
ABSTRACT
Public transport service reliability is crucial for all stakeholders, including users, operators, and society. Bus bunching, where two or more buses on the same route travel closely together, significantly undermines service reliability. This paper reviews bus bunching, its causes and consequences, and control strategies from demand, supply, and decision-making perspectives. It identifies gaps in the literature, emphasising the need for realistic evaluations of control methods and real-world applications. The paper reveals that most bunching solutions prioritise operators over public transport users, and the trade-offs posed by these methods require further examinations. Hybrid methods combining holding with other measures have outperformed standalone holding methods but need real-world testing. User-centric approaches, such as encouraging and incentivising passengers to choose less crowded vehicles or wait, have demonstrated some potential in alleviating service bunching. However, their effectiveness in real-world applications present important research directions. In summary, the practical classification and framework presented in this review can assist policymakers in making informed and optimised decisions by considering various variables and performance measures involved in the process, and in finding balanced solutions for passenger and operator.
1. Introduction
The reliability of public transport is crucial for various stakeholders, including users, operators, communities, governments, and society. Unreliable public transport can lead to negative consequences for users, such as missed trips and transfers resulting from irregular arrival times, overcrowded vehicles, longer travel and waiting times, reduced comfort, and low satisfaction (Soza-Parra et al., Citation2019; Tirachini et al., Citation2013). Operators also face challenges in maintaining regular trips and punctuality, utilising resources effectively, ensuring timely departure for the next trip, and dispatching additional vehicles for delayed trips can result in significant consequences. These include increased operating costs, reduced revenue due to lower patronage and penalties for poor performance, loss of reputation and competitiveness, and diminished efficiency and effectiveness (Soza-Parra et al., Citation2022). This affects community trust in public transport as a viable mode of transport over the long term. Therefore, understanding and improving public transport reliability is vital for long-term sustainability, encouraging more people to use public transport, and meeting stakeholder needs, as it is one of the most important features for users (Balcombe et al., Citation2004; Ceder, Citation2016).
Bunching is a significant factor that deteriorates the reliability of public transport, and it is a complex problem to solve analytically (Daganzo, Citation2009; Rashidi et al., Citation2017). It is generally defined as the phenomenon of two or more public transport vehicles that serve the same line moving in pairs or very close to each other as a result of deviation from defined headways or published schedules. Researchers and practitioners have been studying bunching since the 1960s (Newell & Pott, Citation1964; Turnquist & Bowman, Citation1980). Bunching can make service schedules unreliable and spread through the network from one stop and route to others, creating a negative feedback loop with service disturbances (Daganzo & Pilachowski, Citation2011; Xuan et al., Citation2011). This results in increased travel time and negatively affects system stability, including headway variability, schedule deviation, and departure discrepancy. Bunching leads to added costs for both passengers and operators. Passengers may experience longer waiting time, in-vehicle time, over-crowding, and dissatisfaction, leading to poor overall experience and lack of trust in the transport system. Operators face delays, increased operating costs, and inefficient resource allocations. For example, overcrowding may require the operator to deploy additional vehicles in the system, which is costly. Bunching situations, where the front vehicle is overcrowded and the latter is underutilised, are inefficient uses of resources. Overall, bus bunching reduces service competitiveness and could potentially lead to a user shift towards other transport modes.
There is no single threshold value to define bunching events, as it depends on the type of the service, time of the day, location, and service frequency. Earlier studies suggest using a constant threshold, which is a fixed time interval that separates consecutive vehicles. Feng and Figliozzi (Citation2011) considered three minutes and Iliopoulou et al. (Citation2020b) employed one minute. Typically, this threshold ranges from 20 s to ¼ of the planned headways. However, some recent works suggest a variable threshold, which considers the service type, real-time information, and passenger demand. It is expected that this method may provide a more accurate characterisation of bunching events. For instance, Gong et al. (Citation2020) considered the temporal variability and service type.
Controlling bunching is crucial for improving public transport reliability (PTR), since it causes delays, increased costs, and passenger dissatisfaction. Understanding bunching, its occurrence, causes, consequences, modelling, and prediction under different control conditions is vital. This can help transport agencies and operators in developing effective strategies to prevent and mitigate bunching, ultimately improving PTR and overall passenger satisfaction.
Bus bunching is a well-explored topic in the literature, with extensive research on its modelling and control methodologies. However, a critical review of control strategies with specific consideration of key stakeholders of the system and their interest is lacking. This is particularly important when new and alternative control strategies may exist (or emerge) and may result in varying levels of benefits/outcomes on key stakeholders. While Tirachini et al. (Citation2022) recently reviewed headway variability and control strategies comprehensively, their focus and approach differ from that presented in this study. We present a novel and practical framework that focuses mainly on stakeholders involved in the decision-making perspectives. Additionally, our review is broader in scope as it covers both headway-based and schedule-based systems, as well as recently introduced systems such as modular vehicles.
The contributions of this review are threefold. First, it presents a meta-analysis in Section 2 to highlight key aspects of bus bunching modelling and control in recent literature. Second, it categorises contributing factors to bus bunching and critically reviews theoretical modelling structure and solution algorithms, with a focus on recent models in Sections 3 and 4. Lastly, it presents a practical framework in Section 5 to evaluate bunching control methods from demand, supply, and decision-making perspectives. This framework assesses control methods performance in achieving different (and sometimes contradicting) objectives of stakeholders, and offers a valuable tool for planners to make informed, fair, and optimised decisions. Finally, the review identifies several research directions for future studies.
2. Review summary
A substantial body of research has investigated various aspects of bunching, covering its formation, causes, consequences, and potential solutions. For example, Newell and Pott (Citation1964) modelled bus bunching for the first-time, and Osuna and Newell (Citation1972) explored optimal policy for reducing average passenger waiting time, and Nagatani (Citation2001) simulated bunching behaviour under various conditions. Numerous researchers have focused on holding control methods, including stochastic holding by Hickman (Citation2001), headway-based holding by Daganzo (Citation2009), and others who extended holding method further. Speed control and skipping stops have been suggested as effective methods to address bunching problems (Sun & Hickman, Citation2005). Delgado et al. (Citation2012) developed a hybrid model combining holding with boarding limits. Currie and Shalaby (Citation2008) examined signal priority control in streetcars (trams) as a bunching mitigation measure.
Recent years have seen a growing trend in using advanced technologies and automatic data sources for real-time control strategies, proactive prediction, and evaluating the effectiveness of various solutions in addressing bus bunching (Ma et al., Citation2021; Moreira-Matias et al., Citation2016; Rezazada et al., Citation2023). Recently, some researchers have explored the impact of passenger boarding decisions on bus bunching (Drabicki et al., Citation2022; Wang et al., Citation2021). Passengers’ boarding decisions influence loading and unloading (dwell) times and, consequently, bus headway, which can affect bunching. summarises key state-of-the-art control strategies proposed to address bus bunching, with systematic criteria for evaluating these methods, including the data requirements, method, evaluation space, and limitations if applicable. These limitations include those stated in the original paper or identified in this review.
Table 1. Summary of the reviewed control strategies in bunching related articles.
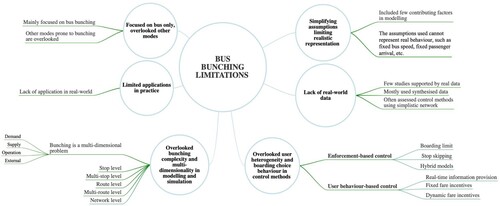
We have identified six major limitations in bus bunching literature, as shown in . Bus bunching is influenced by various factors such as demand, supply, and exogeneous variables (Rezazada et al., Citation2022). Limited data and computational resources have historically made it challenging to incorporate all these factors into problem formulation, leading to possible simplifications. However, recent technological advancements and automation in data collection have provided access to automatic data sources for demand (fare collection systems and passenger count systems), supply (vehicle location and real-time performance), operations (business intelligence), and infrastructure (high resolution network information). These sources represent effective resources for addressing this complex problem, potentially facilitating more comprehensive research in the future. Major limitations identified in the study of bus bunching are listed as follows:
Limited mode coverage: Most published articles focus on bus bunching and overlook other susceptible public transport modes like trams, light-rails, and trains.
Simplified assumptions: Studies often rely on simplified assumptions regarding demand, supply, and system complexities, neglecting factors like variability, uncertainties, and user behaviour that significantly impact bunching and reliability. These assumptions often include simplified demand volumes and variability, runtime variability, and traffic congestion in shared right-of-way. Bunching can propagate from one line or stop to another, particularly in shared corridors. These interactions affect the effectiveness of control mechanisms (Hernández et al., Citation2015). Therefore, it is necessary to adopt a holistic approach to address these complexities.
Simplified networks and limited real-world applications: Existing control methods are tested on simplistic and isolated sub-networks, such as a single stop or a single line, and their real-world applications are limited (Berrebi et al., Citation2018a).
Supply-side focus: Current interventions primarily concentrate on supply-side approaches, with limited investigation of demand-side interventions.
Figure 1. Bus bunching studies limitations in the literature.
The review utilised data from “Scopus” and “Web of Science”, using following keywords {bus OR tram OR streetcar OR public trans* AND bunching}. The search was restricted to the title, abstract, and keywords and no time limits were applied to the search. Supplementary keywords were identified and added, including {Public AND trans* AND bunching}, {Bunching AND control strategy OR headway variability OR regularity OR waiting time}, and {tram OR streetcar OR street trolly AND bunching}. Additional sources recommended by authors were also reviewed to produce this review paper.
3. Contributing factors: an exclusive analysis of the source of problem and solution algorithms
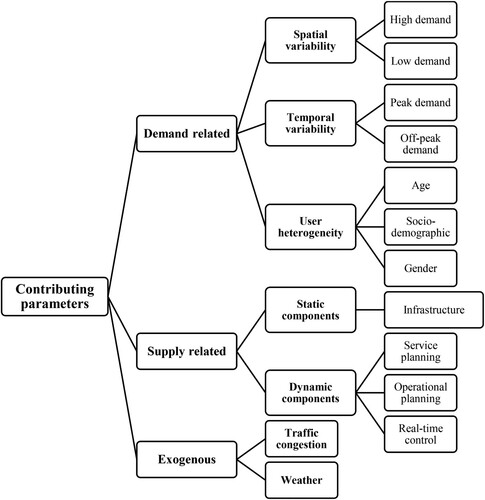
Understanding the root cause of bunching is essential for selecting the right solution. Bunching can be classified into systematic (Endogenous) and non-systematic (Exogenous) problems based on the type of occurrence. Operational planning (OP) is used to address recurring challenges caused by internal factors such as driver behaviour, passenger boarding and alighting at stops, improper scheduling, route configuration, or inter-bus interactions (Moreira-Matias et al., Citation2016). On the other hand, operational control methods are employed to address internal issues characterised by variable patterns, such as sudden shifts in demand that result in variations in headways and bunching problems. Endogenous causes can be categorised further into demand and supply factors (Gong et al., Citation2020).
The absence of a comprehensive classification may lead to missing research and investigation. The various parameters affecting bunching are diverse and difficult to model comprehensively in single study, therefore, a collection of methods and investigation may be required to support a holistic decision-making process. We propose a systematic classification of bunching contributors based on spatio-temporal variability and user heterogeneity. This classification includes three main categories: (1) Demand-related, (2) Supply-related, and (3) Exogenous factors, as depicted in .
Figure 2. Classification of bunching causes.
3.1 Demand related causes
Demand variables, a key source of bunching and reliability problems, can be categorised into three types: (1) spatial variability, encompassing high and low demand areas based mainly on land use types; (2) temporal variability, including weekdays, weekends, peak, off-peak, and intra-peak periods; and (3) user heterogeneity, such as age, socio-demographic variables, and gender.
Identifying bunching is a crucial step, but a comprehensive understanding requires a deeper analysis of the associated attributes. Questions arise whether the attributes of service bunching are consistent across different route segments and at different times of the day (Feng & Figliozzi, Citation2011). The findings indicate otherwise, as Chioni et al. (Citation2020) discovered a negative correlation between the number of traffic lanes at a stop and bunching in low congested areas, while the correlation was positive in high congestion regions. In a separate study, Iliopoulou et al. (Citation2020a) found that temporal factors, like weekends and afternoon peaks, influenced bunching duration. Gong et al. (Citation2020) also observed variation in bunching behaviour during peak and off-peak times. Rezazada et al. (Citation2023) discovered that varying temperature and weather conditions significantly influence passenger arrivals at different stop locations, leading to fluctuations in demand and subsequent bus bunching. Due to variations in bunching duration, pattern, and behaviour, using a bunching solution designed for peak or densely populated areas in less concentrated or off-peak scenarios, and vice versa, may lead to ineffective intervention. Therefore, exploring models that adapt dynamically to spatio-temporal fluctuations, such as using reinforcement learning to learn policies about holding and no-boarding events, is a promising research direction (Saw et al., Citation2020).
Users of different sociodemographic groups may exhibit different boarding behaviours (Pan et al., Citation2022), which ultimately influence dwell times and onboard congestion. Some researchers have explored passenger’s boarding choices (Drabicki et al., Citation2023; Kim et al., Citation2009; Kroes et al., Citation2014; Preston et al., Citation2017), and boarding strategies (Hassan et al., Citation2021; Nassir et al., Citation2017, Citation2019, Citation2018). However, the questions of if and how these behaviours can affect headway variability and service bunching are not adequately studied. For instance, elderly passengers may prefer waiting for a less crowded bus with empty seats, and safer boarding in less congestion. Trip purpose and trip length may also be important factors when passengers may trade-off faster boarding for onboard comfort.
3.2 Supply related causes
Bus bunching, associated with high demand and frequent services (Arriagada et al., Citation2019; El-Geneidy et al., Citation2011), is also influenced by various supply-related factors, including network design, route configuration, service frequency, fleet design, and boarding/alighting door arrangements. Dueker et al. (Citation2004) and Tirachini et al. (Citation2022) highlight factors like improper network design, irregular fleet arrangements, and the use of double-deck buses. Route length, the number of stops, overlapping lines, and shared boarding/alighting doors can lead to bunching by affecting dwell times. This study differentiates between static (infrastructure) and dynamic (service/operations) aspects of supply side factors, because bunching solutions that may relate to service planning decisions and/or operations may significantly differ from those rooted in infrastructure features, such as shared right-of-way, traffic intersections, network bottlenecks, station capacities, etc.
Static factors include the geometric design of route, network layout and alignment, type (interchange or stop), number of routes and route overlaps, spacing between stops, number of stops, proximity to signalised intersections, fleet size and type, payment method, and curbside parking conditions (Diab et al., Citation2015; Diab & El-Geneidy, Citation2012; Dueker et al., Citation2004; Rashidi et al., Citation2017; Tirachini et al., Citation2022). Dynamic factors encompass service frequency and headway, scheduling, dispatching discrepancy, terminal layovers, interactions between departing and arriving vehicles, speed variability, and driver behaviour (Arriagada et al., Citation2019; El-Geneidy et al., Citation2011).
Because of interrelated factors in bus bunching, it can propagate between stops and lines. For example, if a merging bus line experiences bunching, its impact can extend to other lines, especially in networks where overtaking is not possible, e.g. exclusive bus lanes, tunnels, or rail, etc. Gong et al. (Citation2020) found that including bus stop type, number of routes sharing the stop and other supply-related factors can enhance bunching prediction performance. Similarly, delays at signalised intersections can lead to bunching and affect other routes due to network alignment. Additionally, onboard payment and double-deck buses can increase passenger dwell time, which also contributes to bunching.
3.3 Exogenous causes
External disruptions, such as traffic incidents, congestions, signal timing, adverse weather, and vehicle breakdowns, can also affect public transport service performance. Moosavi et al. (Citation2020) highlighted traffic disruptions in mixed-use right-of-way, affecting operating time and causing travel time variations. External disruptions cause variations in travel time, leading to early or late arrivals at upstream stops. Dwell times at stops can take increasingly longer due to increased passenger accumulation at stops upon late service arrival. Predicting and responding to these initial disruptions is challenging due to their unpredictability and the complexity of surrounding conditions (Moreira-Matias et al., Citation2016). To address such issues, proactive predictive control measures such as data-driven and AI-based models for real-time monitoring and anomaly detection may be effective and emerging approaches.
4. Modelling of bus bunching
The three key components in modelling and analysing public transport bunching are: data type and source (input), mathematical and statistical formulation, and control method. These components are summarised in this section.
4.1 The type of data
The advancement of Information and Communication Technology (ICT), Global Positioning System (GPS), and automated big data has enabled researchers to study bunching on a large scale. In recent years, Automatic Fare Collection (AFC), Automatic Vehicle Location (AVL), and Automatic Passenger Count (APC) data have been extensively used datasets for bunching research. Many earlier studies have been based on historical datasets (El-Geneidy & Vijayakumar, Citation2011), while the use of real-time data has increased for better accuracy, prediction, and prevention (Arriagada et al., Citation2019; Barabino et al., Citation2013; Pi et al., Citation2018; Verbich et al., Citation2016). Using smart card data, Jiang et al. (Citation2019) modelled passenger waiting times at stops to predict bus bunching. Yu et al. (Citation2016) predicted headway pattern to detect bus bunching at stops. Rashidi et al. (Citation2017) and Moreira-Matias et al. (Citation2012) utilised AVL data for bunching estimation and Bunching Black Spots (BBS) identification, respectively.
Modelling bus bunching using data fusion from different sources and real-time demand data on a large scale is still in its early stages. The integration of data from various sources such as fare cards, GPS, passenger count systems, CCTV, and coordinated signal systems, is expected to drive future research development, potentially leading to more reliable results (Varga et al., Citation2018; Yu et al., Citation2016).
4.2 Theoretical formulation and analysis
The literature on bunching problem incorporates various variables and methods to model and predict bunching in real-time and offline, including mathematical and statistical models, machine learning and deep learning, and simulation. Given the challenges of directly modelling service bunching, researchers instead analyse different determinants of bunching such as headway, schedule, speed, passenger demand, waiting time, driver behaviour, and synchronisation. For example, Daganzo (Citation2009) modelled headway, Ceder et al. (Citation2013) formulated transfer synchronisation, Phillips et al. (Citation2015) examined the impact of driver behaviour, and He et al. (Citation2019) focused on cruising speed, as detailed in . For more comprehensive information, readers may refer to Rezazada et al. (Citation2022).
4.3 Solution algorithms
Various techniques including analytical, optimisation, machine learning, deep learning, and simulation, tackle bunching problems. With more computational power, reinforcement and deep learning are favoured for complex situations, with technique choice depending on network size, data, bunching severity, and objectives. Earlier models used simpler networks (Ling & Shalaby, Citation2005); now, more sophisticated algorithms like those in machine and deep learning are employed. For example, Wang and Sun (Citation2020) used multi-agent deep reinforcement learning for bus interactions, while recent research (He et al., Citation2022; Shi et al., Citation2021; Wang & Sun, Citation2021) focuses on modelling complex bunching scenario and system optimisation.
Deep learning (DL) models employ hidden layers to learn intricate and high-dimensional features from raw data, eliminating the need for manual feature engineering. This is beneficial for modelling and understanding complex phenomena with numerous contributing factors, such as bunching. Deep reinforcement learning (DRL) models can learn optimal policies by combining actions, the environment, and rewards. Reinforcement learning-based control methods excel in intricate decision-making tasks, even surpassing human performance in domains like Go and electronic games (Liu et al., Citation2023). DL and DRL are effective for handling uncertainties, and multi-dimensional dynamic systems, given enough data for the learning model is provided. While multi-agent DRL is promising for control policies for multi-agent systems, limited studies have fully explored its potential (Wang & Sun, Citation2023). Applying DL and DRL for control strategies in this context is also a potential area of research. For instance, Liu et al. (Citation2023) applied DRL to holding, and other control strategies, including overtaking, speed control, and signal coordination and optimisation, can be explored.
5. Bunching control: a practical framework analysing control methods in bunching
The literature on bus bunching presents various control methods encompassing technical, strategic, and policy approaches, each effective under different conditions. While established methods are well-studied, others with potential remain less explored, and strategies can sometimes favour operators over passengers, leading to ineffective user experience improvement. Planners face complexities in choosing methods without clear demand and supply design specifications. This section introduces a practical framework, depicted in , to evaluate control methods and aid planners in deciding on efficient strategies that align with their objectives.
Figure 3. Qualitative assessment framework for bunching control strategies in public transport.
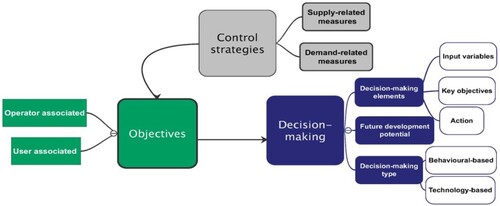
The framework consists of three main elements: control strategies, objectives, and decision-making attributes (). It offers a practical method for classifying control strategies based on their effectiveness in achieving objectives, establishing a performance benchmark for similar methods and identifying promising, underutilised strategies. Additionally, it aids policymakers to target specific groups and balance interests between passengers and operators. Methods are categorised as Passenger-Oriented Method (POM), Operator-Oriented Method (OOM), or balancing both interests Integrated Method (IM).
presents a qualitative assessment of nine control methods categorised as demand and supply control in the left column. It evaluates their impact on passenger and operator measures and objectives in the top row. Symbols (+) or (–) indicate the method's effectiveness in achieving the objective, based on reported outcomes in the original articles (NA denotes not applicable, NR denotes not reported). The table notes rating such as “Acceptable results & covered slightly” (+), “promising results & covered fairly” (++) and “significant results that covered sufficiently in over three papers” (+++). Methods are classified as passenger-oriented, operator-oriented, or balancing both.
Table 2. Qualitative assessment of bunching control methods based on type of intervention and Pax/Opr attributes.
Passenger choice to board or wait is evaluated as follow: (+) for voluntarily waiting, and (-) for forced waiting due to boarding limits or stop skipping policies. A single (+) rating indicates a positive trip experience, while a single (-) rating suggests a negative perception of public transport. A triple (+ + +) rating for voluntary waiting leads to improved passenger experience and reduced crew scheduling and fleet scheduling costs by improving resource allocation. Control strategy orientation is determined by comparing (+) and (-) ratings for passenger and operator attributes in . If positive passenger ratings exceed operator ratings, it is classified as passenger-oriented (POM); otherwise, it is operator-oriented (OOM). Equal ratings result in an integrated method (IM).
The headway-based holding (HH) approach requires longer holding time, resulting in approximately twice in-vehicle time compared to the schedule-based holding (SH) (Berrebi et al., Citation2018b). HH has been found to be more effective in achieving headway regularity (+++) (Daganzo, Citation2009), but less effective in schedule recovery compared to SH (+) (Wu et al., Citation2018). Signal priority can reduce waiting time (++), outperforming speed control by minimising delays at intersections. However, additional research is needed to establish the validity of these results, especially for other transport modes like trams. The implementation of stop-skipping and boarding limit strategies can significantly reduce in-vehicle time (+++), but they may affect waiting passengers (- -), as they may be left behind. While stop-skipping is effective for maintaining speed and headway, it prioritises the benefit of operators and thus considered an operator-oriented method (OOM). Some parameters such as effective resource allocation, trip experience, and comfort, are less observed parameters in this review, requiring further research to quantify their impact.
provides valuable insights for policy makers and planners, but it does not offer a decision-making perspective for in-depth analysis of each method. To address this gap, we have synthesised to outline decision-making elements, types, and their potential alignment with emerging technologies (such as large-scale automatic data collection, advanced computation, real-time information, and automated and connected networks) and the possibility of incorporating user boarding behaviour. With the increasing role of technology, there is a growing focus on boarding behaviour and data-driven based measures like machine and deep learning (He et al., Citation2022; Shi et al., Citation2021; Wang & Sun, Citation2020; Wang & Sun, Citation2023). Behavioural-based and technology-based decision variables have been employed to assess control methods alignment with emerging technology and user boarding behaviour, similar to the classification of each control method orientation in . Behavioural-based measures the orientation of a method in terms of passenger choice, while technology-based measures the compatibility with emerging technology, such as the use of historical and real-time data ().
Table 3. Evaluation based on decision-making perspectives.
Real-time and choice attributes are more important over historical and enforcement attributes due to their higher significance. Real-time controls play a crucial role in proactively preventing bunching and providing passengers with boarding choice flexibility, preventing involuntarily being left behind (boarding limit) or having to backtrack to the skipped stops (expressing). This prioritisation helps planners identify control methods that can benefit from emerging technologies and integrate passenger boarding behaviours into models.
Hybrid approaches such as dynamic demand control (DDC) and microeconomic behavioural models (MBM), are promising for future research and practice. Such models can incorporate individual behaviours towards management leverages and incentives and dynamically model incentives based on demand and operation attributes. Unlike existing models that employ fixed incentives for all passengers, this approach enables designing and fine-tuning of incentives for passengers with distinct characteristics and trip features, such as waiting time, trip length, trip purpose, and sociodemographic characteristics.
5.1 Comprehensive review of control methods
5.1.1 Supply control
5.1.1.1 Headway-based holding (HH)
The holding method involves delaying buses at control points when their departure time or headways deviate from the schedule (Dai et al., Citation2019). This is done through two methods: headway-based holding (HH), which holds buses when headways are smaller than the designed headway, and schedule-based holding (SH), which holds buses if the departure time is earlier than planned departure. Koffman (Citation1978) conducted a simulation model to study the effectiveness of bus holding in regulating headway in a hypothetical single bus route. Many subsequent studies have focused on improving headway through headway-based holding control.
Traditionally, a static headway threshold was used as a criterion for holding buses at control points, but Rossetti and Turitto (Citation1998) proposed a dynamic threshold approach. Eberlein et al. (Citation2001) and Hickman (Citation2001) formulated as a deterministic and stochastic quadratic programming problem, respectively. Daganzo (Citation2009) analysed adaptive holding control based on real-time headway information, and later Cats et al. (Citation2010) applied HH control strategy in BusMezzo, a large-scale agent-based simulation.
Several studies combined holding methods with other strategies to alleviate bus bunching: Delgado et al. (Citation2012) with boarding limits, Nesheli and Ceder (Citation2014) with stop skipping, Wu et al. (Citation2017) with vehicle overtaking, Seman et al. (Citation2020) with priority control, and Manasra and Toledo (Citation2019) with speed change control. These hybrid models have outperformed standalone holding method in reducing waiting time and in-vehicle time, improving operational speed, headway regularity, and schedule adherence. Cats et al. (Citation2012) found that holding and dispatching buses from a limited number of control stops was not effective in improving bus regularity along the route. More recent studies by (Berrebi et al., Citation2018b; Cats et al., Citation2014; Dai et al., Citation2019) have further explored this topic dynamically.
5.1.1.2 Schedule-based holding (SH)
While headway-based holding methods can reduce waiting times and achieve even headways, they may not guarantee schedule adherence with larger disturbances (Daganzo, Citation2009; Dai et al., Citation2019). To address this, Xuan et al. (Citation2011) introduced a dynamic holding control approach based on schedule deviation and Li et al. (Citation2019) integrated holding with operating speed control to enhance both headway regularity and schedule adherence, simultaneously.
The availability of real-time service information, including arrival and departure times and onboard crowding, has led to increased interest in schedule-based services. Ingvardson et al. (Citation2018) found that with timetables available, even at 5-min headways 43% of passengers arrive in timely manner. Previous research indicates that passengers do not plan their arrival and arrive randomly at stops for services with short headways of 10 min or less, marking the transition point from random to non-random passenger arrivals (Currie et al., Citation2012; Fan & Machemehl, Citation2009). Studying passenger arrival behaviour at stops using real-time smartphones data, considering trip purpose and user type, is a valuable future research.
The study of various holding methods is a well-explored but integrating them with control strategies is a relevant research area. The literature review of the cited articles reveals that headway-based holding reduces passenger waiting time (Fabian & Sanchez-Martinez, Citation2017), maintains even headways (Daganzo, Citation2009), but requires longer holding times (Berrebi et al., Citation2018b) and is less effective for schedule recovery (Wu et al., Citation2018). In contrast, schedule-based holding improves schedule adherence and recovery, with reduced holding time, but it cannot regularise headways.
Both methods decrease operational speed (Xuan et al., Citation2011) and increase in-vehicle time for onboard passengers while holding at control stops. Since the perceived cost of waiting time is higher than in-vehicle time, this drawback must be addressed or mitigated through the use of hybrid models that combines holding with other strategies (Esfeh et al., Citation2021). The effect of HH and SH on holding and slack times are controversial, as of (Berrebi et al., Citation2018b) SH requires less holding time than HH, while (Daganzo, Citation2009) noted that dynamic HH requires less slack than conventional SH. Further exploration with real data from public transport operation at scale is an interesting research direction.
5.1.1.3 Signal priority and speed control
Studies on integrating signal priority control and holding method to reduce bunching have shown promising results, including decreased passenger waiting time and delay (Chandrasekar et al., Citation2002; Delgado et al., Citation2015), improved regulation of headways (Chow & Li, Citation2019), and reduced bunching (Seman et al., Citation2020). The concept of the “spring-effect”, through cooperation between leading and following buses involving speed control to maintain even headways and enhance travel times is explored by Daganzo and Pilachowski (Citation2011). This method further benefited from integration with signal priority adjustment (Bie et al., Citation2020) and holding control (He, Citation2015), resulting in improved headway and schedule reliability and operational speed with minimal slack added to the schedule. Additionally, adjusting cruising speed on road segments has been shown to reduce stop and onboard waiting times (He et al., Citation2019), with real-time data analysis by Deng et al. (Citation2020) supporting the effectiveness of this approach in enhancing travel time and headway regularity.
5.1.1.4 Short-turning
The short-turning (ST) strategy, particularly effective for congested long routes, minimises total costs, schedule deviation, and waiting time by converting a few regular trips into short-turning trips (Ceder, Citation2016; Tian et al., Citation2022; Tirachini et al., Citation2011; Zhang et al., Citation2017). Gkiotsalitis et al. (Citation2019) optimised bus fleet allocation and switch points for short-turning trips, reducing operational costs and waiting time. Cortés et al. (Citation2011) integrated ST with deadheading and found that ST can lead to a significant reduction in total cost than deadheading. Wang et al. (Citation2019) developed a real-time ST strategy considering passenger choice behaviour and found that real-time ST not only reduces waiting time but also improves vehicle capacity. While short-turning is found effective in reducing waiting time and operational costs, further research is needed to understand the effect of ST on other objectives, especially for passengers who are left behind.
5.1.1.5 Overtaking
Overtaking is frequently employed in conjunction with other control methods, such as holding (Wu et al., Citation2017), stop-skipping (Wu et al., Citation2019), and passenger choice (Sun & Schmöcker, Citation2018). Schmöcker et al. (Citation2016) analysed the impact of overtaking in shared corridors on bus bunching and found that the presence of common routes can significantly reduce service irregularities, especially when overtaking was permitted and feasible. Wu et al. (Citation2019) showed that overtaking can lower overall system costs, including waiting time, in-vehicle travel time, and riding time, leading to a smaller fleet size and decreased operational expenses. Sun and Schmöcker (Citation2018) revealed that overtaking and passenger boarding distribution between two buses arriving simultaneously can affect regularity and bunching. Combining overtaking with queue-swapping improves headway regularity, reduces waiting times, and lowers in-vehicle travel times Wu et al. (Citation2019).
5.1.2 Mixed control: stop skipping and boarding limit
Stop Skipping (SS) (also known as expressing), a control method to reduce trip delays and improve onboard passengers travel times by skipping in certain stops (Gkiotsalitis, Citation2021), is often used with holding and speed control techniques (Cortes et al., Citation2010; Moreira-Matias et al., Citation2016). Research shows that the implementation of SS can decrease total waiting time, in-vehicle time, and travel costs while increasing bus lane capacity and transfer opportunities (Cao & Ceder, Citation2019; Ceder et al., Citation2013; Liu et al., Citation2013). Similar outcomes have been observed with the combination of boarding limits (BL) and holding (Delgado et al., Citation2012). Enayatollahi et al. (Citation2019) noted that a one-second reduction in boarding and alighting time per passenger can significantly reduce bunching. Zhao et al. (Citation2016) introduced a self-adjusting BL and Saw et al. (Citation2020) used BL in combination with holding, employing reinforcement learning to mitigate bunching.
While top-down demand and mixed control strategies have the potential to enhance system efficiency, they primarily prioritise transport operators and only partially consider passenger needs. Skipping stops may lead to frustration and uncertainty regarding the next bus arrival as well as considerable inconvenience for those intending to alight at the skipped stop. Given that the waiting time is perceived as more costly than in-vehicle time, the trade-off posed by this method deserves further examination. Recently, a passenger-centric approach, known as the “bottom-up decision-making architecture” has been proposed, where operators inform passengers about real-time information, allowing them to make an informed decision to board the current bus or wait for the next (Drabicki et al., Citation2022).
5.1.3 Demand control: real-time demand information provision and control
Extensive research has analysed the impact of demand variability on reliability issues in public transport using real-time and offline demand data (Enayatollahi et al., Citation2019; Estrada et al., Citation2021; Fonzone et al., Citation2015; Li et al., Citation2019; Ma et al., Citation2021). However, real-time demand control remains a relatively new area of research in this field. The current top-down approaches mainly involve enforcing demand restrictions, such as capacity constraints and stop-skipping measures.
In recent years, there has been a growing interest in user-centric approaches that consider passengers’ choice behaviour and their willingness to board either currently crowded vehicles or wait for less crowded ones (Drabicki et al., Citation2022; Pan et al., Citation2022; Wang et al., Citation2021). In this approach, real-time information, including arrival times, crowd levels, monetary incentives, and other helpful information is provided to passengers to facilitate their decision-making and optimise their trip experience. This allows passengers to compensate for a few extra waiting minutes in exchange for improved trip quality, seat availability, and efficient boarding and alighting with shorter dwell times. These measures can enhance system performance and reduce in network-wide bunching effects. For instance, Drabicki et al. (Citation2023) employed a probability distribution to predict boarding crowded vehicles or waiting for the next one based on real-time crowd information. Pan et al. (Citation2022) proposed a set of tailored incentives, such as free points, coffee, snacks, and environmental incentives, and included trip purpose, spatio-temporal variables, and the socio-economic background of passengers to influence their boarding choices for overcrowded buses. Sun and Schmöcker (Citation2018) and Wu et al. (Citation2017) combined with overtaking to further enhance this approach.
This approach regulates headways, reduces bunching, enhances trip quality, and allocates resources efficiently by evenly distributing passengers. While real-time information (RTI) is valuable for passenger decision-making, it is crucial to prevent certain unlikely events. If too many passengers rely on RTI to avoid crowded buses, it may inadvertently result in longer waiting times and increased crowding on subsequent vehicles. This emphasises the need for robust predictive and dynamic demand control (DDC) systems to anticipate and counteract such mass responses dynamically. Such systems are vital for maintaining user trust and enhancing the effectiveness of transit systems. To address this issue, a hybrid predictive model that integrates DDC and microeconomic behavioural models (MBM) is suggested for future research. Offering flexible incentives to waiting passengers through dynamic fare management, alongside real-time information and predictive models, has the potential to maintain service reliability.
6. Conclusion and recommendation
This paper critically reviews the literature on bus bunching, including its causes, consequences, modelling methods, and control strategies. The review identifies several gaps in the research, such as simplistic modelling assumptions, overlooked user behaviour and heterogeneity, lack of complex and realistic network setting, and limited real-world testing and applications.
This review emphasises the importance of considering the orientation of measures in every assessment, planning, and research related to bus bunching. It highlights and distinguishes the trade-offs associated with different strategies aimed at public transport operators and passenger satisfaction and stresses the significance of balancing the interest of all parties. Operator-oriented strategies such as, stop-skipping and boarding limitations, can have mixed effects on passengers, including shorter travel times and improved connections for those onboard, while longer waiting times, missed trips, and frustration for waiting passengers at stops skipped. Examining these trade-offs is vital for understanding policy implications and promoting transport equity for both passengers and operators. This study offers a practical framework to understand each method's effectiveness, demand and supply dynamics, and provides input for policymakers to make informed decisions considering various variables and balancing passenger and operator interests.
User-centric approaches, which account for passenger’s willingness to wait to avoid crowded vehicles, show potential in reducing bunching and improving overall performance (Drabicki et al., Citation2023; Wang et al., Citation2021). However, further research is required to assess their impact on crowd management, waiting time distribution, and other objectives in real-world operations. Offering incentives for waiting passengers through dynamic fare adjustment and real-time information, can improve service reliability. Future research should investigate whether specific passenger groups (e.g. elderly) prioritise waiting for less crowded service with incentives and how factors like trip purpose, value of time, sociodemographic, trip distance, and time of day influence boarding behaviours.
Integrating data from multiple automatic sources in real-time for large scale bus operations is still in its early stages, requiring further research to address the replication and alleviation of bus bunching. Hybrid methods that combine holding with other measures such as boarding limit, speed control, stop-skipping, vehicle overtaking, priority control, and passenger boarding behaviour have outperformed holding methods alone (Nesheli & Ceder, Citation2014; Seman et al., Citation2020; Wu et al., Citation2017). However, validating these findings in real-world applications and exploring new technologies like modular buses constitute interesting research questions. Additionally, tackling bus bunching as a complex, multi-dimensional problem suggests that deep learning and reinforcement learning could be valuable for learning high-dimensional features and optimal policy, necessitating further research in this area.
In conclusion, bus bunching is a complex problem in public transport operations that significantly undermines reliability and potentially reduces the attractiveness of public transport service (Ceder, Citation2016; Daganzo, Citation2009; Rashidi et al., Citation2017). This review emphasises the importance of considering orientation in every assessment and highlights the potential of artificial intelligence, machine learning, data fusion, and hybrid methods to address bunching. However, further research can assist to understand how these technologies can quantify the influence of bunching-related factors. The proposed practical framework can help policymakers who make informed decisions to balance the interests of passengers and operators.
Disclosure statement
No potential conflict of interest was reported by the author(s).
References
- Argote-Cabanero, J., Daganzo, C. F., & Lynn, J. W. (2015). Dynamic control of complex transit systems. Transportation Research Part B: Methodological, 81, 146–160. https://doi.org/10.1016/j.trb.2015.09.003
- Arriagada, J., Gschwender, A., Munizaga, M. A., & Trépanier, M. (2019). Modeling bus bunching using massive location and fare collection data. Journal of Intelligent Transportation Systems, 23(4), 332–344. https://doi.org/10.1080/15472450.2018.1494596
- Balcombe, R., Mackett, R. L., Paulley, N., Preston, J., Shires, J., Titheridge, H., Wardman, M., & White, P. (2004). The demand for public transport: A practical guide. TRL Limited.
- Barabino, B., Di Francesco, M., & Mozzoni, S. (2013). Regularity diagnosis by automatic vehicle location raw data. Public Transport, 4(3), 187–208. https://doi.org/10.1007/s12469-012-0059-z
- Bartholdi, J. J., & Eisenstein, D. D. (2012). A self-coördinating bus route to resist bus bunching. Transportation Research Part B: Methodological, 46(4), 481–491. https://doi.org/10.1016/j.trb.2011.11.001
- Berrebi, S. J., Crudden, S. Ó., & Watkins, K. E. (2018a). Translating research to practice: Implementing real-time control on high-frequency transit routes. Transportation Research Part A: Policy and Practice, 111, 213–226. http://doi.org/10.1016/j.tra.2018.03.008
- Berrebi, S. J., Hans, E., Chiabaut, N., Laval, J. A., Leclercq, L., & Watkins, K. E. (2018b). Comparing bus holding methods with and without real-time predictions. Transportation Research Part C: Emerging Technologies, 87, 197–211. https://doi.org/10.1016/j.trc.2017.07.012
- Bie, Y., Xiong, X., Yan, Y., & Qu, X. (2020). Dynamic headway control for high-frequency bus line based on speed guidance and intersection signal adjustment. Computer-Aided Civil and Infrastructure Engineering, 35(1), 4–25. https://doi.org/10.1111/mice.12446
- Cao, Z., & Ceder, A. (2019). Autonomous shuttle bus service timetabling and vehicle scheduling using skip-stop tactic. Transportation Research Part C: Emerging Technologies, 102, 370–395. https://doi.org/10.1016/j.trc.2019.03.018
- Cats, O., Burghout, W., Toledo, T., & Koutsopoulos, H. N. (2010). Evaluation of real-time holding strategies for improved bus service reliability. Conference on Intelligent Transportation Systems, Proceedings, ITSC IEEE.
- Cats, O., Larijani, A. N., Olafsdottir, A., Burghout, W., Andreasson, L., & Koutsopoulos, H. N. (2012). Bus-holding control strategies. Transportation Research Record.
- Cats, O., Rufi, F. M., & Koutsopoulos, H. N. (2014). Optimizing the number and location of time point stops. Public Transport, 6(3), 215–235. https://doi.org/10.1007/s12469-014-0092-1
- Ceder, A. (2016). Public transit planning and operation modeling, practice and behavior (2nd ed.). CRC Press.
- Ceder, A., Hadas, Y., Mclvor, M., & Ang, A. (2013). Transfer synchronization of public transport networks. Transportation Research Record: Journal of the Transportation Research Board, 2350(1), 9–16. https://doi.org/10.3141/2350-02
- Chandrasekar, P., Cheu, R. L., & Chin, H. C. (2002). Simulation evaluation of route-based control of bus operations. Journal of Transportation Engineering, 128(6), 519–527. https://doi.org/10.1061/(ASCE)0733-947X(2002)128:6(519)
- Chioni, E., Iliopoulou, C., Milioti, C., & Kepaptsoglou, K. (2020). Factors affecting bus bunching at the stop level: A geographically weighted regression approach. International Journal of Transportation Science and Technology, 9(3), 207–217. https://doi.org/10.1016/j.ijtst.2020.04.001
- Chow, A. H. F., & Li, S. (2019). Modelling and managing bus service regularity with influence of prevailing traffic. Transportmetrica B, 7(1), 82–106.
- Cortés, C. E., Jara-Díaz, S., & Tirachini, A. (2011). Integrating short turning and deadheading in the optimization of transit services. Transportation Research Part A, 45(5), 419–434.
- Cortes, C. E., Saez, D., Milla, F., Nunez, A., & Riquelme, M. (2010). Hybrid predictive control for real-time optimization of public transport systems’ operations based on evolutionary multi-objective optimization. Transportation Research Part C: Emerging Technologies, 18(5), 757–769. https://doi.org/10.1016/j.trc.2009.05.016
- Currie, G., Douglas, N., & Kearns, I. (2012). An assessment of alternative bus reliability indicators. Australasian Transport Research Forum Proceedings, Pert, Australia.
- Currie, G., & Shalaby, A. (2008). Active transit signal priority for streetcars: Experience in Melbourne, Australia, and Toronto, Canada. Transportation Research Record, 2042(1), 41–49.
- Daganzo, C. F. (2009). A headway-based approach to eliminate bus bunching: Systematic analysis and comparisons. Transportation Research Part B: Methodological, 43(10), 913–921. https://doi.org/10.1016/j.trb.2009.04.002
- Daganzo, C. F., & Pilachowski, J. (2011). Reducing bunching with bus-to-bus cooperation. Transportation Research Part B: Methodological, 45(1), 267–277. https://doi.org/10.1016/j.trb.2010.06.005
- Dai, Z., Liu, X. C., Chen, Z., Guo, R., & Ma, X. (2019). A predictive headway-based bus-holding strategy with dynamic control point selection: A cooperative game theory approach. Transportation Research Part B: Methodological, 125, 29–51. https://doi.org/10.1016/j.trb.2019.05.001
- Delgado, F., Munoz, J. C., & Giesen, R. (2012). How much can holding and/or limiting boarding improve transit performance? Transportation Research Part B: Methodological, 46(9), 1202–1217. https://doi.org/10.1016/j.trb.2012.04.005
- Delgado, F., Muñoz, J. C., Giesen, R., & Wilson, N. H. M. (2015). Integrated real-time transit signal priority control for high-frequency segregated transit services. Transportation Research Record: Journal of the Transportation Research Board, 2533(1), 28–38. https://doi.org/10.3141/2533-04
- Deng, Y. J., Liu, X. H., Hu, X., & Zhang, M. (2020). Reduce bus bunching with a real-time speed control algorithm considering heterogeneous roadway conditions and intersection delays. Journal of Transportation Engineering Part A: Systems, 146(7), 04020048.
- Diab, E. I., Badami, M. G., & El-Geneidy, A. M. (2015). Bus transit service reliability and improvement strategies: Integrating the perspectives of passengers and transit agencies in North America. Transport Reviews, 35(3), 292–328. https://doi.org/10.1080/01441647.2015.1005034
- Diab, E. I., & El-Geneidy, A. M. (2012). Understanding the impacts of a combination of service improvement strategies on bus running time and passenger’s perception. Transportation Research Part A, 46(3), 614–625.
- Drabicki, A., Cats, O., Kucharski, R., Fonzone, A., & Szarata, A. (2023). Should I stay or should I board? Willingness to wait with real-time crowding information in urban public transport. Research in Transportation Business & Management, 47, 100963.
- Drabicki, A., Kucharski, R., & Cats, O. (2022). Mitigating bus bunching with real-time crowding information. Transportation, 50(3), 1003–1030.
- Dueker, K. J., Kimpel, T. J., Strathman, J. G., & Callas, S. (2004). Determinants of bus dwell time. Journal of Public Transportation, 7(1), 21–40. https://doi.org/10.5038/2375-0901.7.1.2
- Eberlein, X. J., Wilson, N. H. M., & Bernstein, D. (2001). The holding problem with real-time information available. Transportation Science, 35(1), 1–18. https://doi.org/10.1287/trsc.35.1.1.10143
- El-Geneidy, A. M., Horning, J., & Krizek, K. J. (2011). Analyzing transit service reliability using detailed data from automatic vehicular locator systems. Journal of Advanced Transportation, 45(1), 66–79. https://doi.org/10.1002/atr.134
- El-Geneidy, A. M., & Vijayakumar, N. (2011). The effects of articulated buses on dwell and running times. Journal of Public Transportation, 14(3), 63–86. https://doi.org/10.5038/2375-0901.14.3.4
- Enayatollahi, F., Idris, A. O., & Atashgah, M. A. (2019). Modelling bus bunching under variable transit demand using cellular automata. Public Transport, 11(2), 269–298. https://doi.org/10.1007/s12469-019-00203-2
- Esfeh, M. A., Wirasinghe, S. C., Saidi, S., & Kattan, L. (2021). Waiting time and headway modelling for urban transit systems – a critical review and proposed approach. Transport Reviews, 41(2), 141–163. https://doi.org/10.1080/01441647.2020.1806942
- Estrada, M., Mension, J., & Salicrú, M. (2021). Operation of transit corridors served by two routes: Physical design, synchronization, and control strategies. Transportation Research Part C: Emerging Technologies, 130, 103283. https://doi.org/10.1016/j.trc.2021.103283
- Fabian, J. J., & Sanchez-Martinez, G. E. (2017). Simulation-based comparison of holding strategies for a multibranch light rail service. Transportation Research Record: Journal of the Transportation Research Board, 2648(1), 23–32. https://doi.org/10.3141/2648-03
- Fan, W. D., & Machemehl, R. B. (2009). Do tranist users just wait for buses or wait with strategies?: Some numerical results that transit planners should See. Transportation Research Record, 2111(1), 169–176.
- Feng, W., & Figliozzi, M. (2011). Empirical findings of bus bunching distributions and attributes using archived AVL/APC bus data. Towards Sustainable Transportation Systems - Proceedings of the 11th International Conference of Chinese Transportation Professionals.
- Fonzone, A., Schmöcker, J. D., & Liu, R. (2015). A model of bus bunching under reliability-based passenger arrival patterns. Transportation Research Part C: Emerging Technologies, 59, 164–182. https://doi.org/10.1016/j.trc.2015.05.020
- Fu, L., & Yang, X. (2002). Design and implementation of bus-holding control strategies with real-time information. Transportation Research Record, 1791(1), 6–12.
- Gkiotsalitis, K. (2021). Stop-skipping in rolling horizons. Transportmetrica A: Transport Science, 17(4), 492–520. https://doi.org/10.1080/23249935.2020.1798554
- Gkiotsalitis, K., Wu, Z., & Cats, O. (2019). A cost-minimization model for bus fleet allocation featuring the tactical generation of short-turning and interlining options. Transportation Research Part C: Emerging Technologies, 98, 14–36. https://doi.org/10.1016/j.trc.2018.11.007
- Gong, Z., Du, B., Liu, Z., Zeng, W., Perez, P., & Wu, K. (2020). SD-seq2seq: A deep learning model for Bus bunching prediction based on smart card data. IEEE.
- Hassan, M. N., Rashidi, T. H., & Nassir, N. (2021). Consideration of different travel strategies and choice set sizes in transit path choice modelling. Transportation, 48(2), 723–746. https://doi.org/10.1007/s11116-019-10075-x
- He, S. X. (2015). An anti-bunching strategy to improve bus schedule and headway reliability by making use of the available accurate information. Computers & Industrial Engineering, 85, 17–32. https://doi.org/10.1016/j.cie.2015.03.004
- He, S. X., Dong, J., Liang, S. D., & Yuan, P. C. (2019). An approach to improve the operational stability of a bus line by adjusting bus speeds on the dedicated bus lanes. Transportation Research Part C: Emerging Technologies, 107, 54–69. https://doi.org/10.1016/j.trc.2019.08.001
- He, S. X., He, J. J., Liang, S. D., Dong, J. Q., & Yuan, P. C. (2022). A dynamic holding approach to stabilizing a Bus line based on the Q-learning algorithm with multistage look-ahead. Transportation Science, 56(1), 31–51. https://doi.org/10.1287/trsc.2021.1048
- Hernández, D., Muñoz, J. C., Giesen, R., & Delgado, F. (2015). Analysis of real-time control strategies in a corridor with multiple bus services. Transportation Research Part B, 78, 83–105.
- Hickman, M. D. (2001). An analytic stochastic model for the transit vehicle holding problem. Transportation Science, 35(3), 215–237. https://doi.org/10.1287/trsc.35.3.215.10150
- Iliopoulou, C. A., Milioti, C. P., Vlahogianni, E. I., & Kepaptsoglou, K. L. (2020a). Identifying spatio-temporal patterns of bus bunching in urban networks. Journal of Intelligent Transportation Systems, 24(4), 365–382. https://doi.org/10.1080/15472450.2020.1722949
- Iliopoulou, C., Vlahogianni, E. I., & Kepaptsoglou, K. (2020b). Understanding the factors that affect the bus bunching events’ duration. International Conference on Intelligent Transportation Systems (ITSC), Rhodes, Greece.
- Ingvardson, J. B., Nielsen, O. A., Raveau, S., & Nielsen, B. F. (2018). Passenger arrival and waiting time distributions dependent on train service frequency and station characteristics: A smart card data analysis. Transportation Research Part C: Emerging Technologies, 90, 292–306. https://doi.org/10.1016/j.trc.2018.03.006
- Jiang, R. S., Hu, D. W., & Wu, X. (2019). Prediction of bus bunching using smart card data. ASCE.
- Khan, Z. S., He, W., & Menéndez, M. (2023). Application of modular vehicle technology to mitigate bus bunching. Transportation Research Part C, 146, 103953.
- Kim, J.-K., Lee, B., & Oh, S. (2009). Passenger choice models for analysis of impacts of real-time Bus information on crowdedness. Transportation Research Record: Journal of the Transportation Research Board, 2112(1), 119–126. https://doi.org/10.3141/2112-15
- Koffman, D. (1978). Simulation study of alternative real-time bus headway control strategies. Transportation Research Record, (663), 41–46.
- Kroes, E., Kouwenhoven, M., Debrincat, L., & Pauget, N. (2014). Value of crowding on public transport in île-de-France, France. Transportation Research Record: Journal of the Transportation Research Board, 2417(1), 37–45. https://doi.org/10.3141/2417-05
- Li, S., Liu, R., Yang, L., & Gao, Z. (2019). Robust dynamic bus controls considering delay disturbances and passenger demand uncertainty. Transportation Research Part B: Methodological, 123, 88–109. https://doi.org/10.1016/j.trb.2019.03.019
- Ling, K., & Shalaby, A. (2005). A reinforcement learning approach to streetcar bunching control. Journal of Intelligent Transportation Systems, 9(2), 59–68. https://doi.org/10.1080/15472450590934615
- Liu, D., Xiao, F., Luo, J., & Yang, F. (2023). Deep reinforcement learning-based holding control for Bus bunching under stochastic travel time and demand. Sustainability, 15(14), 10947. https://doi.org/10.3390/su151410947
- Liu, Z., Yan, Y., Qu, X., & Zhang, Y. (2013). Bus stop-skipping scheme with random travel time. Transportation Research Part C: Emerging Technologies, 35, 46–56. https://doi.org/10.1016/j.trc.2013.06.004
- Ma, Q., Li, S., Zhang, H., Yuan, Y., & Yang, L. (2021). Robust optimal predictive control for real-time bus regulation strategy with passenger demand uncertainties in urban rapid transit. Transportation Research Part C: Emerging Technologies, 127, 103086. https://doi.org/10.1016/j.trc.2021.103086
- Manasra, H., & Toledo, T. (2019). Optimization-based operations control for public transportation service with transfers. Transportation Research Part C: Emerging Technologies, 105, 456–467. https://doi.org/10.1016/j.trc.2019.06.011
- Moosavi, S. M. H., Yuen, C. W., Yap, S. P., & Onn, C. C. (2020). Simulation-based sensitivity analysis for evaluating factors affecting bus service reliability: A big and smart data implementation. IEEE Access, 8, 201937–201955. https://doi.org/10.1109/ACCESS.2020.3036285
- Moreira-Matias, L., Cats, O., Gama, J., Mendes-Moreira, J., & De Sousa, J. F. (2016). An online learning approach to eliminate bus bunching in real-time. Applied Soft Computing, 47, 460–482. https://doi.org/10.1016/j.asoc.2016.06.031
- Moreira-Matias, L., Ferreira, C., Gama, J., Mendes-Moreira, J., & Sousa, J. F. D. (2012). Bus bunching detection by mining sequences of headway deviations. ICDM, Springer, 77-91.
- Nagatani, T. (2001). Bunching transition in a time-headway model of a bus route. Physic Review, 63(3), 036115.
- Nassir, N., Hickman, M., & Ma, Z. (2017). Statistical inference of transit passenger boarding strategies from farecard data. Transportation Research Record: Journal of the Transportation Research Board, 2652(1), 8–18. https://doi.org/10.3141/2652-02
- Nassir, N., Hickman, M., & Ma, Z.-L. (2019). A strategy-based recursive path choice model for public transit smart card data. Transportation Research Part B: Methodological, 126, 528–548. https://doi.org/10.1016/j.trb.2018.01.002
- Nassir, N., Zhao, J., Attanucci, F., & Wilson, N. (2018). Bayesian inference of passenger boarding strategies at express stops with real-time bus arrival information. The 97th annual meeting of the transportation reseach board, Washington, D.C.
- Nesheli, M. M., & Ceder, A. (2014). Optimal combinations of selected tactics for public-transport transfer synchronization. Transportation Research Part C: Emerging Technologies, 48, 491–504. https://doi.org/10.1016/j.trc.2014.09.013
- Newell, G. F., & Pott, R. B. (1964). Maintaining a bus schedule. Australian Road Research Board (ARRB), Melbourne.
- Osuna, E. E., & Newell, G. F. (1972). Control strategies for an idealized public transportation system. Transportation Science, 6(1), 52–72. https://doi.org/10.1287/trsc.6.1.52
- Pan, L., Waygood, E. O. D., & Patterson, Z. (2022). Would You wait? Bus choice behavior analysis considering various incentives. Transportation Research Record, 2676(7), 117–127.
- Phillips, W., del Rio, A., Muñoz, J. C., Delgado, F., & Giesen, R. (2015). Quantifying the effects of driver non-compliance and communication system failure in the performance of real-time bus control strategies. Transportation Research Part A, 78, 463–472.
- Pi, X., Egge, M., Whitmore, J., Sean Qian, Z., & Silbermann, A. (2018). Understanding transit system performance using AVL-APC data: An analytics platform with case studies for the Pittsburgh Region. Journal of Public Transportation, 21(2), 19–40. https://doi.org/10.5038/2375-0901.21.2.2
- Preston, J., Pritchard, J., & Waterson, B. (2017). Train overcrowding. Transportation Research Record: Journal of the Transportation Research Board, 2649(1), 1–8. https://doi.org/10.3141/2649-01
- Rashidi, S., Ranjitkar, P., Csaba, O., & Hooper, A. (2017). Using automatic vehicle location data to model and identify determinants of bus bunching. Transportation Research Procedia, 25, 1444–1456.
- Rezazada, M., Nassir, N., & Egemen, T. (2022). Public transport bunching: A critical review with focus on methods and findings for implications for policy and future research. Australasian transport research forum 2022 proceedings, Adelaide, Australia.
- Rezazada, M., Nassir, N., & Egemen, T. (2023). What influences passenger’s arrival rate at stops in Melbourne: Wasea-Lstm, a novel deep learning model leveraging multi-source data fusion. Australasian transport research forum 2023 proceedings, Perth, Australia.
- Rossetti, M. D., & Turitto, T. (1998). Comparing static and dynamic threshold based control strategies. Transportation Research Part A, 32A(8), 607–620.
- Saw, V.-L., Vismara, L., & Chew, L. Y. (2020). Intelligent buses in a loop service: Emergence of no-boarding and holding strategies. Complexity, 2020, 7274254. https://doi.org/10.1155/2020/7274254
- Schmöcker, J. D., Sun, W., Fonzone, A., & Liu, R. (2016). Bus bunching along a corridor served by two lines. Transportation Research Part B: Methodological, 93, 300–317. https://doi.org/10.1016/j.trb.2016.07.005
- Seman, L. O., Koehler, L. A., Camponogara, E., & Kraus Jr, W. (2020). Integrated headway and bus priority control in transit corridors with bidirectional lane segments. Transportation Research Part C: Emerging Technologies, 111, 114–134. https://doi.org/10.1016/j.trc.2019.12.001
- Shi, H., Nie, Q., Fu, S., Wang, X., Zhou, Y., & Ran, B. (2021). A distributed deep reinforcement learning–based integrated dynamic bus control system in a connected environment. Computer-Aided Civil and Infrastructure Engineering, 37(15), 2016–2032.
- Soza-Parra, J., Raveau, S., & Muñoz, J. C. (2022). Public transport reliability across preferences, modes, and space. Transportation, 49(2), 621–640. https://doi.org/10.1007/s11116-021-10188-2
- Soza-Parra, J., Raveau, S., Muñoz, J. C., & Cats, O. (2019). The underlying effect of public transport reliability on users’ satisfaction. Transportation Research Part A, 126, 83–93.
- Sun, A., & Hickman, M. (2005). The real-time stop-skipping problem. Journal of Intelligent Transportation Systems, 9(2), 91–109. https://doi.org/10.1080/15472450590934642
- Sun, W., & Schmöcker, J.-D. (2018). Considering passenger choices and overtaking in the bus bunching problem. Transportmetrica B, 6(2), 151–168.
- Tian, S., Li, X., Liu, J., Ma, H., & Yu, H. (2022). A short-turning strategy to alleviate bus bunching. Journal of Ambient Intelligence and Humanized Computing, 13(1), 117–128. https://doi.org/10.1007/s12652-020-02891-2
- Tirachini, A., Cortés, C. E., & Jara-Díaz, S. R. (2011). Optimal design and benefits of a short turning strategy for a bus corridor. Transportation, 38(1), 169–189. https://doi.org/10.1007/s11116-010-9287-8
- Tirachini, A., Godachevich, J., Cats, O., Muñoz, J. C., & Soza-Parra, J. (2022). Headway variability in public transport: a review of metrics, determinants, effects for quality of service and control strategies. Transport Reviews, 42(3), 337–361. https://doi.org/10.1080/01441647.2021.1977415
- Tirachini, A., Hensher, D. A., & Rose, J. M. (2013). Crowding in public transport systems: Effects on users, operation and implications for the estimation of demand. Transportation Research Part A, 53, 36–52.
- Turnquist, M. A., & Bowman, L. A. (1980). The effects of network structure on reliability of transit service. Transportation Research Part B: Methodological, 14(1-2), 79–86. https://doi.org/10.1016/0191-2615(80)90034-X
- Varga, B., Tettamanti, T., & Kulcsár, B. (2018). Optimally combined headway and timetable reliable public transport system. Transportation Research Part C: Emerging Technologies, 92, 1–26. https://doi.org/10.1016/j.trc.2018.04.016
- Verbich, D., Diab, E., & El-Geneidy, A. (2016). Have they bunched yet? An exploratory study of the impacts of bus bunching on dwell and running times. Public Transport, 8(2), 225–242. https://doi.org/10.1007/s12469-016-0126-y
- Wang, J., & Sun, L. (2020). Dynamic holding control to avoid bus bunching: A multi-agent deep reinforcement learning framework. Transportation Research Part C: Emerging Technologies, 116, 102661. https://doi.org/10.1016/j.trc.2020.102661
- Wang, J., & Sun, L. (2021). Reducing bus bunching with asynchronous multi-agent reinforcement learning. International Joint Conference on Artificial Intelligence, IJCI, 426-433.
- Wang, J., & Sun, L. (2023). Multi-objective multi-agent deep reinforcement learning to reduce bus bunching for multiline services with a shared corridor. Transportation Research Part C: Emerging Technologies, 155, 104309. https://doi.org/10.1016/j.trc.2023.104309
- Wang, P., Chen, X., Zheng, Y., Cheng, L., Wang, Y., & Lei, D. (2021). Providing real-time bus crowding information for passengers: A novel policy to promote high-frequency transit performance. Transportation Research Part A, 148, 316–329.
- Wang, W., Tian, Z., Li, K., & Yu, B. (2019). Real-time short turning strategy based on passenger choice behavior. Journal of Intelligent Transportation Systems, 23(6), 569–582. https://doi.org/10.1080/15472450.2019.1573366
- Wu, W., Liu, R., & Jin, W. (2017). Modelling bus bunching and holding control with vehicle overtaking and distributed passenger boarding behaviour. Transportation Research Part B: Methodological, 104, 175–197. https://doi.org/10.1016/j.trb.2017.06.019
- Wu, W., Liu, R., & Jin, W. (2018). Integrating bus holding control strategies and schedule recovery: Simulation-based comparison and recommendation. Journal of Advanced Transportation, 2018. Article ID 9407801.
- Wu, W., Liu, R., Jin, W., & Ma, C. (2019). Simulation-based robust optimization of limited-stop bus service with vehicle overtaking and dynamics: A response surface methodology. Transportation Research Part E: Logistics and Transportation Review, 130, 61–81. https://doi.org/10.1016/j.tre.2019.08.012
- Xuan, Y., Argote, J., & Daganzo, C. F. (2011). Dynamic bus holding strategies for schedule reliability: Optimal linear control and performance analysis. Transportation Research Part B: Methodological, 45(10), 1831–1845. https://doi.org/10.1016/j.trb.2011.07.009
- Yu, H., Chen, D., Wu, Z., Ma, X., & Wang, Y. (2016). Headway-based bus bunching prediction using transit smart card data. Transportation Research Part C: Emerging Technologies, 72, 45–59. https://doi.org/10.1016/j.trc.2016.09.007
- Zhang, H., Zhao, S., Liu, H., & Li, J. (2017). A dynamic short-turning bus control for uncertain demand. Journal of Advanced Transportation, 2017. Article ID 7392962.
- Zhao, S., Lu, C., Liang, S., & Liu, H. (2016). A self-adjusting method to resist bus bunching based on boarding limits. Mathematical Problems in Engineering, 2016, 8950209. https://doi.org/10.1155/2016/8950209
