
 ?Mathematical formulae have been encoded as MathML and are displayed in this HTML version using MathJax in order to improve their display. Uncheck the box to turn MathJax off. This feature requires Javascript. Click on a formula to zoom.
ABSTRACT
Determining the factors that positively and negatively affect the resilience of transport networks provides valuable information that leads to a deeper understanding of the preparedness and response of networks to external disruptions. Over the past few decades, several review papers have explored various interpretations of transport network resilience and its calculation metrics. Nevertheless, only a limited number of these papers have paid attention on the utilisation of empirical data in resilience studies. This paper, through a systematic literature review, contributes to filling this gap. To this end, from a pool of 127 relevant articles, a subset of 53 articles using real-world data was selected. The paper analyses and classifies empirical findings in transport network resilience studies. In particular, it highlights and thoroughly discusses spatial patterns of resilience and relevant influencing factors that positively or negatively affect the resilience attributes of a transport network. Although it is possible to place the empirical results within the theoretical framework proposed by the literature, two main issues on target reference levels arise from the graphical representation of transport network resilience as suggested by the theory. Based on these findings, research gaps are identified and future directions for transport researchers are proposed.
1. Introduction
Transport networks are the pillars of the economy. A resilient and efficient transport network, intended as the set of links, nodes and transport services (e.g. toll roads, public transport services, airline services), enables the movement of goods and people and promotes trade and cohesion between regions and societies. However, these networks, at both the infrastructure and service levels, are susceptible to risks from external disruptions. Climate change-related phenomena, such as rising temperatures and the increased frequency and intensity of extreme weather events (de’ Donato & Michelozzi, Citation2014; Stott, Citation2016), pose challenges to the resilience of passenger and freight transport networks. Additionally, maintenance work (Younes et al., Citation2019), protests (van Exel & Rietveld, Citation2001; Van Exel & Rietveld, Citation2009; Adler & van Ommeren, Citation2016), and other external disruptions like the COVID-19 pandemic or political unrest can disrupt travel and logistic activities on transport networks (Bergantino et al., Citation2021; Chen et al., Citation2024; Vickerman, Citation2021; Zhang et al., Citation2021). Over the past few decades, numerous articles have examined the resilience of transport networks concerning these events, proposing various metrics to analyse network performance during disruptions and assess resilience. Concepts such as robustness, vulnerability, and reliability have been defined to provide additional tools for understanding and calculating transport networks resilience. Although a significant portion of the literature has used real-world data to support its findings, only a few of the transport resilience reviews we found have discussed its use. Furthermore, little emphasis has been placed on exploring potential spatial patterns of resilience, defined as the interaction between spatial dynamics or characteristics (e.g. urban or rural area, or distance decay functions from a point of interest) and a specific resilience outcome (i.e. increase or decrease in one or more resilience attributes). Similarly, limited attention has been given to the identification of influencing factors that may increase or decrease the resilience of transport networks. To address this gap, this paper aims to review relevant literature on empirical resilience outcomes. In addition, we exploited the analysis of the transport resilience studies that used real-world data to test the theoretical and graphical framework which is generally adopted by the literature.
The paper is organised as follows: section 2 provides a brief overview of the concepts of transport network resilience; section 3 describes the selection process and the collected sample of articles; section 4 analyses spatial patterns and factors influencing resilience, organising and discussing them; section 5 discusses the results and situates them within the adopted theoretical context; section 6 highlights gaps in contextualising the empirical results within the theory and proposes future research directions; finally, section 7 concludes the paper. This contribution delves into the use of real-world data in resilience assessment and provides an in-depth discussion of empirical findings on resilience. Specifically, it identifies, classifies, and discusses empirical factors of resilience and tests the theoretical and graphical framework over the real-world applications. Inconsistencies between transport networks resilience theory and practice are critically discussed and future strands of research are proposed.
2. Short overview of the concepts of transport network resilience
Transport network resilience is defined as the ability of a transport network to absorb shocks, maintain functionality, adapt to and resist the negative effects of disruptive events, and rapidly recover to a state of equilibrium (Bešinović, Citation2020; Gonçalves & Ribeiro, Citation2020; Gu et al., Citation2020; Pan et al., Citation2021; Wan et al., Citation2018). It has a temporal dimension, with static resilience referring to the ability to maintain functions immediately after a shock and withstand the damages and disturbances caused by disruptive events. Dynamic resilience, on the other hand, refers to the speed at which a network recovers to a desired state of equilibrium after a perturbation (Mattsson & Jenelius, Citation2015). Various related concepts have been categorised and defined to create a resilience theoretical framework (Wan et al., Citation2018) and several metrics have been produced in the literature in recent years (see Zhou et al., Citation2019 for a review). Here is a summary of the main related concepts:
Robustness: The network's ability to maintain functions during a disruption.
Vulnerability: The risk of disruption and loss of functionality, representing a network's susceptibility to perturbations and adverse consequences that lead to performance loss.
Redundancy: The ability of a network to offer alternative options or provide additional capacity to replace capacity loss during a disruption.
Resourcefulness: The availability of supplies and resources and the ability to mobilise them to restore functionality during a perturbation.
Rapidity: The speed at which functionality of a transport network is restored.
Reliability: The probability that a transport network will function successfully for an intended period of time under operating conditions.
Mitigation strategies: Retrofitting or enhancing transport infrastructure, with a focus on vulnerable components or nodes of a network, to improve the ability to absorb the adverse effects of disruption events.
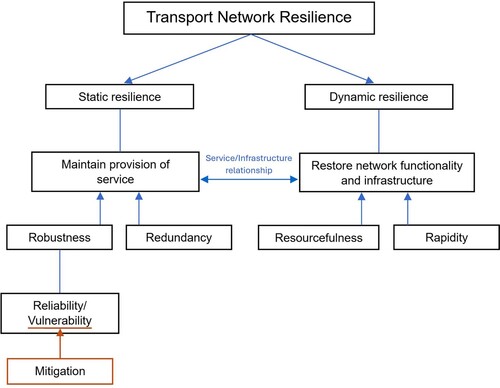
Resilience and related concepts are interrelated and interdependent. As noted in the 4R framework (Bruneau et al., Citation2003), which is a widely adopted theoretical framework in resilience studies, robustness and redundancy contribute to static resilience, while resourcefulness and rapidity contribute to dynamic resilience. Vulnerability, reliability and mitigation strategies are associated with the risk of disruption and the networks’ ability to maintain functionality under perturbations. Besides mitigation strategies, that are centered around the infrastructure, all the other concepts are related both to the service and to the infrastructural resilience. For example, a bridge can be robust to withstand earthquakes, and similarly, a transit service can be robust against strikes when guaranteed operating hours are put in place. displays the interconnections between the various concepts.
Figure 1. Transport network resilience and related concepts.
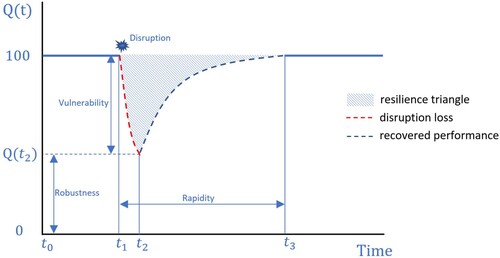
Regarding the measurement of resilience, it can be based on performance or topological metrics (see the reviews of Pan et al., Citation2021; Reggiani et al., Citation2015 ; Zhou et al., Citation2019). Performance metrics measure the performance of a network over time. shows the cumulative impact area, which in its initial form was conceptualised as the “resilience triangle” (Tierney & Bruneau, Citation2007), defining resilience in different phases: pre-disruption (t0 to t1), disruption/failure (static resilience) (t1 to t2), and recovery phase (dynamic resilience) (t2 to t3). This form has been later expanded to a wider variety of resilience curve characteristics and corresponding cumulative areas. For example, one frequently mentioned and used cumulative area is the “resilience trapezoid” (Poulin & Kane, Citation2021). Quantitatively, according to Bruneau et al. (Citation2003) framework, transport system resilience can be measured as:
(1)
(1) where R represents the “resilience triangle” from
to
and
represent a performance indicator, that, based on the applications, may be the level of service, the physical resistance of the infrastructure or others.
Figure 2. Evolution of transport networks’ performance under disruption based on Bruneau et al. (Citation2003) and Gu et al. (Citation2020).
3. Methodology of the review and overview of the real-data sample
We conducted a literature search on the Scopus database using the following research string: “TITLE-ABS-KEY (“transport* resilien*” OR “resilien* of transport*” OR “transport* network resilien*” OR “resilien* of transport* network”)”. Additional papers were included based on the references cited in the retrieved papers and searches on authors who frequently focus on these topics. Only papers written in English were considered. From this process, 127 papers were deemed relevant for interpreting transport network resilience, computing resilience metrics, or both.
Among these papers, we conducted an additional literature search to identify the “real data subsample”, which includes articles that used real data for their empirical analysis. In this paper, we focus only on performance metrics since they align better with our research focus, which is network performance and related indicators (such as flow, capacity, speed, and delay). For studies related to topological metrics, please refer to Zhou et al. (Citation2019) or Pan et al. (Citation2021) for a review. To create the subsample, we retained the literature that used data (flow/speed/ …) as performance indicators in the resilience analysis (n = 48) and the literature using a combination of performance and topological metrics (likewise weighted network connectivity indexes) (n = 13). Among these, we excluded papers that used simulation data (n = 8) and kept those that used real data (n = 53). summarises the process.
Figure 3. Selection process of the 53 real data paper subsample.
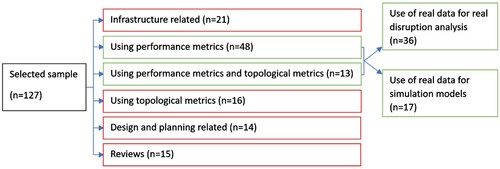
As shown in , 36 of the subsampled papers analyse real disruption events, while the remaining 17 are used to study simulated disruptions or serve as input or benchmarks for simulation models. For example, Donovan and Work (Citation2017) utilised real GPS data from taxi trips in New York City before, during, and after Hurricane Sandy to study speed deviations in normal and disruptive states. On the other hand, Azolin et al. (Citation2020) used real origin-destination survey data on walking, cycling, public transportation, and car trips in two Brazilian regions to study the share of trips that would be resilient to a hypothetical fuel crisis affecting most of the motorised means of transport. The most used type of real data is flow data (n = 38), followed by travel time (n = 30), trip spatial coordinates (n = 7), cost of transport (n = 5), and accident data (n = 2). In terms of modes of transport, most studies in the subset are related to the road network (n = 17), followed by railways (n = 11), metro services (n = 10), bicycles (n = 10), airways (n = 6), bus services (n = 5), multimodal networks (n = 5), walking (n = 2), and waterways (n = 1). categorises the literature subsample by data type and mode of transport.
Table 1. List of references by type of real-data use by mode of transport.
4. Transport resilience empirical findings
In the following two sections, we analyse and categorise the spatial patterns and resilience influencing factors found in the subsample.Footnote1
4.1. Spatial patterns
The term “spatial patterns” refers to geographical aspects that are often associated with specific resilience effects. We have identified the following spatial patterns: central/urban vs peripheral/rural; high vs low accessibility; closest alternative mode distance decay; and different locations of hazards. at the end of this section groups the methodologies used to study these spatial patterns.
Central/urban vs peripheral/rural: The centrality of urban locations and the concentration of jobs and services are linked to two opposing effects. On one side, central urban zones are found to be the most vulnerable to disruptive events (Chang & Nojima, Citation2001; Ferranti et al., Citation2016; Hara & Kuwahara, Citation2015; Jiang et al., Citation2018; Spyropoulou, Citation2020; Tsapakis et al., Citation2012). This vulnerability is due to the high density of passengers involved, the high concentration of infrastructure that propagates the incident (Ferranti et al., Citation2016; Jiang et al., Citation2018), and the presence of pre-existing bottlenecks or congestion (Hara & Kuwahara, Citation2015; Spyropoulou, Citation2020; Tsapakis et al., Citation2012). Systematic congestion is particularly problematic during emergencies (Hara & Kuwahara, Citation2015), as pre-existing bottlenecks exacerbate the negative effects of disaster-induced congestion, further impacting the network's performance. On the other hand, central locations are found to be more resilient than outer regions (Azolin et al., Citation2020; da Mata Martins et al., Citation2019; Fernandes et al., Citation2019; Lu, Citation2018; Matisziw et al., Citation2020; Spyropoulou, Citation2020; Zhu et al., Citation2017). These regions exhibit higher redundancy (Azolin et al., Citation2020; da Mata Martins et al., Citation2019; Fernandes et al., Citation2019; Lu, Citation2018; Saberi et al., Citation2018; Spyropoulou, Citation2020; Yang et al., Citation2022), which increases the availability of alternative modes of transport for disrupted modes’ users. Additionally, the presence of infrastructure, jobs, and services in central locations makes them priority zones (Zhu et al., Citation2017) with faster recovery times compared to outer areas (Lu, Citation2018; Zhu et al., Citation2017). This positive pattern is also observed in multimodal networks, as shown by Safitri and Chikaraishi (Citation2022), who found that central zones along main transport corridors recovered faster and experienced lower monetary losses (in terms of travel time) during heavy rain disruptions in Japan in 2018. Better infrastructure is also associated with improved emergency response. Matisziw et al. (Citation2020) noted that central areas with better infrastructure exhibit higher levels of resilience to car crashes, measured as lower patrol response times, compared to rural areas.
High vs low accessibility: Different locations with varying levels of accessibility experience different magnitudes of disruption-related effects. In general, areas with limited accessibility are less vulnerable to disruptions compared to zones characterised by higher gravity and heavier flows (Chang & Nojima, Citation2001; Ganin et al., Citation2017, Citation2019; Santos et al., Citation2021). For example, mountainous areas in Japan during the 1995 Kobe earthquake showed a lesser decrease in commuting levels compared to central areas, which were the main commuting destinations (Chang & Nojima, Citation2001). However, when disruptions are mode-specific, such as bus services (Spyropoulou, Citation2020) or motorised private means (Azolin et al., Citation2020; da Mata Martins et al., Citation2019; Fernandes et al., Citation2019), regions with limited accessibility through alternative modes of transport are less redundant and therefore less resilient. The same holds for areas with scarce accessibility and little infrastructural redundancy when disruptions sever the main access links (Safitri & Chikaraishi, Citation2022).
Distance decay (proximity) to closest alternative mode: This spatial pattern is specific to bike-sharing service studies (Cheng et al., Citation2021; Saberi et al., Citation2018; Teixeira & Lopes, Citation2020; Yang et al., Citation2022; Younes et al., Citation2019). Bike-sharing stations located within a threshold radius from a public transport stop significantly increase the redundancy of transport networks when disrupted. The detected thresholds are 1.2 km in Cheng et al. (Citation2021) and 1 km in Saberi et al. (Citation2018). Teixeira and Lopes (Citation2020) and Younes et al. (Citation2019) found significant changes in bike-sharing ridership within a catchment area with a radius of 400 meters from metro stations. Yang et al. (Citation2022) integrated the work of Saberi et al. (Citation2018) and supported the 1 km threshold but found it to be significant only for weekdays in the city of London, suggesting bike sharing as an alternative mode of commuting when public transport is disrupted.
Different locations of hazards: Studies on the impacts of Hurricane Sandy (Donovan & Work, Citation2017; Janić, Citation2015; Mudigonda et al., Citation2019) and Hurricane Irene (Zhu et al., Citation2016, Citation2017) show that the closer a region is to the coast, the greater the impact on the performance of transport networks. Interestingly, the impact is not necessarily negative. Donovan and Work (Citation2017) found that despite severe flooding, taxi trips in lower Manhattan were significantly faster during the first four days after Hurricane Sandy, suggesting that travel time benefited from local changes in demand and alternative use of infrastructure until it was restored. Proximity to the seashore is also a negative factor in the context of sea-level rise, as shown by Dawson et al. (Citation2016). However, the effects of sea-level rise can propagate to inner regions, causing a cascade effect of congestion and delays (Sun et al., Citation2020). The affected regions are not necessarily the ones directly affected by the disruption. Büchel et al. (Citation2020) found that the 2017 Rastatt disruption in Germany led to a significant increase in congestion and delays in Schaffhausen, Switzerland, due to necessary rerouting along a different path. On the other hand, the Basel area, which lies along the same path that passes through Rastatt, experienced a significant reduction in congestion and average delays during the disruption period.
Table 2. Methodology used for the identification of spatial patterns of resilience.
4.2. Resilience influencing factors
We have identified the following main factors that influence the resilience of transport networks: redundancy, provision of real-time information, institutional plans and management, climate change and intensity of disruptions, strengthening of infrastructure, congestion and socio-economic indicators. at the end of this section groups the methodologies used to identify these resilience influencing factors.
Redundancy: Redundancy is the most frequently detected factor that impacts resilience and is found in 25 papers. This is not surprising, considering that redundancy is one of the attributes used by Bruneau et al. (Citation2003) and other scholars to define and build the 4R methodological framework for resilience assessment. Regarding between-modes redundancy, bus services have been shown to be a significant complement to disrupted metro services (Jin et al., Citation2014; Jiang et al., Citation2018). Cycling serves as a complementary mode to both bus and metro services (Azolin et al., Citation2020; Cox et al., Citation2011; Campisi et al., Citation2020; da Mata Martins et al., Citation2019). The road transport complements metro and bus services during disruptions, and vice versa (Cox et al., Citation2011; Ganin et al., Citation2017; Loo & Leung, Citation2017; Spyropoulou, Citation2020; Sun et al., Citation2020; Zhu et al., Citation2017). High-speed rail in China has been shown to provide redundancy for air traffic during severe airport delays (Zhou & Chen, Citation2020). Similarly, walking complements road transport during severe disruptions (Loo & Leung, Citation2017). However, it is important to note that between-modes redundancy may also have negative side effects, such as increased congestion on alternative modes. For example, bike-sharing docks located close to metro stations improve general resilience to metro disruptions but may suffer increased pressure along specific routes (Yang et al., Citation2022). Similarly, car trips increase during public transport strikes, despite increasing redundancy, leads to congestion and increased travel time (Spyropoulou, Citation2020; Tsapakis et al., Citation2012). Therefore, walking and cycling policies, as well as car-sharing/pooling, can increase resilience not only in terms of redundancy but also in terms of robustness by keeping congestion low. However, it is important to consider the limited range of walking and biking. To model their redundancy potential, it is recommended to adopt maximum potential distances (Azolin et al., Citation2020; da Mata Martins et al., Citation2019). Regarding within-mode (infrastructural) redundancyFootnote2, both ground and underground infrastructural redundancy are significant positive factors for private and public transport (Chang & Nojima, Citation2001; Ganin et al., Citation2017; Lu, Citation2018; Mudigonda et al., Citation2019; Serulle et al., Citation2011). However, re-routing potential may be offset by two main factors. First, infrastructure integration may not always be feasible due to discrepancies, suggesting that standardisation of infrastructure helps increase resilience (Woodburn, Citation2019). Second, re-routing should be supported by real-time information to minimise performance losses (Loo & Leung, Citation2017; Spyropoulou, Citation2020).
Provision of real-time information: As anticipated, literature in the subsample indicates that the provision of real-time data during a disruption increases resilience (Loo & Leung, Citation2017). This suggests that quick responses from governments and transport operators in sharing relevant information can enhance the overall level of resilience. For example, during the 2014 Hong Kong protests of the “Occupy Central Movement”, the government, transport operators, and other stakeholders effectively shared real-time data, enabling citizens to make informed decisions and reroute to alternative modes with known availability. Similar real-time monitoring technologies have been suggested by Ferranti et al. (Citation2016) for train networks and by Yang et al. (Citation2022) for bike-sharing networks. Ferranti et al. (Citation2016) proposed low-cost implementation of real-time monitoring to identify heat-related incidents in the train network and intervene promptly to mitigate delays. Yang et al. (Citation2022) recommended dynamic geographical fleet management to redistribute pressure among a larger number of stations and bicycles during disruptions of alternative modes.
Institutional plans and management: Institutional actions, both pre-disruption and post-disruption, are often recommended to significantly contribute to the resilience of transport networks. In the case of disasters such as hurricanes or tsunamis, Donovan and Work (Citation2017), Hara and Kuwahara (Citation2015), and Mudigonda et al. (Citation2019) suggest that identifying and reinforcing critical nodes and implementing quick post-emergency responses can contribute to resilience and expedite recovery to pre-disruption levels. For example, traffic management and evacuation planning could have led to better results during the 2011 Japan tsunami by redirecting traffic to more elevated areas (Hara & Kuwahara, Citation2015). Other types of recommended government actions are found in the subset. Ferranti et al. (Citation2016) found that heat-related disruptions are concentrated in the first period of the summer season, suggesting the implementation of mid-term mitigation actions to prevent similar events in the following periods. Similarly to Yang et al. (Citation2022) regarding geographical fleet management, Matisziw et al. (Citation2020) found that the geographical location of patrols responding to car crashes is a significant positive factor, and that flexible patrol locations, combined with data-driven accident anticipation, can enhance road network resilience. In the air sector, de Jong and Lieshout (Citation2021) found that integration at the European level, specifically in air traffic management or guaranteeing overflight services, can offset performance degradation caused by air control strikes. Evidence of additional performance decrease is found in cases where services of overflight are not guaranteed. As expected, the provision of emergency aids during disruptions such as the COVID-19 pandemic is expected to increase transport network resilience and partially mitigate its negative effects (e.g. the number of passengers for airline operators, as seen in Santos et al., Citation2021). For multimodal networks, redesigning and rescaling passenger shuttle services that feed into main train and bus routes during a pandemic has been shown to better accommodate demand during disruptions (Auad et al., Citation2021).
Climate change and intensity of disruptions: As expected, the intensity of disruptions is a significant factor contributing to a decrease in performance. Studies by Janić (Citation2015), Safitri and Chikaraishi (Citation2022), Zhou and Chen (Citation2020) and Zhu et al. (Citation2017) demonstrate that the stronger the intensity of the disruption, the greater the drop in performance. These studies compare intensities by examining different networks subjected to the same weather event (Janić, Citation2015; Safitri & Chikaraishi, Citation2022) or by considering different hazards affecting the same networks at different times (Zhou & Chen, Citation2020; Zhu et al., Citation2017). Dawson et al. (Citation2016) used time-series analysis to find that high-emission scenarios leading to accelerated climate change are estimated to significantly increase accidents on the southwest English rail network, which is vulnerable to sea level rise due to its proximity to the seashore.
Strengthening of the infrastructure: Strengthening the infrastructure is identified in the subset as a positive factor for building resilience. It not only increases the physical resistance of the network but also enhances the density of the infrastructure, providing more accommodating links for users in the event of a disruption (Lu, Citation2018; Matisziw et al., Citation2020; Mudigonda et al., Citation2019; Serulle et al., Citation2011; Woodburn, Citation2019). Fabella and Szymczak (Citation2021) highlight that for rail networks strengthening of the infrastructure may be sufficient for dealing with small-scale disruptions such as fallen trees, while larger events require quick and efficient rerouting plans (e.g. Fikar et al., Citation2016). Mudigonda et al. (Citation2019) emphasise that reinforcement actions should be anticipated through mitigation plans that identify critical nodes and enhance local resilience. Similarly, Woodburn (Citation2019) suggests identifying infrastructure discrepancies and upgrading inferior infrastructure for integrated rerouting.
Congestion: As mentioned earlier, systematic congestion and high user flows have a negative impact on the resilience of transport networks (Donovan & Work, Citation2017; Hara & Kuwahara, Citation2015; Jiang et al., Citation2018; Wang et al., Citation2019). Congestion can also spill over to alternative modes (Yang et al., Citation2022; Spyropoulou, Citation2020). Niu et al. (Citation2022) further supports the negative impact of pre-existing congestion and, in line with Hara and Kuwahara (Citation2015), points out that centrality topological features (representing infrastructure density) are relevant for exacerbating congestion only in the case of unforeseeable events like hurricanes. In other types of foreseeable events, such as the carnival of Rio de Janeiro, the authors did not find any association between centrality measures and performance degradation.
Increase in socio-economic indicators: The last factor is related to the long-term increase in countries’ socio-economic indicators. Tang et al. (Citation2020) and Otuoze et al. (Citation2021) used historical macro-economic indicators to evaluate and predict the resilience of transport networks in different cities in China and Nigeria, respectively. Tang et al. (Citation2020) employed various indicators, such as per capita area of paved roads, passenger traffic per road and the number of accidents, to build a layered network model and assess the extent to which these indexes contribute to different aspects of resilience. They found that GDP growth alone is not sufficient to explain transport resilience improvements, suggesting that economic growth does not necessarily correspond to an increase in transport infrastructure and service quality. Economic growth can also bring negative side effects, including heavy urbanisation, increased user density and pressure on transport networks. Otuoze et al. (Citation2021) noted that historical data on population, population density, number and estimated length of roads and railways are good predictors of traffic volume in congested cities like Kano and Lagos in Nigeria. Santos et al. (Citation2021) supports the idea put forth by Tang et al. (Citation2020) and, by using data on air passengers during the first wave of the Covid-19 pandemic in Brazil's federal states, indicate that historical improvement in social conditions is a significant factor in explaining the decrease in airline ridership during the disruption. This evidence, coupled with the increasing substitutability of long-haul trips with virtual meetings, is a factor that air operators should consider to be prepared for future risks.
Table 3. Methodology used for the identification of resilience influencing factors.
5. Discussion and policy implications
The analysis of the real-data subsample showed the existence of common spatial patterns that contribute to resilience. Central and urban zones were found to be more vulnerable to disruptive events due to higher social, economic, and infrastructure density. However, these areas also exhibited greater resilience by providing better redundancy and being designated as “priority zones” with faster recovery times compared to outer areas. Similarly, zones with lower accessibility were less vulnerable to disruptive events due to lighter user flows, but they were also less resilient due to limited between-modes and infrastructural redundancy. Integration of bike sharing programmes with public transport (PT) modes within a certain distance from PT stops was found to significantly enhance overall resilience. Furthermore, resilience did not always align with the local dimension of disruption. While proximity to disruption generally leads to a drop in performance, countertrends such as increased performance due to changes in demand or the propagation of disruptive effects to outer areas were also observed.
Regarding influential factors, the review identified several key factors correlated with higher levels of resilience: (i) redundancy, (ii) provision of real-time information, (iii) institutional plans and management, and (iv) strengthening of infrastructure. On the other hand, climate change, intensity of disruptions, and systematic congestion were found to have negative impacts. There was no consensus in the subsampled literature regarding the effect of economic indicators on resilience. While economic growth often leads to improved transport infrastructure and services, it can also bring negative side effects such as increased urbanisation and pressure on transport networks. Further research is needed to study the specific effects of economic indicators.
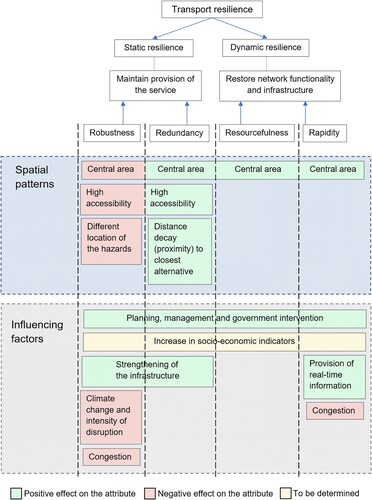
The findings on spatial patterns and influential factors align with the 4R theoretical framework proposed by Bruneau et al. (Citation2003). Placing the analysis within this framework is expected, given its widespread use by scholars in the field. categorises the findings based on the 4R framework, with positive effects represented by a green background, negative effects by a red background, and “increase in socio-economic indicators” denoted by a yellow background, indicating the lack of a clear trend. This graphical representation highlights the diverse contributions and impacts of different spatial patterns and influencing factors on various attributes of resilience. It emphasises the importance of considering multiple attributes of resilience, as focusing on only one attribute may lead to incomplete and biased assessments that fail to capture the offsets or synergies among different attributes. Given the existence of metrics that focus on single attributes in the literature, this finding underscores the need for scholars and policymakers to acknowledge the potential weaknesses and limitations of the metrics used thus far. The findings reported in this review support several policy suggestions. Firstly, adopting metrics that focus on different attributes of resilience is recommended. Alternatively, when using a single-attribute approach is necessary, researchers should provide a clear rationale for their choice or disclose the limitations associated with it. Furthermore, demonstrates that influential factors can act specifically on certain resilience attributes, which may be of interest to policymakers. For example, policymakers aiming to increase the likelihood of fast recovery for road users in the event of a disruption may consider addressing systematic congestion and providing real-time information to users. The importance of the local dimension of resilience should not be overlooked, suggesting that specific local policies should be preferred over standardised resilience plans. However, local effects can also impact outer regions, necessitating the integration of local policies and governance structures to achieve resilience on a larger geographic scale. Regarding the building of resilience, the review identified specific institutional actions that can help offset performance drops caused by disruptions. These include local reinforcement of critical nodes, the development of quick post-emergency traffic plans, the establishment of geographically flexible fleets and intervention units and the provision of financial aids.
Figure 4. Sub-categorisation of the findings based on the 4R framework.
Additionally, the review highlighted other influential factors that can be leveraged by local policies to enhance resilience:
Redundancy, both between modes and within modes, increases resilience. Redundancy efforts should consider integration among alternatives, potential negative spillovers such as induced congestion, and distance decays. Strengthening the infrastructure contributes to physical redundancy, bridging infrastructure gaps and enabling different alternatives to integrate and build more robust networks.
Provision of real-time data has a positive effect on transport network resilience, improving the speed of recovery and the efficiency of rerouting and user redistribution across alternative modes.
Systematic congestion exacerbates the negative effects of unexpected disruptions. Negative impacts on transport resilience should be included in the planning of policies aimed at mitigating congestion's negative externalities.
Worsening climate change is a significant negative factor for transport resilience. Defining future risk scenarios, as suggested by Jaroszweski et al. (Citation2014), can help better understand the current level of transport resilience. The increasing intensity of disruptions negatively affects resilience, necessitating the development of future policies that focus not only on mitigation but also on adaptation (Zhang & Witlox, Citation2019) to build transport resilience.
6. Research gaps and future research strands
Although it was possible to place the empirical results in the context of the 4R framework, real data only partially supports the “resilience triangle” as shown in . Several papers (Donovan & Work, Citation2017; Fabella & Szymczak, Citation2021; Hara & Kuwahara, Citation2015; Janić, Citation2015; Janić, Citation2018; Loo & Leung, Citation2017; Mudigonda et al., Citation2019; Niu et al., Citation2022; Zhu et al., Citation2016) attempted to graphically represent the performance of the network as a function of time, but at least two main issues need to be highlighted.
The first issue relates to the challenge of finding an objective pre-disruption reference point (Q() in ). In empirical time series performance data, it is not trivial to find a constant previous trend. For scheduled operations like bus, train, and airline services, the reference point may be objectively set as the scheduled level of activity during the analysed time period (Janić, Citation2015; Janić, Citation2018). However, when analysing road traffic flow data, speed data (Donovan & Work, Citation2017; Hara & Kuwahara, Citation2015; Mudigonda et al., Citation2019; Niu et al., Citation2022; Zhu et al., Citation2016), or other types of data where there is no scheduled level, the pre-disruption level is usually set as the last observation before the disruptive event. Such a level may not necessarily be the 100% reference point as depicted in Bruneau et al. (Citation2003) representation. Examples such as weekly/monthly seasonality or peak versus off-peak traffic make it difficult to define common trends. The pre-disruption levels depend on the circumstances of the transport system at the moment of disruption, and the calculation of resilience (as in EquationEquation 1
(1)
(1) ) is conditional on them.
The second issue relates to the recovery phase and the definition of “full recovery of service” (Q() in ), which seems challenging to determine when analysing empirical data. Should it be the same as the pre-disruption performance level depicted in ? Without a pre-set reference level, it may be difficult to determine
in , i.e. the time at which the event is totally overcome. The pre-disruption level is conditional on the state of the transport system at the moment before the shock and on its operational volatility, and not necessarily that state has to be reached again or be considered as the target point. In a dynamic and ever-changing world, performance metrics aiming to return to pre-disruption event performance may also seem to rely on an undesirable expectation.
We deem that investigating these methodological issues in future research is of utmost relevance to support the widespread adoption of the methodological framework and graphical representation of transport network resilience.
Additional research directions are proposed to further investigate transport network resilience and its existing challenges within empirical settings:
How can disruptive events be categorised for empirical analysis? There are several types of disruptions, and every type of disruption has his own impact on transport performance. provides evidence of this heterogeneity summarising the disruption types found in empirical studies. A first effort to categorise typologies has already been done by van Cranenburgh et al. (Citation2012), where substantial changes impacting mobility are grouped according to the graduality, or abruptiveness, of the change and their domain. Most of the paper we analysed belong to the “abrupt” class, except for climate change (Dawson et al., Citation2016; Ferranti et al., Citation2016; Sun et al., Citation2020) and long-term growth (Otuoze et al., Citation2021; Tang et al., Citation2020) related works. Starting from a similar framework, it may be useful to further categorise impacts on transport networks performance based on specific sub-types of abrupt changes and study how different shock conditions impact transport systems and their resilience attributes (e.g. speed of recovery). Previous works (Mattsson & Jenelius, Citation2015 Dawson & Marsden, Citation2019; Pan et al., Citation2021) have provided indications on different types of disruptions, but no categorisation has been made that may help support disruption-specific empirical frameworks of assessment.
How are different modes impacted by different types of disruptive events? One main limitation of this study is the lack of isolation of mode-specific and methodology-specific results. Spatial patterns and influencing factors are found transversally between different modes and methodologies used, mainly for simplification and clarity purposes. Only two of the reviews found in the literature (Bešinović, Citation2020; Sun & Wandelt, Citation2021) considered mode-specific resilience attributes, and there is generally little discussion on mode-specific requirements in methodology and differences in results. The same holds true for the mode class, and the different effects that disruptions may have on individual or collective modes. Therefore, there is room for future research to further study this aspect. Delving into the aspect of mode-specific, mode class-specific differences in the results and methodologies used in empirical analysis would provide additional knowledge to better understand mode-specific, mode class-specific – in combination with disruption-specific – resilience.
Is there a link between long-term increase in general well-being of societies (as measured by socio-economic indicators) and growth in transport resilience? The empirical results found in this study are contrasting, and further studies on this topic may help define a specific trend direction. Within our pool of studies, only few delved into these interconnections. Compiling a review following such research focus is expected to provide more insights into the influence that economic growth may have on transport resilience and vice versa. A similar survey may be relevant also from a return-on-investment perspective. Spatial disparities occur not only at the level of transport resilience but also in terms of resilience planning investments. Examining the complex relationships between economic growth, investments in resilience and the actual resilience levels (as assessed by empirical resilience studies), while considering their spatial variations, may be of significant interest to transport practitioners.
Multimodal networks have received limited investigation with real data and performance metrics (in our sample, only 5 eligible papers are related to multimodal networks), with many studies relying on topological metrics methodologies. The main barrier of multimodal networks’ real data resilience studies is that it requires data integration from different modes’ networks (e.g. metro and bus ridership data), a barrier that topological analysis do not encounter due to the static framework of their assessments (network links and nodes). Smart cards and other types of modes data integration are becoming more and more common (see, for example, tap data analysis by Auad et al., Citation2021), giving researchers a great opportunity to set up multimodal network frameworks of analysis. Given the increasing attention on multimodal networks’ resilience, as already noted by Zhou et al. (Citation2019), we recommend further empirical investigation to better understand the effects of disruptions and the redundancy dynamics within networks of networks.
Table 4. List of references by type of disruption.
7. Concluding remarks
Over the past few decades, the debate on transport network resilience has been extensive, with many literature review papers shedding light on different interpretations and metrics developed to describe and assess this concept numerically. However, there has been relatively less attention given by reviews to the use of real data for resilience assessment and related empirical results. This paper aims to bridge this gap by providing an overview of the main spatial patterns and influencing factors that have emerged from the empirical analysis of transport network resilience. By analysing non-simulated data applications, it was possible to test the transport resilience theoretical framework and draw future strands of research based on identified issues and inconsistencies.
We have identified spatial patterns (central/urban vs peripheral/rural; high vs low accessibility; distance decay (proximity) to closest alternative mode; different location of hazards) and influencing factors (redundancy; real-time information provision; institutional planning and management; climate change and intensity of disruptions; strengthening of infrastructure; congestion; increase in socio-economic indicators) that empirical research suggests to have a significant effect on transport network resilience. The empirical results are consistent with the 4R framework proposed by Bruneau et al. (Citation2003), which is often referenced in resilience studies. Both spatial patterns and influencing factors contribute to or negatively affect one or more of the four resilience attributes defined by the 4R framework. One key finding of this paper is that spatial patterns and influencing factors can have contradictory effects on ultimate resilience, contributing to or negatively affecting two or more attributes. Therefore, metrics that aggregate attributes should be preferred over single-attribute metrics.
While the empirical results align with the attribute-based categorisation of resilience, they only partially support the graphical pattern of resilience initially proposed by Bruneau et al. (Citation2003). Two main methodological issues arise when setting the pre-disruption reference performance (baseline) and post-disruption full recovery (target) points. In empirical studies, it is challenging to define these points based on clear common trends of pre-event performance. The starting and ending points of the disruptive event may not necessarily represent the 100% reference point, as they are conditional on the system's state at the moment of disruption, making it difficult to differentiate the effects of the disruption on performance from the operational volatility of performance itself. The paper highlights strengths and criticalities in transport network resilience from empirical studies, offering insights for practitioners and future directions for researcher. In particular, future studies should focus on developing a comprehensive typology of different perturbation effects and on classifying mode- and mode class-specific disruptions’ impacts on specific resilience attributes. Additionally, examining the link between economic growth and transport resilience and integrating multiple modes (multimodal network) in empirical assessments will contribute to our understanding and knowledge of the resilience of transport networks.
Fundings
This research did not receive any specific grant from funding agencies in the public, commercial, or not-for-profit sectors.
Acknowledgments
We are extremely thankful to Prof. Frank Witlox (Ghent University) for the insightful comments and feedback on the original draft and the subsequent revisions.
This paper was developed within the project funded by Next Generation EU – “GRINS – Growing Resilient, INclusive and Sustainable” project (PE0000018), Spoke 7, National Recovery and Resilience Plan (NRRP) – PE9 – Mission 4, Component C2, Intervention 1.3”. The authors acknowledge that the research is also part of the project “GAME: Green, smArt and Mobile urban communitiEs: promotion of inclusive, equitable and integrated social policies for human well-being in cities” funded by the Horizon Europe SEEDS (2022-2023) – University of Bari Aldo Moro.
Disclosure statement
No potential conflict of interest was reported by the author(s).
Notes
1 We acknowledge that both spatial patterns and influencing factors identified are not fully exhaustive in respect to what has been found in the entire transport resilience literature, but they represent a set of interesting results found in the pool of studies we considered.
2 A network is considered to have high infrastructural redundancy when there are numerous available paths that can be chosen to reach a destination.
3 Travel cost refers to the amount of families’ expenditures allocated to transportation (Fernandes et al., Citation2019), rail operator loss of profits (Janić, Citation2018) and cost of users passenger in terms of value of time (Janić, Citation2018; Safitri & Chikaraishi, Citation2022).
References
- Adler, M. W., & van Ommeren, J. N. (2016). Does public transit reduce car travel externalities? Quasi-natural experiments’ evidence from transit strikes. Journal of Urban Economics, 92, 106–119. https://doi.org/10.1016/j.jue.2016.01.001
- Auad, R., Dalmeijer, K., Riley, C., Santanam, T., Trasatti, A., Van Hentenryck, P., & Zhang, H. (2021). Resiliency of on-demand multimodal transit systems during a pandemic. Transportation Research Part C: Emerging Technologies, 133, 103418. https://doi.org/10.1016/j.trc.2021.103418
- Azolin, L. G., da Silva, A. N. R., & Pinto, N. (2020). Incorporating public transport in a methodology for assessing resilience in urban mobility. Transportation Research Part D: Transport and Environment, 85, 102386. https://doi.org/10.1016/j.trd.2020.102386
- Baroud, H., Barker, K., & Ramirez-Marquez, J. E. (2014). Importance measures for inland waterway network resilience. Transportation Research Part E: Logistics and Transportation Review, 62, 55–67. https://doi.org/10.1016/j.tre.2013.11.010
- Bergantino, A. S., Intini, M., & Tangari, L. (2021). Influencing factors for potential bike-sharing users: An empirical analysis during the COVID-19 pandemic. Research in Transportation Economics, 86, 101028. https://doi.org/10.1016/j.retrec.2020.101028
- Bešinović, N. (2020). Resilience in railway transport systems: A literature review and research agenda. Transport Reviews, 40(4), 457–478. https://doi.org/10.1080/01441647.2020.1728419
- Brazil, W., White, A., Nogal, M., Caulfield, B., O'Connor, A., & Morton, C. (2017). Weather and rail delays: Analysis of metropolitan rail in Dublin. Journal of Transport Geography, 59, 69–76. https://doi.org/10.1016/j.jtrangeo.2017.01.008
- Bruneau, M., Chang, S. E., Eguchi, R. T., Lee, G. C., O'Rourke, T. D., Reinhorn, A. M., Shinozuka, M., Tierney, K., Wallace, W. A., & Von Winterfeldt, D. (2003). A framework to quantitatively assess and enhance the seismic resilience of communities. Earthquake Spectra, 19(4), 733–752. https://doi.org/10.1193/1.1623497
- Büchel, B., Spanninger, T., & Corman, F. (2020). Empirical dynamics of railway delay propagation identified during the large-scale Rastatt disruption. Scientific Reports, 10(1), 1–13. https://doi.org/10.1038/s41598-020-75538-z
- Campisi, T., Basbas, S., Skoufas, A., Akgün, N., Ticali, D., & Tesoriere, G. (2020). The impact of COVID-19 pandemic on the resilience of sustainable mobility in Sicily. Sustainability, 12(21), 8829. https://doi.org/10.3390/su12218829
- Chang, S. E., & Nojima, N. (2001). Measuring post-disaster transportation system performance: The 1995 Kobe earthquake in comparative perspective. Transportation Research Part A: Policy and Practice, 35(6), 475–494. https://doi.org/10.1016/S0965-8564(00)00003-3
- Chen, Y., Fuellhart, K., Grubesic, T. H., Zhang, S., & Witlox, F. (2024). An analysis of the context factors influencing the diverse response of airports to COVID-19 using panel and group regression. Transportation Research Part A: Policy and Practice, 179, 103925. https://doi.org/10.1016/j.tra.2023.103925
- Chen, Z., & Wang, Y. (2019). Impacts of severe weather events on high-speed rail and aviation delays. Transportation Research Part D: Transport and Environment, 69, 168–183. https://doi.org/10.1016/j.trd.2019.01.030
- Cheng, L., Mi, Z., Coffman, D. M., Meng, J., Liu, D., & Chang, D. (2021). The role of bike sharing in promoting transport resilience. Networks and Spatial Economics, 1–19.
- Cox, A., Prager, F., & Rose, A. (2011). Transportation security and the role of resilience: A foundation for operational metrics. Transport Policy, 18(2), 307–317. https://doi.org/10.1016/j.tranpol.2010.09.004
- da Mata Martins, M. C., da Silva, A. N. R., & Pinto, N. (2019). An indicator-based methodology for assessing resilience in urban mobility. Transportation Research Part D: Transport and Environment, 77, 352–363. https://doi.org/10.1016/j.trd.2019.01.004
- Dawson, D., & Marsden, G. (2019). Disruption and resilience: New realities? Transport Matters, 303–326.
- Dawson, D., Shaw, J., & Gehrels, W. R. (2016). Sea-level rise impacts on transport infrastructure: The notorious case of the coastal railway line at Dawlish, England. Journal of Transport Geography, 51, 97–109. https://doi.org/10.1016/j.jtrangeo.2015.11.009
- de’ Donato, F., & Michelozzi, P. (2014). Climate change, extreme weather events and health effects. The Mediterranean Sea, 617–624. https://doi.org/10.1007/978-94-007-6704-1_38
- de Jong, G., & Lieshout, R. (2021). Disruption in the air: The impact of flight rerouting due to air traffic control strikes. Transportation Research Part D: Transport and Environment, 90, 102665. https://doi.org/10.1016/j.trd.2020.102665
- D’Lima, M., & Medda, F. (2015). A new measure of resilience: An application to the London Underground. Transportation Research Part A: Policy and Practice, 81, 35–46. https://doi.org/10.1016/j.tra.2015.05.017
- Donovan, B., & Work, D. B. (2017). Empirically quantifying city-scale transportation system resilience to extreme events. Transportation Research Part C: Emerging Technologies, 79, 333–346. https://doi.org/10.1016/j.trc.2017.03.002
- Fabella, V. M., & Szymczak, S. (2021). Resilience of railway transport to four types of natural hazards: An analysis of daily train volumes. Infrastructures, 6(12), 174. https://doi.org/10.3390/infrastructures6120174
- Fernandes, V. A., Rothfuss, R., Hochschild, V., Silva, M. A. V., Silva, W. R., Steiniger, S., & Santos, T. F. (2019). Urban resilience in the face of fossil fuel dependency: The case of Rio de Janeiro’s urban mobility. Urbe. Revista Brasileira de Gestão Urbana, 11), https://doi.org/10.1590/2175-3369.011.e20180160
- Ferranti, E., Chapman, L., Lowe, C., McCulloch, S., Jaroszweski, D., & Quinn, A. (2016). Heat-related failures on southeast England’s railway network: Insights and implications for heat risk management. Weather, Climate, and Society, 8(2), 177–191. https://doi.org/10.1175/WCAS-D-15-0068.1
- Fikar, C., Hirsch, P., Posset, M., & Gronalt, M. (2016). Impact of transalpine rail network disruptions: A study of the Brenner Pass. Journal of Transport Geography, 54, 122–131. https://doi.org/10.1016/j.jtrangeo.2016.05.018
- Fuller, D., Sahlqvist, S., Cummins, S., & Ogilvie, D. (2012). The impact of public transportation strikes on use of a bicycle share program in London: Interrupted time series design. Preventive Medicine, 54(1), 74–76. https://doi.org/10.1016/j.ypmed.2011.09.021
- Ganin, A. A., Kitsak, M., Marchese, D., Keisler, J. M., Seager, T., & Linkov, I. (2017). Resilience and efficiency in transportation networks. Science Advances, 3(12), e1701079. https://doi.org/10.1126/sciadv.1701079
- Ganin, A. A., Mersky, A. C., Jin, A. S., Kitsak, M., Keisler, J. M., & Linkov, I. (2019). Resilience in intelligent transportation systems (ITS). Transportation Research Part C: Emerging Technologies, 100, 318–329. https://doi.org/10.1016/j.trc.2019.01.014
- Gao, Y., & Wang, J. W. (2021). A resilience assessment framework for urban transportation systems. International Journal of Production Research, 59(7), 2177–2192. https://doi.org/10.1080/00207543.2020.1847339
- Gonçalves, L. A. P. J., & Ribeiro, P. J. G. (2020). Resilience of urban transportation systems. concept, characteristics, and methods. Journal of Transport Geography, 85, 102727. https://doi.org/10.1016/j.jtrangeo.2020.102727
- Gu, Y., Fu, X., Liu, Z., Xu, X., & Chen, A. (2020). Performance of transportation network under perturbations: Reliability, vulnerability, and resilience. Transportation Research Part E: Logistics and Transportation Review, 133, 101809. https://doi.org/10.1016/j.tre.2019.11.003
- Hara, Y., & Kuwahara, M. (2015). Traffic Monitoring immediately after a major natural disaster as revealed by probe data – A case in Ishinomaki after the Great East Japan Earthquake. Transportation Research Part A: Policy and Practice, 75, 1–15. https://doi.org/10.1016/j.tra.2015.03.002
- Janić, M. (2015). Reprint of “Modelling the resilience, friability and costs of an air transport network affected by a large-scale disruptive event”. Transportation Research Part A: Policy and Practice, 81, 77–92. https://doi.org/10.1016/j.tra.2015.07.012
- Janić, M. (2018). Modelling the resilience of rail passenger transport networks affected by large-scale disruptive events: The case of HSR (high speed rail). Transportation, 45(4), 1101–1137. https://doi.org/10.1007/s11116-018-9875-6
- Jaroszweski, D., Hooper, E., & Chapman, L. (2014). The impact of climate change on urban transport resilience in a changing world. Progress in Physical Geography: Earth and Environment, 38(4), 448–463. https://doi.org/10.1177/0309133314538741
- Jiang, R., Lu, Q. C., & Peng, Z. R. (2018). A station-based rail transit network vulnerability measure considering land use dependency. Journal of Transport Geography, 66, 10–18. https://doi.org/10.1016/j.jtrangeo.2017.09.009
- Jin, J. G., Tang, L. C., Sun, L., & Lee, D. H. (2014). Enhancing metro network resilience via localized integration with bus services. Transportation Research Part E: Logistics and Transportation Review, 63, 17–30. https://doi.org/10.1016/j.tre.2014.01.002
- Loo, B. P., & Leung, K. Y. (2017). Transport resilience: The occupy central movement in Hong Kong from another perspective. Transportation Research Part A: Policy and Practice, 106, 100–115. https://doi.org/10.1016/j.tra.2017.09.003
- Lu, Q. C. (2018). Modeling network resilience of rail transit under operational incidents. Transportation Research Part A: Policy and Practice, 117, 227–237. https://doi.org/10.1016/j.tra.2018.08.015
- Matisziw, T. C., Ritchey, M., & MacKenzie, R. (2020). Change of scene: The geographic dynamics of resilience to vehicular accidents. Networks and Spatial Economics, 1–20.
- Mattsson, L. G., & Jenelius, E. (2015). Vulnerability and resilience of transport systems – A discussion of recent research. Transportation Research Part A: Policy and Practice, 81, 16–34. https://doi.org/10.1016/j.tra.2015.06.002
- Mudigonda, S., Ozbay, K., & Bartin, B. (2019). Evaluating the resilience and recovery of public transit system using big data: Case study from New Jersey. Journal of Transportation Safety & Security, 11(5), 491–519. https://doi.org/10.1080/19439962.2018.1436105
- Niu, C., Zhang, T., Nair, D. J., Dixit, V., & Murray-Tuite, P. (2022). Link-level resilience analysis for real-world networks using crowd-sourced data. International Journal of Disaster Risk Reduction, 73, 102893. https://doi.org/10.1016/j.ijdrr.2022.102893
- Otuoze, S. H., Hunt, D. V., & Jefferson, I. (2021). Neural network approach to modelling transport system resilience for major cities: Case studies of Lagos and Kano (Nigeria). Sustainability, 13(3), 1371. https://doi.org/10.3390/su13031371
- Pan, S., Yan, H., He, J., & He, Z. (2021). Vulnerability and resilience of transportation systems: A recent literature review. Physica A: Statistical Mechanics and its Applications, 581, 126235. https://doi.org/10.1016/j.physa.2021.126235
- Poulin, C., & Kane, B. M. (2021). Infrastructure resilience curves: Performance measures and summary metrics. Reliability Engineering & System Safety, 216, 107926. https://doi.org/10.1016/j.ress.2021.107926
- Reggiani, A., Nijkamp, P., & Lanzi, D. (2015). Transport resilience and vulnerability: The role of connectivity. Transportation Research Part A: Policy and Practice, 81, 4–15. https://doi.org/10.1016/j.tra.2014.12.012
- Saberi, M., Ghamami, M., Gu, Y., Shojaei, M. H. S., & Fishman, E. (2018). Understanding the impacts of a public transit disruption on bicycle sharing mobility patterns: A case of Tube strike in London. Journal of Transport Geography, 66, 154–166. https://doi.org/10.1016/j.jtrangeo.2017.11.018
- Safitri, N. D., & Chikaraishi, M. (2022). Impact of transport network disruption on travel demand: A case study of the July 2018 heavy rain disaster in Japan. Asian Transport Studies, 8, 100057. https://doi.org/10.1016/j.eastsj.2022.100057
- Santos, L. J., Oliveira, A. V., & Aldrighi, D. M. (2021). Testing the differentiated impact of the COVID-19 pandemic on air travel demand considering social inclusion. Journal of Air Transport Management, 94, 102082. https://doi.org/10.1016/j.jairtraman.2021.102082
- Serulle, N. U., Heaslip, K., Brady, B., Louisell, W. C., & Collura, J. (2011). Resiliency of transportation network of Santo Domingo, Dominican Republic: Case study. Transportation Research Record: Journal of the Transportation Research Board, 2234(1), 22–30. https://doi.org/10.3141/2234-03
- Spyropoulou, I. (2020). Impact of public transport strikes on the road network: The case of Athens. Transportation Research Part A: Policy and Practice, 132, 651–665. https://doi.org/10.1016/j.tra.2019.12.022
- Stott, P. (2016). How climate change affects extreme weather events. Science, 352(6293), 1517–1518. https://doi.org/10.1126/science.aaf7271
- Sun, H., Wu, J., Wu, L., Yan, X., & Gao, Z. (2016). Estimating the influence of common disruptions on urban rail transit networks. Transportation Research Part A: Policy and Practice, 94, 62–75. https://doi.org/10.1016/j.tra.2016.09.006
- Sun, J., Chow, A. C., & Madanat, S. M. (2020). Multimodal transportation system protection against sea level rise. Transportation Research Part D: Transport and Environment, 88, 102568. https://doi.org/10.1016/j.trd.2020.102568
- Sun, X., & Wandelt, S. (2021). Robustness of Air transportation as complex networks: Systematic review of 15 years of research and outlook into the future. Sustainability, 13(11), 6446. https://doi.org/10.3390/su13116446
- Tang, J., Heinimann, H., Han, K., Luo, H., & Zhong, B. (2020). Evaluating resilience in urban transportation systems for sustainability: A systems-based Bayesian network model. Transportation Research Part C: Emerging Technologies, 121, 102840. https://doi.org/10.1016/j.trc.2020.102840
- Teixeira, J. F., & Lopes, M. (2020). The link between bike sharing and subway use during the COVID-19 pandemic: The case-study of New York's Citi Bike. Transportation Research Interdisciplinary Perspectives, 6, 100166. https://doi.org/10.1016/j.trip.2020.100166
- Tierney, K., & Bruneau, M. (2007). Conceptualizing and measuring resilience: A key to disaster loss reduction. TR news, (250).
- Tsapakis, I., Turner, J., Cheng, T., Heydecker, B. G., Emmonds, A., & Bolbol, A. (2012). Effects of tube strikes on journey times in transport network of London. Transportation Research Record: Journal of the Transportation Research Board, 2274(1), 84–92. https://doi.org/10.3141/2274-09
- van Cranenburgh, S., Chorus, C., & Van Wee, B. (2012). Substantial changes and their impact on mobility: A typology and an overview of the literature. Transport Reviews, 32(5), 569–597. https://doi.org/10.1080/01441647.2012.706836
- van Exel, N. J. A., & Rietveld, P. (2001). Public transport strikes and traveller behaviour. Transport Policy, 8(4), 237–246. https://doi.org/10.1016/S0967-070X(01)00022-1
- van Exel, N. J. A., & Rietveld, P. (2009). When strike comes to town … anticipated and actual behavioural reactions to a one-day, pre-announced, complete rail strike in The Netherlands. Transportation Research Part A: Policy and Practice, 43(5), 526–535. https://doi.org/10.1016/j.tra.2009.01.003
- Vickerman, R. (2021). Will Covid-19 put the public back in public transport? A UK perspective. Transport Policy, 103, 95–102. https://doi.org/10.1016/j.tranpol.2021.01.005
- Wan, C., Yang, Z., Zhang, D., Yan, X., & Fan, S. (2018). Resilience in transportation systems: A systematic review and future directions. Transport Reviews, 38(4), 479–498. https://doi.org/10.1080/01441647.2017.1383532
- Wang, H. W., Peng, Z. R., Wang, D., Meng, Y., Wu, T., Sun, W., & Lu, Q. C. (2020). Evaluation and prediction of transportation resilience under extreme weather events: A diffusion graph convolutional approach. Transportation Research Part C: Emerging Technologies, 115, 102619. https://doi.org/10.1016/j.trc.2020.102619
- Wang, Y., Zhan, J., Xu, X., Li, L., Chen, P., & Hansen, M. (2019). Measuring the resilience of an airport network. Chinese Journal of Aeronautics, 32(12), 2694–2705. https://doi.org/10.1016/j.cja.2019.08.023
- Woodburn, A. (2019). Rail network resilience and operational responsiveness during unplanned disruption: A rail freight case study. Journal of Transport Geography, 77, 59–69. https://doi.org/10.1016/j.jtrangeo.2019.04.006
- Yang, Y., Beecham, R., Heppenstall, A., Turner, A., & Comber, A. (2022). Understanding the impacts of public transit disruptions on bikeshare schemes and cycling behaviours using spatiotemporal and graph-based analysis: A case study of four London Tube strikes. Journal of Transport Geography, 98, 103255. https://doi.org/10.1016/j.jtrangeo.2021.103255
- Younes, H., Nasri, A., Baiocchi, G., & Zhang, L. (2019). How transit service closures influence bikesharing demand; lessons learned from SafeTrack project in Washington, D.C. metropolitan area. Journal of Transport Geography, 76, 83–92. https://doi.org/10.1016/j.jtrangeo.2019.03.004
- Zhang, J., Hayashi, Y., & Frank, L. D. (2021). COVID-19 and transport: Findings from a world-wide expert survey. Transport Policy, 103, 68–85. https://doi.org/10.1016/j.tranpol.2021.01.011
- Zhang, S., & Witlox, F. (2020). Analyzing the impact of different transport governance strategies on climate change. Sustainability, 12(1), 200. https://doi.org/10.3390/su12010200
- Zhou, L., & Chen, Z. (2020). Measuring the performance of airport resilience to severe weather events. Transportation Research Part D: Transport and Environment, 83, 102362. https://doi.org/10.1016/j.trd.2020.102362
- Zhou, Y., Wang, J., & Yang, H. (2019). Resilience of transportation systems: Concepts and comprehensive review. IEEE Transactions on Intelligent Transportation Systems, 20(12), 4262–4276. https://doi.org/10.1109/TITS.2018.2883766
- Zhu, Y., Ozbay, K., Xie, K., & Yang, H. (2016). Using big data to study resilience of taxi and subway trips for hurricanes Sandy and Irene. Transportation Research Record: Journal of the Transportation Research Board, 2599(1), 70–80. https://doi.org/10.3141/2599-09
- Zhu, Y., Xie, K., Ozbay, K., Zuo, F., & Yang, H. (2017). Data-driven spatial modeling for quantifying networkwide resilience in the aftermath of hurricanes Irene and Sandy. Transportation Research Record: Journal of the Transportation Research Board, 2604(1), 9–18. https://doi.org/10.3141/2604-02