?Mathematical formulae have been encoded as MathML and are displayed in this HTML version using MathJax in order to improve their display. Uncheck the box to turn MathJax off. This feature requires Javascript. Click on a formula to zoom.
ABSTRACT
Economic sanctions have the potential to affect environmental factors through various channels, including income reduction and constraints on accessing finance and environmentally friendly technologies. This study aims to simulate the energy and environmental consequences resulting from international sanctions in Iran. To achieve this, we develop a System Dynamics model integrating a spectrum of variables spanning economic, social, and environmental dimensions, for the period from 2008 to 2028. Our simulation outcomes indicate that by 2028, sanctions are anticipated to precipitate a notable upsurge in CO2 emissions, ranging from 12.5% to 30% compared to the baseline scenario. The magnitude of this escalation hinges on a variety of factors, including energy intensity and scenarios related to economic growth. According to our findings, prolonging international sanctions could be a major barrier to improving energy intensity and lowering CO2 emissions. Given the potential environmental consequences of sanctions, international communities, particularly sanctioning countries, should consider the environmental impacts of sanctions in their policy-making decisions in order to reduce emissions damage.
1. Introduction
In recent years, there has been a considerable resurgence in the global use of economic sanctions, which have historically been employed as a foreign policy tool targeting specific countries. Iran is among the most sanctioned countries by senders including the United States (US), European Union (EU), and United Nations (UN). Sanctions on Iran have caused or contributed to a wide range of negative macroeconomic outcomes, including rapid currency devaluation, severe trade and fiscal deficits, elevated inflation, and rising poverty rates.Footnote1 Sanctions can also affect CO2 emissions, through various channels, primarily by disrupting economic activity and hindering access to resources and technology necessary for sustainable development and emissions reduction (Hatipoglu, Soytas, and Belaïd Citation2023; Madani Citation2021). The Gross Domestic Product (GDP) per capita growth rates of Iran experienced significant declines during the years of sanctions, with figures of −5%, −2.9%, and −3.6% in 2012, 2013, and 2015, respectively, and −3.1% and −4.1% in 2018 and 2019. These lower economic growth rates have, in turn, constrained the capacity of states to enhance energy efficiency. For instance, the GDP per unit of energy use (measured in constant 2017 PPP $ per kg of oil equivalent), an indicator of energy efficiency, decreased from 5.60 in 2011 (before the onset of economic sanctions) to 4.90 in 2014. This decline illustrates the other side of increasing energy intensity in production: the amount of energy used (measured in kg of oil equivalent) per $1,000 of GDP (measured in constant 2017 PPP) surged from 178.3 in 2011 to 203.9 in 2014, the latest year covered by the World Bank (Citation2024).
While the economic consequences of the sanctions on Iran have been well-documented (for a recent survey see Farzanegan and Batmanghelidj Citation2023), the environmental impacts, which may contribute to social conflict (Farzanegan and Gholipour Citation2023), have received less attention in the empirical literature. The limited number of studies concerning the effects of sanctions on environmental indicators (with a focus on Iran) use a descriptive or time series analysis approaches (e.g. Fahimifard Citation2020; Fotourehchi Citation2020; Madani Citation2021; Saberpour, Akhavan Fard, and Masoud Citation2021) and while they provide helpful stylized facts, they do not account for causal loop diagrams, feedback, and dynamic structures among variables and across different policy scenarios.Footnote2
The environmental impact of sanctions can be substantial, specifically by constraining the importation of clean technologies. This can result in heightened pollution and violations of international environmental obligations that require providing financial, technical, and scientific support to the sanctioned country. Assessing the environmental impact of sanctions is a complex task that involves numerous variables that operate within a dynamic framework with different causal loop diagrams and feedback structures (Wu, Hao, and Ren Citation2020; Yang et al. Citation2021). Moreover, understanding the different effects of sanctions in the case of Iran can help policy-makers to better predict outcomes of economic sanctions in similar cases, reducing the unintended detrimental effects on critical areas like food and water access, as well as the health and environmental conditions of sanctioned countries (e.g. Khalid et al. Citation2024; Neuenkirch and Neumeier Citation2016; Sen, Al-Fasial, and Aisaleh Citation2013). This study investigates the environmental impacts of international sanctions by focusing on energy-related CO2 emissionsFootnote3 using system dynamics modelling (SD). We analyze the driving factors and different policy scenarios concerning energy-related carbon emissions in Iran under the imposed sanctions against its economy, addressing the following questions:
What are the future trends of carbon emissions in different economic sectors of Iran?
How will national-level energy consumption and CO2 emissions be affected under different scenarios of sanctions and economic growth in Iran?
Our study contributes to the literature in several ways, distinguishing itself from previous works that primarily rely on classical econometric approaches (e.g. Fotourehchi Citation2020). To the best of our knowledge, this is the first study to empirically simulate the interconnection between economic and environmental factors using system dynamics modelling to investigate the effects of sanctions. System dynamics (SD) modelling involves the use of causal loop diagrams, stock-and-flow diagrams, and mathematical equations to depict the interactions between components within a system. This method allows us to simulate and comprehend the behaviour of dynamic systems by capturing feedback loops, delays, and nonlinear relationships among variables; aspects that are challenging to explore within the time series framework (Ahmad et al. Citation2016; Yang et al. Citation2021). System dynamics has gained popularity as a method to comprehend policy issues and steer decision-making in various domains, including health, sustainability, and defense (Malbon and Parkhurst Citation2023). Our findings have the ability to enhance time series-based results by further exploring and developing scenarios related to sanctions. These insights can provide policy-makers with a more nuanced understanding of the potential effects arising from various sanction scenarios on environmental performance.
The design of the SD model in this study allows for identifying economic growth and energy intensityFootnote4 as the main factors influencing energy consumption and CO2 emissions (Yang et al. Citation2021). Our initial hypothesis suggests that while the imposition of sanctions may lead to disruptions and a slowdown in economic growth, it could concurrently contribute to an increase in energy-related CO2 emissions.
The remainder of the study is structured as follows: Section 2 provides a theoretical discussion and review of related literature on the sanctions-emission nexus. Section 3 outlines the data and methodology. Section 4 presents the results of the model analysis. Finally, Section 5 concludes and offers policy recommendations.
2. A background on sanctions imposed on Iran and expected environemtnal effects
2.1. A brief overview of recent economic sanctions on Iran
From 2006 to 2010, sanctions were levied against Iran due to its nuclear program. Notably, these sanctions excluded Iran’s crucial financial and economic sectors. In June 2010, the United Nations Security Council (UNSC) enacted further sanctions via Resolution 1929.Footnote5 This decision reflected concerns over Iran’s failure to comply with past resolutions. The resolution targeted Iran’s energy sector, setting the stage for subsequent energy-related sanctions. It acknowledged the importance of diverse and reliable energy access for sustainable growth, noting the potential link between Iran’s energy revenues and the funding of its nuclear activities.
A significant phase of sanctions on Iran started in 2011 when the European Union (EU) targeted the Iranian oil industry. Referring to the UNSC Resolution 1929, the EU stated that “the sale, supply or transfer to Iran of further key equipment and technology which could be used in key sectors in the oil and natural gas industry or, in the petrochemical industry, should be prohibited. Moreover, Member States should prohibit any new investment in the petrochemical sector in Iran”.Footnote6 Energy sanctions on Iran by the EU realized themselves in July 2022. EU imposed prohibitions on the import, purchase, and transport of Iranian crude oil. As a result, Iran lost 20% of the market for its oil exports (Farzanegan Citation2013).
Iranian oil embargo by the EU was associated with the US sanctions on the Central Bank of Iran which was implemented in Jan 2022, undermining the Iranian government to receive oil export revenues from its customers. Sanctions also targeted the insurance industry for Iranian oil cargo. In October 2012, the EU supplemented the energy sanctions with financial measures, barring all transactions – except those of a humanitarian nature – with Iranian banks (Farzanegan Citation2013). The economic sanctions reduced GDP per capita growth rate in Iran by about – 5% in 2012 (World Bank Citation2024).
The negative growth continued in the years 2013–2015 when Iran signed the Joint Comprehensive Plan of Action (JCPOA) with the P5 + 1 (the five permanent members of the United Nations Security Council – China, France, Russia, the United Kingdom, United States – plus Germany). Sanctions on Iran related to its nuclear activities were lifted on Jan 2016, resulting in a temporary economic boom by 2017.
In 2018, with the implementation of the “maximum pressure campaign” by the US, Iran’s economy was encumbered by the re-imposition of economic sanctions. One of the key goals of the campaign was to bring Iran’s oil exports to zero.Footnote7 The maximum pressure campaign negatively affected the Iranian economy and income per capita growth reduced by −3% and −4% in 2018 and 2019, respectively (World Bank Citation2024).
These sanctions did not stop Iranian oil exports. The recent data shows that Iran is exporting 1.5 million barrels per day, mainly to China (Natter and Dlouhy Citation2024). However, sanctions have imposed significant transaction costs. Iran is offering discounts on its exported oil (Aizhu and Xu Citation2023) and uses shadow channels for its oil exports to China (Donovan and Nikoladze Citation2024). Distortions of sanctions have affected different sectors of the Iranian economy, resulting in higher inflation and poverty, hindering the attention and capacity of the government to focus on environmental concerns. Under economic sanctions and lower welfare, individuals also engage much less in environemtnal organizations. For example, according to the Wave 7 of World Value Survey conducted in 2020, more than 87% of respondentns in Iran declare a lack of active or altogether inactive membership in environemtnal organizations.Footnote8
The economic strain caused by the sanctions diminished Iran’s capacity and inclination to adopt sustainable policies and overhaul its polluting industries. Additionally, the sanctions hindered Iran’s access to grants for environmental initiatives from global funding bodies like the Global Environment Facility, an arm of the World Bank (Bartlett and Hakim Citation2021).
2.2. Why do sanctions matter for environemtnal performance?
Economic sanctions can contribute to environmental degradation through various channels. Some well-established consequences of sanctions are a decreases in income levels and the slowdown in economic growth. The detrimental impact of sanctions on economic modernization may impede efforts to enhance environmental quality and delay the attainment of the necessary development levels to reduce environmental damages, as discussed in the literature on the environmental Kuznets curve (Balali, Zamani-Dadandeh, and Yousofi Citation2013; Farzanegan and Markwardt Citation2018).
Not only is the development of the formal economy affected by sanctions, but the informal economy is also impacted. Farzanegan (Citation2013) explains various mechanisms through which sanctions may contribute to the expansion of the shadow economy in Iran. The growth of the shadow economy results in increased pollution. In a theoretical and empirical study, Biswas, Farzanegan, and Thum (Citation2023) demonstrate that higher levels of the shadow economy lead to more pollution and that this relationship becomes even stronger in the presence of public corruption.
Firms operating in the shadow economy are unregistered and are under little to no government oversight. Consequently, imposing environmental standards on them becomes challenging. Additionally, due to their unregistered nature, these firms lack access to banking credit and other formal funding sources for investment in environmentally-friendly technologies, leading to the use of outdated means of production and emissions-intensive inputs. Sanctions distort various markets, including the currency market, providing lucrative rent-seeking opportunities which foster illicit trade and corruption. These factors, in turn, make environmental protection more challenging.
The imperative to address sanctions may result in the lower prioritization of environmental and natural resource management on the public policy agenda of sanctioned states. Consequently, this shift can diminish the attention and resources allocated to environmental protection (Khalid et al. Citation2024). In a study by Cheratian, Goltabar, and Farzanegan (Citation2023), the response of Iranian businesses to sanctions and their chosen strategies to counteract these effects are examined. It is revealed that one such strategy involves reducing research and development (R&D) expenditures, potentially impairing the efficiency of energy consumption. This, in turn, could lead to higher energy intensity in production and increased pollution.
Hatipoglu, Soytas, and Belaïd (Citation2023) report that by restricting a targeted state’s access to capital and energy sources, sanctions pose as the main obstacles to achieving sustainable energy systems, exacerbating emissions challenges. Also, the adverse global effects of carbon-intensive energy choices resulting from sanctions not only disrupt regional energy transitions but also hinder international efforts to reduce emissions (Khalid et al. Citation2024).
Despite increasing concerns about the impact of rising CO2 concentrations on climate change, fossil fuels continue to be a major contributor to emissions (Hosseini et al. Citation2019). Iran ranks eighth in the world in terms of total CO2 emissions, producing 0.7 billion tons in 2019, and twelfth in per capita CO2 emissions at 8.5 tons (Olivier and Peters Citation2020; see and in Appendix A). Iran’s high consumption of non-renewable energy sources is driven by several factors, including abundant fossil fuel reserves, population growth, reliance on fossil fuel power plants for electricity generation, and energy subsidies (Hosseini et al. Citation2019). The abundance of cheap non-renewable energy makes it cost-effective to use these resources. As a result, most electricity for economic enterprises, such as industry, agriculture, and services is generated by fossil fuel power plants (Pourkiaei et al. Citation2021). This close relationship between economic growth and fossil fuel consumption has been further exacerbated by international sanctions, which restrict the import of environmentally-friendly technologies and block international aid for environmental purposes (Fahimifard Citation2020; Jabari et al. Citation2024; Madani Citation2020; Madani Citation2021; Mostafavi, Ghaemi Asl, and Hoseini Citation2014; Saberpour, Akhavan Fard, and Masoud Citation2021). These sanctions have increased energy intensity and caused economic production to be more expensive due to its environmental impact in Iran. To alleviate the negative effects of declining welfare caused by sanctions, the Iranian government continues to provide energy subsidies, which in turn leads to increased energy consumption over time. While the share of fossil-fuel subsidies in the GDP was about 6% in 2016 (when sanctions were lifted and the JCPOA was implemented), it increased to 20% in 2019 following the re-imposition of sanctions by the Trump administration. While this increase could be driven by a decrease in the GDP under sanctions, the fossil fuel subsidies per capita also shows a similar increase from 340 USD in 2016 to more than 1000 USD in 2019.Footnote9
Due to increasing concerns about global warming and climate change, countries have taken steps to control greenhouse gas emissions (Labzovskii et al. Citation2019; Ye et al. Citation2021). These efforts have been implemented internationally through the ratification of the Kyoto Protocol and Paris Agreement, which aim to reduce greenhouse gas emissions (Fletcher and Smith Citation2024; Radmehr, Rastegari Henneberry, and Shayanmehr Citation2021). In addition, they have been implemented domestically through measures such as sustainable economic growth planning, the promotion of renewable energy sources to reduce fossil fuel consumption, the improvement of efficiency and standards in the transport sector (Ding and Liu Citation2023; Lee Citation2019), and the implementation of emissions taxes (Balali, Khaledian, and Sam Deliri Citation2018). However, economic sanctions have led to a recession in Iran, hindering the country’s ability to fulfill its obligations under the Paris Agreement to reduce CO2 emissions. This is because implementing these measures would exacerbate the economic recession and face opposition from within the country (Hosseini et al. Citation2019). Data from the World Bank also shows a trend of deteriorating energy intensity in Iran from 2000 to 2020, influenced by the sanctions (see in Appendix A).
Sanctions have placed restrictions on Iran’s access to foreign investment, new technologies, and services, and have also blocked international aid and frozen Iranian foreign assets, thereby impacting various sectors of Iran’s economy over the past few decades (Fotourehchi Citation2020; Madani Citation2021).
3. Data and methodology
3.1. Model description
The research hypothesis is that sanctions, while disrupting and slowing economic growth, lead to an increase in energy-related CO2 emissions. To test this hypothesis, we use a system dynamics (SD) model. The model is based on the Kaya identityFootnote10 and considers the economic sectors based on whether energy is used as an input or final product and whether it is deemed to be productive or non-productive (Riemer et al. Citation2023; Robalino-López et al. Citation2015; Yang, Ma, and Li Citation2020). In order to align with the classification used on the energy balance sheet of Iran’s Energy Ministry, and for compatibility with the Central Bank of Iran (CBI) and the Statistical Center of Iran (SCI), the economic sectors in Iran that emit CO2 were categorized as industry, agriculture, services, household, power plants, refinery plants, and transportation.
In this model, the industry, agriculture, services, power plant, and refinery plant sectors contribute to economic value and are considered productive. However, household energy consumption, which largely goes towards meeting basic needs rather than generating economic value (Cui, Xia, and Hao Citation2019; Yang et al. Citation2021), is considered as a non-productive sector.
The portion of transportation activities that contribute to economic value is included in the services sector, while the portion related to household activities is treated as non-productive. International sanctions are treated as an exogenous variable that directly affects the model’s key variables. It is assumed that sanctions on Iran’s economy, through limiting oil exports, reducing foreign investment, and restricting access to technology (Fahimifard Citation2020; Madani Citation2021; Roudari et al. Citation2023; Saberpour, Akhavan Fard, and Masoud Citation2021), directly impact two key variables. These are economic growth (GR), defined as changes in the GDP, and the energy intensity (θ) of productive economic sectors, which in turn affects energy consumption and CO2 emissions (). While GDP growth rate and energy intensity are the main factors directly affecting the energy consumption of productive economic sectors (), the non-productive sector’s energy consumption (
) additionally depends on population (POP), family size (FS), and the number of household vehicles (V). As mentioned, energy-related CO2 emissions of each sector are directly affected by its energy consumption and CO2 emissions coefficient
().
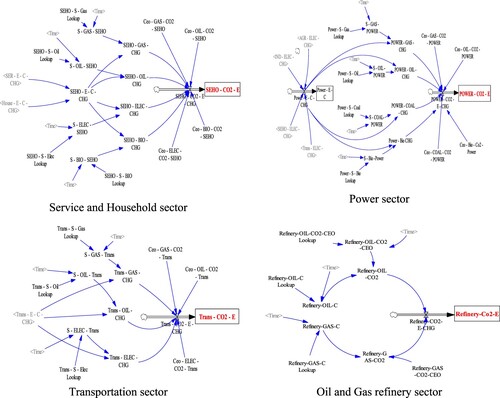
Figure 1. Stock-flow diagram of the productive economic-energy subsystem.
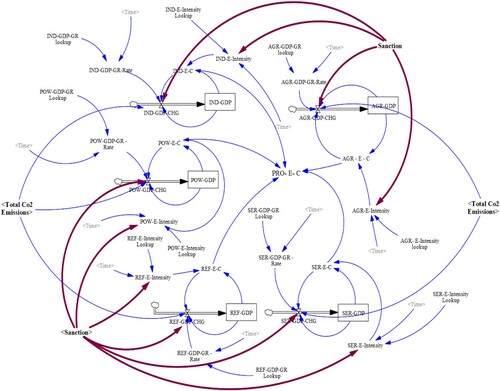
Table 1. Variable description in the mathematical model.
Various types of energy, including oil, gas, coal, electricity, biomass, and others, are used in the productive and non-productive sectors of Iran, but only those that emit CO2 are included in this model. The emissions coefficients for each type of energy used in different sectors vary in this model and are based on data from Iran’s Energy Balance Sheet. describes all variables and parameters of the model.
3.2. Mathematical model
This section outlines the main dynamic equations of the model. As shown in Equation (1), total energy consumption is calculated by summing the energy consumption of both the productive and non-productive sectors. The energy intensity of each sector is calculated by dividing the sector’s final energy consumption by its GDP and is defined as the energy consumption per unit of economic value added. In this model, the energy consumption of the transportation and household sectors is a function of population, but the former is also influenced by the number of vehicles per capita and the average energy consumption per vehicle (Equation 5). The latter is defined as a function of population net growth, family size, and energy consumption per household (Equation 6).
Equations (1) through (7) constitute our core model, which comprehensively describes the economic structure of Iran, encompassing energy consumption and CO2 emissions. These equations are formulated based on Iran’s energy balance sheet and designed to ensure compatibility with the standards set by the Central Bank of Iran (CBI) and the Statistical Center of Iran (SCI).
Equation (7) specifically describes the relationship between the equations and CO2 emissions. In this equation, the total CO2 emissions from both productive and non-productive activities (TCO2) are dependent on the CO2 emissions intensity for each fuel type, emissions produced by each fuel type in each sector (), energy consumption of that fuel in that sector (
),energy mix structure (S), energy consumption in productive economic sectors (
), and CO2 emissions intensity (δ).
(1)
(1)
(2)
(2)
(3)
(3)
(4)
(4)
(5)
(5)
(6)
(6)
(7)
(7)
3.3. System dynamics (SD) model
System dynamics (SD) is a simulation technique that is widely used in decision making, policy planning, and evaluation (Armenia et al. Citation2023; Dong et al. Citation2012; Kunche and Mielczarek Citation2021). It allows for the examination of causal relationships and dynamic changes between various elements in a complex system (Dong et al. Citation2018; Eidin et al. Citation2024; Yang et al. Citation2021). By employing SD, it becomes possible to model complex systems that exhibit a high degree of interconnection, feedback, and interaction among their variables or components (Jokar and Mokhtar Citation2018). Originally developed in 1950 by Jay W. Forrester for corporate managers seeking to understand industrial processes (Ansari and Seifi Citation2013), SD has since found successful applications in various socio-economic studies across several domains (Anand, Vrat, and Dahiya Citation2006; Ansari and Seifi Citation2012; Ford Citation2009; Jokar and Mokhtar Citation2018).
The environmental impacts of economic policies, including carbon emissions, present a highly intricate challenge due to the nonlinear relationships among the variables within the system. To tackle this complexity, the field of system dynamics (SD) offers an approach that enables us to comprehend the nonlinear behaviour of complex systems over time. SD incorporates elements such as stocks, flows, internal feedback loops, table functions, and time delays.
SD extensively employs cause-and-effect relationships and feedback systems, which help identify complex behavioural patterns over time and allow for the study of long-term unanticipated consequences and policy resistance (Kunche and Mielczarek Citation2021). The modelling process for SD begins with defining the object, specifying the system boundary, and constructing the causal chains of factors in the system (Ahmad et al. Citation2016; Yang et al. Citation2020). We simulate the potential national-level impacts of Iran’s sanctions and economic growth on energy consumption and CO2 emissions and forecast future carbon emissions trends in various economic sectors of Iran.
We employ a system dynamics model that considers various economic, social, and environmental factors and their interrelationships. This model consists of three subsystems: the Productive Economic-Energy Subsystem (PEES), the Social-Non-Productive Economic-Energy Subsystem (SNEES), and the Energy-Emission Subsystem (EES). We use the variables listed in to create stock-flow diagrams and mathematical equations that describe the interactions between these subsystems.
3.3.1. Productive economic-energy subsystem (PEES)
GDP has been identified as a main factor in the relationship between energy consumption and CO2 emissions in various studies (Ahmad et al. Citation2016; Kunche and Mielczarek Citation2021; Li et al. Citation2023; Liu et al. Citation2015; Proano et al. Citation2020; Yang et al. Citation2021; Ye et al. Citation2021). It is well established that energy consumption and economic growth are closely linked, with a strong positive correlation between total economic output and energy consumption (Li et al. Citation2020; Saqib Citation2021; Wu, Peng, and Wang Citation2020).
The Productive Economic-Energy Subsystem (PEES) in our model illustrates the relationship between the economic growth of productive sectors and their energy consumption. This subsystem includes the GDP of the productive economic sectors in Iran, including agricultural domestic production (AGR-GDP), industry domestic production (IND-GDP), service domestic production (SER-GDP), power plants GDP (POW-GDP), and the refinery sector GDP (REF-GDP). CO2 emissions in this subsystem are generated by economic activities that create added value.
Energy intensity is an indicator used to measure energy efficiency at the national level and it is calculated by dividing energy consumption (either final or primary) by GDP. This measure is often referred to as “energy consumption per added value” (Ebrahimi and Pilevar Citation2021; Iran Energy Balance Citation2017; Rahmani et al. Citation2020; Wu, Hao, and Ren Citation2020; Yang et al. Citation2021). In our model, the energy intensity of each economic sector is represented by the following indices: AGR-E-Intensity (agriculture), IND-E-Intensity (industry), SER-E-Intensity (services), POW-E-Intensity (power plants), and REF-E-Intensity (refinery). Sanctions, which are external factors that influence the economic growth rate and energy intensity of productive sectors, also affect energy consumption and CO2 emissions ().
3.3.2. Social-non-productive economic-energy subsystem (SNEES)
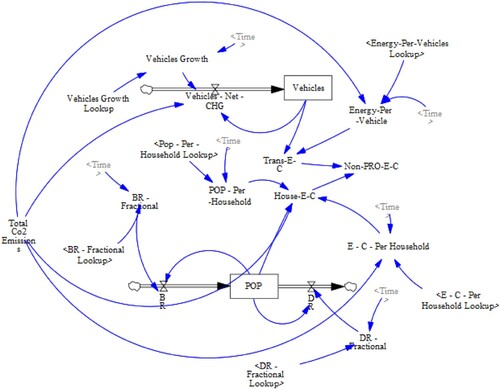
Non-productive economic emissions are largely due to providing basic guarantees for livelihoods that do not create economic value (Cui, Xia, and Hao Citation2019; Yang et al. Citation2021). In this sector, increasing energy consumption is related to the growing population, per capita consumption, and changing consumer needs, behaviour, and lifestyles (Rahmani et al. Citation2020; Satterthwaite Citation2009). The CO2 emissions of this sector, which include household and transportation, are influenced by factors such as population size, family size, number of vehicles, and energy consumption patterns (Cui, Xia, and Hao Citation2019). Within this sector, household energy consumption (House-E-C) is determined by variables such as population (POP), average household size (POP-per-household), and energy consumption per household (E-C-per-household). Meanwhile, the energy consumption of the transportation sector is largely influenced by the number of vehicles and energy usage per vehicle. As shown in , population size and the number of vehicles are considered stock variables, while birth rate (BR), death rate (DR), and vehicle net change (Vehicle – Net – CHG) are considered flow variables.
Figure 2. Stock-flow diagram of social-non-productive economic-energy subsystem.
3.3.3. Energy – emission subsystem (EES)
Energy availability has long been a major focus of political discussions worldwide due to its role in driving economic growth. However, it is also an important contributor to global climate change and CO2 emissions (Rahmani et al. Citation2020).
According to a report from Iran’s energy ministry in 2017, there are six main sources of CO2 emissions in the country: industry, agriculture, service & household, oil, gas refinery, transportation, and power plants (Iran Energy Balance Citation2017). These sectors and the factors that influence their emissions are depicted in EES (). Essentially, this subsystem represents the connection between the economic and social components and the environment in the overall system, with factors such as GDP growth in economic sectors, population growth, and vehicle growth linked to carbon emissions.
Figure 3. Causal loop diagram of CO2 emissions of different sectors.
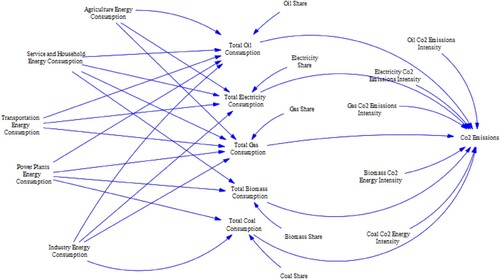
In the model, energy consumption in the service and household sectors are combined and represented as SEHO-E-C ( in Appendix B).Footnote11 The variables for cumulative CO2 emissions in these sectors are considered stock variables, including AGR-CO2-E, IND-CO2-E, SEHO-CO2-E, Power-CO2-E, TRANS-CO2-E, and Refinery-CO2-E, while their annual changes in CO2 emissions are considered flow variables. In this study, the total annual and cumulative carbon emissions from energy consumption are calculated by summing the CO2 emissions from these sectors and are represented as the flow and stock variables Total-CO2-E-CHG and Total-CO2-E, respectively ( in Appendix B). The energy-CO2 emissions subsystem in Iran’s carbon emissions system includes driving factors such as energy type (Oil, Gas, Electricity, Coal, and Biomass), CO2 emissions intensity for all types of energy, and the share of each type of energy from total energy consumption ().
3.4. Data collection
To examine the impact of various international sanction scenarios on energy consumption and CO2 emissions in Iran, we use an SD model and industrial strength simulation software (Vensim). This analysis focuses on examining key factors, including energy intensity, fuel composition, and fuel-specific emissions coefficients from 2008 to 2028. The data for this study are primarily obtained from the Statistical Center of Iran (SCI Citation2021), Iran’s annual energy balance sheet published by the Ministry of Energy (Iran Energy Balance Citation2017), and the Central Bank of Iran (CBI Citation2021), with 2008 serving as the base year.Footnote12
3.5. Model validation
Model validation is a crucial aspect of system dynamics modelling that ensures the validity of the model’s results (Barlas Citation1996) and establishes trust in the model’s usefulness for its intended purposes (Atamer Balkan et al. Citation2021; Barlas Citation1996). Model validation is an ongoing process that occurs throughout the model conceptualization, construction, and communication stages (Forrester and Senge Citation1980). Structural assessment and boundary adequacy tests are used in this study to assess the endogeneity and homogeneity of each variable and the compatibility of the model’s relationships with existing knowledge about economic growth, energy consumption, and CO2 emissions. The SD model’s ability to reproduce historical data is also evaluated using standard indicators. The Mean Absolute Percentage Error (MAPE) between actual data and simulated values of key variables from 2008 to 2020 is used to measure the validity of the SD model (). The results show a high degree of similarity between the simulated values and the actual values, with relative errors of no more than 5% (in some cases, no more than 1%, with a maximum deviation of 4.42%). These results demonstrate that the model performs well in both simulation and prediction ().
Table 2. Validity of the SD model.
3.6. Scenarios design
To facilitate the comparison of our scenario, it is essential to establish a counterfactual trend or a baseline scenario. This baseline scenario illustrates a situation in which no socio-technical constraints are applied to mitigate CO2 emissions and no sanctions are imposed – referred to as “business as usual.” In this context, the existing conditions of economic growth, energy consumption, and CO2 emissions are considered to define the baseline. It is important to note that the baseline reflects a scenario without the imposition of sanctions.
Drawing from the literature above, we identify two pivotal factors that mainly impact CO2 emissions and the formulation of mitigation policies: economic growth and energy intensity. These factors are notably influenced by international economic sanctions (Fahimifard Citation2020; Madani Citation2020; Madani Citation2021; Mostafavi, Ghaemi Asl, and Hoseini Citation2014; Proano et al. Citation2020; Saberpour, Akhavan Fard, and Masoud Citation2021; Yang et al. Citation2021). Thus, in the next step, we identify six scenarios, each contingent on distinct assumptions regarding sanctions and economic growth. Conversely, international economic sanctions stand as a primary factor influencing Iran’s economic growth, alongside variations in energy intensity across different economic sectors. Previous periods of sanctions in Iran form the basis for the various scenarios scrutinized in this study. Hence, we examine three phases of Iran’s economic growth: before the JCPOA (2008–2015), during the implementation of the agreement (2016–2017), and following the reinstatement and intensification of sanctions (2018–2020), in conjunction with two patterns of energy intensity change. Based on the results of sensitivity analysis, model validation, and the current classification of economic growth, seven policy scenarios are identified within these three phases, as shown in .
Table 3. Definitions of different scenarios.
We acknowledge an important distinction in our analysis between the sanctions before 2016 and those imposed post-2018. The first scenario captures the effect of sanctions in a context where they do not impact energy intensity. It is important to highlight that the scenarios are computed based on real data sourced from the World Bank (Citation2021). In Scenario 2, representing the pre-2016 sanctions period, we calculate average annual growth rates in various sectors as follows: agriculture (AGR) = 3.43%, industry (IND) = 4.29%, and services (SER) = 3.78%. Additionally, the average annual change in energy intensity across all sectors is recorded at 2.3%. In contrast, in Scenario 6, which corresponds to the post-2018 sanctions period, we note different average annual growth rates in the sectors: agriculture (AGR) = 4.12%, industry (IND) = 1.68%, and services (SER) = −0.25%. Moreover, the average annual change in energy intensity across all sectors is higher, at 7.96%. Consequently, our study aims to account for the actual impact of sanctions during the analyzed period and acknowledges the disparity between the two aforementioned periods of sanctions.
4. Results and discussion
4.1 Analysis of the baseline scenario and the current status of CO2 emissions
After validating the model, time series data for the relevant variables covering the period 2008–2020 are incorporated into the model. Using historical data, a baseline scenario is established to simulate and predict the trajectory of energy consumption and CO2 emissions by 2028. The results from the baseline scenario, where no sanctions were applied (illustrated in and ) suggest that, considering the current conditions of economic growth and energy intensity across different economic sectors, both energy consumption and CO2 emissions are anticipated to increase at an accelerating rate. Energy intensity, a metric used to evaluate the energy consumption of specific economic activities or sectors, has fluctuated in Iran over the past two decades, generally demonstrating an upward trend (World Bank Citation2021). According to the literature, sanctions have played a role in contributing to this trend (Madani Citation2021). The baseline scenario anticipates a rise in CO2 emissions across all economic sectors by 2028, without any indication of a declining trend in emissions for any sector (see ). Although the cumulative amount of CO2 emissions over time is greater in the power plant sector compared to other sectors, transportation is expected to exhibit a higher annual emission rate.
Figure 4. Cumulative (upper panel) and annual (lower panel) CO2 emissions by different sectors in the base scenario.
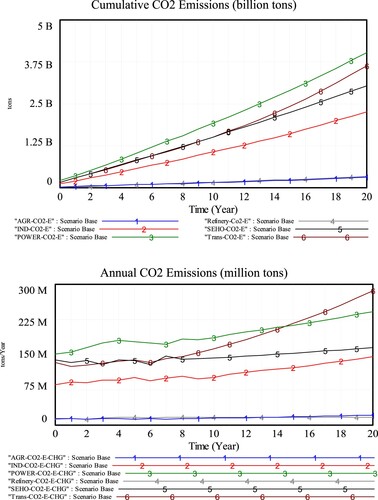
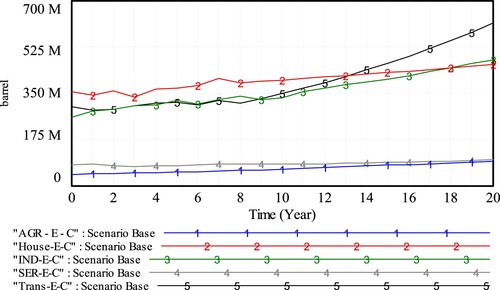
Figure 5. Energy consumption by different sectors in the base scenario.
In the baseline scenario, economic growth persists without any policy restrictions on CO2 emissions. Considering Iran’s main oil resources and reliance on fossil fuels, the baseline scenario foresees a sustained upward trajectory in annual CO2 emissions. By 2028, it is anticipated that these emissions will reach 872 million tons per year (, right panel), underscoring the necessity for the implementation of policies designed to restrict emissions and mitigate the ongoing rise in CO2 emissions.
depicts the trend of energy consumption in various economic sectors from 2008 to 2028. As per the baseline scenario, sustained economic growth coincides with a rise in energy consumption across all sectors. The model outcomes additionally suggest that energy consumption within both the industry and transportation subsectors experience accelerating rates of increase in the forthcoming years, surpassing that of the household sector. The services, agriculture, and household sectors exhibit a gradual rise in energy consumption over time. Consequently, for the development of policies targeting enhanced energy efficiency, prioritizing the industry and transportation sectors in environmental and energy policy initiatives is crucial. These results also indicate that the total annual energy consumption across various economic sectors in 2028 (year 20 in ) is projected to reach 1905 million barrel of oil equivalent (MMBOE) under the baseline scenario. This indicates a growing trend in energy consumption. An expected development is a gradual decrease in the proportion of fossil energy, influenced by declining reserves and increasing extraction costs. Nevertheless, in the absence of meticulous energy policies and emission constraints, both fossil energy consumption and CO2 emissions in Iran are projected to steadily increase from 2008 to 2028.
4.2. Policy scenario analysis and the impacts of sanctions on CO2 emissions
To effectively compare the national-level impacts of energy consumption and CO2 emissions under various sanctions scenarios, Iran’s economy and its indicators are segmented into three periods: pre-JCPOA agreement, the JCPOA agreement suspension period (JCPOA), and the period of heightened economic sanctions (post-JCPOA) (see ). Using sensitivity analysis based on the SD model and the factors affecting energy consumption and CO2 emissions, these two variables are simulated by designing six scenarios for post-2020. The outcomes of the sensitivity analysis for the entire economy are illustrated in .
Figure 6. Total annual CO2 emissions (upper panel) and total energy consumption (lower panel) in Iran under different scenarios.
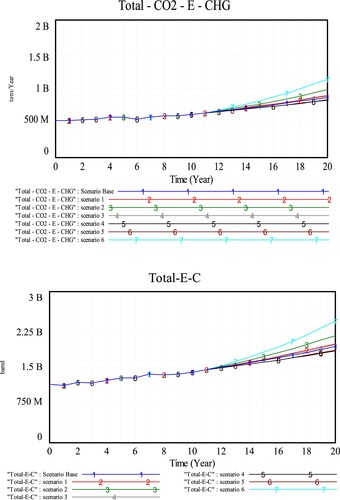
As mentioned above, the first scenario reflects the impact of energy intensity observed during the pre-JCPOA period. In this sense, the gap between Scenarios 1 and 2 can be explained by the effects of energy intensity on both energy consumption and, consequently, CO2 emissions. The results demonstrate that in Scenario 2, which involves economic sanctions prior to the JCPOA, with an annual energy intensity increase of 2.3%, the projected annual CO2 emissions are expected to reach 981 million tons in 2028 (year 20). This represents a 12.5% increase compared to the base scenario. Additionally, in Scenario 4, there is a projected reduction of over 4.5% in total fossil fuel energy consumption and over 5% in CO2 emissions in 2028, compared to the baseline scenario. The evident outcome is that the partial lifting and suspension of sanctions post-JCPOA, facilitated by increased access to new technologies and a rise in GDP, leads to improved energy intensity in economic activities. As a result, this mitigates CO2 emissions. In this instance, annual CO2 emissions under scenario 5 could decrease by 4.4% compared to the baseline. Moreover, the findings reveal that under Scenario 6, where international economic sanctions against Iran have been reinstated and intensified, annual CO2 emissions in 2028 increases substantially (around 30% compared to the baseline). Given the conditions of the sanctions, the government will try to maintain energy subsidies to reduce household living and firm production costs.
As shows, Scenario 6 (conditions indicating the continuation of economic sanctions) exhibits the highest annual CO2 emissions, reaching 1,135 million tons in 2028, attributed to the worsening of energy intensity. By contrast, Scenario 4, which corresponds to JCPOA agreement with the highest economic growth rate, shows a reduction in CO2 emissions. This result demonstrates that despite the positive relationship between economic growth and CO2 emissions, the post-JCPOA increase in economic growth – attributed to upgrades in firm equipment and subsequent enhancements in energy intensity – leads to a decrease in CO2 emissions. Emissions and energy consumption by economic sectors under different scenarios are shown in .
Figure 7. CO2 emissions and energy consumption by various economic sectors under different scenarios.
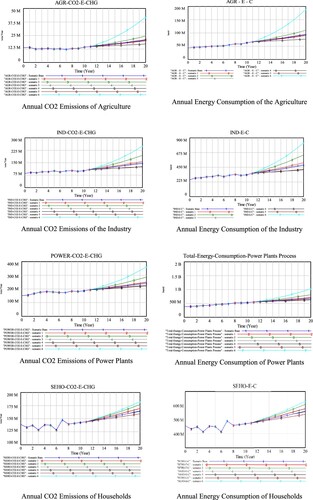
Simulation results show that the agriculture sector is expected to have the lowest CO2 emissions in 2028 among all economic sectors. However, the effects of sanctions on CO2 emissions varies among the different scenarios. In Scenario 1, under the pre-JCPOA period, there is a notable increase in CO2 emissions and energy consumption, primarily confined to the household and industrial sectors. This trend could be explained by factors such as changes in production processes, increased demand for household energy, and industrial expansion during that time. In Scenario 2, also before the JCPOA, annual CO2 emissions in the agriculture sector are projected to be 24.2 million tons in 2028. In Scenario 3, during the JCPOA, CO2 emissions and energy consumption do not exhibit significant increases compared to the baseline. Scenario 4, which is also under the JCPOA and has lower energy intensity, reduces emissions to 16.9 million tons. We note an opposite pattern in Scenario 5, where sanctions are re-imposed. On the other hand, in Scenario 6, characterized by the most stringent sanctions and increased energy intensity, there is a 147% increase in CO2 emissions from 2008 to 2028, reaching 41.8 million tons in the agriculture sector.
The industry sector shows a similar trend in CO2 emissions under the different scenarios. In Scenarios 1 and 2, emissions in this sector are estimated to be 157 and 193 million tons at the end of the simulation period, respectively. These emissions decrease to 149 and 124 million tons in Scenarios 3 and 4, respectively, where the sanctions are lifted. However, the re-establishment and intensification of sanctions in Scenario 6 results in more than 249 million tons of carbon dioxide emissions in the industry sector, a 100% increase. Scenario 4 has the lowest CO2 emissions among all scenarios.
In the power sector Scenario 6 has the highest CO2 emissions, which reached 360 million tons in 2028. In all scenarios, energy consumption in the power sector by the end of 2028 varies between 620 and 1020 MMBOE. Notably, the industrial sector, recognized for its high energy intensity, records energy consumption below 600 MMBOE in all scenarios except Scenario 6. This deviation is attributed to the substantial proportion of fossil-based electricity in Iran. Transitioning to renewable energy sources in the electricity industry could reduce these emissions. Among the various scenarios analyzed, Scenario 4 – which involves decreasing energy intensity and lifting economic sanctions – has the lowest projected CO2 emissions in the power sector. Carbon emissions in the service and household (SEHO) sectors are also illustrated in . In the service and household sector, Scenario 6 has the highest projected CO2 emissions in 2028 at 182 million tons. The findings indicate that reducing energy intensity in economic activities is key to reducing CO2 emissions in the future.
5. Conclusion and policy implications
This study aims to simulate the energy and environmental impacts arising from different international sanction scenarios in Iran. To achieve this, we develop a system dynamic framework and test its reliability using structural assessment, boundary adequacy, and the ability to reproduce historical data. Our initial hypothesis posits that international sanctions, potentially dampening economic growth, result in an upswing in CO2 emissions associated with energy production.
To assess the effects of diverse factors on energy-related carbon emissions in Iran, we formulate multiple scenarios incorporating variations in international economic sanctions, economic growth, and energy intensity across various economic sectors. The findings indicate that, in the baseline scenario referred to as “business as usual,” both fossil fuel energy consumption and CO2 emissions are projected to steadily rise until 2028. Furthermore, the temporary lifting of economic sanctions, as seen during the implementation of the Joint Comprehensive Plan of Action (JCPOA) agreement, potentially results in a reduction in carbon emissions by around 5%. Nevertheless, the reinstatement of earlier sanctions, as exemplified by the JCPOA’s failure in 2018 and the introduction of new sanctions, impedes economic growth and heightens energy intensity across all sectors. This exacerbates both energy consumption and carbon emissions, particularly in instances where sanctions are implemented and energy intensity experiences a significant increase (as seen in Scenario 6). In this line, our findings indicate that the reinstatement of earlier sanctions is expected to cause a significant rise in CO2 emissions, ranging from 12.5% to 30% compared to the baseline scenario. The degree of this escalation depends on various factors, such as energy usage efficiency and different economic growth possibilities.
Aligned with previous studies (e.g. Fotourehchi Citation2020), our analysis generally indicates that the initiation and prolonged enforcement of sanctions lead to a rise in CO2 emissions, indicating a crucial environmental externality. Nevertheless, our analysis provides additional granularity regarding the specific changes in both CO2 emissions and energy consumption attributable to the sanctions. Moreover, while Khalid et al. (Citation2024) report that sanctions, particularly trade sanctions, generally enhance the climate change aspects of environmental quality, i.e. sanctions reduce the growth in greenhouse gas emissions, our findings reveal a differing outcome in the context of Iran. This variation could be elucidated by the varying impacts of sanctions in the short and long-term horizons, a dynamic aspect captured by our system dynamics framework. Chen et al. (Citation2023) demonstrated that, although there was a short-term reduction in greenhouse gas emissions due to energy sanctions during the geo-conflict of the Russian – Ukrainian war, this decrease is not sustainable in the long run. Our analysis aligns with prior findings (e.g. Chen et al. Citation2023), indicating that the objectives of a global climate agreement, including CO2 mitigation, may face challenges due to the escalation of international sanctions. Moreover, our results indicate that persistent economic sanctions impede the enhancement of energy intensity in Iran.
As mentioned earlier, while sanctions have not directly triggered environmental issues in Iran, they have exerted indirect environmental impacts by limiting access to technology, services, and expertise, blocking international aid for the environment and amplifying the natural resource intensity of Iran’s economy (Hatipoglu, Soytas, and Belaïd Citation2023; Madani Citation2021). Prior research has typically identified a positive correlation between economic growth and CO2 emissions. In contrast, our findings indicate that during the period of lifted sanctions, such as the JCPOA period, heightened economic growth coincides with a reduction in energy-related CO2 emissions, attributed to improved energy intensity. However, the re-imposition of sanctions has rendered economic activities more environmentally costly, potentially leading to unintended adverse environmental externalities such as increased CO2 emissions. In a media report, Scollon (Citation2023) explains that “In addition to the increased production of mazut and other dirty fuels, Tehran has exempted some automotive manufacturers from installing air filters until international sanctions imposed over Iran.” Since 2015, the government has not fulfilled its obligation to submit a carbon-cutting plan in connection with the Paris Agreement on climate change. Officials maintain that Iran will refrain from ratifying the accord until international sanctions are lifted, contending that access to contemporary foreign technology is essential for emissions reduction.
Gaining a comprehensive understanding of the unintended consequences of sanctions is crucial for guiding policy-makers to make informed decisions that harmonize foreign policy objectives with emissions control, contributing to sustainable global development. In line with Hatipoglu, Soytas, and Belaïd (Citation2023), our analysis suggests that countries under sanctions should seek a balance between economic recovery and environmental sustainability. This entails diversifying energy sources through investments in renewable energy projects, attracting foreign investment aligned with emissions reduction goals, and fortifying environmental regulations, including more stringent emissions standards and impact assessments.
The enduring and potentially irreversible nature of environmental issues underscores that the repercussions of sanctions can endure for years or even decades, impacting not only the targeted country but also future generations globally. Consequently, policymakers should meticulously evaluate the duration and severity of sanctions, advocating for a more efficacious and environmentally responsible approach to achieving diplomatic goals. Additionally, policy-makers, especially in countries imposing sanctions, should conscientiously factor in the environmental consequences of sanctions in their decision-making processes, considering aspects such as carbon leakage. Hence, if the international community aspires to curtail CO2 emissions in alignment with the Paris Agreement, the frequent imposition of international sanctions may lead to substantial carbon leakage on a global scale. This presents an intriguing avenue for future studies.
If the use of sanctions continues, it is imperative to enhance humanitarian exemptions, given the main environmental consequences and the associated humanitarian and justice implications of sanctions. Future studies could delve into the development of novel schemes, mechanisms, reforms, and legal exemptions aimed at mitigating the enduring environmental effects of economic sanctions. Furthermore, there is a pressing need for sustainable and resilient environmental policies that underscore long-term planning strategies to effectively address the lasting impacts of sanctions.
Acknowledgments
We appreciate the helpful comments and suggestions of the editor (Toby S. James) and three anonymous reviewers. The research assistance by Noah Haynes and Jhoana Ocampo is acknowledged.
Disclosure statement
No potential conflict of interest was reported by the author(s).
Correction Statement
This article has been corrected with minor changes. These changes do not impact the academic content of the article.
Additional information
Notes on contributors
Hamid Balali
Hamid Balali is an Associate Professor in the Department of Natural Resource and Environmental Economics at the Faculty of Agriculture, Bu-Ali Sina University, located in Hamedan, Iran. His research focuses on environmental economics, climate change resilience, and water economics. He applies the system dynamics approach to model complex social, economic, and ecological systems.
Mohammad Reza Farzanegan
Mohammad Reza Farzanegan is a Professor of Economics of the Middle East at the Center for Near and Middle Eastern Studies (CNMS), School of Business and Economics at Philipps-Universität Marburg in Germany. Additionally, he is a research fellow at CESifo (Munich) and ERF (Cairo). His primary research focuses on political economy, specifically in the areas of economic sanctions, conflicts, and the resource curse.
Omid Zamani
Omid Zamani is a Research Associate at the Department of Agricultural Economics at the University of Kiel and the Market Analysis division of the Thuenen Institute. His primary research interests include agri-food market analysis, modeling for policy assessment, climate policy, and food systems.
Mostafa Baniasadi
Mostafa Baniasadi is an Assistant Professor of Agricultural Economics/Natural Resource and Environmental Economics at Bu-Ali Sina University, within the Department of Agricultural Extension and Education, specializing in Agricultural Economics. His research interests include natural resource and environmental economics, particularly focusing on environmental externalities, water and groundwater economics, and food security.
Notes
1 To learn more about the economic effects of sanctions with reference to Iran, see Khabbazan and Farzanegan (Citation2016), Gharehgozli (Citation2017), Esfahani and Rasoulinezhad (Citation2017), Haidar (Citation2017), Dadpay and Tabrizy (Citation2021), Zamani et al. (Citation2021), Farzanegan and Fischer (Citation2021), Laudati and Pesaran (Citation2023), and Salehi-Isfahani (Citation2023).
2 The environmental effects of sanctions, with a focus on Iran, have attracted attention in recent policy debates. See Hakim and Makuch (Citation2022) and Bartlett and Hakim (Citation2021) for further references.
3 Carbon dioxide (CO2) emissions are a significant component of greenhouse gas emissions, contributing to global climate change. These emissions primarily result from human activities, such as the burning of fossil fuels (coal, oil, and natural gas) for energy, industrial processes, and deforestation. Efforts to mitigate climate change often focus on reducing CO2 emissions through the adoption of cleaner energy sources, energy efficiency measures, and sustainable land-use practices. Monitoring and understanding CO2 emissions is crucial for developing effective strategies to address climate change and promote environmental sustainability.
4 Energy intensity refers to the amount of energy required to produce a unit of output or activity. In this context, it is calculated as the ratio of energy consumption to gross domestic product (GDP).
10 The Kaya identity is a mathematical framework introduced in 1995 for analyzing the primary drivers of global CO2 emissions. It is a useful equation for quantifying total human-generated CO2 emissions, a greenhouse gas.
11 At the international level, statistics on the energy sector and GDP are provided based on the International Standard Industrial Classification of all economic activities (ISIC), but in Iran, energy sector statistics are not recorded by any of the energy authorities. Therefore, due to differences in definitions, it is not possible to calculate some indicators (at least separately for consumer sectors), such as energy intensity or CO2 emissions coefficient, etc., which are based on two categories of energy sector information and the value-add of each sector (Iran Energy Balance Citation2017).
12 The choice of 2008 as the base year was made because it was considered a relatively normal year in terms of sanctions and economic conditions in Iran. By selecting a year that was not significantly impacted by extraordinary circumstances, we aim to establish a baseline that provides a clearer understanding of the underlying economic dynamics before the influence of major events or sanctions. This allows for a more accurate assessment of changes and deviations in subsequent years.
References
- Ahmad, S., R. M. Tahar, F. Muhammad-Sukki, A. B. Munir, and R. A. Rahim. 2016. “Application of System Dynamics Approach in Electricity Sector Modelling: A Review.” Renewable and Sustainable Energy Reviews 56: 29–37. https://doi.org/10.1016/j.rser.2015.11.034.
- Aizhu, C., and M. Xu. 2023. China Saves Billions of Dollars from Record Sanctioned Oil Imports. Reuters (October 11, 2023). https://shorturl.at/zABF7.
- Anand, Sh., P. Vrat, and R. P. Dahiya. 2006. “Application of a System Dynamics Approach for Assessment and Mitigation of CO2 Emissions from the Cement Industry.” Journal of Environmental Management 79 (4): 383–398. https://doi.org/10.1016/j.jenvman.2005.08.007.
- Ansari, N., and A. Seifi. 2012. “A System Dynamics Analysis of Energy Consumption and Corrective Policies in Iranian Iron and Steel Industry.” Energy 43 (1): 334–343. https://doi.org/10.1016/j.energy.2012.04.020.
- Ansari, N., and A. Seifi. 2013. “A System Dynamics Model for Analyzing Energy Consumption and CO2 Emission in Iranian Cement Industry Under Various Production and Export Scenarios.” Energy Policy 58: 75–89. https://doi.org/10.1016/j.enpol.2013.02.042.
- Armenia, S., F. Barnabé, E. Franco, F. Iandolo, A. Pompei, and G. Tsaples. 2023. “Identifying Policy Options and Responses to Water Management Issues Through System Dynamics and fsQCA.” Technological Forecasting and Social Change 194: 122737. https://doi.org/10.1016/j.techfore.2023.122737.
- Atamer Balkan, B., A. N. Lindqvist, K. Odoemena, R. Lamb, M. A. Tiongco, S. Gupta, A. Peteru, and H. M. Menendez. 2021. “Understanding the Impact of COVID-19 on Agriculture and Food Supply Chains: System Dynamics Modeling for the Resilience of Smallholder Farmers.” Journal of Food System Dynamics 12 (3): 255–270. https://doi.org/10.18461/ijfsd.v12i3.89.
- Balali, H., G. Khaledian, and A. Sam Deliri. 2018. “Determination of Optimal Green Tax Rate on Greenhouse Gas Emissions in Dairy Farms of Hamedan Povince.” Agricultural Economics & Development 32: 227–236. https://doi.org/10.22067/jead2.v32i3.71669. In Persian.
- Balali, H., O. Zamani-Dadandeh, and A. Yousofi. 2013. “The Relationship Between Economic Growth and Environmental Pollution in Oil Sector with Emphasis on Oil Price Volatility: Case Study of Iran.” Planning and Budgeting 18: 49–66. http://dorl.net/dor/20.1001.1.22519092.1392.18.3.3.4.
- Barlas, Y. 1996. “Formal Aspects of Model Validity and Validation in System Dynamics.” System Dynamics Review 12 (3): 183–210. https://doi.org/10.1002/(SICI)1099-1727(199623)12:3%3C183::AID-SDR103%3E3.0.CO;2-4.
- Bartlett, B., and S. Hakim. 2021. Economic Sanctions are Triggering Environmental Damage. Al Jazeera, 15 February. https://www.aljazeera.com/opinions/2021/2/15/economic-sanctions-are-triggering-environmental-damage.
- Biswas, A. K., M. R. Farzanegan, and M. Thum. 2023. “Pollution, Shadow Economy and Corruption: Theory and Evidence.” Ecological Economics 75: 114–125. https://doi.org/10.1016/j.ecolecon.2012.01.007.
- Central Bank of Iran (CBI). 2021. Selected Findings of the 2021 National Accounts of Iran. https://www.cbi.ir/page/2072.aspx.
- Chen, Y., J. Jiang, L. Wang, and R. Wang. 2023. “Impact Assessment of Energy Sanctions in Geo-Conflict: Russian–Ukrainian War.” Energy Reports 9: 3082–3095. https://doi.org/10.1016/j.egyr.2023.01.124.
- Cheratian, I., S. Goltabar, and M. R. Farzanegan. 2023. “Firms Persistence Under Sanctions: Micro-Level Evidence from Iran.” World Economy 46: 2408–2431. https://doi.org/10.1111/twec.13378.
- Cui, P., S. Xia, and L. Hao. 2019. “Do Different Sizes of Urban Population Matter Differently to CO2 Emission in Different Regions? Evidence from Electricity Consumption Behavior of Urban Residents in China.” Journal of Cleaner Production 240: 118207. https://doi.org/10.1016/j.jclepro.2019.118207.
- Dadpay, A., and S. Tabrizy. 2021. “Political Agreements and Exporting Activities: An Empirical Assessment of the Effects of the JCPOA Agreement on Iran’s Exports.” Comparative Economic Studies 63 (1): 147–180. https://doi.org/10.1057/s41294-020-00136-x.
- Ding, X., and X. Liu. 2023. “Renewable Energy Development and Transportation Infrastructure Matters for Green Economic Growth? Empirical Evidence from China.” Economic Analysis and Policy 79: 634–646. https://doi.org/10.1016/j.eap.2023.06.042.
- Dong, K., G. Hochman, Y. Zhang, R. Sun, H. Li, and H. J. E. E. Liao. 2018. “CO2 Emissions, Economic and Population Growth, and Renewable Energy: Empirical Evidence Across Regions.” Energy Economics 75: 180–192. https://doi.org/10.1016/j.eneco.2018.08.017.
- Dong, X., C. Li, J. Li, W. Huang, J. Wang, and R. Liao. 2012. “Application of A System Dynamics Approach for Assessment of the Impact of Regulations on Cleaner Production in the Electroplating Industry in China.” Journal of Cleaner Production 20: 72–81. https://doi.org/10.1016/j.jclepro.2011.08.014.
- Donovan, K., and M. Nikoladze. 2024. “The Axis of Evasion: Behind China’s Oil Trade with Iran and Russia.” Atlantic Council, March 28, 2024. https://shorturl.at/BEFS8.
- Ebrahimi, M., and N. Pilevar. 2021. “System Dynamics Modeling and Simulation to Analyze the Role of Solar Energy in Secure Access to Sustainability.” Journal of Industrial Engineering International 17 (1): 63–77. https://doi.org/10.30495/jiei.2021.1924887.1102.
- Eidin, E., T. Bielik, I. Touitou, J. Bowers, C. McIntyre, D. Damelin, and J. Krajcik. 2024. “Thinking in Terms of Change Over Time: Opportunities and Challenges of Using System Dynamics Models.” Journal of Science Education and Technology 33: 1–28. https://doi.org/10.1007/s10956-023-10047-y.
- Esfahani, M. N., and E. Rasoulinezhad. 2017. “Iran’s Trade Policy of Asianization and De-Europeanization Under Sanctions.” Journal of Economic Studies 44: 552–567. https://doi.org/10.1108/JES-05-2016-0101.
- Fahimifard, S. M. 2020. “Studying the Effect of Economic Sanctions on Iran’s Environmental Indexes (SVAR Approach).” Journal of Econometric Modeling 18: 93–119. https://doi.org/10.22075/JEM.2020.21451.1504. in Persian.
- Farzanegan, M. R. 2013. “Effects of International Financial and Energy Sanctions on Iran’s Informal Economy.” SAIS Review of International Affairs 33 (1): 13–36. https://doi.org/10.1353/sais.2013.0008.
- Farzanegan, M. R., and E. Batmanghelidj. 2023. “Understanding Economic Sanctions on Iran: A Survey.” The Economists’ Voice 20: 197–226. https://doi.org/10.1515/ev-2023-0014.
- Farzanegan, M. R., and S. Fischer. 2021. “Lifting of International Sanctions and the Shadow Economy in Iran - A View from Outer Space.” Remote Sensing 13 (22): 4620. https://doi.org/10.3390/rs13224620.
- Farzanegan, M. R., and H. F. Gholipour. 2023. “Does Satisfaction with Amenities and Environment Influence the Taste for Revolt in the Middle East?” Constitutional Political Economy. https://doi.org/10.1007/s10602-023-09422-z.
- Farzanegan, M. R., and G. Markwardt. 2018. “Development and Pollution in the Middle East and North Africa: Democracy Matters.” Journal of Policy Modeling 40: 350–374. https://doi.org/10.1016/j.jpolmod.2018.01.010.
- Fletcher, W. D., and C. B. Smith. 2024. “International Efforts to Address Global Warming.” In The Global Climate Crisis, 2nd ed., 105–124. Elsevier. https://doi.org/10.1016/C2023-0-50849-3.
- Ford, A. 2009. Modeling the Environment: An Introduction to System Dynamics of Environmental Systems. Washington, DC, USA: Island Press.
- Forrester, J. W., and P. M. Senge. 1980. “Tests for Building Confidence in System Dynamic Models.” TIMS Studies Management Science 14: 209–228. https://www.albany.edu/faculty/gpr/PAD724/724WebArticles/ForresterSengeValidation.pdf.
- Fotourehchi, Z. 2020. “Are UN and US Economic Sanctions a Cause or Cure for the Environment: Empirical Evidence from Iran.” Environment, Development and Sustainability 22: 5483–5501. https://doi.org/10.1007/s10668-019-00434-0.
- Gharehgozli, O. 2017. “An Estimation of the Economic Cost of Recent Sanctions on Iran Using the Synthetic Control Method.” Economics Letters 157: 141–144. https://doi.org/10.1016/j.econlet.2017.06.008.
- Haidar, J. I. 2017. “Sanctions and Export Deflection: Evidence from Iran.” Economic Policy 32 (90): 319–355. https://doi.org/10.1093/epolic/eix002.
- Hakim, S., and K. E. Makuch. 2022. Conflicts of Interest: The Environmental Costs of Modern War and Sanctions. London, UK: Royal United Services Institute. https://www.rusi.org/explore-our-research/publications/commentary/conflicts-interest-environmental-costs-modern-war-and-sanctions.
- Hatipoglu, E., M. A. Soytas, and F. Belaïd. 2023. “Environmental Consequences of Geopolitical Crises: The Case of Economic Sanctions and Emissions.” Resources Policy 85 (B): 104011. https://doi.org/10.1016/j.resourpol.2023.104011.
- Hosseini, S. M., A. Saifoddin, R. Shirmohammadi, and A. Aslani. 2019. “Forecasting of CO2 Emissions in Iran Based on Time Series and Regression Analysis.” Energy Reports 5: 619–631. https://doi.org/10.1016/j.egyr.2019.05.004.
- Iran Energy Balance. 2017. Energy Balance Sheet 2017. Tehran, Iran: Energy Ministry of Iran. https://www.isn.moe.gov.ir.
- Jabari, L., A. A. Salem, O. Zamani, and M. R. Farzanegan. 2024. “Economic Sanctions, Energy Efficiency, and Environmental Impacts: Evidence from Iranian Industrial Sub-Sectors.” MAGKS - Joint Discussion Papers in Economics No. 03-2024, Marburg. https://doi.org/10.2139/ssrn.4712314
- Jokar, Z., and A. Mokhtar. 2018. “Policy Making in the Cement Industry for CO2 Mitigation on the Pathway of Sustainable Development-A System Dynamics Approach.” Journal of Cleaner Production 201: 142–155. https://doi.org/10.1016/j.jclepro.2018.07.286.
- Khabbazan, M. M., and M. R. Farzanegan. 2016. “Household Welfare in Iran Under Banking Sanctions: From Open Economy Toward Autarchy.” In Economic Welfare and Inequality in Iran, edited by Mohammad Reza Farzanegan and Pooya Alaedini, 213–232. New York, US: Palgrave Macmillan.
- Khalid, S., M. Tahir Ali, L. Okafor, and O. I. Sanusi. 2024. “Do Sanctions Affect the Environment? The Role of Trade Integration.” Research in Globalization 8: 100191. https://doi.org/10.1016/j.resglo.2023.100191.
- Kunche, A., and B. Mielczarek. 2021. “Application of System Dynamics Modelling for Evaluation of Carbon Mitigation Strategies in Cement Industries: A Comparative Overview of the Current State of the Art.” Energies 14 (5): 1464. https://doi.org/10.3390/en14051464.
- Labzovskii, L., H. W. Mak, S. T. K. Kenea, J. Rhee, A. Lashkari, S. Li, T. Goo, Y. Oh, and Y. Byun. 2019. “What Can We Learn About Effectiveness of Carbon Reduction Policies from Interannual Variability of Fossil Fuel CO2 Emissions in East Asia?” Environmental Science & Policy 96: 132–140. https://doi.org/10.1016/j.envsci.2019.03.011.
- Laudati, D., and M. H. Pesaran. 2023. “Identifying the Effects of Sanctions on the Iranian Economy Using Newspaper Coverage.” Journal of Applied Econometrics 38 (3): 271–94. https://doi.org/10.1002/jae.2947.
- Lee, C. 2019. “Decentralized Allocation of Emission Permits by Nash Data Envelopment Analysis in the Coal-Fired Power Market.” Journal of Environmental Management 241: 353–362. https://doi.org/10.1016/j.jenvman.2019.03.114.
- Li, J., M. Irfan, S. Samad, B. Ali, and Y. Zhang. 2023. “The Relationship Between Energy Consumption, CO2 Emissions, Economic Growth, and Health Indicators.” Intetnational Journal of Environmental Research and Public Health 20 (3): 2325. https://doi.org/10.3390/ijerph20032325.
- Li, J., X. Shi, H. Wu, and L. Liu. 2020. “Trade-Off Between Economic Development and Environmental Governance in China: An Analysis Based on the Effect of River Chief System.” China Economic Review 60: 101403. https://doi.org/10.1016/j.chieco.2019.101403.
- Liu, X., S. Ma, J. Tian, N. Jia, and G. Li. 2015. “A System Dynamics Approach to Scenario Analysis for Urban Passenger Transport Energy Consumption and CO2 Emissions: A Case Study of Beijing.” Energy Policy 85: 253–270. https://doi.org/10.1016/j.enpol.2015.06.007.
- Madani, K. 2020. “How International Economic Sanctions Harm the Environment.” Earth’s Future 8: e2020E–F001829. https://doi.org/10.1029/2020EF001829.
- Madani, K. 2021. “Have International Sanctions Impacted Iran’s Environment?” World (oakland, Calif 2: 231–252. https://doi.org/10.3390/world2020015.
- Malbon, E., and J. Parkhurst. 2023. “System Dynamics Modelling and the Use of Evidence to Inform Policymaking.” Policy Studies 44: 454–472. https://doi.org/10.1080/01442872.2022.2080814.
- Mostafavi, S. M., M. Ghaemi Asl, and A. Hoseini. 2014. “An Investigate for Causality Relationship Among Economic Sanctions, Macroeconomic Factors and Environmental Polluters in Iran.” Quarterly Journal of Quantitative Economics 11 (1): 103–128. https://jqe.scu.ac.ir/article_11707.html?lang=en. (In Persian.
- Natter, A., and J. A. Dlouhy. 2024. “Oil Market Sees Iran Sanctions Having Muted Export Impact.” Bllomberg, April 23, 2024. https://shorturl.at/mzBIZ.
- Neuenkirch, M., and F. Neumeier. 2016. “The Impact of US Sanctions on Poverty.” Journal of Development Economics 121: 110–119. https://doi.org/10.1016/j.jdeveco.2016.03.005.
- Olivier, J. G., and J. A. Peters. 2020. Trends in Global CO2 and Total Greenhouse Gas Emissions, 2020 Report. Hague, Netherlands: © PBL Netherlands Environmental Assessment Agency, 2020 PBL publication number: 4331. https://www.pbl.nl/sites/default/files/downloads/pbl-2020-trends-in-global-CO2-and_total-greenhouse-gas-emissions-2020-report_4331.pdf.
- Pourkiaei, S. M., F. Pourfayaz, R. Shirmohammadia, S. Moosavi, and N. Khalilpoor. 2021. “Potential, Current Status, and Applications of Renewable Energy in Energy Sector of Iran: A Review.” Renewable Energy Research Applications 2 (1): 25–49. https://doi.org/10.22044/rera.2020.8841.1008.
- Proano, L., A. T. Sarmiento, M. Figueredo, and M. Cobo. 2020. “Techno-Economic Evaluation of Indirect Carbonation for CO2 Emissions Capture in Cement Industry: A System Dynamics Approach.” Journal of Cleaner Production 263: 121457. https://doi.org/10.1016/j.jclepro.2020.121457.
- Radmehr, R., Sh. Rastegari Henneberry, and S. Shayanmehr. 2021. “Renewable Energy Consumption, CO2 Emissions, and Economic Growth Nexus: A Simultaneity Spatial Modeling Analysis of EU Countries.” Structural Change and Economic Dynamics 57: 13–27. https://doi.org/10.1016/j.strueco.2021.01.006.
- Rahmani, O., Sh. Rezania, A. Beiranvand pour, Sh. Aminpour, M. Soltani, Y. Ghaderpour, and B. Oryani. 2020. “An Overview of Household Energy Consumption and Carbon Dioxide Emissions in Iran.” Processes 8 (8): 994. https://doi.org/10.3390/pr8080994.
- Riemer, M., J. Wachsmuth, B. Boitier, A. Elia, K. Al-Dabbas, Ş. Alibaş, A. Chiodi, and F. Neuner. 2023. “How do System-Wide Net-Zero Scenarios Compare to Sector Model Pathways for the EU? A Novel Approach Based on Benchmark Indicators and Index Decomposition Analyses.” Energy Strategy Reviews 50: 101225. https://doi.org/10.1016/j.esr.2023.101225.
- Robalino-López, A., A. Mena-Nieto, J. E. García-Ramos, and A. A. Golpe. 2015. “Studying the Relationship Between Economic Growth, CO2 Emissions, and the Environmental Kuznets Curve in Venezuela (1980–2025).” Renewable and Sustainable Energy Reviews 41: 602–614. https://doi.org/10.1016/j.rser.2014.08.081.
- Roudari, S., F. Ahmadian-Yazdi, S. H. Arabi, and S. Hammoudeh. 2023. “Sanctions and Iranian Stock Market: Does the Institutional Quality Matter?” Borsa Istanbul Review 23 (4): 919–935. https://doi.org/10.1016/j.bir.2023.03.006.
- Saberpour, A., M. Akhavan Fard, and G. Masoud. 2021. “Impact of Sanctions on Transfer of Environmental Technologies in International Law with Emphasis on Iran.” Medical Law Journal 15 (56): 299–316. http://ijmedicallaw.ir/article-1-1310-en.html. (In Persian).
- Salehi-Isfahani, D. 2023. “The Impact of Sanctions on Household Welfare and Employment in Iran.” Middle East Development Journal 15 (2): 189–221. https://doi.org/10.1080/17938120.2023.2248697.
- Saqib, N. 2021. “Energy Consumption and Economic Growth: Empirical Evidence from MENA Region.” International Journal of Energy Economics and Policy 11 (6): 191–197. https://doi.org/10.32479/ijeep.11931.
- Satterthwaite, D. 2009. “The Implications of Population Growth and Urbanization for Climate Change.” Environment and Urbanization 21 (2): 545–567. https://doi.org/10.1177/0956247809344361.
- Scollon, M. 2023. Iran’s Environmental Standards, Polluted Reality Mix Like Oil and Water. Radio Free Europe/Radio Liberty. https://www.rferl.org/a/iran-environmental-standards-pollution-smog/32385813.html.
- Sen, K., W. Al-Fasial, and Y. Aisaleh. 2013. “Syria: Effects of Conflict and Sanctions on Public Health.” Journal of Public Health 35 (2): 195–199. https://doi.org/10.1093/pubmed/fds090.
- Statistical Center of Iran (SCI). 2021. Selected Findings of the 2019 Annual National Accounting. https://www.amar.org.ir/english.
- World Bank. 2021. Iran’s Economic Outlook. http://www.worldbank.org/en/country/iran/publication/economic-outlook.
- World Bank. 2024. World Development Indicaotrs. Washington, DC: The World Bank Group.
- Wu, H., Y. Hao, and S. Ren. 2020. “How do Environmental Regulation and Environmental Decentralization Affect Green Total Factor Energy Efficiency: Evidence from China.” Energy Economics 91: 104880. https://doi.org/10.1016/j.eneco.2020.104880.
- Wu, H., D. Peng, and L. Wang. 2020. “Model for Sustainable Development Based on System Dynamics and Energy-Economy-Environment Coordination: A Case Study of Beijing, China.” Energy Science & Engineering 9: 828–842. https://doi.org/10.1002/ese3.837.
- Yang, J., W. Cai, M. Ma, C. Liu, X. Ma, L. Li, and X. Chen. 2020. “Driving Forces of China’s CO2 Emissions from Energy Consumption Based on Kaya-LMDI Methods.” Science of The Total Environment 711: 134569. https://doi.org/10.1016/j.scitotenv.2019.134569.
- Yang, H., X. Li, L. Ma, and Z. Li. 2021. “Using System Dynamics to Analyse Key Factors Influencing China’s Energy-Related CO2 Emissions and Emission Reduction Scenarios.” Journal of Cleaner Production 320: 128811. https://doi.org/10.1016/j.jclepro.2021.128811.
- Yang, H., L. Ma, and Z. Li. 2020. “A Method for Analyzing Energy-Related Carbon Emissions and the Structural Changes: A Case Study of China from 2005 to 2015.” Energies 13: 2076. https://doi.org/10.3390/en13082076.
- Ye, F., X. Xiong, L. Li, and Y. Li. 2021. “Measuring the Effectiveness of the Chinese Certified Emission Reduction Scheme in Mitigating CO2 Emissions: A System Dynamics Approach.” Journal of Cleaner Production 294: 125355. https://doi.org/10.1016/j.jclepro.2020.125355.
- Zamani, O., M. R. Farzanegan, J. Loy, and M. Einian. 2021. “The Impacts of Energy Sanctions on the Black-Market Premium: Evidence from Iran.” Economics Bulletin 41 (2): 432–443. http://www.accessecon.com/Pubs/EB/2021/Volume41/EB-21-V41-I2-P38.pdf.
Appendices
Appendix A
Figure A1. Per capita energy use from 1970 to 2019 in Iran (kg of oil equivalent per capita). Source: World Bank (Citation2021).
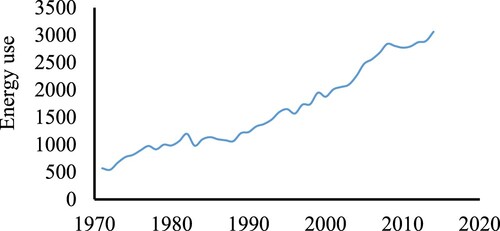
Figure A2. CO2 emissions (mt) from 1970 to 2019 in Iran. Source: World Bank (Citation2021).
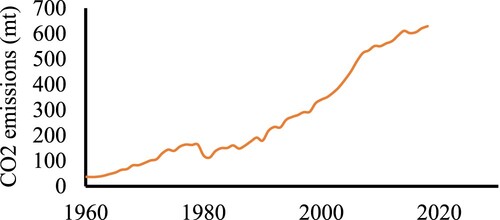
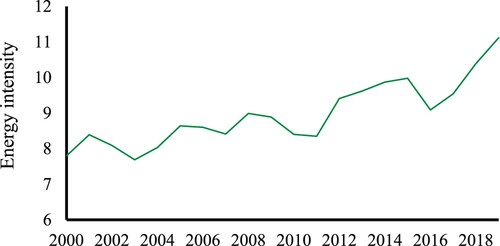
Figure A3. Energy intensity level of primary energy (MJ/$2017 PPP GDP). Source: World Bank (Citation2021).
Appendix B
Figure B1. CO2 Emissions flow diagram of different sectors.
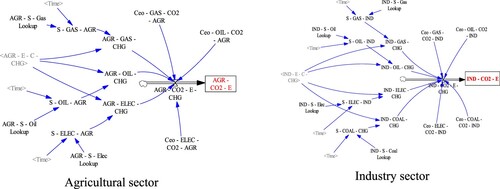
Figure B1. Continued