

Abstract
This study answers the question of whether ultrasound machine settings and the cardiac cycle can influence 3D power Doppler (3D PD) indices in the evaluation of uterine fibroid vascularisation. These parameters were reported to affect the vascular indices and cause undesired variation. 3D PD ultrasound was performed using three different gain settings: a fixed predetermined gain (50 dB), a higher gain (65 dB) and an individualised subjectively most optimal gain. Two consecutive 3D PD sweeps were taken to evaluate the effect of the cardiac cycle. A predetermined most optimal fixed gain setting was not different from the individually most optimal chosen gain in vascular assessment of fibroids. A higher gain corresponded with a significantly higher vascular index (VI). Potential variation during the cardiac cycle does not disturb the VI in fibroids.
Introduction
Minimally invasive therapies like the uterine artery embolisation and the MR guided focussed ultrasound are the emerging alternatives for hysterectomy. Vascularity of fibroids may play a role in the effectiveness of these minimally invasive techniques (Funaki et al. Citation2007; Isonishi et al. Citation2008; Yoon et al. Citation2010; Minsart et al. Citation2012). Vascularity assessment with MRI is expensive and not available for every patient. A cheaper and faster way to measure and quantify vascularisation would be preferable.
3D power Doppler (3D PD) ultrasound can quantify vessels within a volume of interest and is easily performed. 3D PD ultrasound is extensively studied in several areas of gynaecology and obstetrics (uterus, ovarian, endometrium, tumour, placenta, etc). Several studies suggest that 3D PD indices may be helpful to distinguish between benign and malignant lesions (Alcazar et al. Citation2005a; Alcazar and Guerriero Citation2007; Makled et al. Citation2013).
Only a handful of investigators used 3D PD in the assessment of fibroids. Vascularity was used to assess painful myomas in pregnancy (Degani et al. Citation2007), response to GnRHa (Chia et al. Citation2006), to compare 3D PD with their histopathological parameters (Minsart et al. Citation2012) and to assess response to Ulipristal (Czuczwar et al. Citation2015). A positive relation between 3D PD parameters and histopathological vascular parameters in fibroids is reported; high 3D PD indices correspond with high cellular activity score (Minsart et al. Citation2012). Furthermore, 3D PD is reported to be a reproducible technique, also in fibroids (Alcazar et al. Citation2005b; Alcazar and Prka Citation2009; Jones et al. Citation2011; Minsart et al. Citation2012; Claeskens et al. Citation2013; Nieuwenhuis et al. Citation2015).
Vascular indices are however subjective to machine settings and hardly studied in fibroids. Several factors like the cardiac cycle and machine settings have been evaluated (Raine-Fenning et al. Citation2008b; Schulten-Wijman et al. Citation2008; Martins et al. Citation2010; Collins et al. Citation2012; Miyague et al. Citation2013b) and have been reported to be of influence. From all machine settings, the gain has been reported to be the most sensitive to changes. A general guideline or consensus on how to use 3D PD in fibroids is lacking in terms of used settings and off-line methods to calculate vascular indices in fibroids. Therefore, the aim of this study is to evaluate the different gain settings and the potential influence of the cardiac cycle on 3D PD indices in the assessment of fibroid vascularisation. Secondly, several off-line methods will be evaluated for volume, shell and vascular index (VI) calculation in fibroids.
Materials and methods
Study design
A prospective cohort study was performed between March 2012 and August 2014 at our out-patient clinic of the VU University Medical Centre, Amsterdam (Nieuwenhuis et al. Citation2017). All pre-menopausal women diagnosed with a maximum of two fibroids without the use of any hormonal drug therapy (e.g. oral contraceptives, levonorgestrel releasing intra uterine device, GnRH agonists, Ulipristal) were consecutively asked to participate in the study and included a maximum of two fibroids were chosen (of which only the largest was measured) to avoid any risk of mixing measurements of the fibroids in the same patient during follow up. During the follow up, extra 3D PD sweeps were performed in a random sample of 40 patients to evaluate the effect of the cardiac cycle and gain settings. The study was approved by the ethical board as transvaginal ultrasound is considered regular care.
Ultrasound
All women underwent a real time 2D greyscale sonography of the uterus and ovaries followed by a 3D PD ultrasound on the day of their visit using a 5–8 MHz vaginal transducer on the Accuvix V10 ultrasound machine (Samsung-Medison, South Korea). All volumes were collected by a single experienced examiner (L. L. Nieuwenhuis) in a standardised way using the same predetermined settings for 3D PD. First, the uterus was examined in both the sagittal (from left to right) and transversal plane (from cervix to fundus). Subsequently, the myometrium was studied and in case of fibroids; size, subjective vascularisation and location were registered. Location was classified according to the FIGO Palm Coin classification (Munro et al. Citation2011). As long as the fibroid could be visualised using the vaginal probe there was no minimum or maximum fibroid diameter, however, in general it was difficult or not possible to properly measure fibroids larger than 8 cm. Power Doppler settings were set to achieve maximum sensitivity for detecting small vessels without background noise; Frequency 5–8 MHz, Gain fixed at 50 dB, pulse repetition frequency 0.60 kHz, Wall motion filter low. The power Doppler mode was activated and the 3D region of interest was manually adjusted to contain the entire fibroid (sweep angle of 70–90 degrees, dependent on the size of the fibroid).
In total, four consecutive 3D PD sweeps were obtained: the first two sweeps with the same settings were performed to assess the effect of the cardiac cycle on the vascularisation of the fibroid. A 3D PD sweep (of 10 seconds for a small angle sweep) will include ∼4–5 cardiac cycles (assuming a heart rate above 50 beats a minute). The last two sweeps were obtained with different gain settings. First, gain settings were changed to a higher sensitivity (a randomly chosen fixed gain 65) and then changed into what subjectively seemed the best gain. This individualised gain was selected by increasing the gain until noise artefacts were visible, followed by reducing the gain until artefacts just disappeared (Collins et al. Citation2012). All acquired volumes were digitally stored (as mvl and VOO files).
Off-line evaluation of the 3D volumes
All stored volumes were evaluated with VOCAL (Virtual Organ Computer-aided AnaLysis) software, Sonoview Pro- 1.6.2. (Samsung-Medison, South Korea). Through a standardised protocol, volume and vascular parameters were measured for the entire fibroid and for the fibroids shell using automatic and manual modes (Nieuwenhuis et al. Citation2015). 3D sweep quality was scored on a Likert scale from 1 to 5 for different US entities, 1 point for each entity (1. contrast, sharpness, brightness, 2. visibility of fibroid (border), 3. penetration depth, 4. total fibroid visible in sweep, 5. movement artefacts). For every volume measurement, the examiner registered which type of contour (manual or automatic) subjectively seemed to be the best fit for the fibroid. The vascular parameters were automatically calculated in the histogram function of the VOCAL software. We used the VI (and not FI or VFI) since this parameter was reported to be the most reproducible one in fibroids assessment (Minsart et al. Citation2012; Nieuwenhuis et al. Citation2015). The VI represents the proportion of blood vessels within the tissue (number of colour voxels divided by the total number of both colour and grey voxels). To assess the optimal shell thickness for fibroids, two different shells sizes were compared; shell thickness of 0.5 cm and 1 cm. The optimal shell contour should contain the entire vascular capsule without other uterine vessels such as (branches of) the uterine arteries.
Statistical analysis
All analyses were performed using IBM SPSS Statistics 22.0 (IBM, New York, NY) software package. A paired t-test was used to compare the effect of different gain settings on the VI and the difference in VI from two consecutive sweeps (p value <.05 was considered statistically significant). If data were not normally distributed, they were log transformed.
Results
Baseline characteristics of patients and fibroids are listed in . The vast majority of 3D sweeps was of sufficient or good quality (94.3%). Only in 1.4% of 3D sweeps quality was insufficient for proper VI assessment and were excluded, in all of these volumes it concerned a large fibroid.
Table 1. Baseline patient and fibroid characteristics.
Gain settings
Data were not normally distributed and therefore log transformed before analyses. The average subjective most optimal gain (chosen by the examiner) was 48.13 dB (SD 7.6, median 48, range 38–60). The VI of the predetermined fixed gain (gain 50 dB) and the chosen subjective most optimal gain did not differ significantly with a mean difference in VI value of −0.30 (95%CI −0.73 to 0.12; p value .15) (). The VI of the higher gain setting (gain 65) was significantly higher than the standard gain of 50 with a mean difference of 0.62 (95%CI 0.29–0.94; p value <.01).
Table 2. Effect of the cardiac cycle and different gain settings on Vascular Index (VI) measured with 3D power Doppler ultrasound in patients with fibroids (N = 40).
Potential effect of variations during the cardiac cycle
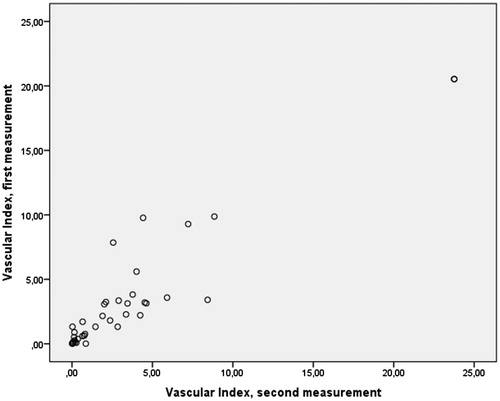
No significant difference was found in the VI values between the two consecutive sweeps (mean difference 0.04; 95% CI −0.32 to 0.40; p = .82, ), indicating that potential variation during the cardiac cycle does not disturb the outcome of the VI of fibroids when duration of the scan is 10 seconds or longer. However, in a few individuals large differences were observed in the two consecutive measurements, all with a very high VI value (see ). It is not clear if these differences are affected by the variation or are induced by the cardiac cycle.
Figure 1. Vascular Index (VI)* in fibroids calculated from two consecutive 3D power Doppler sweeps in the same patient #. *VI was measured using VOCAL software (manual contour mode, histogram function). #Little difference can be observed between two consecutive measurements. Only in a few individuals, all with a high VI, large differences can be observed.
Off-line subjective evaluations
Of the 40 patients, four patients had fibroids larger than 8 cm (the largest diameter was 8.8 cm). Fibroids larger than 8 cm did not seem to fit well in the scan sector and deeper/peripheral vessels were not visible () without increasing the gain resulting in noise artefacts. As far as we know, there is no international agreement on optimal fibroid diameter groups to be used. For small fibroids (0–3 cm), the manual and automatic modes are both good to use. In case of a large fibroid (>6 cm) or oval fibroid (), examiner preferred to use the manual contour mode (see ). The most optimal shell size seemed 0.5 cm (see ).
Figure 2. 3D power Doppler image: well vascularised fibroid, moderate peripheral penetration.
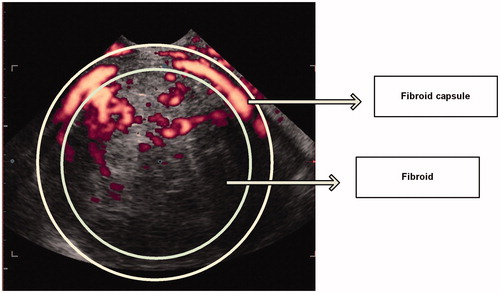
Figure 3. 3D power Doppler image in VOCAL: oval fibroid with vascular capsule, good peripheral penetration.
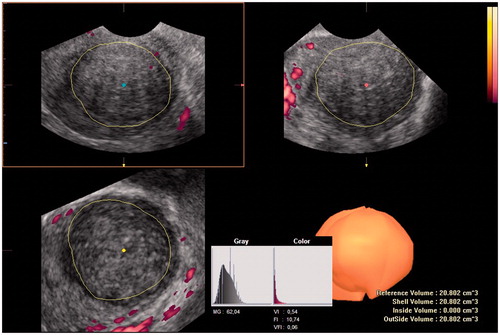
Table 3. Observer preferenceTable Footnotea for type of volume measurement in fibroids using 3D power Doppler ultrasound and VOCAL software.
Table 4. Shell size preferenceTable Footnotea in measuring vascular indices using 3D power Doppler ultrasound and VOCAL software for the capsule of the fibroidTable Footnoteb.
Discussion
Main findings
A predetermined most optimal fixed gain setting was not different from an individually most optimal chosen gain in vascular assessment of fibroids using 3D PD. A higher gain corresponded with a significantly higher VI. Furthermore, the cardiac cycle does not exert a major impact on fibroid vascularisation when duration of the scan is long (in our study, it was in general 10 seconds or longer). In some individuals with a highly vascularised fibroid, its influence cannot be excluded given the variation between the two consecutive volumes. For off-line fibroid volume evaluation, the manual mode was preferred, especially for large fibroids. Fibroids larger than 8 cm did not seem to fit in the scan sector and may be less suited for transvaginal (3D PD) measurement. A shell of 0.5 cm seemed the best fit to calculate vascularisation of the fibroids’ capsule.
Limitations
The limitation of this study was that an assumption was made that two consecutive sweeps were representatively enough to investigate the influence of the cardiac cycle. This methodology can be debated since we did not compare VI in systole with VI in diastole. On the other hand, we observed sweep time for several 3D PD sweeps, a 3D sweep of a fibroid <3 cm will take 10 seconds on the used ultrasound machine and automatically contains several cardiac cycles in one volume. During the study, we did not measure sweep time per 3D PD sweep taken, therefore, we cannot analyse the effect of the duration of the individual sweeps taken. Machines with a faster sweep time may have a higher risk on differences due to the cardiac cycle, but on the other hand, may have a lower risk on movements’ artefacts. Given the lack of previous data, we were not able to make a proper power calculation and we chose a sample size that we thought was sufficient. However, we are not sure if our sample size was large enough to detect differences in VI induced by variations during the cardiac cycle.
Interpretation
3D PD vascular indices were subjected to machine settings. Several effects like the cardiac cycle and machine settings were evaluated (Yoon et al. Citation1999; Raine-Fenning et al. Citation2008b; Martins et al. Citation2010; Collins et al. Citation2012; Kudla and Alcazar Citation2012; Miyague et al. Citation2013a; Ten Cate et al. Citation2013) and reported to be of influence. Findings in our population on gain settings corresponded with most studies (Raine-Fenning et al. Citation2008b; Collins et al. Citation2012; Minsart et al. Citation2012). A higher gain corresponded with a higher VI (Collins et al. Citation2012) and a predetermined most optimal gain were used with good reproducibility and was reported to correspond with the histology (Minsart et al. Citation2012). Measuring fibroids over time suggest a fixed gain, which seemed to be sufficient and suitable in order to assess the fibroid vascularisation, but this was not studied. Yet, some studies had used the fixed gain setting already to follow patients’ vascular indices (Chia et al. Citation2006; Czuczwar et al. Citation2015).
Several studies in fibroids did not correct for the possible influence of the cardiac cycle (Chia et al. Citation2006; Minsart et al. Citation2012; Czuczwar et al. Citation2015). While others advice to use STIC/4 D PD to overcome the influence of the cardiac cycle (Kudla and Alcazar Citation2010; Miyague et al. Citation2013a). For example, a significant difference was found between a 1 cm3 part of ovarian stroma measured in systole and diastole (Kudla and Alcazar Citation2010). In our study, we measured the entire fibroid (larger than 1 cm3) and could not confirm a significant influence of the cardiac cycle. A 3D sweep of a fibroid will take more than 10 seconds and automatically contains several cardiac cycles in one volume. A potential influence of the cardiac cycle is hereby possibly overcome. On the other hand, if we study the individual two measurements we can observe that in four patients with highly vascularised fibroids there was a large difference between both measurements. Thus, a potential effect of the cardiac cycle in these conditions cannot be excluded. However, differences can also be exerted due to variations in off-line volume selection for VI calculation between the two sweeps, since these will never be exactly the same and can be difficult in case of large fibroids or poor image quality. Fibroids larger than 8 cm did not fit well in the scan sector and showed to take up fewer vessels in peripheral fibroids tissue (large distance from the transducer). This is in concordance with the previous studies (Raine-Fenning et al. Citation2008a; Martins et al. Citation2010; Czuczwar et al. Citation2015). Besides ultrasound settings, off-line measurements can influence the vascular parameters as well. If fibroid volume is not measured correctly or completely, this will influence the calculated volume and will subsequently influence the vascular parameters. In this study, we only evaluated the preference of one examiner concerning the best fitting off-line mode for fibroid measurement. In a previous study (Nieuwenhuis et al. Citation2015), the interobserver agreement was highest for the manual mode. In this study, we also found that in the majority of cases, the volume measurement in our hands is most reliable with the manual mode, mainly due to the size and shape (not always round but slightly oval) of the fibroid. These results need to be confirmed in future studies. We did not verify our volume measurements with other imaging modalities. However, some previous studies reported fibroid volumes by 3D ultrasound to be similar to measurements by MRI or histopathology (Zivkovic et al. Citation2012).
Clinical implications
Total ultrasound examination time was not recorded. In general, it takes ∼1 minute extra to make a 3D PD sweep. Off-line calculation of the VI takes ∼2–5 minutes, depending on the number of calculations made and the experience of the examiner. Possible effects on the performance of 3D PD were studied before applying it in clinical practice. Although it is not possible to overcome differences between machine settings, we consider 3D PD to be useful in fibroids. A predetermined (most optimal) fixed gain setting seemed to be the most accurate way to evaluate fibroid vascularisation between patients and to study vascularisation in fibroids over time. A tool to quantify vascularisation in fibroids may in theory be clinically relevant to predict the natural behaviour of fibroids and response to drug or minimal invasive therapies. Together with the previously reported good reproducibility and correlation with histology, 3D PD can make a trustworthy instrument to apply for fibroid evaluation in clinical practice. Before applying 3D PD as a diagnostic tool in fibroids, these results need to be confirmed in other studies. The potential diagnostic effect of 3D PD ultrasound can then be further studied in clinical practice.
Conclusions
To determine vascularity using 3D PD ultrasound in uterine fibroids, a predetermined most optimal fixed gain can be used. The cardiac cycle showed not to be of influence (when scan duration is more than 10 seconds), though needs to be confirmed in other studies. For off-line 3D PD volume measurement in fibroids, examiner preferred the manual contour mode and a shell size of 0.5 cm.
Disclosure statement
The authors report no conflicts of interest.
References
- Alcazar JL, Guerriero S. 2007. Three-dimensional power Doppler in ovarian tumors. Ultrasound in Obstetrics and Gynecology 29:718–719.
- Alcazar JL, Merce LT, Garcia MM. 2005a. Three-dimensional power Doppler vascular sampling: a new method for predicting ovarian cancer in vascularized complex adnexal masses. Journal of Ultrasound in Medicine 24:689–696.
- Alcazar JL, Merce LT, Manero MG, Bau S, Lopez-Garcia G. 2005b. Endometrial volume and vascularity measurements by transvaginal 3-dimensional ultrasonography and power Doppler angiography in stimulated and tumoral endometria: an interobserver reproducibility study. Journal of Ultrasound in Medicine 24:1091–1098.
- Alcazar JL, Prka M. 2009. Evaluation of two different methods for vascular sampling by three-dimensional power Doppler angiography in solid and cystic-solid adnexal masses. Ultrasound in Obstetrics and Gynecology 33:349–354.
- Chia CC, Huang SC, Chen SS, Kang JY, Lin JC, Lin YS, et al. 2006. Ultrasonographic evaluation of the change in uterine fibroids induced by treatment with a GnRH analog. Taiwanese Journal of Obstetrics and Gynecology 45:124–128.
- Claeskens J, Tomsin K, Molenberghs G, Van HC, Mesens T, Meylaerts L, et al. 2013. Validation of 3D power Doppler and VOCAL software in the sonographic assessment of hepatic venous flow. Facts, Views and Vision in ObGyn 5:7–12.
- Collins SL, Stevenson GN, Noble JA, Impey L, Welsh AW. 2012. Influence of power Doppler gain setting on Virtual Organ Computer AnaLysis (VOCAL) indices in vivo: can use of the individual sub-noisegain (SNG) level optimise information? Ultrasound in Obstetrics and Gynecology, epub ahead of print.
- Czuczwar P, Wozniak S, Szkodziak P, Milart P, Wozniakowska E, Wrona, et al. 2015. Influence of ulipristal acetate therapy compared with uterine artery embolization on fibroid volume and vascularity indices assessed by three-dimensional ultrasound: prospective observational study. Ultrasound in Obstetrics and Gynecology 45:744–750.
- Degani S, Tamir A, Leibovitz Z, Shapiro I, Gonen R, Ohel G. 2007. Three-dimensional power Doppler in the evaluation of painful leiomyomas and focal uterine thickening in pregnancy. International Journal of Gynaecology and Obstetrics 99:122–126.
- Funaki F, Fukunishi H, Funaki T, Sawada K, Kaji Y, Maruo T. 2007. Magnetic resonance-guided focused ultrasound surgery for uterine fibroids: relationship between the therapeutic effects and signal intensity of preexisting T2-weighted magnetic resonance images. American Journal of Obstetrics and Gynecology 196:e1–e6.
- Isonishi S, Coleman RL, Hirama M. 2008. Analysis of prognostic factors for patients with leiomyoma treated with uterine arterial embolization. American Journal of Obstetrics and Gynecology 198:270–e1.
- Jones NW, Raine-Fenning NJ, Mousa HA, Bradley E, Bugg GJ. 2011. Evaluating the intra- and interobserver reliability of three-dimensional ultrasound and power Doppler angiography (3D-PDA) for assessment of placental volume and vascularity in the second trimester of pregnancy. Ultrasound in Medicine and Biology 37:376–385.
- Kudla MJ, Alcazar JL. 2010. Spatiotemporal image correlation using high-definition flow: a new method for assessing ovarian vascularization. Journal of Ultrasound in Medicine 29:1469–1474.
- Kudla MJ, Alcazar JL. 2012. Spatiotemporal image correlation with spherical sampling and high-definition flow: new 4-dimensional method for assessment of tissue vascularization changes during the cardiac cycle: reproducibility analysis. Journal of Ultrasound in Medicine 31:73–80.
- Makled AK, Elmekkawi SF, El-Refaie TA, El-Sherbiny MA. 2013. Three-dimensional power Doppler and endometrial volume as predictors of malignancy in patients with postmenopausal bleeding. Journal of Obstetrics and Gynaecology Research 39:1045–1051.
- Martins WP, Raine-Fenning NJ, Ferriani RA, Nastri CO. 2010. Quantitative three-dimensional power Doppler angiography: a flow-free phantom experiment to evaluate the relationship between color gain, depth and signal artifact. Ultrasound in Obstetrics and Gynecology 35:361–368.
- Minsart AF, Ntoutoume SF, VAndenhoute K, Jani J, Van PC. 2012. Does three-dimensional power Doppler ultrasound predict histopathological findings of uterine fibroids? A preliminary study. Ultrasound in Obstetrics and Gynecology 40:714–720.
- Miyague AH, Raine-Fenning NJ, Pavan TZ, Polanski LT, Baumgarten MN, Nastri CO, et al. 2013a. Influence of gain adjustment on 3-dimensional power Doppler indices and on spatiotemporal image correlation volumetric pulsatility indices using a flow phantom. Journal of Ultrasound in Medicine 32:1831–1836.
- Miyague AH, Raine-Fenning NJ, Polanski L, Martinez LH, Araujo JE, Pavan TZ, et al. 2013b. Assessing repeatability of 3D Doppler indices obtained by static 3D and STIC power Doppler: a combined in-vivo/in-vitro flow phantom study. Ultrasound in Obstetrics and Gynecology 42:571–576.
- Munro MG, Critchley HO, Broder MS, Fraser IS. 2011. FIGO classification system (PALM-COEIN) for causes of abnormal uterine bleeding in nongravid women of reproductive age. International Journal of Gynaecology and Obstetrics 113:3–13.
- Nieuwenhuis LL, Betjes HE, Hehenkamp WJ, Heymans MW, Brolmann HA, et al. 2015. The use of 3D power Doppler ultrasound in the quantification of blood vessels in uterine fibroids: feasibility and reproducibility. Journal of Clinical Ultrasound 43:171–178.
- Nieuwenhuis LL, Keizer AL, Stoelinga B, Twisk JW, Hehenkamp WJ, Brolmann HA, et al. 2017. Fibroid vascularisation assessed with three dimensional Power Doppler ultrasound is a predictor for uterine fibroid growth: a prospective cohort study. British Journal of Obstetrics and Gynaecology. [Epub ahead of print]. doi: 10.1111/1471-0528.14608
- Raine-Fenning NJ, Nordin NM, Ramnarine KV, Campbell BK, Clewes JS, Perkins A, et al. 2008a. Determining the relationship between three-dimensional power Doppler data and true blood flow characteristics: an in-vitro flow phantom experiment. Ultrasound in Obstetrics and Gynecology 32:540–550.
- Raine-Fenning NJ, Nordin NM, Ramnarine KV, Campbell BK, Clewes JS, Perkins A, et al. 2008b. Evaluation of the effect of machine settings on quantitative three-dimensional power Doppler angiography: an in-vitro flow phantom experiment. Ultrasound in Obstetrics and Gynecology 32:551–559.
- Schulten-Wijman MJ, Struijk PC, Brezinka C, De JN, Steegers EA. 2008. Evaluation of volume vascularization index and flow index: a phantom study. Ultrasound in Obstetrics and Gynecology 32:560–564.
- Ten Cate DF, Luime JJ, van der Ven M, Hazes JM, Kooiman K, de Jong N, et al. 2013. Very different performance of the power Doppler modalities of several ultrasound machines ascertained by a microvessel flow phantom. Arthritis Research and Therapy 15:R162.
- Yoon DY, Choi BI, Kim TK, Han JK, Yeon KM. 1999. Influence of instrument settings on flow signal and background noise in power Doppler US. An experimental study using a flow phantom with hyperechoic background. Investigative Radiology 34:781–784.
- Yoon SW, Lee C, Kim KA, Kim SH. 2010. Contrast-enhanced dynamic MR imaging of uterine fibroids as a potential predictor of patient eligibility for MR guided focused ultrasound (MRgFUS) treatment for symptomatic uterine fibroids. Obstetrics and Gynecology International 2010:834275.
- Zivkovic N, Zivkovic K, Despot A, Paic J, Zelic A. 2012. Measuring the volume of uterine fibroids using 2- and 3-dimensional ultrasound and comparison with histopathology. Acta Clinica Croatica 51:579–589.