

 ?Mathematical formulae have been encoded as MathML and are displayed in this HTML version using MathJax in order to improve their display. Uncheck the box to turn MathJax off. This feature requires Javascript. Click on a formula to zoom.
Abstract
Thalassaemia is a typically monogenic disease caused by mutations or deletions in the globin gene and has a high prevalence in southern China. Prenatal screening for thalassaemia can be effective in reducing the incidence of thalassaemia. Haematologic parameters of pregnant thalassaemia carriers are diverse and potentially valuable for identifying different types of genotypes. By comparing and evaluating haematological parameters, formulas in the literature, we tried to reveal differences between pregnant women carrying different types of thalassaemia genes. The Mentzer formula (MCV/RBC) showed a strong ability to differentiate thalassaemia genotypes in pregnant women. In addition, combined with haemoglobin electrophoresis HbA2 can further distinguish the –α/αα, αTα/αα, –/αα, β+/N and β0/N groups. HbA2 divides them into two groups. Based on the Mentzer formula, we can further decide which type of thalassaemia to screen (α/β and the subgroups) for genotyping. Therefore, this simpler and more cost-effective workflow has great potential for application in screening pregnant women for thalassaemia carriers.
What is already known on this subject? Currently, it is known that thalassaemia gene carriers have abnormal blood indicators. Many findings describe their important values in distinguishing thalassaemia and other blood diseases. They combined different metrics as an algorithm to distinguish thalassaemia and iron deficiency anaemia. Prenatal screening is an effective method to reduce the incidence of thalassaemia. The current main method is PCR. Due to technical and financial constraints, many backward places cannot use this technology. The necessity for prenatal screening for thalassaemia has been overlooked.
What the results of this study add? Among these algorithms, Mentzer formula revealed differences in haematological parameters during pregnancy between normal individuals and thalassaemia carriers. Combining the HbA2, thalassaemia carriers can be distinguished from normal individuals, including –α/αα, αTα/αα, –/αα, β0/N and β+/N.
What are the implications of these findings for clinical practice and/or further research? We provide another tool for these hospitals that donot have Hb electrophoresis test and PCR. Then the clinical doctor can get some evidence and suggest women go to another big hospital for essential tests. It is an excellent suggestion. In the future, we will collect more specific gene types and further investigate their potential relationship using these formulas.
Impact Statement
Introduction
Thalassaemia is a typically monogenic disease caused by mutations or deletions in the globin gene. The prevalence of thalassaemia is highest in Guangxi, a region in southern China. About one in four to five people carry the thalassaemia gene, and one in 55 families has a newborn at risk of thalassaemia major (Xiangmin et al. Citation2011).
Potential molecular defects in the α-globin or β-globin gene clusters form the basis for defects in haemoglobin synthesis and various genetic forms of α-thalassaemia or β-thalassaemia (Taher et al. Citation2018). Healthy individuals have four α genes (αα/αα) in chromosome 16 which control α globin chain production, two on each chromosome. α-Thalassaemia is the result of decreased or absent production of α-globin chain synthesis, leading to the accumulation of β-globin chains. The α-thalassaemia is classified by the number of deleted (or mutated) α-globin genes: (1)one deletion gene (α+-thalassaemia). (2) Two deletions gene on the same chromosome or cis-chromosome (α0-thalassaemia). (3) Three deletions gene (HbH disease). (4) Four deletions gene (hydrops fetalis with Hb Bart’s). In this article, we classified the α-thalassaemia as –α/αα, αTα/αα, –/αα, –/–α, ‘–’ represents α gene deletion, ‘T’ represents α gene mutation. There is a β-globin gene on each chromosome 11 of normal individuals which controls β-globin synthesis. The underlying reason for β-thalassaemia is usually caused by the point mutations of β-globin genes, which lead to the result of deficiency or absent synthesis of β-globin chains, as well as an accumulation of α-chains. Hence, the β-thalassaemia can be divided into two categories: (1)the total absence of β-globin subunit (β0/N). (2) Reduced production of β-globin subunit (β+/N)(Muncie and Campbell Citation2009).
When the α- and β-globin chains are out of balance, patients develop various pathological indications. Therefore, many complications that occur with thalassaemia can be grouped as (1) ineffective erythropoiesis, (2) iron overload from regular blood transfusions, (3) transfusion-transmitted infections, (4) toxicities of iron chelation therapy, (5) bacterial infectionsand (6) hypercoagulability (Cunningham et al. Citation2004). Serious thalassaemia occurs in homozygotes or compound heterozygous genotypes. Carriers show no significant difference to normal individuals. However, if parents are carriers, the likelihood of producing offspring with homozygous or compound heterozygous genotypes is high. Therefore, screening of pregnant women is a key step in reducing the incidence of thalassaemia. After a period of observation, we found significant differences in the haematological indicators of pregnant women with different types of thalassaemia gene carriers. By comparing and evaluating haematological parameters, formulas in the literature, we tried to reveal potential differences in pregnant women carrying different types of thalassaemia genes and provide a simple and economical screening procedure. Therefore, it can effectively prevent the occurrence of thalassaemia and provide the necessary basis for preventive health care for pregnant women. In our study, we collected the results of haematological indicators of pregnant women who underwent screening for thalassaemia at the People’s Hospital of Guangxi Zhuang Autonomous Region and the First Affiliated Hospital of Guangxi University of Traditional Chinese Medicine from 2019 to 2021, and statistically analysed the data between the groups.
Materials and methods
Literature search
PubMed and Google Scholar were searched for literature applying RBC parameters to evaluate thalassaemia. We focussed on the AUC > 0.700 (95% CI). These formulas included (England and Fraser Citation1973, Mentzer Citation1973, Srivastava and Bevington Citation1973, Shine and Lal Citation1977, Ricerca et al. Citation1987, Green and King Citation1989, Ehsani et al. Citation2005, Sirdah et al. Citation2008): (1) Mentzer formula (MCV/RBC). (2) Ricerca formula 1 (RDW × MCV/RBC). (3) Sirdah formula (MCV-RBC-3 × Hb). (4) Ehsani formula (MCV-10×RBC). (5) Srivastava formula (MCH/RBC). (6) Green and King formula (MCV2 RDW/Hb×100). (7) England and Fraser formula (MCV-RBC-5 × Hb-3.4). (8) Ricerca formula 2 (RDW/RBC). (9) Shine and Lal formula (MCV2×MCH/100). These formulas were used to differentiate the β‐thalassaemia minor from iron deficiency in previous research, but hadnot evaluated the ability of differentiation of thalassaemia. In this study, all formulas were used to detect the different thalassaemia genotypes and were further used to assess their area under the curve (AUC), cut-off value, sensitivity and specificity.
Detection of peripheral blood parameters and thalassemia genes
Gestational weeks (GWs) used in this study were completed weeks. Four hundred and forty-eight cases were collected and analysed. Details are mentioned in .
Table 1. Demographic details for the studied pregnant women.
We retrospectively reviewed the laboratory data of pregnant women in the People’s Hospital of Guangxi Zhuang Autonomous Region and the First Affiliated Hospital of Guangxi University of Chinese Medicine between 2019 and 2021. In the morning, 2–3 ml blood was drawn from each subjects’ vein into the vacutainer containing EDTA, and then blood cell count was conducted in two hours. The peripheral red cell parameters, including RBC, Hb, HCT, MCV, MCH, MCHC and RDW, were determined within two hours (BC-6000Plus, Mindray, Shenzhen, China). Also, HbA2 was tested (VARIANT II, BIO-RAD, Hercules, CA). Genomic DNA was extracted from the peripheral blood via standard methods according to the instruction of kit (Hybribio, Guangzhou, China). Multiplex gap-PCR analyses were employed to confirm the subtypes of α-thalassaemia and β-thalassaemia. The normal groups were the pregnant women whose thalassaemia genes were negative.
Statistical analysis
First of all, outlier exclusion was investigated. Data points were calculated and excluded via Grubbs’ test with the GraphPad (GraphPad Software, La Jolla, CA) (https://www.graphpad.com/quickcalcs/grubbs1/). Statistical analysis was performed in GraphPad Prism v8.4.3 (GraphPad Software, La Jolla, CA). Unpaired comparisons were conducted using a one-way ANOVA or Kruskal–Wallis test (after the mentioned log(2) transformations and then assessment for normality and lognormality tests) with Tukey’s or Dunn’s multiple comparison test. Receiver operator characteristic curve and AUC (95% confidence interval) were used to calculate and judge the cut-off value, sensitivity and specificity. The significance level for all tests was .05.
Results
In our study, data on peripheral blood parameters were retrospectively collected from thalassaemia carriers with varying degrees of deletion or mutation of the globin gene.
Peripheral red cell parameters comparison
The different thalassaemia showed variations in RBC parameters. We compared them with different aspects in the following. The results are shown in Figure S1.
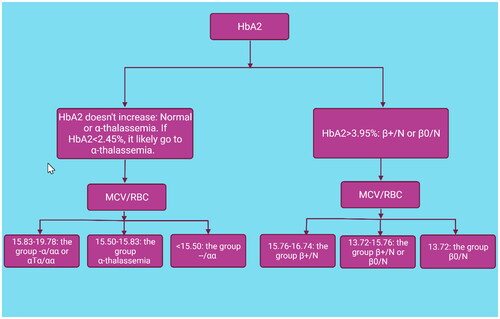
Figure 1. Workflow distinguishes thalassaemia by using the HbA2 and the Mentzer formula in pregnant women.
The differences in indicators between thalassaemia and normal groups were diverse. Most of the thalassaemia groups had a significant increase in RBC and RDW, while they showed a decrease in Hb, MCV, MCH and MCHC. It is worth noting that –/αα, β+/N and β0/N varied the most. Similar characteristics were observed in the –α/αα and αTα/αα groups. However, –/αα can exhibit dramatically different characteristics compared to these two groups. Interestingly, there was no significant difference in HCT between these three groups. There was no significant difference in RBC, HCT, RDW and MCHC between the β+/N and β0/N groups. However, the group β+/N was significantly higher than the group β0/N in HB, MCVand MCH. –/αα thalassaemia indicated a similar landscape to β-thalassaemia. Thus, –α/αα and αTα/αα thalassaemia differed from β-thalassaemia, especially for RDW, MCV and MCH.
Comparison between normal group and α-thalassaemia or β-thalassaemia in HbA2
HbA2 was significantly smaller in αTα/αα and –/αα thalassaemia than in the normal and β-thalassaemia groups, while the β-thalassaemia group showed the highest levels in these groups (Figure S1). When the groups αTα/αα and –/αα were compared to the normal group, the AUC was 0.7756, and the cut-off value was 2.45%. The sensitivity and specificity were 75.52% and 71.11%, respectively. A comparison between the β-thalassaemia group and the normal group showed better results. The AUC was 1.000 and the critical value was 3.95%. Both sensitivity and specificity were 100% (Figure S2).
Investigate the different types of thalassaemia by using chosen formulas
These formulas show different abilities to differentiate thalassaemia. The Mentzer formula (MCV/RBC) shows the strongest ability and will be evaluated in terms of AUC, the cut-off value, sensitivity and specificity (Figure S3).
Evaluate the power of the Mentzer formula (MCV/RBC)
Although it was insignificant between the group –α/αα and αTα/αα, Mentzerformula still showed good performance in distinguishing other types of thalassaemia. For example, when the β+/N thalassaemiawas compared to the β0/N thalassaemia, the AUC is 0.7161 together with high sensitivity and specificity (Figure S4).
Discussion
Thalassaemia, which is an autosomal inherited blood disorder, has a high prevalence in southern China. The mechanism of α-thalassaemia is the deletion or point mutation of the α-globin gene, which reduces the level of α-globin. β-Thalassaemia is caused by more than 200 point mutations, and rarely by deletions. In the Guangxi region, CD41-42 (-CTTT) accounts for 45.2%, followed by CD17 (AAG > TAG), at about 24.7% (Rund and Rachmilewitz Citation2005). The balance between the α-globin peptide chain and the β-globin peptide chain is disrupted, resulting in reduced or unabledsynthesisof normal haemoglobin, resulting in anaemia in patients (Galanello and Origa Citation2010). However, the importance of screening for thalassaemia is neglected in some remote areas because they lack some of the necessary techniques such as PCR and DNA-seq. Our work experience may provide a simple and economical tool to reduce the incidence of thalassaemia.
From the 1970s, various formulas from red cell parameters were used for distinguishing thalassaemia. However, most of them are used to differentiate between the β-thalassaemia minor from iron deficiency. Sirdah et al. evaluated the ability of the above formulas in distinguishing these two kinds of diseases by investigating 2196 samples (Sirdah et al. Citation2008). Most of them showed excellent analytical power with an AUC greater than 0.70. However, studies using these parameters to screen pregnant women for different types of thalassaemia seem to be scarce. We found that red cell parameters in various thalassaemia differed significantly in pregnant women. Therefore, we tried to evaluate the possibility of using these formulas to classify the various thalassaemia. However, the results were disappointing and most of them did not show the same excellent ability as before. For example, Sirdahformula cannot distinguish the group β+/N from the group β0/N. After comparing these results, we noticed that only Mentzerformula and Ricercaformula one showed similar possibility of using in this field. When we calculated the AUC of the Ricerca formula one, it showed poor efficiencies that some AUCs were smaller than 0.7 (data not publish). Our data showed that the Mentzer formula had a strong ability to discriminate between different types of thalassaemia, especially between the group –α/αα, αTα/αα vs. –/αα, the normal group vs. –/αα, the group β+/N or β0/N vs. the normal group. Most AUCswere larger than 0.900 and the sensitivity and specificity were approximately larger than 90% at the same time.
ROC analysis is used in clinical epidemiology to quantify how accurately a medical diagnostic test (or system) distinguishes between two patient states (commonly referred to as ‘diseased’ and ‘nondiseased’)(Hajian-Tilaki Citation2013). The area under the ROC curve (AUC) is a portion of the area of the unit square. Its value is between 0 and 1.0 (Streiner and Cairney Citation2007). Typically, the greater the AUC, the parameters or formulas are more accurate. Meanwhile, if the sensitivity and specificity are higher, the more reliable the parameter or formula is. Normally, the closer the AUC is to 1.00, the more perfect the differentiation is, but an AUC less than 0.50 indicates that the differentiation is worthless. Form our research, the result shows high AUC, sensitivity and specificity in α-thalassaemia and β-thalassaemia. Mentzerformula used 13 as the cut-off value in distinguishing β-thalassaemia and iron deficiency (Mentzer Citation1973). However, we did not observe similar results in our study. The underlying reason could be that the pregnancy status influenced the changes in red blood cell parameters. During pregnancy, the maternal blood system undergoes profound changes to meet the physiological needs of the foetal development and the mother. These changes are principally influenced by changes in the hormonal milieu. Red cell mass is increased after pregnancy driven by an increase in maternal erythropoietin production. Meanwhile, an increase in MCV is observed. The average increase in women with sufficient iron is 4 fl. Moreover, MCV increases constantly during pregnancy, but the increase is not statistically significant (Lurie Citation1993, Lurie and Mamet Citation2000). Other red blood cell indices seem to change little in pregnancy excluding Hb dropping (Chandra et al. Citation2012). It may explain why the cut-off value of Mentzer formula changes when used in pregnant women with β-thalassaemia.
The HbA2 and the Mentzer formula show strong power in differentiating these thalassaemia. Based on our data, we try to use a combination of HbA2 and Mentzerformula to screen for different types of thalassaemia. First of all, HbA2 divides them into two groups. If it is greater than 3.95%, they will go to the group β-thalassaemia. Otherwise, they move to the group normal or α-thalassaemia. Although there is no significance between the group α-thalassaemia, the group αTα/αα and –/αα is significantly smaller than the normal group. We recommend that they are more possible to move to the group αTα/αα and –/αα if the HbA2 < 2.45%. Definitely, they will be confirmed exactly by the Mentzer formula later on. Based on the Mentzer formula, there are three situations in the group β-thalassaemia: (1)when the result is between 15.76 and 16.74, they go to the group β+/N. (2) When the result is between 13.72 and 15.76, they are in the group β+/N or β0/N. (3) When the result is smaller than 13.72, they go to the group β0/N. Similarly, there are three situations in the group α-thalassaemia based on the Mentzer formula: (1)when the result is between 15.83 and 19.78, they go to the group –α/αα and αTα/αα. (2) When the result is between 15.5 and 15.83, it cannot distinguish the α-thalassaemia clearly. Fortunately, this range is very narrow. (3) When the result is smaller than 15.5, they go to the group –/αα ().
Conclusions
Based on the Mentzer formula, we can further classify the different genotypes of thalassaemia. The haematological parameters differ also between populations. The gold standard is still PCR. After screening the potential patients, we suggest that people can further confirm the specific genetics using PCR, even next-generation sequencing (NGS). Although our method is a screening method and cannot replace thalassaemia gene detection in pregnant women, the combinatory use of HbA2 and Mentzer formula as an algorithm could be a very simple and quick way to screen for these common thalassaemia in pregnant women. It provides a promising value in preventing the prevalence of thalassaemia and health care of pregnant women, especially in economically underdeveloped areas.
Ethical approval
The study was conducted in accordance with good Clinical Practice and the Declaration of Helsinki. The protocol was approved by the Ethics Committee of the People’s Hospital of Guangxi Zhuang Autonomous Region. Informed consent was obtained from all individual participants included in the study.
Author contributors
All authors have made a significant contribution to the paper and are listed in this paper. Those who do not fulfil the ICMJE Criteria for Authorship have been credited in the acknowledgement section. All authors reviewed and edited the manuscript and approved the final version of the manuscript.
Supplemental Material
Download Zip (1.2 MB)Acknowledgements
We thank the patients, their families, and the study teams who participated in the investigation.
Disclosure statement
No potential conflict of interest was reported by the author(s).
Data availability statement
The data that support the findings of this study are available from the corresponding author, Hangjiu Su, upon reasonable request.
Additional information
Funding
References
- Chandra, S., et al., 2012. Physiological changes in hematological parameters during pregnancy. Indian Journal of Hematology & Blood Transfusion, 28 (3), 144–146.
- Cunningham, M.J., et al., 2004. Complications of beta-thalassemia major in North America. Blood, 104 (1), 34–39.
- Ehsani, M., et al., 2005. A new formula for differentiation of iron deficiency anemia (IDA) and thalassemia trait (TT). Turkish Journal of Hematology, 22, 268.
- England, J.M. and Fraser, P.M., 1973. Differentiation of iron deficiency from thalassaemia trait by routine blood-count. Lancet, 1 (7801), 449–452.
- Galanello, R. and Origa, R., 2010. Beta-thalassemia. Orphanet Journal of Rare Diseases, 5, 11.
- Green, R. and King, R., 1989. A new red cell discriminant incorporating volume dispersion for differentiating iron deficiency anemia from thalassemia minor. Blood Cells, 15 (3), 481–491, discussion 492–495.
- Hajian-Tilaki, K., 2013. Receiver operating characteristic (ROC) curve analysis for medical diagnostic test evaluation. Caspian Journal of Internal Medicine, 4 (2), 627–635.
- Lurie, S., 1993. Changes in age distribution of erythrocytes during pregnancy: a longitudinal study. Gynecologic and Obstetric Investigation, 36 (3), 141–144.
- Lurie, S. and Mamet, Y., 2000. Red blood cell survival and kinetics during pregnancy. European Journal of Obstetrics, Gynecology, and Reproductive Biology, 93 (2), 185–192.
- Mentzer, W.C., Jr., 1973. Differentiation of iron deficiency from thalassaemia trait. Lancet, 1 (7808), 882.
- Muncie, H.L. Jr. and Campbell, J., 2009. Alpha and beta thalassemia. American Family Physician, 80 (4), 339–344.
- Ricerca, B.M., et al., 1987. Differentiation of iron deficiency from thalassaemia trait: a new approach. Haematologica, 72 (5), 409–413.
- Rund, D. and Rachmilewitz, E., 2005. Beta-thalassemia. New England Journal of Medicine, 353 (11), 1135–1146.
- Shine, I. and Lal, S., 1977. A strategy to detect beta-thalassaemia minor. Lancet, 1 (8013), 692–694.
- Sirdah, M., et al., 2008. Evaluation of the diagnostic reliability of different RBC indices and formulas in the differentiation of the beta-thalassaemia minor from iron deficiency in Palestinian population. International Journal of Laboratory Hematology, 30 (4), 324–330.
- Srivastava, P.C. and Bevington, J.M., 1973. Iron deficiency and-or thalassaemia trait. Lancet, 1 (7807), 832.
- Streiner, D.L. and Cairney, J., 2007. What’s under the ROC? An introduction to receiver operating characteristics curves. Canadian Journal of Psychiatry. Revue Canadienne de Psychiatrie, 52 (2), 121–128.
- Taher, A.T., Weatherall, D.J., and Cappellini, M.D., 2018. Thalassaemia. Lancet, 391 (10116), 155–167.
- Xiangmin, X., Xinhua, Z., and Lili, C., 2011. Guidelines for Thalassemia Prevention and Control Programme. Beijing: People’s Military Medical Press.