

Abstract
Background
To evaluate the value of the platelet-to-lymphocyte ratio (PLR) in predicting preeclampsia (PE) in pregnant women.
Methods
PubMed, EMBASE and Web of Science databases were searched for observational studies (cohort, case-control or cross-sectional) that reported pre-treatment maternal PLR values in women with and without PE. The analysis was done using a random effects model. Pooled effect sizes were reported as weighted mean difference (WMD) with 95% confidence intervals (CIs). Newcastle-Ottawa Scale (NOS) was used to evaluate the risk of bias.
Results
Twenty-five studies with 7755 patients were included in this meta-analysis. PLR was comparable in patients with PE and healthy pregnant women (WMD −2.97; 95% CI: −11.95 to 6.02; N = 16). Patients with mild (WMD −3.00; 95% CI: −17.40 to 11.41; N = 12) and severe PE (WMD −5.77; 95% CI: −25.48 to 13.94; N = 14) had statistically similar PLR, compared to healthy controls.
Conclusions
Our findings show similar PLR in PE and healthy pregnancies. PLR, therefore, may not be used to differentiate between PE and normal pregnancy or for assessing the severity of PE. The majority of included studies were case-control, potentially introducing bias, and we identified evidence of publication bias as well.
Plain Language Summary
This study assessed the use of the platelet-to-lymphocyte ratio (PLR) for the prediction of preeclampsia (PE) in pregnant women. After reviewing 25 studies involving 7755 pregnant women, the researchers found that PLR values were similar in women with PE and those with healthy pregnancies. Additionally, PLR did not differ significantly in cases of mild or severe PE, compared to healthy pregnancies. This study concluded that the PLR may not a reliable predictor for PE in pregnant women, nor can it be used to assess the severity of PE. Further research is needed to identify more effective methods for predicting and managing PE in pregnant women.
Introduction
Preeclampsia (PE) is a condition that occurs exclusively during pregnancy and is characterised by the development of hypertension and proteinuria (Duley Citation2009, Ives et al. Citation2020). PE occurs in approximately 2–8% of all pregnancies and is considered a significant obstetric complication due to the associated maternal and neonatal complications (Duley Citation2009, Madazli et al. Citation2014, Wadhwani et al. Citation2020). Timely identification and accurate prediction of PE are crucial for appropriate management and improved outcomes for affected women and offspring.
Current research focuses on identifying new reliable biomarkers that can aid in the early prediction and assessment of PE (Petla et al. Citation2013, Danielli et al. Citation2022, MacDonald et al. Citation2022). The platelet-to-lymphocyte ratio (PLR) has emerged as a potential predictor of various autoimmune and cardiovascular diseases (Gasparyan et al. Citation2019, Kurtul and Ornek Citation2019, Wang et al. Citation2023). Numerous studies attempted to examine the potential of PLR as a biomarker and evaluate its effectiveness in predicting the severity of the various diseases and associated complications (Zhou et al. Citation2019, Liu et al. Citation2022, Simadibrata et al. Citation2022). While some studies suggested that PLR may be considered a potential marker for assessing the presence of inflammation and the immune response in cases of PE, the research findings are inconclusive (Gezer et al. Citation2016, Sitotaw et al. Citation2018, Mannaerts et al. Citation2019, Elmaradny et al. Citation2022, Yakiştiran et al. Citation2022, Ozkan et al. Citation2023). Some studies have indicated a notable increase in PLR in patients with pre-eclampsia compared to women with uncomplicated pregnancies (Gezer et al. Citation2016, Yakiştiran et al. Citation2022). This elevated PLR could potentially indicate an inflammatory response and an imbalance in the immune system, associated with pre-eclampsia. However, other studies report lack of significant differences or even a decrease in PLR levels in women with pre-eclampsia compared to healthy pregnancies (Sitotaw et al. Citation2018, Mannaerts et al. Citation2019, Elmaradny et al. Citation2022, Ozkan et al. Citation2023). It is important to note that additional factors like gestational age, maternal age and underlying health conditions might influence PLR values, and their impact should be considered when interpreting the results of these studies.
The main aim of this analysis was to summarise current evidence and to investigate whether there is a significant difference in PLR values between women with PE and those with normal pregnancies. Additionally, we aimed to assess whether PLR values show correlation with the severity of PE. Our results may provide an insight on whether PLR may be integrated into a routine clinical assessment for a comprehensive evaluation of pre-eclampsia. This may allow further aid in risk stratification, management decisions and potential interventions.
Methods
Search strategy
PubMed, Embase and Web of Science databases were comprehensively searched for the relevant English language studies, published up to 15 May 2023, using combinations of keywords: (‘Platelet-to-Lymphocyte Ratio’ OR ‘PLR’ OR ‘blood parameters’ OR ‘blood count’ OR ‘platelets’ OR ‘lymphocytes’) AND (‘preeclampsia’ OR ‘eclampsia’ OR ‘gestational hypertension’). Manual searches of reference lists and relevant review articles were also conducted for any missed eligible studies.
Study selection criteria
We included: (1) studies that investigated the link between pre-treatment maternal PLR and PE; (2) studies that included PE patients and healthy pregnant women as a control group; (3) English-language observational studies (cohort, case-control or cross-sectional) from peer-reviewed journals.
Reports not meeting the inclusion criteria, studies with incomplete or insufficient data to calculate effect sizes (mean differences), conference abstracts, case reports, editorials, reviews and animal studies were not considered for inclusion.
Selection of studies
Following the execution of the search strategy in the three designated databases, duplicate studies were removed. Two reviewers then independently searched titles and abstracts for relevant publications for further evaluation. In the subsequent stage, the full text of the chosen studies was carefully assessed to determine whether they met the criteria for inclusion in our meta-analysis. This comprehensive assessment involved a detailed examination of the methodology and the results sections of each study. Any discrepancies or disagreements regarding the inclusion of studies were resolved through in-depth discussions among the study authors.
Risk of bias assessment and data extraction
We used Newcastle-Ottawa Scale (NOS) (Well et al. Citation2023) to evaluate the risk of bias. Data extraction from the final set of included studies was carried out independently by two authors using a standardised data extraction form. Any discrepancies during this process were resolved by discussion. A third senior author was consulted to provide additional insight and expertise when needed to facilitate consensus among the authors. In studies where the effect sizes were reported as median with range (minimum–maximum), we adopted the method by Hozo et al. to derive mean and standard deviation (Hozo et al. Citation2005).
Statistical analysis
We decided to employ a random-effects model for all analyses. This choice was motivated by the observed variations in study characteristics, including baseline characteristics of the patients, study settings, sample size and severity of PE considered. These variations had the potential to introduce substantial heterogeneity in the reported findings. By using a random-effects model, we aimed to address this expected heterogeneity. Pooled effect sizes were reported as weighted mean difference (WMD), with corresponding 95% confidence interval (CI). The I-squared statistic was utilised to assess the presence of statistical heterogeneity. Higher values of I2 (>40%) indicated greater heterogeneity in the included studies (Cochrane Handbook for Systematic Reviews of Interventions Citation2023). An evaluation of publication bias was conducted by Egger’s test and funnel plots (Egger et al. Citation1997). A p value less than .05 indicated statistical significance. We conducted subgroup analysis based on the country of the study, total sample size, sample size in the PE group and NOS quality score obtained by the included studies.
Adherence to relevant guidelines
This study was conducted according to the PRISMA guidelines (Page et al. Citation2021, PRISMA Citation2023), and the protocol of the study was registered in the International Prospective Register of Systematic Reviews (PROSPERO). The registration number assigned to this study protocol in PROSPERO is CRD42023429260.
Results
Our search strategy identified 2948 studies (). After removal of duplicates, titles and abstracts of the remaining 2057 unique studies were evaluated. Additional 2006 reports did not meet eligibility criteria and were excluded. Of the remaining 51 studies, 26 did not meet the necessary criteria and were excluded. Finally, 25 studies with 7755 patients were selected for our analysis () (Yavuzcan et al. Citation2014, Kirbas et al. Citation2015, Gezer et al. Citation2016, Toptas et al. Citation2016, Jeon et al. Citation2017, Yücel and Ustun Citation2017, Çintesun et al. Citation2018, Kim et al. Citation2018, Sitotaw et al. Citation2018, Gogoi et al. Citation2019, Kholief et al. Citation2019, Mannaerts et al. Citation2019, Örgül et al. Citation2019, Syahputra et al. Citation2019, Bayram and Karaşin Citation2021, Gamal El-Din Mahmoud et al. Citation2021, Oğlak et al. Citation2021, Singgih et al. Citation2021, Taşkömür and Erten Citation2021, Elmaradny et al. Citation2022, Madendag et al. Citation2022, Yakiştiran et al. Citation2022, Cui et al. Citation2023, Maziashvili et al. Citation2023, Ozkan et al. Citation2023). summarises the specific details of the included studies.
Figure 1. Selection process of studies included in the review.
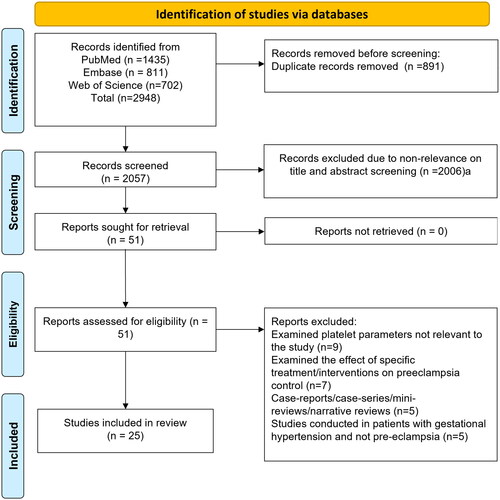
Table 1. Studies included in the meta-analysis and their characteristics.
The quality assessment scores for the studies varied between 6 and 8 on the NOS, which has a maximum possible score of 9. On average, the included studies received a mean NOS score of 7.1. Most of the studies (n = 13) were conducted in Turkey. Two studies were carried out in Indonesia, the Republic of Korea and Egypt. One study was conducted in China, Georgia, Saudi Arabia, Belgium, India and Ethiopia. Regarding the study designs, most of the studies (n = 11) had a case-control design. Five studies were cross-sectional, while eight studies were retrospective and used data from registries or medical records. Only one study adopted a prospective cohort design.
PLR in patients with preeclampsia and healthy controls
PLR was comparable in patients with PE and healthy pregnant women (WMD −2.97; 95% CI: −11.95 to 6.02; I2 = 86.3%; N = 16) (). Egger’s test and funnel plots did not show the presence of publication bias (p > .05) (Supplementary Figure 1). Subgroup analysis also did not show any significant distinction in the PLR between women with PE and healthy pregnancies across the different subgroups ().
Figure 2. Weighted mean difference (WMD) of PLR between cases with preeclampsia and healthy controls.
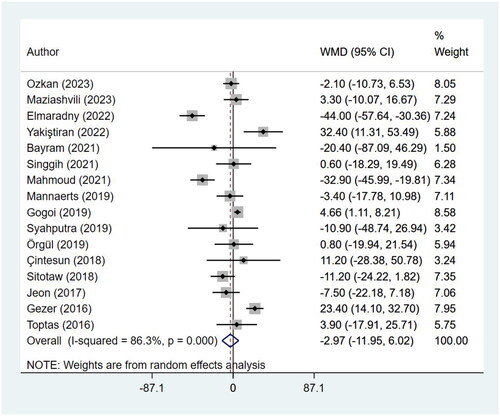
Table 2. Findings of the subgroup analysis between preeclampsia and the healthy controls.
PLR in patients with mild preeclampsia and healthy controls
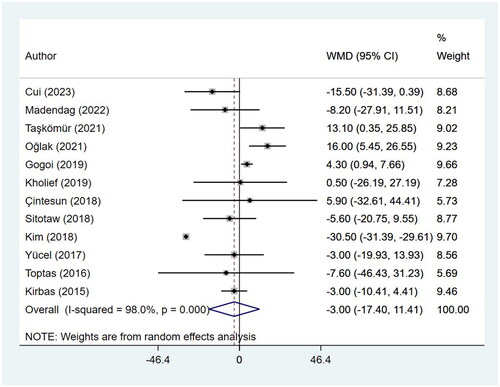
Women with mild PE had statistically similar PLR, compared to healthy pregnant women (WMD −3.00; 95% CI: −17.40 to 11.41; I2 = 98.0%; N = 12) (). Publication bias was detected on Egger’s test (p = .024) and on the funnel plot (Supplementary Figure 2).
Figure 3. Weighted mean difference (WMD) of PLR between cases with mild preeclampsia and healthy controls.
PLR in patients with severe preeclampsia and healthy controls
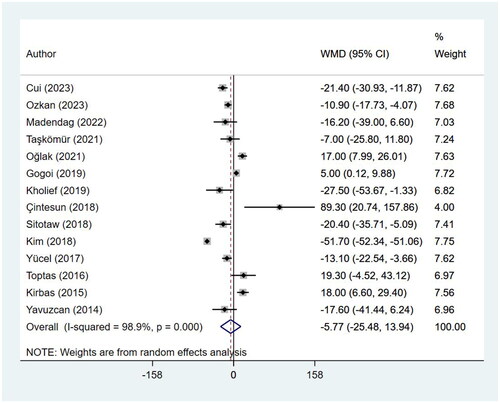
Women with severe PE had statistically similar PLR, compared to healthy control group (WMD −5.77; 95% CI: −25.48 to 13.94; I2 = 98.9%; N = 14) (). Publication bias was detected on Egger’s test (p = .001) and on the funnel plot (Supplementary Figure 3).
Figure 4. Weighted mean difference (WMD) of PLR between cases with severe preeclampsia and healthy controls.
Discussion
The results of this study show no significant difference in the PLR between women with PE and healthy pregnant women. Similar findings were reported for the analysis based on the severity of PE. This implies that PLR may not serve as a reliable biomarker for distinguishing between PE and normal pregnancies. One possible explanation for the lack of significant difference in PLR between PE and healthy pregnant controls could be related to the complex pathophysiology of PE. It is widely accepted that PE is a multifactorial disorder involving various mechanisms, including inflammation, endothelial dysfunction, oxidative stress and immune dysregulation (Uzan et al. Citation2011, Gathiram and Moodley Citation2016). PLR, as a marker of systemic inflammation, may be influenced by several factors other than PE, such as maternal age, gestational age and other comorbidities (Akgun et al. Citation2017, Hershko Klement et al. Citation2018). These confounding factors might mask the potential association between PLR and PE.
Our analysis revealed comparable PLR in women with mild PE and women with healthy pregnancies. Similarly, comparable PLR was observed in women with severe PE and healthy pregnant women. This suggests that PLR may not be a useful marker for distinguishing between different stages of PE or assessing disease severity. Alternative biomarkers, including placental growth factor (PlGF), soluble fms-like tyrosine kinase-1 (sFlt-1) and neutrophil–lymphocyte ratio (NLR) have demonstrated stronger associations with the severity of PE and may offer more accurate prognostic information (Chau et al. Citation2017, Kang et al. Citation2020, Leaños-Miranda et al. Citation2020). The heterogeneity among the included studies should also be considered when interpreting the results of this meta-analysis. Variations in study design, patient populations, sample sizes and laboratory techniques may have contributed to the observed heterogeneity. Different studies may have employed varying techniques for measuring PLR, leading to inconsistent results. Variations in laboratory protocols, such as blood collection methods, platelet and lymphocyte counting techniques, and timing of sample collection, can introduce variability and affect the accuracy and comparability of PLR measurements. Standardising measurement techniques across studies is, therefore, crucial to reduce variability.
While our study did not show a significant finding, it does indicate the need for sequential measurement of PLR throughout pregnancy to identify the most appropriate gestational age for sampling and to capture potential dynamic changes in PLR that might be linked with the development of PE. Furthermore, PLR should be evaluated in conjunction with conventional PE markers, such as blood pressure measurements, proteinuria and inflammatory markers. Combining PLR with established markers in predictive models may enhance the overall efficiency and accuracy of PE prediction. Future research should focus on constructing robust prediction models, conducting large prospective studies, and validating the findings in diverse populations to fully explore the potential of PLR as a predictive marker for PE.
Limitations
It is important to acknowledge some limitations of this meta-analysis. First, although we conducted a thorough quality assessment of the included studies, potential biases and limitations inherent in the original studies cannot be completely ruled out. These factors may have influenced the overall effect estimate. Second, the majority of reports in our analysis were case-control studies that are susceptible to selection bias, particularly with respect to the choice of controls. Finally, we found statistical evidence of publication bias.
Conclusions
Our findings suggest a lack of significant difference in PLR between PE and healthy pregnancies. PLR, therefore, is not a useful biomarker for distinguishing between PE and normal pregnancies or assessing disease severity. Further research is needed to identify more reliable and specific biomarkers for the early detection and management of PE. Large-scale prospective cohort studies are warranted to accurately assess the role of PLR in PE. These studies would provide more robust evidence of the association between PLR and PE, overcome limitations of small sample sizes, account for potential confounding variables, and offer longitudinal data to evaluate PLR dynamics throughout pregnancy. Such studies may also have the potential to enhance our understanding of PLR as a biomarker for PE and its clinical utility in risk prediction and management strategies.
Author contributions
All authors contributed to the study conception and design. Material preparation, data collection and analysis were performed by TQ, XD, JL and MF. MF wrote the manuscript and all authors approved the manuscript.
Ethics approval
None.
Supplemental Material
Download Zip (135 KB)Disclosure statement
The authors report there are no competing interests to declare.
Data availability statement
The authors confirm that the data supporting the findings of this study are available within the article and its supplementary materials.
Additional information
Funding
References
- Akgun, N., et al., 2017. Correlations of maternal neutrophil to lymphocyte ratio (NLR) and platelet to lymphocyte ratio (PLR) with birth weight. Journal of Maternal-Fetal & Neonatal Medicine, 30 (17), 2086–2091.
- Bayram, F. and Karaşin, S.S., 2021. The predictive role of neutrophil–lymphocyte ratio, platelet lymphocyte ratio, and other complete blood count parameters in eclampsia and HELLP syndrome. Journal of Surgery and Medicine, 5 (12), 1202–1205.
- Chau, K., Hennessy, A., and Makris, A., 2017. Placental growth factor and pre-eclampsia. Journal of Human Hypertension, 31 (12), 782–786.
- Çintesun, E., et al., 2018. Systemic inflammatory response markers in preeclampsia. Journal of Laboratory Physicians, 10 (3), 316–319.
- Cochrane Handbook for Systematic Reviews of Interventions, 2023. Available from: https://training.cochrane.org/handbook [Accessed 12 Feb 2023].
- Cui, H.X., et al., 2023. Neutrophil-to-lymphocyte ratio (NLR) as a predictive index for liver and coagulation dysfunction in preeclampsia patients. BMC Pregnancy and Childbirth, 23 (1), 4.
- Danielli, M., et al., 2022. Blood biomarkers to predict the onset of pre-eclampsia: a systematic review and meta-analysis. Heliyon, 8 (11), e11226.
- Duley, L., 2009. The global impact of pre-eclampsia and eclampsia. Seminars in Perinatology, 33 (3), 130–137.
- Egger, M., et al., 1997. Bias in meta-analysis detected by a simple, graphical test. BMJ (Clinical Research ed.), 315 (7109), 629–634.
- Elmaradny, E., et al., 2022. Predictive values of combined platelet count, neutrophil–lymphocyte ratio, and platelet–lymphocyte ratio in preeclampsia. Journal of Obstetrics and Gynaecology, 42 (5), 1011–1017.
- Gamal El-Din Mahmoud, A., et al., 2021. First-trimester neutrophil-to-lymphocyte and platelet-to-lymphocyte ratios as indicators for early diagnosis of preeclampsia. Al-Azhar Medical Journal, 50 (2), 1059–1074.
- Gasparyan, A.Y., et al., 2019. The platelet-to-lymphocyte ratio as an inflammatory marker in rheumatic diseases. Annals of Laboratory Medicine, 39 (4), 345–357.
- Gathiram, P. and Moodley, J., 2016. Pre-eclampsia: its pathogenesis and pathophysiology. Cardiovascular Journal of Africa, 27 (2), 71–78.
- Gezer, C., et al., 2016. High first-trimester neutrophil-to-lymphocyte and platelet-to-lymphocyte ratios are indicators for early diagnosis of preeclampsia. Ginekologia Polska, 87 (6), 431–435.
- Gogoi, P., et al., 2019. Neutrophil-to-lymphocyte ratio and platelet indices in pre-eclampsia. International Journal of Gynaecology and Obstetrics, 144 (1), 16–20.
- Hershko Klement, A., et al., 2018. Neutrophils to lymphocytes ratio and platelets to lymphocytes ratio in pregnancy: a population study. PLOS One, 13 (5), e0196706.
- Hozo, S.P., Djulbegovic, B., and Hozo, I., 2005. Estimating the mean and variance from the median, range, and the size of a sample. BMC Medical Research Methodology, 5 (1), 13.
- Ives, C.W., et al., 2020. Preeclampsia-pathophysiology and clinical presentations: JACC state-of-the-art review. Journal of the American College of Cardiology, 76 (14), 1690–1702.
- Jeon, Y.L., et al., 2017. Modified complete blood count indices as predicting markers of preeclampsia from gestational hypertension: neutrophil to lymphocyte ratio, platelet to lymphocyte ratio, and platelet to neutrophil ratio. Clinical Laboratory, 63 (11), 1897–1902.
- Kang, Q., et al., 2020. Predictive role of neutrophil-to-lymphocyte ratio in preeclampsia: a meta-analysis including 3982 patients. Pregnancy Hypertension, 20, 111–118.
- Kholief, A., et al., 2019. Neutrophil/lymphocyte ratio, platelet/lymphocyte ratio, and C-reactive protein as markers for severity of pre-eclampsia. Research and Opinion in Anesthesia and Intensive Care, 6 (1), 1.
- Kim, M.-A., et al., 2018. Clinical significance of platelet-to-lymphocyte ratio in women with preeclampsia. American Journal of Reproductive Immunology (New York, N.Y. : 1989), 80 (1), e12973.
- Kirbas, A., et al., 2015. Prediction of preeclampsia by first trimester combined test and simple complete blood count parameters. Journal of Clinical and Diagnostic Research, 9 (11), QC20–QC23.
- Kurtul, A. and Ornek, E., 2019. Platelet to lymphocyte ratio in cardiovascular diseases: a systematic review. Angiology, 70 (9), 802–818.
- Leaños-Miranda, A., et al., 2020. Usefulness of the sFlt-1/PlGF (soluble fms-like tyrosine kinase-1/placental growth factor) ratio in diagnosis or misdiagnosis in women with clinical diagnosis of preeclampsia. Hypertension (Dallas, Tex.: 1979), 76 (3), 892–900.
- Liu, Y., et al., 2022. Platelet-to-lymphocyte ratio predicts the presence of diabetic neurogenic bladder. Diabetes, Metabolic Syndrome and Obesity, 15, 7–13.
- MacDonald, T.M., et al., 2022. Clinical tools and biomarkers to predict preeclampsia. EBioMedicine, 75, 103780.
- Madazli, R., et al., 2014. Comparison of clinical and perinatal outcomes in early- and late-onset preeclampsia. Archives of Gynecology and Obstetrics, 290 (1), 53–57.
- Madendag, Y., et al., 2022. Maternal serum telomerase levels increase in pregnancies with mild and severe preeclampsia. Placenta, 123, 41–45.
- Mannaerts, D., et al., 2019. Are neutrophil/lymphocyte ratio (NLR), platelet/lymphocyte ratio (PLR), and/or mean platelet volume (MPV) clinically useful as predictive parameters for preeclampsia? Journal of Maternal-Fetal & Neonatal Medicine, 32 (9), 1412–1419.
- Maziashvili, G., et al., 2023. The use of systemic inflammatory markers from routine blood tests in predicting preeclampsia and the impact of age on marker levels. Cureus, 15 (3), e35836.
- Oğlak, S.C., Tunç, Ş., and Ölmez, F., 2021. First trimester mean platelet volume, neutrophil to lymphocyte ratio, and platelet to lymphocyte ratio values are useful markers for predicting preeclampsia. Ochsner Journal, 21 (4), 364–370.
- Örgül, G., et al., 2019. First trimester complete blood cell indices in early and late onset preeclampsia. Turkish Journal of Obstetrics and Gynecology, 16 (2), 112–117.
- Ozkan, D., et al., 2023. Efficacy of blood parameters in predicting the severity of gestational hypertension and preeclampsia. Journal of Obstetrics and Gynaecology, 43 (1), 2144175.
- Page, M.J., et al., 2021. The PRISMA 2020 statement: an updated guideline for reporting systematic reviews. International Journal of Surgery, 88, 105906.
- Petla, L.T., et al., 2013. Biomarkers for the management of pre-eclampsia in pregnant women. Indian Journal of Medical Research, 138 (1), 60–67.
- PRISMA, 2023. Transparent reporting of systematic reviews and meta-analyses. Available from: http://www.prisma-statement.org/.
- Simadibrata, D.M., et al., 2022. Platelet-to-lymphocyte ratio, a novel biomarker to predict the severity of COVID-19 patients: a systematic review and meta-analysis. Journal of the Intensive Care Society, 23 (1), 20–26.
- Singgih, R., Firmansyah, Y., and Dewi, A.K., 2021. Clinical ability of neutrophil–lymphocyte ratio in pregnancy as a predictor of preeclampsia. Journal of South Asian Federation of Obstetrics and Gynaecology, 13 (3), 125–130.
- Sitotaw, C., Asrie, F., and Melku, M., 2018. Evaluation of platelet and white cell parameters among pregnant women with preeclampsia in Gondar, Northwest Ethiopia: a comparative cross-sectional study. Pregnancy Hypertension, 13, 242–247.
- Syahputra, M.I., et al., 2019. Comparison of neutrophil–lymphocyte ratio (NLR), platelet lymphocyte ratio (PLR), and mean platelet volume (MPV) in preeclampsia and normal pregnancy. Global Journal for Research Analysis, 8 (4), 221–222.
- Taşkömür, A.T. and Erten, Ö., 2021. The role of cystatin C, neutrophil–lymphocyte ratio and platelet–lymphocyte ratio in the evaluation of kidney function in women with preeclampsia. Taiwanese Journal of Obstetrics & Gynecology, 60 (4), 615–620.
- Toptas, M., et al., 2016. Are neutrophil/lymphocyte ratio and platelet/lymphocyte ratio predictors for severity of preeclampsia? Journal of Clinical Gynecology and Obstetrics, 5 (1), 27–31.
- Uzan, J., et al., 2011. Pre-eclampsia: pathophysiology, diagnosis, and management. Vascular Health and Risk Management, 7, 467–474.
- Wadhwani, P., et al., 2020. A study to compare maternal and perinatal outcome in early vs. late onset preeclampsia. Obstetrics & Gynecology Science, 63 (3), 270–277.
- Wang, H., Li, L., and Ma, Y., 2023. Platelet-to-lymphocyte ratio a potential prognosticator in acute myocardial infarction: a prospective longitudinal study. Clinical Cardiology, 46 (6), 632–638.
- Well, G., et al., 2023. The Newcastle-Ottawa (NOS) for assessing the quality of nonrandomized studies in meta-analysis. Ottawa Hospital Research Institute [online]. Available from: https://www.ohri.ca/programs/clinical_epidemiology/oxford.asp [Accessed 5 Jan 2023].
- Yakiştiran, B., et al., 2022. Role of derived neutrophil-to-lymphocyte ratio, uric acid-to-creatinine ratio and delta neutrophil index for predicting neonatal outcomes in pregnancies with preeclampsia. Journal of Obstetrics and Gynaecology, 42 (6), 1835–1840.
- Yavuzcan, A., et al., 2014. Mean platelet volume, neutrophil–lymphocyte ratio and platelet–lymphocyte ratio in severe preeclampsia. Ginekologia Polska, 85 (3), 197–203.
- Yücel, B. and Ustun, B., 2017. Neutrophil to lymphocyte ratio, platelet to lymphocyte ratio, mean platelet volume, red cell distribution width and plateletcrit in preeclampsia. Pregnancy Hypertension, 7, 29–32.
- Zhou, H., et al., 2019. Severity stratification and prognostic prediction of patients with acute pancreatitis at early phase: a retrospective study. Medicine, 98 (16), e15275.