

 ?Mathematical formulae have been encoded as MathML and are displayed in this HTML version using MathJax in order to improve their display. Uncheck the box to turn MathJax off. This feature requires Javascript. Click on a formula to zoom.
Abstract
Background
This study aimed to investigate the potential role of ferroptosis/hypoxia-related genes in cervical cancer to improve early management and treatment of cervical cancer.
Methods
All data were downloaded from public databases. Ferroptosis/hypoxia-related genes associated with cervical cancer prognosis were selected to construct a risk score model. The relationship between risk score and clinical features, immune microenvironment and prognosis were analysed.
Results
Risk score model was constructed based on eight signature genes. Drug prediction analysis showed that bevacizumab and cisplatin were related to vascular endothelial growth factor A. Risk score, as an independent prognostic factor of cervical cancer, had a good survival prediction effect. The two groups differed significantly in degree of immune cell infiltration, gene expression, tumour mutation burden and somatic variation.
Conclusions
We developed a novel prognostic gene signature combining ferroptosis/hypoxia-related genes, which provides new ideas for individual treatment of cervical cancer.
Plain Language Summary
Ferroptosis, hypoxia and immune regulation play important roles in cervical cancer progression. In this study, we developed a novel prognostic signature combining ferroptosis and hypoxia-related genes, which provides new ideas for individual treatment of cervical cancer patients. The risk score established by ferroptosis and hypoxia-related gene as an independent prognostic factor of cervical cancer has a good survival prediction effect. High and low risk groups showed significant differences in TIME, prognosis, biological metabolic pathway and tumour mutation burden. In addition, we found drugs associated with signature genes. In short, this study has laid a theoretical foundation for exploring the related molecular mechanisms and prognosis of cervical cancer. It also contributes to the exploration of clinical management and treatment.
Introduction
Cervical cancer is a common cancer in women with high incidence and mortality. Persistent human papilloma virus (HPV) infection is the leading cause of cervical cancer. Ferroptosis is a regulatory necrosis, which is more immunogenic than apoptosis (Sun et al. Citation2020). For cell growth, cancer cells have an increased need for iron compared to non-cancer cells, making cancer cells more prone to iron-catalysed necrosis. Previous studies have reported the role of ferroptosis in a variety of cancers, including cervical cancer (Battaglia et al. Citation2020, Qi et al. Citation2021). Hypoxia is one of the main features of cancer, affecting gene expression, angiogenesis, metabolism and tumour biology-related processes. Tumour hypoxia increases the risk of local invasion, metastasis and treatment failure (Datta et al. Citation2021). Hypoxia also affects the early metastasis of cervical cancer (Y. Zhang et al. Citation2021). Notably, previous studies have found that hypoxia-inducible factor 1 subunit α (HIF1A) is a promoter of ferroptosis (M. Yang et al. Citation2019). Another study showed that hypoxia-inducible factor 2α (HIF-2α) can activate the expression of hypoxia-inducible, lipid droplet-associated protein (HILPDA) and selectively enrich polyunsaturated lipids, thereby promoting ferroptosis (Zou et al. Citation2019). Interestingly, there is growing evidence that ferroptosis and hypoxia are associated with tumour immunity. Ferroptosis mediates tumour suppressive activity of interferon gamma secreted by CD8 T cells in response to immune checkpoint blockade (Stockwell and Jiang Citation2019). Hypoxia enhances immunosuppression by inhibiting CD4+ effector T cell function and promoting regulatory T cells (Treg) activity (Westendorf et al. Citation2017). Therefore, studying the relationship between ferroptosis, hypoxia and immunity may improve the effect of immunotherapy. With the advent of the era of big data, more and more researchers have begun to mine public databases. Many previous studies have constructed ferroptosis and hypoxia-related gene signatures in various cancers based on data from public databases to help predict patient survival and characterise the immune microenvironment of patients (Wen et al. Citation2021, C. Liu et al. Citation2022, C. B. Yang et al. Citation2022, T. Zhang et al. Citation2022, Zhong et al. Citation2023). In this study, based on the data from the public database of cervical cancer, the ferroptosis and hypoxia-related gene signature were constructed to assess tumour immune microenvironment (TIME) and predict prognosis. This ferroptosis and hypoxia-related gene signature has a good survival prediction effect. However, as the ferroptosis and hypoxia-related gene signature is developed and validated based on public database data, the results are speculative. Therefore, it is necessary to collect a large number of clinical samples for comprehensive evaluation and validation.
Methods
Data sources
Cervical cancer data were downloaded from the GEO and TCGA databases. Gene expression data, clinical information, mutation data and copy number variation (CNV) data were collected and downloaded from UCSC Xena website (https://gdc.xenahubs.net). The gene expression matrix file in GSE44001 dataset was downloaded from the GEO database and annotated (GPL14951 annotation). Samples with no clinical follow-up information, unknown survival time, survival time less than 0 and no survival status were excluded. Gene probe was converted into gene symbol. If there were multiple gene symbols in the expression, the median value was taken. Those probes that corresponded to multiple genes were removed. Finally, TCGA-cervical cancer data included three paracancerous and 293 cancer tissue samples, and GSE44001 dataset included 300 cancer tissue samples. TCGA-cervical cancer data and GSE44001 data were regarded as the training set and test set, respectively.
Identification of ferroptosis and hypoxia-related genes
Totally, 259 ferroptosis-related genes were downloaded from the FerrDb database (http://www.zhounan.org/ferrdb/index.html). Subsequently, ferroptosis-related genes in the Liang JY study were included as supplements (Liang et al. Citation2020). Totally, 267 ferroptosis-related genes were obtained. Subsequently, 200 hypoxia-related genes were downloaded from the MSigDB database (https://www.gsea-msigdb.org/gsea/msigdb/). In addition, the indicator genes of ferroptosis and hypoxia were also searched from the literature (Zheng et al. Citation2020, Wen et al. Citation2021).
Construction of risk score model
Univariate Cox analysis of ferroptosis and hypoxia-related genes in training set and test set were performed to determine the correlation with prognosis. Then, intersection genes with p ≤ .05 in both datasets were selected for the Lasso analysis. Finally, multivariate Cox regression was used to construct model for ferroptosis and hypoxia-related genes. The calculation formula is as follows: . The genes in the risk score were defined as signature genes. According to the median risk score, patients were divided into high and low risk score groups. Then, differences in survival between high and low risk groups were using Kaplan–Meier analysis. Furthermore, 1-, 3- and 5-year receiver operator characteristic (ROC) curve analyses were performed to assess the accuracy of risk model in predicting cervical cancer prognosis. In addition, survival and prognostic accuracy analyses were validated in the test set.
Molecular characterisation of signature genes
According to the median expression value of signature genes in training set samples, patients were divided into high and low expression groups. Then, differences in survival between high and low expression groups were using Kaplan–Meier analysis. Then, Wilcoxon’s test was used to analyse the differential expression of signature genes in cancer and paracancerous tissues. Meanwhile, the human protein atlas database (https://www.proteinatlas.org/) was used to verify the expression of signature genes at the protein level in cancer and paracancerous tissues. To understand the mutation situation of signature genes, maftools function was used to analyse the mutation data of cervical cancer. In addition, CNV data were analysed to observe the replication and deletion of signature genes.
Associated transcription factors (TFs) and drug prediction of signature genes
Subsets of TF were obtained from Cistrome (http://cistrome.org/CistromeCancer/CancerTarget/). Corresponding TF expression values were obtained from TCGA database. Subsequently, the IFs associated with the signature genes were identified (|Pearson’s correlation coefficient| >0.3, p < .01). Furthermore, drugs related to signature genes were screened based on DGIdb database (https://dgidb.org/), hoping to provide a new perspective for disease diagnosis, treatment and research.
Relationship between risk score and clinical features
To judge the relationship between risk score and clinical features, multivariate Cox analysis was used to determine whether the risk score was an independent prognostic factor different from other clinical factors. Subsequently, prognostic nomograms were constructed by stepwise Cox regression models for all independent prognostic parameters to predict 1-, 3- and 5-year overall survival (OS) in training set. In addition, differences in risk score between different clinical subgroups were compared.
Tumour immune microenvironment
SSGSEA algorithm quantified the relative abundance of each immune cell in the TIME of cervical cancer. Gene sets were obtained from Charoentong study to mark each immune cell type (Charoentong et al. Citation2017). The ESTIMATE algorithm was used to calculate the immune score, stromal score, tumour purity and ESTIMATE score of cervical cancer patients. Wilcoxon’s test was used to statistically analyse the significance of differences between high and low risk score groups.
Gene set variation analysis (GSVA)
To uncover differences in biological pathways between high and low risk score patients, GSVA enrichment analysis was performed using the ‘GSVA’ package of R software. The ‘c2.cp.kegg.v7.2.symbols’ gene set was downloaded from the MSigDB database. The ‘limma’ package was used for difference analysis. False discovery rate (FDR) <0.05 and |log2 (fold change, FC)| >0.1 were considered statistically significant differences.
Analysis of gene expression difference between two groups
In order to further assess the situation between high and low risk groups, the limma package was used for differential expression analysis (FDR <0.05 and |log2 (FC)| >1). Subsequently, to study the regulatory relationship between differentially expressed genes, a protein–protein interaction (PPI) network was constructed using the STRING database (https://cn.string-db.org/). In addition, differentially expressed genes were functionally enriched using David database (https://david.ncifcrf.gov/).
Tumour mutation burden (TMB) analysis
TMB score was calculated using mafTools package. Training set samples were divided into high and low groups based on the median TMB score. Subsequently, TMB was compared between high and low risk groups. To further assess the distribution of somatic variation between the high and low risk groups, the top 20 genes with high frequency of variation were compared. In addition, Spearman’s correlation analysis was performed for risk score, TMB and signature genes.
Expression validation by real-time polymerase chain reaction (PCR)
The cancer tissues and normal paracancerous tissues from four patients with cervical cancer without other complications were selected as samples for real-time PCR verification. TRIzol and FastKing cDNA first strand synthesis kits were used for total RNA extraction and reverse transcription, respectively. Subsequently, real-time PCR validation was performed using SuperReal PreMix Plus (SYBR Green). In this part of the study, ACTB was used as the internal reference. ABI 7300 fluorescence quantitative PCR was used for real-time PCR detection. The 2–ΔΔCT method was used for relative quantitative analysis of the data. The 2–ΔΔCT represents the change factor of target gene expression in the experimental group compared with the control group.
Results
Construction of risk score model
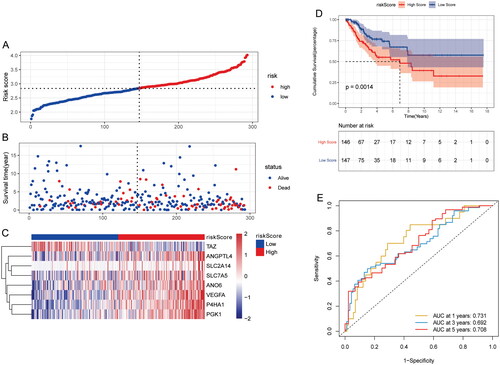
Univariate Cox analysis revealed that 12 genes were related to prognosis in training set and test set (p < .05) (). In order to facilitate clinical application, eight signature genes (ANGPTL4, P4HA1, PGK1, ANO6, SLC2A14, SLC7A5, TAZ and VEGFA) were further screened by lasso in training set (). Among them, ANGPTL4, P4HA1 and PGK1 belong to hypoxia-related genes, ANO6, SLC2A14, SLC7A5 and TAZ belong to ferroptosis-related genes, and VEGFA belongs to both hypoxia and ferroptosis-related genes (). Multivariate Cox regression analysis was used to construct a risk model according to the eight signature genes. The risk score formula: Risk Score = (ANGPTL4 × 0.026905493) + (ANO6 × 0.182845696) + (P4HA1 × 0.16619873) + (PGK1 × 0.228103114) + (SLC2A14 × 0.275332067) + (SLC7A5 × 0.007934591) – (TAZ × 0.282285441) + (VEGFA × 0.120698826). The sample was divided into high and low risk groups according to the median risk score (). Furthermore, a higher proportion of death samples were found in the high risk group (). Among the eight signature genes, TAZ was low expressed, and the other seven genes were high expressed in the high risk group (). Kaplan–Meier’s analysis showed that patients in the low risk group had a relatively good prognosis (). ROC curve analysis showed that the area under the curve (AUC) of 1-, 3- and 5-years were 0.731, 0.692 and 0.708, respectively (). This indicates that the model has a good prognostic ability. Furthermore, validation of the test set exhibits similar results to training set (Supplementary Figure 1).
Figure 1. Construction of risk model in training set. (A) Gene Venn diagram after univariate Cox screening in training set and test set; (B) forest map of 12 prognostic genes in the training set; (C) forest map of 12 prognostic genes in the test set; (D) locus of coefficients for each gene with value log (lambda). The horizontal axis and vertical axis represent the log value of the independent variable lambda and the coefficient of the independent variable, respectively. (E) Confidence intervals under each lambda; (F) Venn diagram of distribution of signature genes.
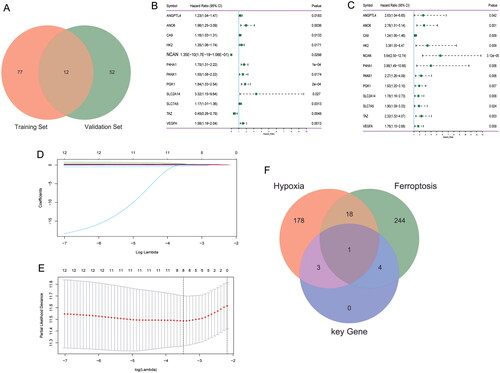
Figure 2. Effect of risk score on patient survival in training set. (A) Distribution map of risk score in training set; (B) survival status of patients at high and low risk score in training set; (C) expression heat map of eight signature genes in high and low risk groups in training set; (D) Kaplan–Meier’s survival curves of patients with high and low risk score in training set; (E) time-dependent ROC analysis of risk score in training set.
Molecular characterisation of signature genes
Kaplan–Meier’s analysis showed that ANGPTL4, SLC2A14, SLC7A5 and TAZ genes had no significant effect on the survival of patients, while the survival of patients with high expression of P4HA1, PGK1, ANO6 and VEGFA was significantly lower than those with low expression (p < .05) (Supplementary Figure 2A–D). This result suggests that P4HA1, PGK1, ANO6 and VEGFA as prognostic molecular markers for cervical cancer may be more reliable compared to ANGPTL4, SLC2A14, SLC7A5 and TAZ. Expression analysis of signature genes in cancer and paracancerous tissues showed that ANO6 was significantly lower in cancer tissues, while PGK1, SLC7A5 and TAZ were significantly higher in cancer tissues (Supplementary Figure 2E). Furthermore, protein expression levels of ANO6, PGK1, SLC7A5 and TAZ showed the same expression trend in cancer and paracancerous tissues (Supplementary Figure 2F–I). In addition, mutations and CNV frequency of signature genes in training set were also analysed (Supplementary Figure 2J and K). The results showed that ANO6 had the highest mutation and TAZ had the highest CNV frequency. However, in general, the mutation and CNV frequency of all signature genes in the cervical cancer were low. This implies that the expression of eight signature genes is less affected by mutations and CNV in cervical cancer.
Associated TF and drug prediction of signature genes
Subsets of TF were obtained from Cistrome. Correlation analysis showed that among the eight signature genes, ANO6 (n = 58) had the most relevant TFs, but SLC2A14 had no related TFs (|Pearson’s correlation coefficient| >0.3, p < .01) (Supplementary Table 1). Moreover, the TF KDM3A was associated with ANO6, P4HA1, PGK1 and VEGFA (Supplementary Figure 3A). Drug prediction showed that only P4HA1, PGK1, SLC7A5 and VEGFA were associated with drugs (Supplementary Figure 3B). Among them, BEVACIZUMAB and CISPLATIN were related to VEGFA gene.
Association between risk score and clinical features
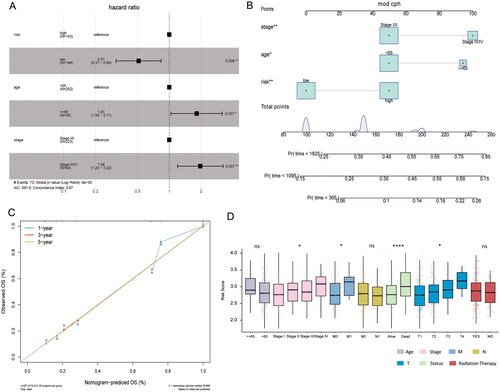
Multivariate Cox analysis was performed to investigate the correlation between risk score and clinical features. The results showed that risk score, stage and age were independent prognostic factors (). Subsequently, nomograms were constructed to predict the probability of OS at 1-, 3- and 5-years (). The calibration curve showed that the combined model (nomogram) showed high accuracy in 3- and 5-year OS (). These results suggest that the nomogram constructed using the combined model may be a better predictor of survival in patients with cervical cancer than using a single prognostic factor. Furthermore, risk score for different clinical subgroups was compared. Risk score was significantly different in stage, M stage, T stage and status ().
Figure 3. Relationship between risk score and clinical features in training set. (A) Multivariate Cox analysis of clinical features and risk score; (B) nomogram of clinical features and risk score; (C) calibration chart in 1-, 3- and 5-year calibration chart; (D) differences in risk score among different clinical subgroups.
Association between risk score and immune cell infiltration
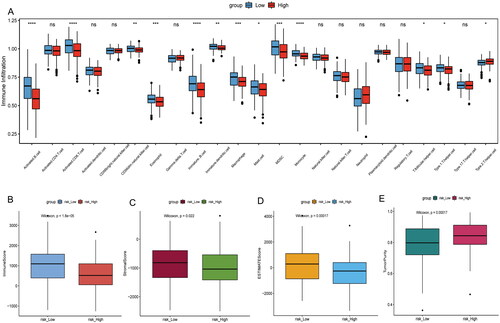
To explore the relationship between risk score and TIME, ssGSEA method was used to evaluate the immune cell infiltration status in high and low risk groups of training set. The ssGSEA results showed that immature B cell, immature dendritic cell, activated B cell, CD56dim natural killer cell, eosinophil, activated CD8 T cell, macrophage, mast cell, MDSC, monocyte, T follicular helper cell, type 1 T helper cell and type 2 T helper cell infiltration were significantly different in the high and low risk groups (). The immune score, stromal score and ESTIMATE score were significantly lower in the high risk score group than in the low risk score group, while tumour purity was higher in the low risk score group ().
Figure 4. Comparison of TIME in high and low risk groups. (A) Differences in the degree of immune cell infiltration between high and low risk groups; (B) differences in immune score between high and low risk groups; (C) differences in stromal score between high and low risk groups; (D) differences in ESTIMATE score between high and low risk groups; (E) differences in tumour purity between high and low risk groups.
Analysis of ferroptosis and hypoxia status
The expression of indicator genes for ferroptosis and hypoxia in the high and low risk score groups was analysed to assess ferroptosis and hypoxia status. The results showed that 15 of the 16 hypoxia indicator genes were highly expressed in the high risk group (Supplementary Figure 4A). This suggests that hypoxia was more significant in the high risk group. Among the 16 genes of ferroptosis inhibitor, ATF4, HELLS, HMOX1, HSF1, NQO1, OTUB1 and SQSTM1 had no significant difference between high and low risk score groups. ACSL3, CA9, CD44, FTH1, HSPA5, SCD and SLC7A11 were significantly highly expressed in the high risk group, while GPX4 and HSPB1 were significantly highly expressed in the low risk group (Supplementary Figure 4B).
Analysis of GSVA
GSVA analysis revealed differences in metabolic pathways between high and low risk score groups (Supplementary Figure 5). For example, TGF beta signalling pathway, ECM receptor interaction, focal adhesion signalling pathway were more active in the high risk group, while oxidative phosphorylation, ribosome, arachidonic acid metabolism signalling pathway were more active in the low risk group.
Analysis of differentially expressed genes between two groups
Totally, 36 differentially expressed genes were identified (FDR <0.05 and |log2(FC)| >1). Among them, 11 were highly expressed and 25 lowly expressed in high risk group (Supplementary Figure 6A). A principal component analysis (PCA) was also performed, showing the contribution of individual genes to the grouping (Supplementary Figure 6B). Gene Ontology (GO) function enrichment analysis was performed for differentially expressed genes, and biological functions enriched in biological process (BP), cell composition (CC) and molecular function (MF) was displayed by bubble map (Supplementary Figure 6C). The results showed that differentially expressed genes were enriched in several immune-related BPs. PPI network analysis showed that VEGFA had the most interaction genes, and VEGFA was also the signature gene in the model (Supplementary Figure 6D). In the PPI network, there were three groups with interaction score above 0.9, namely APOE and APOC1 (0.995), VEGFA and FN1 (0.992), and VEGFA and MMP1 (0.967).
TMB analysis
TMB analysis showed that the TMB in the high risk group was significantly higher than that of low risk group (). Furthermore, TMB score was generally higher in the high risk group (Supplementary Figure 7A). To further assess the distribution of somatic variation between the high and low risk groups, the top 20 genes with high frequency of variation were compared (Supplementary Figure 7B and C). The results showed significant differences in genetic mutations between high and low risk groups. Spearman’s correlation analysis showed that risk score was positively correlated with TMB (). These results suggest that TMB plays an important role in the progression of cervical cancer.
Figure 5. Comparison of TMB in high and low risk groups and real-time PCR validation. (A) Differential analysis of TMB in high and low risk groups; (B) correlations between TMB, risk score and signature genes; (C) expression validation of ANO6, PGK1, SLC7A5 and TAZ in cervical cancer samples by real-time PCR.
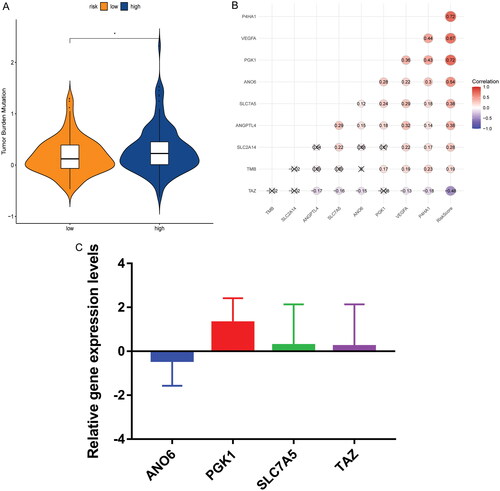
Real-time PCR validation
When analysing the molecular characterisation of signature genes, it was found that found that the expression of ANO6, PGK1, SLC7A5 and TAZ at the mRNA and protein levels were significantly different between cancer and paracancerous tissues. Therefore, ANO6, PGK1, SLC7A5 and TAZ were selected for real-time PCR verification. Primers of all genes are shown in Table S2. PGK1, SLC7A5 and TAZ showed an up-regulated trend and ANO6 showed a down-regulated trend in cancer tissues compared with paracancerous tissues (). Their expression trends were consistent with the results of analysis in public databases. However, real-time PCR results lack significance, which may be caused by the small sample size. Therefore, collecting a larger number of samples for further research is needed.
Discussion
With the advent of the era of big data, more and more researchers are starting to explore public databases to develop prognostic models, providing theoretical basis for clinical management and prognosis. Previous researchers constructed ferroptosis-related signature based on public data to predict the prognosis and immune microenvironment of triple-negative breast cancer (S. Wu et al. Citation2022), gastric cancer (Y. Liu et al. Citation2023) and head and neck cancer (Chung et al. Citation2023). Previous researchers have also constructed hypoxia-related signature based on public data (Jiao and Geng Citation2023, Ren et al. Citation2023). Ferroptosis and hypoxia play an important role in the progression of many cancers. In this study, based on the data from the public database of cervical cancer, the ferroptosis and hypoxia-related gene signature were constructed to assess TIME and predict prognosis.
In this study, eight signature genes related to the prognosis of cervical cancer were obtained, including three hypoxia-related genes (ANGPTL4, P4HA1 and PGK1), four ferroptosis-related genes (ANO6, SLC2A14, SLC7A5 and TAZ) and one hypoxia and ferroptosis-related genes (VEGFA). Angiopoietin-like 4 (ANGPTL4) is abnormally expressed in cervical cancer and is closely associated with poor OS and disease-free survival (DFS) (Nie et al. Citation2019). ANGPTL4 silencing can inhibit SiHa cell proliferation (Nie et al. Citation2016). Studies have shown that the expression of prolyl 4-hydroxylase subunit alpha 1 (P4HA1) and vascular endothelial growth factor A (VEGFA) can regulate the proliferation and migration of cervical cancer cells (Y. Yang et al. Citation2021). The expression of phosphoglycerate kinase 1 (PGK1) in cervical cancer tissues was significantly increased, and the proliferation, migration and invasion abilities of cancer cells were enhanced (S. Liu et al. Citation2022). Activation of anoctamin 6 (ANO6) is essential during ferroptosis-mediated cancer cell death (Ousingsawat et al. Citation2019). Tafazzin (TAZ) is over-expressed in cervical cancer and promotes tumorigenicity and inhibits apoptosis of cervical cancer cells (Chen et al. Citation2017). Solute carrier family 7 member 5 (SLC7A5) is associated with acquired malignant potential in invasive uterine carcinoma (Uno et al. Citation2011). In the presence of hypoxia and HIF1 blockade, colon cancer cells adapt to energy metabolism by up-regulating solute carrier family 2 member 14 (SLC2A14) glucose transporter (Valli et al. Citation2019). PPI network found that lysine demethylase 3A (KDM3A) was related with four signature genes (ANO6, P4HA1, PGK1 and VEGFA). KDM3A can promote cervical cancer malignancy through the ETS1/KIF14/Hedgehog axis (J. Liu et al. Citation2020). Drug prediction showed that BEVACIZUMAB and CISPLATIN were both related to VEGFA gene. It is noted that BEVACIZUMAB and CISPLATIN are related with the treatment of cervical cancer (Tewari et al. Citation2017, Federico et al. Citation2021). These results imply that eight signature genes have important mediating roles in cervical cancer. Therefore, we speculated that the prognostic risk model of cervical cancer constructed by these eight signature genes had potential reliability.
The ROC analysis results indicate that the risk model has good prognostic ability. Multivariate Cox analysis showed that risk score was an independent prognostic factors. Therefore, the construction of risk model provides a choice for prognostic prediction of cervical cancer patients. Risk score was also found to be correlated with the TIME of cervical cancer. The ssGSEA results showed that immune cell infiltration were different in the high and low risk groups. Tumour progression and prognosis in cervical cancer patients are closely related to the abundance of tumour-infiltrating immune cells (Mei et al. Citation2020). Moreover, the immune score, stromal score and ESTIMATE score were significantly lower in the high risk score group than in the low risk score group, while tumour purity was higher in the low risk score group. Previous studies showed that cervical cancer patients with high immunity score and ESTIMATE score had higher survival than those with low immunity score and ESTIMATE score (L. Yang et al. Citation2021, X. Yang et al. Citation2022). Cervical cancer patients with low tumour purity have a better prognosis, and tumour purity is related to immunity (Deng et al. Citation2021). In summary, risk score was associated with immunity to cervical cancer. Previous study has shown that TMB is related to immunotherapy (L. Liu et al. Citation2019). Therefore, TMB in the high and low risk groups was explored. The results showed that risk score was positively correlated with TMB, and the TMB value was higher in the high risk group. In addition, the high and low risk groups also had a large number of somatic variations, but the mutated genes were significantly different. Therefore, we speculated that the risk model had good predictive value in the prognosis and TIME of cervical cancer. These results may provide new ideas for studying the mechanism of tumour hypoxia, ferroptosis and gene mutation. As the ferroptosis and hypoxia-related gene signature is developed and validated based on public database data, the results are speculative. Therefore, a lot of validation is needed to comprehensively evaluate the ferroptosis and hypoxia-related gene signature.
GSVA analysis revealed TGF beta signalling pathway, ECM receptor interaction, focal adhesion signalling pathway were more active in the high risk group, while oxidative phosphorylation, ribosome, arachidonic acid metabolism signalling pathway were more active in the low risk group. Cervical cancer cells secrete TGF beta to promote tumour growth and metastasis while evading the host’s immune system (López-Muñoz et al. Citation2013). The focal adhesion pathway in cervical squamous cell carcinoma is regulated by microRNA-218, which further regulates cancer cell migration and invasion (Yamamoto et al. Citation2013). ECM receptor interaction also plays a key role in the progression of cervical cancer (K. Wu et al. Citation2018). Inhibition of oxidative phosphorylation may alleviate hypoxia and reactivate anti-tumour immune responses (Boreel et al. Citation2021). It has been reported that abnormal ribosome biogenesis pathway can regulate the growth of cervical cancer cells (A. Wu et al. Citation2021). Arachidonic acid metabolism plays a key role in carcinogenesis (Yarla et al. Citation2016). Therefore, it is speculated that these differential metabolic pathways may play an important regulatory role in the progression of cervical cancer. Moreover, differences in metabolic pathways between high and low risk groups provide potential research directions for predicting patient prognosis.
Admittedly, this experiment also has some limitations. First, the underlying molecular mechanisms revealed by this experiment are needed in the further study. Second, the sample size in the real-time PCR was too small and the results lacked significance. Therefore, it is necessary to continue collecting samples for research.
Conclusions
In this study, a novel prognostic signature was discovered combining ferroptosis and hypoxia-related genes for cervical cancer. The identification of this prognostic signature provides a new idea for individual treatment of cervical cancer patients. Risk score as an independent prognostic factor of cervical cancer has a good survival prediction effect. High and low risk groups showed significant differences in TIME, prognosis, biological metabolic pathway and TMB. In addition, drugs associated with signature genes have been found. In short, this study has laid a theoretical foundation for exploring the related molecular mechanisms and prognosis of cervical cancer.
Author contributions
Conception and design: W.H. and X.Y.; administrative support: X.Y.; provision of study materials or patients: Y.F. and Y.B.; collection and assembly of data: Q.Z. and L.X.; data analysis and interpretation: W.H. and Y.F. All authors reviewed the manuscript.
Ethical approval
This study was approved by the Ethics Committee of Chengdu Second People’s Hospital (No. 2022 216). All participants who provided samples at the real-time PCR validation were informed of the purpose of this study, and that this study complied with the Declaration of Helsinki.
Consent form
The informed consent was obtained from the all participants.
Supplemental Material
Download Zip (41.3 MB)Disclosure statement
No potential conflict of interest was reported by the author(s).
Data availability statement
All data generated or analysed during this study are included in this published article.
Additional information
Funding
References
- Battaglia, A.M., Chirillo, R., and Aversa, I., 2020. Ferroptosis and cancer: mitochondria meet the "Iron Maiden" cell death. Cells, 9 (6), 1.
- Boreel, D.F., et al., 2021. Targeting oxidative phosphorylation to increase the efficacy of radio- and immune-combination therapy. Clinical Cancer Research, 27 (11), 2970–11.
- Charoentong, P., et al., 2017. Pan-cancer immunogenomic analyses reveal genotype-immunophenotype relationships and predictors of response to checkpoint blockade. Cell Reports, 18 (1), 248–262.
- Chen, M., Zhang, Y., and Zheng, P.S., 2017. Tafazzin (TAZ) promotes the tumorigenicity of cervical cancer cells and inhibits apoptosis. PLOS One, 12 (5), e0177171.
- Chung, C.H., et al., 2023. Ferroptosis signature shapes the immune profiles to enhance the response to immune checkpoint inhibitors in head and neck cancer. Advanced Science, 10 (15), e2204514.
- Datta, A., et al., 2021. Impact of hypoxia on cervical cancer outcomes. International Journal of Gynecological Cancer, 31 (11), 1459–1470.
- Deng, Y., et al., 2021. Tumor purity as a prognosis and immunotherapy relevant feature in cervical cancer. Aging, 13 (22), 24768–24785.
- Federico, C., et al., 2021. Localized delivery of cisplatin to cervical cancer improves its therapeutic efficacy and minimizes its side effect profile. International Journal of Radiation Oncology, Biology, Physics, 109 (5), 1483–1494.
- Jiao, Y. and Geng, R., 2023. A hypoxia molecular signature-based prognostic model for endometrial cancer patients. International Journal of Molecular Sciences, 24 (2), 1675.
- Liang, J.Y., et al., 2020. A novel ferroptosis-related gene signature for overall survival prediction in patients with hepatocellular carcinoma. International Journal of Biological Sciences, 16 (13), 2430–2441.
- Liu, C., et al., 2022. Prognostic modeling of lung adenocarcinoma based on hypoxia and ferroptosis-related genes. Journal of Oncology, 2022, 1022580.
- Liu, J., et al., 2020. Histone demethylase KDM3A promotes cervical cancer malignancy through the ETS1/KIF14/Hedgehog axis. OncoTargets and Therapy, 13, 11957–11973.
- Liu, L., et al., 2019. Combination of TMB and CNA stratifies prognostic and predictive responses to immunotherapy across metastatic cancer. Clinical Cancer Research, 25 (24), 7413–7423.
- Liu, S., et al., 2022. HPV16 E6/E7 stabilize PGK1 protein by reducing its poly-ubiquitination in cervical cancer. Cell Biology International, 46 (3), 370–380.
- Liu, Y., et al., 2023. A new ferroptosis-related signature model including messenger RNAs and long non-coding RNAs predicts the prognosis of gastric cancer patients. Journal of Translational Internal Medicine, 11 (2), 145–155.
- López-Muñoz, H., et al., 2013. Cervical cancer cells induce apoptosis in TCD4+ lymphocytes through the secretion of TGF-β. Archives of Gynecology and Obstetrics, 287 (4), 755–763.
- Mei, J., et al., 2020. Construction of an immune-related gene signature for prediction of prognosis in patients with cervical cancer. International Immunopharmacology, 88, 106882.
- Nie, D., et al., 2016. Knockdown of angiopoietin-like protein 4 inhibits proliferation and promotes apoptosis in cervical cancer SiHa cells. Xi Bao Yu Fen Zi Mian Yi Xue Za Zhi, 32 (4), 488–492.
- Nie, D., et al., 2019. Up-regulated of angiopoietin-like protein 4 predicts poor prognosis in cervical cancer. Journal of Cancer, 10 (8), 1896–1901.
- Ousingsawat, J., Schreiber, R., and Kunzelmann, K., 2019. TMEM16F/Anoctamin 6 in ferroptotic cell death. Cancers, 11 (5), 625.
- Qi, X., et al., 2021. A novel ferroptosis-related gene signature for predicting outcomes in cervical cancer. Bioengineered, 12 (1), 1813–1825.
- Ren, M., et al., 2023. A novel pancreatic cancer hypoxia status related gene signature for prognosis and therapeutic responses. Molecular Biotechnology,
- Stockwell, B.R. and Jiang, X., 2019. A physiological function for ferroptosis in tumor suppression by the immune system. Cell Metabolism, 30 (1), 14–15.
- Sun, Y., et al., 2020. The emerging role of ferroptosis in inflammation. Biomedicine & Pharmacotherapy = Biomedecine & Pharmacotherapie, 127, 110108.
- Tewari, K.S., et al., 2017. Bevacizumab for advanced cervical cancer: final overall survival and adverse event analysis of a randomised, controlled, open-label, phase 3 trial (Gynecologic Oncology Group 240). Lancet, 390 (10103), 1654–1663.
- Uno, K., et al., 2011. Divergent expression of l-type amino acid transporter 1 during uterine cervical carcinogenesis. Human Pathology, 42 (11), 1660–1666.
- Valli, A., et al., 2019. Adaptation to HIF1α deletion in hypoxic cancer cells by upregulation of GLUT14 and creatine metabolism. Molecular Cancer Research, 17 (7), 1531–1544.
- Wen, K., et al., 2021. Construction and validation of a combined ferroptosis and hypoxia prognostic signature for hepatocellular carcinoma. Frontiers in Molecular Biosciences, 8, 809672.
- Westendorf, A.M., et al., 2017. Hypoxia enhances immunosuppression by inhibiting CD4+ effector T cell function and promoting Treg activity. Cellular Physiology and Biochemistry, 41 (4), 1271–1284.
- Wu, A., et al., 2021. Overexpression of ARHGAP30 suppresses growth of cervical cancer cells by downregulating ribosome biogenesis. Cancer Science, 112 (11), 4515–4525.
- Wu, K., et al., 2018. Identification of key pathways and genes in the progression of cervical cancer using bioinformatics analysis. Oncology Letters, 16 (1), 1003–1009.
- Wu, S., et al., 2022. Development and verification of a prognostic ferroptosis-related gene model in triple-negative breast cancer. Frontiers in Oncology, 12, 896927.
- Yamamoto, N., et al., 2013. Tumor suppressive microRNA-218 inhibits cancer cell migration and invasion by targeting focal adhesion pathways in cervical squamous cell carcinoma. International Journal of Oncology, 42 (5), 1523–1532.
- Yang, C.B., Feng, H.X., and Dai, C.L., 2022. Development and validation of an immune-related prognosis signature associated with hypoxia and ferroptosis in hepatocellular carcinoma. Cancer Medicine, 11 (11), 2329–2341.
- Yang, L., et al., 2021. Identification of prognosis-related genes in the cervical cancer immune microenvironment. Gene, 766, 145119.
- Yang, M., et al., 2019. Clockophagy is a novel selective autophagy process favoring ferroptosis. Science Advances, 5 (7), eaaw2238.
- Yang, X., et al., 2022. Ferroptosis-related genes identify tumor immune microenvironment characterization for the prediction of prognosis in cervical cancer. Annals of Translational Medicine, 10 (2), 123.
- Yang, Y., et al., 2021. Constructed a novel 5 hypoxia genes signature for cervical cancer. Cancer Cell International, 21 (1), 345.
- Yarla, N.S., et al., 2016. Targeting arachidonic acid pathway by natural products for cancer prevention and therapy. Seminars in Cancer Biology, 40–41, 48–81.
- Zhang, T., et al., 2022. A novel predictive model for adrenocortical carcinoma based on hypoxia- and ferroptosis-related gene expression. Frontiers in Medicine, 9, 856606.
- Zhang, Y., et al., 2021. hCINAP is potentially a direct target gene of HIF-1 and is required for hypoxia-induced EMT and apoptosis in cervical cancer cells. Biochemistry and Cell Biology = Biochimie et Biologie Cellulaire, 99 (2), 203–213.
- Zheng, S., et al., 2020. Identification and validation of a combined hypoxia and immune index for triple-negative breast cancer. Molecular Oncology, 14 (11), 2814–2833.
- Zhong, J., et al., 2023. Development and validation of a combined hypoxia and ferroptosis prognostic signature for breast cancer. Frontiers in Oncology, 13, 1077342.
- Zou, Y., et al., 2019. A GPX4-dependent cancer cell state underlies the clear-cell morphology and confers sensitivity to ferroptosis. Nature Communications, 10 (1), 1617.