

Abstract
Background
Ovarian cancer stands as a highly aggressive malignancy. The core aim of this investigation is to uncover genes pivotal to the progression and prognosis of ovarian cancer, while delving deep into the intricate mechanisms that govern their impact.
Methods
The study entailed the retrieval of RNA-seq data and survival data from the XENA database. Outliers were meticulously excluded in accordance with TCGA guidelines and through principal components analysis. The R package ‘deseq2’ was harnessed to extract differentially expressed genes. WGCNA was employed to prioritise these genes, and Cox regression analysis and survival analysis based on disease-specific time were conducted to identify significant genes. Immunohistochemistry validation was undertaken to confirm the distinct expression of USP43. Furthermore, the influence of USP43 on the biological functions of ovarian cancer cells was explored using techniques such as RNA interference, western blotting, scratch assays, and matrigel invasion assays. The examination of immune infiltration was facilitated via CIBERSORT.
Results
The study unearthed 5195 differentially expressed genes between ovarian cancer and normal tissue, comprising 3416 up-regulated and 1779 down-regulated genes. WGCNA pinpointed 204 genes most intimately tied to tumorigenesis. The previously undisclosed gene USP43 exhibited heightened expression in tumour tissues and exhibited associations with overall survival and disease-specific survival. USP43 emerged as a driver of cell migration (43.27 ± 3.91% vs 19.69 ± 1.94%) and invasion ability (314 ± 32 vs 131 ± 12) through the mechanism of epithelial mesenchymal transition, potentially mediated by the KRAS pathway. USP43 was also identified as a booster of CD4+ T memory resting cell infiltration, while concurrently reducing M1 macrophages within cancer, thereby fostering a milieu with relatively immune suppressive traits. Interestingly, USP43 demonstrated connections with epigenetically regulated-mRNAsi, although not with mRNAsi.
Conclusion
This study underscores the role of USP43 in facilitating tumour migration and invasion. It postulates USP43 as a novel therapeutic target for ovarian cancer treatment.
PLAIN LANGUAGE SUMMARY
Ovarian cancer is the most deadly tumour among all gynecological tumours. Thus we tried to explore the relevant mechanism of ovarian cancer because its occurrence and development mechanism has not been fully elucidated. We used bioinformatics methods to perform differential gene analysis on ovarian cancer tissues and normal tissues, and used methods such as WGCNA and COX regression analysis to find the gene USP43 related to tumour development and prognosis. USP43 is a gene that has not been studied in ovarian cancer before. Through RNA interference technology, we found that it can promote the migration and invasion ability of ovarian cancer and promote epithelial-mesenchymal transition of ovarian cancer cells. In addition, this gene has also been proven to be related to tumour immunity and tumour stemness. These results indicate that USP43 can promote the tumorigenesis of ovarian cancer and can be used as a drug target.
Introduction
Ovarian cancer ranks as the 7th most common cancer among women worldwide in terms of incidence and 8th in terms of mortality, making it the most deadly cancer among all gynecological tumours. Epithelial ovarian cancer constitutes 90% of primary malignant tumours of the ovary, with serous adenocarcinoma accounting for proximately 70% of cases (Momenimovahed et al. Citation2019). The 5-year prognosis is less than 20%.In 2022, China is projected to witness 57,090 new cases of ovarian cancer and 39,306 deaths (Xia et al. Citation2022).
Weighted gene co-expression network analysis (WGCNA) is an powerful and robust method widely used to identify gene co-expression modules by constructing a scale-free network to analyse the correlation between genes and analyse the correlation between gene co-expression modules and biological phenotypes (van Dam et al. Citation2017). The WGCNA method has been extensively utilised to identify clinically relevant genes in cancer, such as identifying hub genes for the early diagnosis of gastric cancer using the WGCNA approach (Rezaei et al. Citation2022).
The human genome encodes six major classes of deubiquitinating enzymes, of which the Ubiquitin-Specific Proteases (USP) family is the largest, and the USP family is involved in tumour development, such as USP1, USP7, USP8, USP10, USP20, USP28, etc. (Mennerich et al. Citation2019). For example, USP20 can promote cancer cell proliferation, invasion, and metastasis phenotypes in various cancers by deubiquitinating β-catenin (Wu et al. Citation2018). USP22 regulates the expression of FoxM1 transcription factor through Wnt/β-catenin signalling pathway, which has an impact on pancreatic cancer development (Ning Citation2014). Breast cancer cells’ cisplatin sensitivity and cell stemness are affected by USP37 via the Hedgehog pathway (Qin Citation2019). ……USP43 is a member of the deubiquitinating enzyme USP family, and the relationship between USP43 and tumours was first reported in 2017, in that study, USP43 expression was increased in breast cancer and was able to promote proliferation and epithelial mesenchymal transition in breast cancer cells thereby affecting prognosis (Lin et al. Citation2017) USP43 was also able to inhibit the degradation of ZEB1 by deubiquitinating the ZEB1 transcription factor, thus promoting epithelial mesenchymal transition and proliferation in colorectal cancer cells (Ye et al. Citation2021). In this study, we found that USP43 expression was elevated in ovarian serous adenocarcinoma and was correlated with disease-specific survival (DSS) and overall survival (OS). We used RNA interference (RNAi) technology to research USP43 in order to better understand the molecular processes and underlying mechanisms that it affects, and provide new strategy for the treatment of ovarian serous adenocarcinoma.
Methods
Data acquisition and pre-processing
The TCGA target GTEX dataset was downloaded from the UCSC XENA database and the RNA sequencing data of primary ovarian serous adenocarcinoma and normal ovarian tissue were extracted (Caicedo et al. Citation2020). Corresponding clinical information was obtained from the GDC TCGA Ovarian Cancer dataset of UCSC XENA and Corresponding follow-up information was obtained from the TCGA Pan-Cancer dataset.
Differential gene analysis
The data were processed using the ‘DESeq2’ package in R. For genes with multiple expression data, the maximum value was taken. Genes with expression in at least 60% of the samples were selected for differential analysis; genecodeV42 was downloaded from GENCODE (https://www.gencodegenes.org/) for gene annotation; the screening conditions for differential expression genes were set to |LogFC|> 2 and Padj < 0.01.
Construction of gene Co-expression network and trait association analysis
The differential genes obtained by the above method were used to construct a scale-free gene co-expression network in R using the ‘WGCNA package’. A suitable soft threshold is selected to make the constructed network more consistent with the criteria of scale-free networks. All genes are split into distinct gene co-expression modules with at least 50 genes in each module based on the previously chosen soft thresholds, and the modules with correlations smaller than 0.4 are merged. The correlation between each module and the phenotype was then determined using the module eigengenes of each gene co-expression module that had been calculated.
Screening of hub genes
The gene module with the strongest correlation with the phenotype was selected, and all genes in these modules were correlated with the module eigengene and the phenotype in turn to obtain their module memberships (MMS) and gene significances (GS), respectively. Reasonable thresholds were set according to MMS and GS, thus candidate genes were screened out. The R ‘survival package’ was used to progressively run univariate and multivariate cox regression analyses on the candidate genes based on disease-specific survival before choosing the hub genes.
Validation of hub genes
The MINiML data in the GSE12470, GSE18520 and GSE66957 datasets in the GEO database (https://www.ncbi.nlm.nih.gov/geo/) were downloaded and if the datasets were not normalised, the ‘normalize.quantiles’ function in the preprocessCore package in R was used to normalise the data. According to the corresponding platform annotation information, the probe IDs were converted to gene symbols, probes with multiple genes were excluded, and the mean values of the genes corresponding to multiple probes were calculated.
Survival analysis
Tumour samples were divided into high and low expression groups based on hub gene median expression. Survival analysis was performed based on disease-specific survival and overall survival using the R ‘survival package’.
Immunohistochemistry
In the Human Protein Atlas (HPA) database (Uhlen et al. Citation2017) (Human Protein Atlas proteinatlas.org), immunohistochemical pictures of USP43 in normal ovarian tissues and ovarian serous adenocarcinoma tissues were obtained, where normal ovarian tissues Patient ID: 3036 (http://images.proteinatlas.org/27762/59460_A_4_7.jpg); ovarian serous adenocarcinoma Patient ID: 3115 (http://images.proteinatlas.org/27762/59464_B_3_2. jpg; http://images.proteinatlas.org/27762/59464_B_3_1.jpg).
Cell culture and transfection
All cell lines were purchased from Nanjing Cobioer Biotechnology Corporation (Nanjing, China). The OVCAR3 cell line was cultured in DMEM medium (Hyclone, South Logan, UT, USA)with 10% foetal bovine serum(Hyclone) and 1% penicillin-streptomycin mixture (Procell, Wuhan, China) and incubated under 37 °C, 5% co2 cell. USP43 interfering RNA (NC, SiUSP43-1, SiUSP43-2) was transfected into OVCAR3 cells using lipo3000 (Thermo Fisher Scientific, Waltham, MA, USA), and the cells were collected after 24h for subsequent assays. The interfering sequences was as follows:NC:5′-UUCUUCGAAGGUGUCACGUTT-3′;SiUSP43-1:5′-GGCUGAGAGUUCAGGUGAAUA-3′. SiUSP43-2:5′-CGUUGUCUUGUAAUCUCUAAA-3′.
RT-qPCR
After transfection treatment, the cells were lysed and RNA were extracted using TRIzol (Invitrogen, Carlsbad, CA, USA). cDNA was obtained by reverse transcription using PrimeScript™ II 1st Strand cDNA Synthesis Kit (TaKaRa, Tokyo, Japan) as template, and mRNA was amplified using SYBR™ Green PCR Master Mix(Applied Biosystems, Foster, CA, USA) by adding β-actin primer and USP43 primer. NC was used as the control group, and quantitative analysis was performed by the 2-ΔΔCT method. The primer information was as follows USP43-forward: 5′-CAGTTCTACACACCAAGGAGGAGC-3′; USP43-verse: 5′-GATGTCAGGCAGCGTCCACAAA-3′. β-actin-forward:5′-CACCATTGGCAATGAGCGGTTC-3′; β-actin-reverse:5′- AGGTCTTTGCGGATGTCCACGT-3′
Western blot
After transfection treatment, the protein expression of USP43 and β-actin was detected by immunoblotting; Primary antibody was incubated overnight at 4 °C; We used the gel imaging system to analyse the band density and compare it with the internal control. Primary antibodies included: USP43(GeneTex, Irvine, CA, USA), β-actin(GeneTex), E-cadherin (Cell Signalling Technology, Danvers, MA, USA), Vimentin(Cell Signalling Technology).
Scratch assay and matrigel invasion assay
Scratching experiment: using a pencil to draw horizontal horizontal lines at the bottom of the six-well plate, OVCAR3 cells were seed in the six-well plate with 3 × 10⁶ cells/well, placed in the incubator for 24h, then transfected with NC, SiUSP43-1 and SiUSP43-2 respectively, and continued to be incubated in the incubator for 24h.After the cells were completely attached to the wall, a line was drawn with 10ul pipette tip in the centre of the plate wells perpendicular to the horizontal line.The wells were replaced with original medium and photographed under the microscope at the intersection of the two lines. After being placed in the incubator for 24h, the photos were taken again.
Matrigel Invasion experiment: seed transfected OVCAR3 cells into different upper chambers, put the chambers back into the incubator. After 24h, the he cells on the lower surface of the membrane were fixed with 4% paraformaldehyde and stained with 0.5% crystal solution. Then the cells were photographed using microscope.
Gene functional enrichment analysis
According to the median expression of USP43, tumour samples were divided into USP43 high expression group and USP43 low expression group, and the expression differences between the two groups were analysed and USP43-related differential genes were obtained using the R language ‘DEseq2’ package. The GSEA gene function enrichment analysis was carried out using the ‘clusterProfiler’ tool, and the gene sets employed were oncogenic signature gene sets from the MsigDB database (https://www.gsea-msigdb.org/gsea/msigdb).
Immune infiltration analysis
The percentage of 22 immune cell subtypes in the tumour samples was calculated using the R ‘CIBERSORT’ package, and the difference in the percentage of immune cell subtypes between the USP43 high expression group and USP43 low expression group was analysed using the Wilcoxon rank sum test. The TIMER2.0 database (http://timer.cistrome.org/) was utilised to determine the relationship between the USP43 gene and immune cell subtypes in ovarian cancer. The results that were consistent across both analyses were used as the basis for the final judgement.
Stemness index analysis
The stemness index of each samples was obtained from previous study (Malta et al. Citation2018). According to the USP43 expression, the mRNAsi and EREG-mRNAsi were compared between different groups.
Statistical analysis
Statistical processing was performed using R 4.12. mRNA expression differences after cell transfection, matrigel invasion assay, and western blot were statistically analysed using two independent samples t-test. GEO database expression differences were statistically analysed using two independent samples Wilcoxon rank sum test. Survival analysis were used log-rank test.
Ethical approval and statement of human and animal right
TCGA, GEO and HPA belong to public databases. The patients involved in the database have obtained ethical approval. Users can download relevant data for free for research and publish relevant articles. Our article is based on open source data, so there are no ethical issues. Moreover, this article does not contain any studies with human or animal subjects.
Results
Differentially expressed gene screening
499 samples, including 412 ovarian cancer samples and 87 normal tissue samples, were left after removing samples that were not appropriate for analysis in accordance with the TCGA guideline and outliers based on the findings of principal component analysis (Supplementary Figure 1A). Differential analysis of all genes was performed using Deseq2, and the results showed that there were a total of 5195 differential genes, including 3416 up-regulated genes and 1779 down-regulated genes (Supplementary Figure 1B).
Gene co-expression network construction and hub gene screening
The DESeq2 corrected gene expression data were subjected to WGCNA analysis, and the soft threshold value for analysis was chosen as 6.10 gene modules were ultimately identified when the clustering tree was cut with a similarity coefficient of 0.4 (). These 10 gene modules were correlated with the clinical data, in which the turquoise module was the module with the strongest negative correlation with cancer (r=-0.89,95% CI[-0.90,-0.86] P < 0.001) and the blue module was the module with the strongest positive correlation with cancer (r = 0.69, 95% CI[0.64,0.73], P < 0.001) ().
Figure 1. Weighted gene co-expression network analysis and screening of hub gene. (A) Clustering diagram of gene modules; (B) heat map of correlation analysis between gene modules and phenotypes: age(age), length(maximum diameter length of tumour), stage(tumour stage), grade(pathological grading), lymph (whether there is lymphovascular invasion), metastasis(whether there is distant metastasis), and type(whether it is cancer or not). (C) Screening candidate genes in blue module, the thresholds are MMS > 0.75 and GS > 0.5. D: Screening candidate genes in turquoise module, the thresholds are MMS > 0.8 and GS > 0.8. E: Multivariate COX regression analysis for genes with P < 0.05 after univariate COX regression analysis. * P < 0.05, ** P < 0.01, *** P < 0.001.
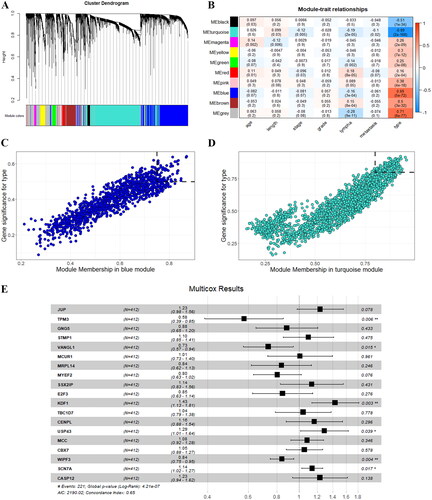
The MMS and GS were calculated for each gene in the blue and turquoise modules, and the scatter plots were plotted. For both modules, here are strong correlation between MMS and GS,0.91(95%CI [0.90,0.92], P < 0.01) for the turquoise modules and 0.47(95%CI [0.45,0.49], P < 0.01) for the blue modules. For the blue module, the screening threshold of candidate genes was set as MMS > 0.75 and GS > 0.5, and a total of 64 candidate genes were obtained (). For the turquoise module, the screening threshold of candidate genes was set as MMS >0.8 and GS >0.8, and a total of 140 candidate genes were obtained () Following univariate cox analysis using DDS survival data on the 204 candidate genes collected above, the candidate genes with p < 0.05 were screened out and subjected to multivariate cox analysis, where the candidate genes with p < 0.05 were again selected out, and ultimately 6 key genes were obtained: TPM3, VANGL1, KDF1, USP43, WIPF3, SCN7A ().
Validation of the key gene USP43
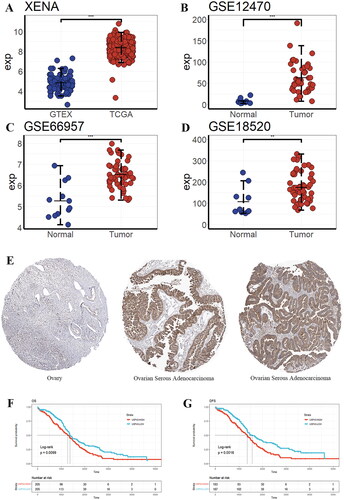
The data from TCGA target GTEX dataset showed that USP43 expression was elevated in tumour tissues (), and the difference was statistically significant (4.85 ± 0.78 vs 8.36 ± 0.68, P < 0.001). USP43 expression data in GSE12470 (3.64 ± 6.16 vs 71.63 ± 77.85), GSE66957 (5.28 ± 0.82 vs 6.52 ± 0.61), GSE18520 (108.32 ± 64.91 vs 180.78 ± 77.67) datasets all showed that USP43 expression was elevated in the tumour group (). Immunohistochemical images of normal ovarian tissues and ovarian serous adenocarcinoma tissues were retrieved from the HPA database in order to further study the role of USP43. The expression of USP43 was much higher in tumour tissues than in normal ovarian tissues, according to immunohistochemistry (), and the expression region was found in the cytoplasm of tumour cells. The tumour groups were split into USP43 high expression and USP43 low expression groups based on the median USP43 expression. According to the survival analysis, there were statistically significant differences between the USP43 high expression group and the USP43 low expression group in terms of OS (P = 0.0099) and DSS (P = 0.0016) ().
Figure 2. Validation of the hub gene USP43. (A) USP43 mRNA expression in different data sets. (E) Immunohistochemistry of USP43 protein in normal ovarian tissues and ovarian cancer tissues. (F) Overall survival of USP43 high and low expression groups. (G) Disease-specific survival of USP43 high and low expression groups. * P < 0.05, ** P < 0.01, *** P < 0.001.
USP43 promotes ovarian cancer cell migration and invasion through epithelial-mesenchymal transformation
The expression of USP43 mRNA was detected in ovarian cancer cell lines using qPCR, and the OVCAR3 cell line had higher USP43 mRNA expression than the other two lines (). qPCR results showed high efficiency of USP43 gene silencing within the OVCAR3 cell line (); WB results showed that transfection of SiRNA could reduce the expression of USP43 protein in OVCAR3 cells (). The results of the scratch assay showed that the migration ability of cells in the SiUSP43-2 group was significantly reduced compared with the NC group, and the difference was statistically significant (43.27 ± 3.91% vs 19.69 ± 1.94%, P < 0.01, ). The results of the matrigel invasion assay showed that the invasion ability of cells in the SiUSP43-2 group was significantly reduced compared with the NC group, and the difference was statistically significant (314 ± 32 vs 131 ± 12, P < 0.05, ). The above results suggest that USP43, which is highly expressed in ovarian cancer cells, can promote the migration and invasive ability of tumour cells, which ultimately affects disease progression.
Figure 3. USP43 Promotes Ovarian Cancer Cell Migration and Invasion through epithelial-mesenchymal transformation. (A) Expression of USP43 mRNA in different cell lines. (B,C) Interference efficiency of different groups after RNAi interference; (D) USP43 promotes OVCAR3 cell migration; (E) USP43 promotes OVCAR3 cell invasion; (F) Western blot of expression of epithelial mesenchymal transition marker protein after interference with USP43. (G) Gene Set Enrich Analysis results of USP43-related genes. * P < 0.05,** P < 0.01,*** P < 0.001.
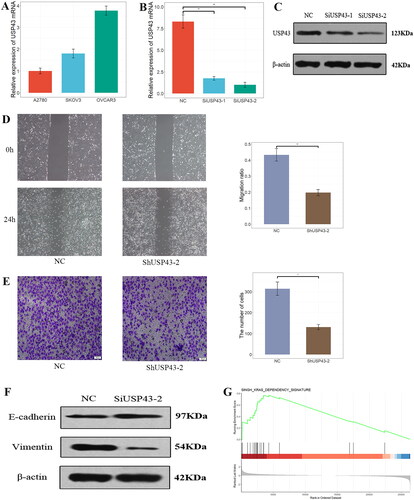
To elucidate the mechanism behind above phenomena, the expression of epithelial mesenchymal transition markers in OVCAR-3 cells was examined using Western blot technique. In cells with knockdown of USP43 protein, E-cadherin expression increased and Vimentin expression decreased () and the difference is statistically significant (Supplementary Figure 2A). It is suggested that knockdown of USP43 can inhibit the epithelial mesenchymal transition of tumour cells. This also suggested that USP43 could enhance cell migration and invasion by promoting cell epithelial mesenchymal transition. The tumour samples were classified into high or low expression group according to the USP43 expression (Supplementary Figure 2B). GSEA enrichment analysis result of USP43-related differential genes in oncogenic signature gene sets has 24 meaningful pathways (Supplementary Figure 2C). The most meaningful was closely related to KRAS signal pathway (), suggesting that, USP43 may affect epithelial mesenchymal transition of tumour cells through KRAS-related pathway.
USP43 is associated with immune cell infiltration and tumour stemness
The CIBERSORT results showed that the proportion of activated NK cells and resting CD4+ memory T cells increased and the proportion of M1 macrophages decreased in the tumours of the USP43 high expression group compared with the USP43 low expression group (Supplementary Figure 3A), and the differences were statistically significant (P < 0.01, P < 0.05, P < 0.05). The above results were verified using the TIMER2 database, which showed that the USP43 gene was positively correlated with resting CD4+ memory T cells (Rho = 0.16, P = 0.0116), negatively correlated with M1 macrophages (Rho = −0.224, P = 0.000358) (Supplementary Figure 3B), and not with activated NK cells (Rho=-0.028, P = 0.665) (Supplementary Figure 3C).
The stemness index, calculated by machine learning algorithm, can be used as a quantification measure of the stemness of tumour samples. The results showed that there was no difference in the mRNA stemness index (mRNAsi) between the two group (0.41 ± 0.07 vs 0.43 ± 0.06, P > 0.05) (Supplementary Figure 3D). However, there was a significant difference in EREG-mRNAsi, with the high expression group showing a higher index compared to the low expression group. (0.52 ± 0.11 vs 0.57 ± 0.11, P < 0.01) (Supplementary Figure 3E).
Discussion
Ovarian cancer can be divided into epithelial ovarian cancer and non-epithelial ovarian cancer according to the histological type, of which epithelial ovarian cancer accounts for 90% of all ovarian cancers; 97% of these epithelial ovarian cancers are non-mucinous ovarian cancers, while serous adenocarcinoma discussed in the article accounts for 70% of non-mucinous ovarian cancers; Among them, 80% of patients with serous adenocarcinoma are already in the progressive stage at the time of initial diagnosis (51%stage III, 29%stage IV) and the ultimate five-year survival rate is only 20%. Therefore, it is important to investigate the mechanism of its development and metastasis and to find its molecular therapeutic targets.
Ubiquitination is involved in the regulation of multiple biological processes, and there is increasing evidence that ubiquitination can influence cancer development and progression; and the largest family of deubiquitinating enzymes, the USP family, has been shown to be associated with the development of multiple cancers, and the corresponding USP protein inhibitors also, such as Pimozide, Vialinin A, Mitoxantrone, etc., have shown inhibitory effects on cancer cell-related phenotypes (Morrow et al. Citation2015). The relationship between USP43 protein, discussed in the paper, and cancer has only been reported in breast, colorectal and non-small cell lung cancer, and its relationship with ovarian cancer was first suggested by this study. By exploring the relationship between USP43 and survival, it was found that OS and DSS were significantly prolonged in the USP43 low expression group compared to the USP43 high expression group, which implies that USP43 as a potential drug target. But which relevant clinical features (e.g. tumour stage, pathological grade, and chemotherapy sensitivity) are affected by USP43 have not been elucidated. In addition, the overall survival is also associated with the patient’s frailty status (D’Oria et al. Citation2022), which was not analysed as a potential influencing factor in this study. Therefore, the final results may be subject to bias.
To investigate the relationship between USP43 and ovarian cancer, RNAi technology was used to knock down the expression of USP43 gene in ovarian cancer cell lines with high expression of USP43, and eventually the relationship between USP43 and cell migration and cell invasion was found, i.e. USP43 could enhance the migration and invasion ability of ovarian cancer cells, and in order to explain the above phenomenon, epithelial mesenchymal transition relevant markers were detected. Finally, USP43 was found to promote epithelial mesenchymal transition in ovarian cancer cells. It was concluded that USP43 promotes ovarian cancer cell migration and invasion through epithelial mesenchymal transition. In contrast to most epithelial malignancies through vascular metastasis, epithelial ovarian cancer metastasises mainly through implantation and adheres to peritoneal tissues, a metastatic mode that is more dependent on epithelial mesenchymal transition. To continue the exploration, the following question needs to be clarified: the cellular localisation of USP43 protein. Presumably, USP43 is localised in the cytop lasm of ovarian cancer cells based on immunohistochemical results, but according to data from the database, USP43 is mainly present in the nucleus of the cells. Is this difference in subcellular localisation the result of different experimental methods or is it similar to the HMGB1 protein, which is associated with the development of cancer (Wang et al. Citation2020)? This difference in subcellular localisation also suggests the need for mutation analysis of USP43.
Furthermore, although the relationship between deubiquitinating enzymes and tumour epithelial mesenchymal transition has been addressed (Dai and Ye Citation2022) and the association of USP43 with KRAS signal pathway has been suggested by the GSEA functional enrichment approach. The mechanism by which USP43 affects epithelial mesenchymal transition has not been elucidated. Epithelial mesenchymal transition has been shown to be associated with multiple signal pathways and transcription factors (Georgakopoulos-Soares et al. Citation2020), among which SNAIL1 and SNAIL2 can bind to the E-box sequence of the E-cadherin promoter, thereby inhibiting E-cadherin protein expression, and SNAIL1 is highly expressed in ovarian cancer and affects prognosis; KLF8 can directly inhibit E-cadherin protein expression by regulating the E-cadherin promoter. cadherin promoter and promote epithelial mesenchymal transition in ovarian cancer (Lu et al. Citation2014); FOXC2 has also been reported to be associated with epithelial mesenchymal transition in ovarian cancer (Liu et al. Citation2014). If USP43 subcellular localisation is in the nucleus, its interaction with the above transcription factors may be responsible for the promotion of epithelial mesenchymal transition by USP43.
In recent years, immunotherapy for cancer has gradually become a mainstream treatment approach for ovarian cancer (Fagotti et al. Citation2020), with immune surveillance playing a crucial role. Macrophages are immune cells that play an important role in tumour development and progression. M1 macrophages play an important role in tumour immune surveillance. M1 macrophages are a special type of macrophages with activated state and anti-inflammatory properties. They recruit other immune cells, such as natural killer cells and T cells, by releasing various cytokines and chemokines to collaborate in the anti-tumour response. In early-stage tumours, M1 macrophages can recognise and destroy cancer cells, thus stopping tumour progression (Wu et al. Citation2020). CD4+ memory T cells can recognise and kill tumour cells and inhibit tumour growth and metastasis by secreting cytotoxins, cytokines, and other immune molecules. Second, CD4+ memory T cells can regulate the activity of other immune cells, such as enhancing the killing effect of tumour-specific CD8+ T cells and promoting the activity of natural killer cells and macrophages, thus enhancing the immune system’s ability to attack tumours (Ostroumov et al. Citation2018). The ubiquitin-specific protease family also has significant effects on tumour immunity. For example, USP8 promotes pancreatic tumour growth through immune evasion by inhibiting ubiquitination-regulated proteasomal degradation pathways upregulating PD-L1 levels (Yang et al. Citation2023). In this paper, we found an association between USP43 and immune cell infiltration in ovarian cancer and hypothesised that USP43 contributes to an immunosuppressive microenvironment by inhibiting M1 macrophage formation and decreasing CD4+ T memory cell activity, ultimately leading to tumour development. This echoes the conclusion in another article that the proportion of M2 macrophages is positively correlated with cancer stage (Jammal et al. Citation2022).
Tumour stem cells are a small subset of cells within a tumour that possess the ability for self-renewal and multi-lineage differentiation. They are considered key factors in tumour development and drug resistance (Laganà et al. Citationn.d.). Due to the limited sample size, the difference in mRNAsi between the two groups may not be significant. However, the elevation of EREG-mRNAsi in the high expression group of USP43 suggests that the impact of USP43 on survival might be mediated through epigenetic alterations. Another possibility is that the changes in USP43 expression could be the cause of the epigenetic modifications.
In addition to studying the mechanisms of disease, the prevention and diagnosis of diseases are also important research areas. Among them, the relationship between metabolic diseases, represented by obesity, and cancer is increasingly recognised. Preventing obesity has been proven to be an effective primary prevention measure for gynecological tumours (Giannini et al. Citation2022). Moreover, obesity can lead to a decrease in the overall detection rate of sentinel lymph nodes during surgery, resulting in inaccurate staging and prognostic assessment, and affecting the selection of subsequent treatment plans (Vargiu et al. Citation2022). The USP family is closely associated with metabolic diseases. USP19, which promotes fat synthesis, is a potential therapeutic target for diabetes (Coyne et al. Citation2019). USP20, when phosphorylated, can inhibit the degradation of HMG-CoA reductase, leading to elevated cholesterol levels (Lu et al. Citation2020). Additionally, USP43 may also impact metabolism in the body. Targeting USP43 as a therapeutic target for ovarian cancer can not only inhibit the progression of ovarian cancer but also increase the success rate of surgery by reducing BMI.
In conclusion, this study showed that USP43 can promote the migration and invasion of ovarian cancer cell by promoting epithelial mesenchymal transformation and inducing an immunosuppressive microenvironment and increase tumour stemness, suggesting that USP43 may become a new target for ovarian serous adenocarcinoma treatment and providing a theoretical basis for drug development. However, there are certain limitations in the current study. During the multi-factorial Cox regression analysis, common prognostic factors such as tumour stage, patient age, and frailty status were not included. This omission could potentially introduce bias into our findings. Additionally, immunohistochemistry results indicating the subcellular localisation of USP43 in the cytoplasm appear to contradict database information. Consequently, further investigation is required to validate the final results. The uncertainty surrounding the subcellular localisation of USP43 has also led to an unclear understanding of its direct interaction sites within the KRAS signal pathway. Furthermore, the analyses conducted thus far on the relationship between USP43 and tumour stemness have been primarily correlational, rather than indicative of causal inference. Addressing these limitations necessitates a more comprehensive and in-depth exploration to elucidate the role of USP43 in ovarian cancer.
Supplemental Material
Download Zip (3.4 MB)Disclosure statement
The authors declare that there is no conflicts of interest of financial ties to disclose regarding to this article.
Data available statement
All of data this study used were obtained from open access database. The data generated after analysing in present study are available from the corresponding author on reasonable requests.
Additional information
Funding
References
- Caicedo, H.H., et al., 2020. Overcoming barriers to early disease intervention. Nature Biotechnology, 38 (6), 1–11.
- Coyne, E.S., et al., 2019. The deubiquitinating enzyme USP19 modulates adipogenesis and potentiates high-fat-diet-induced obesity and glucose intolerance in mice. Diabetologia, 62 (1), 136–146.
- D’Oria, O., et al., 2022. The role of preoperative frailty assessment in patients affected by gynecological cancer: a narrative review. Italian Journal of Gynaecology and Obstetrics, 34 (02), 76.
- Dai, J. and Ye, M., 2022. The role of deubiquitinases in tumour epithelial-mesenchymal transition. Chinese Journal of Biochemistry and Molecular Biology, 38 (6), 717–724.
- Fagotti, A., et al., 2020. Randomized trial of primary debulking surgery versus neoadjuvant chemotherapy for advanced epithelial ovarian cancer (SCORPION-NCT01461850). International Journal of Gynecologic Cancer, 30 (11), 1657–1664.
- Georgakopoulos-Soares, I., et al., 2020. EMT factors and metabolic pathways in cancer. Frontiers in Oncology, 10, 499.
- Giannini, A., et al., 2022. Advances on prevention and screening of gynecologic tumours: Are we stepping forward? Healthcare, 10 (9), 1605.
- Jammal, M.P., et al., 2022. Mast cells and M2 macrophages in ovarian cancer. Journal of Obstetrics and Gynaecology, 42 (7), 3094–3100.
- Laganà, A.S., et al., n.d. Cytogenetic analysis of epithelial ovarian cancer’s stem cells: an overview on new diagnostic and therapeutic perspectives.
- Lin, F., et al., 2017. USP43 promotes tumorigenesis through regulating cell cycle and EMT in breast cancer. International Journal of Clinical and Experimental Pathology, 10 (11), 11014–11021.
- Liu, B., et al., 2014. Overexpressed FOXC2 in ovarian cancer enhances the epithelial-to-mesenchymal transition and invasion of ovarian cancer cells. Oncology Reports, 31 (6), 2545–2554.
- Lu, H., et al., 2014. Transformation of human ovarian surface epithelial cells by Krüppel-like factor 8. Oncogene, 33 (1), 10–18.
- Lu, X.-Y., et al., 2020. Feeding induces cholesterol biosynthesis via the mTORC1–USP20–HMGCR axis. Nature, 588 (7838), 479–484.
- Malta, T.M., et al., 2018. Machine learning identifies stemness features associated with oncogenic dedifferentiation. Cell, 173 (2), 338–354.e15.
- Mennerich, D., Kubaichuk, K. and Kietzmann, T., 2019. DUBs, hypoxia, and cancer. Trends in Cancer, 5 (10), 632–653.
- Momenimovahed, Z., et al., 2019. Ovarian cancer in the world: epidemiology and risk factors. International Journal of Women’s Health, 11, 287–299.
- Morrow, J.K., et al., 2015. Targeting ubiquitination for cancer therapies. Future Medicinal Chemistry, 7 (17), 2333–2350.
- Ning, Z., 2014. USP22 promote Wnt/β-catenin signaling pathway-mediated FoxM1 expression and induces epithelial-mesenchymal transition in pancreatic ductal adenocarcinoma. Thesis (PhD). Dalian Medical University.
- Ostroumov, D., et al., 2018. CD4 and CD8 T lymphocyte interplay in controlling tumour growth. Cellular and Molecular Life Sciences, 75 (4), 689–713.
- Qin, T., 2019. Mechanism of usp37 in regulation of breast cancer stemness, EMT and cisplatin sensitivity via Hedgehog pathway. Thesis (PhD). Dalian Medical University.
- Rezaei, Z., et al., 2022. Identification of early diagnostic biomarkers via WGCNA in gastric cancer. Biomedicine & Pharmacotherapy, 145, 112477.
- Uhlen, M., et al., 2017. A pathology atlas of the human cancer transcriptome. Science (New York, N.Y.), 357 (6352), eaan2507.
- van Dam, S., et al., 2017. Gene co-expression analysis for functional classification and gene–disease predictions. Briefings in Bioinformatics, 19 (4), 575–592.
- Vargiu, V., et al., 2022. Impact of obesity on sentinel lymph node mapping in patients with apparent early-stage endometrial cancer: The ObeLyX study. Gynecologic Oncology, 165 (2), 215–222.
- Wang, C.-Q., et al., 2020. Subcellular localization of HMGB1 in colorectal cancer impacts on tumour grade and survival prognosis. Scientific Reports, 10 (1), 18587.
- Wu, C., et al., 2018. USP20 positively regulates tumourigenesis and chemoresistance through β-catenin stabilization. Cell Death & Differentiation, 25 (10), 1855–1869.
- Wu, K., et al., 2020. Redefining tumour-associated macrophage subpopulations and functions in the tumour microenvironment. Frontiers in Immunology, 11, 1731.
- Xia, C., et al., 2022. Cancer statistics in China and United States, 2022: profiles, trends, and determinants. Chinese Medical Journal, 135 (5), 584–590.
- Yang, H., et al., 2023. Targeting ubiquitin-specific protease 8 sensitizes anti-programmed death-ligand 1 immunotherapy of pancreatic cancer. Cell Death and Differentiation, 30 (2), 560–575.
- Ye, D., et al., 2021. USP43 directly regulates ZEB1 protein, mediating proliferation and metastasis of colorectal cancer. Journal of Cancer, 12 (2), 404–416.