

Abstract
Background
Cystatin SA (CST2) plays multiple roles in different types of malignant tumours; however, its role in serous ovarian cancer (SOC) remains unclear. Therefore, we aimed to investigate the expression levels, survival outcomes, immune cell infiltration, proliferation, cell cycle, and underlying molecular mechanisms associated with the CST2 signature in SOC.
Methods
The Cancer Genome Atlas database was used to acquire clinical information and CST2 expression profiles from patients with SOC. Wilcoxon rank-sum tests were used to compare CST2 expression levels between SOC and normal ovarian tissues. A prognostic assessment of CST2 was conducted using Cox regression analysis and the Kaplan–Meier method. Differentially expressed genes were identified using functional enrichment analysis. Immune cell infiltration was examined using a single-sample gene set enrichment analysis. Cell cycle characteristics and proliferation were assessed using a colony formation assay, flow cytometry, and a cell counting kit-8 assay. Western blots and quantitative reverse transcription PCR analyses were employed to examine CST2 expressions and related genes involved in the cell cycle and the Wnt-β-catenin signalling pathway.
Results
Our findings revealed significant upregulation of CST2 in SOC, and elevated CST2 expression was correlated with advanced clinicopathological characteristics and unfavourable prognoses. Pathway enrichment analysis highlighted the association between the cell cycle and the Wnt signalling pathway. Moreover, increased CST2 levels were positively correlated with immune cell infiltration. Functionally, CST2 played vital roles in promoting cell proliferation, orchestrating the G1-to-S phase transition, and driving malignant SOC progression through activating the Wnt-β-catenin signalling pathway.
Conclusions
The elevated expression of CST2 may be related to the occurrence and progression of SOC by activating the Wnt-β-catenin pathway. Additionally, our findings suggest that CST2 is a promising novel biomarker with potential applications in therapeutic, prognostic, and diagnostic strategies for SOC.
PLAIN LANGUAGE SUMMARY
Serous ovarian cancer is a type of gynecological malignant tumour with high mortality rates. Understanding this disease is crucial for improving treatments and enhancing patient survival. In our study, we investigated a protein called CST2 and its role in serous ovarian cancer. We found that CST2 levels vary among patients and are associated with the progression of cancer and the prognosis of the patient, which could be valuable for future diagnosis and treatment strategies. However, further research is needed to validate these findings. Despite its limitations, our findings suggest that CST2 holds promise as a potential biomarker for detecting serous ovarian cancer and as a therapeutic target in the management of patients with this type of cancer.
Introduction
Ranking second among cancers that cause the highest number of female deaths, ovarian cancer (OC) is associated with multiple aetiologies, histopathologies, and biological features (Karnezis et al. Citation2017), with 19,880 new cases and 12,810 deaths in the United States in 2022 (Siegel et al. Citation2022). Serous ovarian cancer (SOC) is the predominant histological subtype and constitutes over 70% of all OC cases (Lheureux et al. Citation2019). The metastatic and advanced disease has been diagnosed in more than 75% of patients with high-grade serous ovarian cancer (HGSOC), with five-year survival rates of only approximately 31% (Geistlinger et al. Citation2020, Bray et al. Citation2018). Due to its poor prognosis, limited therapeutic avenues, elevated recurrence rates, and notable resistance to treatment, SOC is the most lethal type of gynaecologic cancer. Consequently, the identification of innovative therapeutic targets and prognostic indicators for patients with SOC is of paramount importance.
Cystatin SA (CST2), which is situated on chromosome 20, comprises 115 amino acid residues and is stabilised by two disulphide bonds. CST2 expression is upregulated in mildasthma, suggesting that it is involved in the inflammatory response associated with mild wheezing (Singhania et al. Citation2018). Moreover, CST2 is a valuable non-invasive indicator of early recurrence and medical refractoriness in chronic rhinosinusitis with nasal polyps, offering potential benefits in disease prediction and guiding personalised treatment approaches (Mueller et al. Citation2019). Furthermore, as an oncogene, CST2 plays multiple roles in a diverse range of malignant tumours, potentially contributing to both diagnosis and prognosis (Bao et al. Citation2019, Cheng et al. Citation2019, Liu et al. Citation2018, Wang et al. Citation2017). The present study found that colorectal cancer tissues had higher CST2 mRNA expression compared to normal tissues based on online databases (Xie et al. Citation2021). The overexpression of CST2 has been found to be associated with adverse prognostic outcomes in patients with gastric cancer, as well as promoting the proliferation, migration, and invasion of gastric cancer cells through the regulation of the epithelial–mesenchymal transition and TGF-β1 signalling pathways (Zhang et al. Citation2020). We hypothesised that CST2 may also be associated with the occurrence and progression of SOC and affect patient prognosis.
Therefore, this study aimed to perform bioinformatics analyses to investigate the expression level, survival rate, immune cell infiltration, and underlying molecular mechanisms related to the CST2 signature in SOC. Moreover, we developed cell model assays to reveal the role of CST2 in SOC progression, which may aid clinicians in treatment refinement and improve outcomes in patients with SOC.
Methods
Study cohorts and data processing
Clinical information and CST2 RNA-sequencing data were collected from 381 patients with SOC through the Cancer Genome Atlas (TCGA; https://portal.gdc.cancer.gov/) database at the Cancer Genome Browser of University of California-Santa Cruz (UCSC; https://xenabrowser.net/datapages/), with clinicopathological characteristics detailed in Supplementary Table 1. Based on a median CST2 mRNA expression of 0.526 (range, 0.164–1.287), the CST2 expression levels of SOC patients were defined as low- or high-expression groups. Gene expression data from normal ovarian tissues (n = 88) were sourced from the Genotype Tissue Expression (GTEx; https://commonfund.nih.gov/gtex) database. Receiver operating characteristic (ROC) curves were used to assess the accuracy of CST2 for predicting benign and malignant ovarian tumours. Data analyses were performed using the pROC package (version 1.18.0) (Robin et al. Citation2011), followed by visualising the results through the R package ggplot2 (version 3.3.6) (Gustavsson et al. Citation2022).
Clinical manifestation analysis and prognostic analysis
The clinical data and prognostic profiles of patients with SOC were obtained from the UCSC database. Associations between clinicopathological features and CST2 expression were assessed using the Wilcoxon rank-sum test. Fitted survival regression analyses and proportional hazard hypothesis tests were performed using the survival package. The outcomes, including disease-specific survival (DSS), overall survival (OS), and progression-free survival (PFS), were represented as Kaplan–Meier curves generated with the survminer and ggplot2 packages. Additionally, a nomogram model was constructed and visualised for individual prognostic prediction in patients with SOC using the rms package in conjunction with Cox regression analysis.
Functional enrichment analyses
We used the R packages DESeq2 and edgeR to screen out differentially expressed genes (DEGs) between the high- and low-expression groups of CST2 in SOC in the TCGA database (Love et al. Citation2014). The threshold criteria were set at p.adj <0.05, and |log2FC| >1.0. The DEGs were visualised using a volcano plot. For functional enrichment analyses, we employed the clusterProfiler package and the org.Hs.eg.db package (Yu et al. Citation2012), which encompasses the Kyoto Encyclopaedia of Genes and Genomes (KEGG), gene set enrichment analyses (GSEA) (Subramanian et al. Citation2005), and Gene Ontology (GO) enrichment analyses. Pertinent cellular components, molecular functions, biological processes, and significantly enriched pathways were visualised using the R package ggplot2 based on the normalised enrichment score.
Analysis of immune infiltrations
The expression profiles of immune-related genes (including 24 immune cells) (Bindea et al. Citation2013) were used to calculate immune infiltration levels, and the relative enrichment scores of immune cells in SOC were examined via single-sample GSEA using the R package GSVA (Hänzelmann et al. Citation2013). Spearman’s correlation was used to ascertain the relationship between immune cell infiltration and CST2 expression. Statistical significance was defined as p < 0.05.
Tissue samples and cell treatment
High-grade serous ovarian cancer specimens (n = 5) and their corresponding adjacent tissues (n = 5) were procured from the Department of Gynaecology of the Affiliated Hospital of Chengde Medical University. The normal ovarian epithelial cell line HOSE and human ovarian serous carcinoma cell lines (Anglne, CAOV3, OVCAR-3, and SKOV-3) were acquired from Procell Life Technology (Wuhan, China). The cells were cultured in the indicated media at 37 °C and 5% CO2. Cell transfections were performed following manufacturers’ instructions (Lipofectamine™ 3000 Transfection Reagent, Thermo Fisher Scientific, Waltham, MA, USA).
Plasmid and siRNA construction
Based on the human CST2 gene sequence (NM_001322.3), the primers (F)5′-TCACACTGACCACCTCCTACTCC-3′ and (R)5′-GCCTTCTCTGTCTTCTCCTGCTG-3′ were employed to subclone the PCR-amplified human CST2 full-length complementary DNA (cDNA) into the pcDNA3.1(+) vector and construct the CST2 overexpression plasmid. Negative control (si-NC) and two small interfering RNAs (siRNAs) targeting CST2 (si-CST2#1 and si-CST2#2) were purchased from GenePharma (Shanghai, China). The oligonucleotide sequences of si-CST2#1 and #2 were 5′-GTGAATTACTTCTTCGACATA-3′ and 5′-AGGGAGTCACACTGACCACCT-3′, respectively.
Western blots and quantitative reverse-transcription PCR (qPCR)
TRIzol was used for total RNA extraction, and subsequent cDNA synthesis was performed via reverse transcription using the Takara RNA PCR KIT (AMV) Ver 3.0 (Takara, Japan). Both the internal reference (GAPDH) and target genes were amplified using specific primers (sequences are listed in Supplementary Table 2) and SYBR Green qPCR Super MIX-UDG (Thermo Fisher Scientific). The relative target gene expression levels were calculated utilising the 2-ΔΔCt method.
Protein samples from each group were quantified using the bicinchoninic acid method. Subsequently, 30 μg of protein underwent sodium dodecyl sulfate-polyacrylamide gel electrophoresis, followed by transfer onto nitrocellulose membranes (Pall Life Science, Beijing, China). The membranes were blocked by 0.5% skim milk powder for 2 h at 25 °C (Solarbio, Beijing, China). Next, the primary antibody was employed for overnight incubation at 4 °C, and the horseradish peroxidase-conjugated secondary antibody (1:3000; Proteintech, Wuhan, China) was then employed for 1 h incubation at 25 °C. Imaging and quantitative analysis were conducted using ChemiDoc™ XRS+ (BioRad, Irvine, CA, USA). Detailed information regarding the primary antibodies used is provided in Supplementary Table 3.
Cell counting kit-8 (CCK-8) assays
After transfection, the cells were harvested from each experimental group. Cell density was standardised to 4 × 10³ cells per well, with each group comprising six wells. Subsequently, at different time intervals after transfection, 10 mL of CCK (Solarbio) stock solution was introduced, followed by an incubation period of 2.5 h at 37 °C.
Colony formation assays
Cells were evenly distributed (500 cells/well) in 6-well plates and cultured for 10–14 d culture, with routine culture medium replacement. Once the colony size exceeded 50 cells, a solution of 10% methanol, pre-chilled at 4 °C, was introduced into the cells for 15 min incubation. The cells were fixed with 0.1% crystal violet for an additional 15 min before counting the colonies.
Cell cycle detection
Transfected SOC cells were gently centrifuged at 20×g for 5 min at 25 °C. The cells were then resuspended in phosphate buffered saline (PBS) at a density of 1 × 10⁵ cells/mL. After thoroughly mixing with 75% alcohol, the cells were incubated for 2 h at 4 °C. The cells were rinsed with PBS and centrifuged at 20×g for 3 min. Next, 400 μL of the cell cycle detection reagent from the Tali™ Cell Cycle Kit (Thermo Fisher Scientific) was used for cell resuspension, followed by further flow cytometric analyses.
Statistical analyses
Statistical analyses were performed using the SPSS software (version 25.0; Chicago, IL, USA). Wilcoxon rank-sum tests and Student’s t-tests were used to compare significant differences between the two groups. One-way analysis of variance (ANOVA) was employed to assess p values in cases involving more than two groups. Statistical significance was set at p < 0.05.
Ethics approval statement
Protocol of the study was approved by the Ethics Committee of the Affiliated Hospital of Chengde Medical University and complied with the Declaration of Helsinki (CYFYLL2022402).
Results
CST2 expression analyses
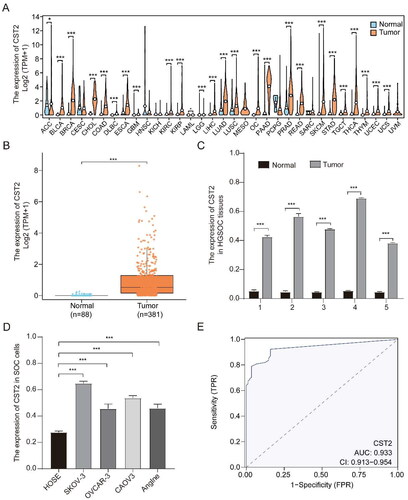
Pan-cancer analysis revealed that CST2 exhibited higher expression levels in various tumour samples, including OC (). Higher mRNA levels of CST2 were detected in SOC samples of the versus in normal ovarian tissues (). Moreover, CST2 mRNA expression was higher in SOC cell lines (Anglne, CAOV3, OVCAR-3, and SKOV-3) than that in HOSE cell lines (). The ROC curve demonstrated that CST2 mRNA expression levels were effective in discriminating between normal and SOC tissues, with an area under the curve (AUC) of 0.933 (95% confidence interval (CI), 0.913–0.954] ().
Figure 1. CST2 mRNA expression is upregulated in tumours. CST2 mRNA expression (A) in normal tissues and multiple tumours as well as (B) in SOC and non-matched normal tissues in the GTEx and TCGA databases, (C) in five fresh HGSOC samples and their adjacent normal tissues, and (D) in HOSE and SOC cell lines. (E) The ROC curve to clarify normal ovarian tissues and SOC in the TCGA database. * p < 0.05, ** p < 0.01, *** p < 0.001. OC: ovarian cancer; SOC: serous ovarian cancer; HGSOC: high-grade serous ovarian cancer; ROC: receiver operating characteristic; GTEx: Genotype Tissue Expression Project; TCGA: The Cancer Genome Atlas.
Association between advanced clinico-pathological features and high CST2 expression in patients with SOC
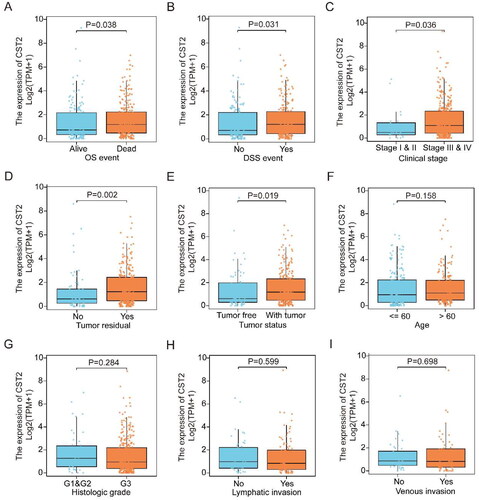
As depicted in , elevated CST2 expression significantly correlated with residual tumours (p = 0.002), tumour status (p = 0.019), clinical stage (stage III/IV vs. stage I/II, p = 0.036), DSS (p = 0.031), and OS (p = 0.038). However, CST2 expression was not significantly associated with venous (p = 0.698) or lymphatic (p = 0.599) invasion, histological grade (p = 0.284), or patient age (p = 0.158).
Figure 2. Relationships among CST2 expression and clinico-pathological features. (A) OS, (B) DSS, (C) clinical stages, (D) residual tumour, (E) tumour status, (F) age, (G) histologic grade, (H) lymphatic invasion, and (I) venous invasion. DSS: disease-specific survival; OS: overall survival.
High CST2 expression is a predictor of poor prognosis in patients with SOC
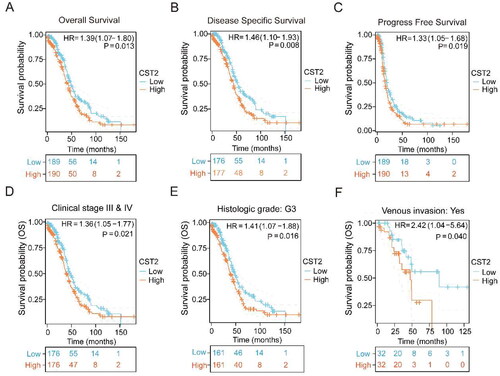
Patients with high CST2 expression levels showed significantly poorer DSS (HR = 1.46, 95% CI: 1.10–1.93, p = 0.008), OS (HR = 1.39, 95% CI: 1.07–1.80, p = 0.013), and PFS (HR = 1.33, 95% CI: 1.05–1.68, p = 0.019) than those with low expression levels (). Furthermore, association was observed between the elevated CST2 expression levels and worse OS in clinical stages III/IV (HR = 1.36, 95% CI: 1.05–1.77, p = 0.021, ), histologic grade G3 (HR = 1.41, 95% CI: 1.07–1.88, p = 0.016, ), and venous invasion (HR = 2.42, 95% CI: 1.04–5.64, p = 0.040, ).
Figure 3. Kaplan–Meier survival curves displaying low- and high-CST2 expressions in SOC patients in the TCGA database. (A) OS, (B) DSS, (C) PFS, (D) clinical stages III and IV, (E) histologic grade G3, and (F) venous invasion. HR: Hazard Ratio; DSS: disease-specific survival; OS: overall survival; PFS: progress-free survival; SOC: serous ovarian cancer.
Constructing and validating nomogram
In univariate analyses, five variables exhibited prognostic significance: age, clinical stage, tumour status, residual tumour, and CST2 expression (Supplementary Table 4). These significant variables were used to construct a nomogram for the 1-, 3-, and 5-year OS predictions of patients with SOC (Supplementary Figure 1A). A higher point accumulation in the nomogram corresponded to a worse prognosis (Supplementary Figure 1A). Moreover, its predictive performance was further examined using calibration curves (Supplementary Figure 1B–D). Time-dependent ROC curves showed the superior predictive capacity of the nomogram for OS (Supplementary Figure 2A–C).
DEGs analyses
In comparison to the CST2 low-expression group, we identified 189 DEGs in the CST2 high-expression group. Of these, 154 (81.5%) were upregulated and 35 (18.5%) were downregulated (Supplementary Figure 3A and Supplementary Table 5). Relationships between CST2 and the top 15 DEGs are shown in Supplementary Figure 3B.
Correlation between immune cells infiltration and CST2 expression
Compared with the low-CST2 expression group, the high-CST2 expression group was associated with notably higher enrichment scores for natural killer (NK) cells, mast cells, eosinophils, and CD8+ T cells (all p < 0.05; Supplementary Figure 4A–D). Additionally, CST2 positively correlated with NK cells (r = 0.174, p < 0.001), mast cells (r = 0.244, p < 0.001), eosinophils (r = 0.142, p = 0.005), and CD8+ T cells (r = 0.150, p = 0.003), all of which play essential roles in humoral immunity (Supplementary Figure 4E–H).
CST2 promotes cell proliferation
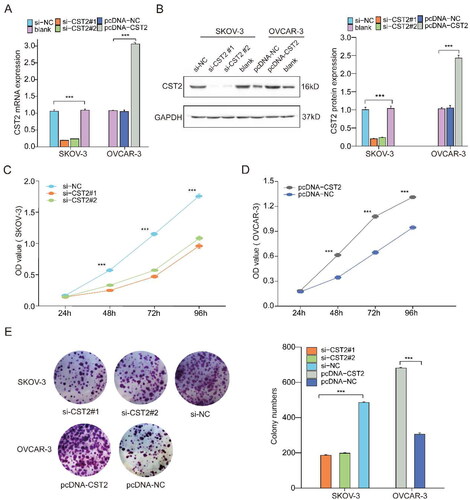
To reveal the roles of CST2 in SOC cell processes, we constructed CST2-knockdown in SKOV-3 cells using two CST2-specific siRNAs and detected the interference efficiency using western blotting and qPCR (). The CCK-8 assay demonstrated that CST2 knockdown dramatically reduced SKOV-3 cell proliferation (). Furthermore, the results of colony formation assays indicated a significantly decreased mean colony count upon CST2 knockdown (). We overexpressed CST2 in OVCAR-3 cells (). Both colony formation and CCK-8 assays revealed a marked increase in the growth rate of OVCAR-3 cells compared to that of HOSE cells induced by CST2 ().
Figure 4. CST2 promotes the proliferation of SOC cells. Knockdown and overexpression of CST2 in SOC cells (SKOV-3 and OVCAR-3) utilising (A) qPCR and (B) western blots. (C) CCK-8 assays showing that CST2 knockdown reduced SKOV-3 cell proliferation. (D) CCK-8 assays showing CST2 overexpression increased OVCAR-3 cell proliferation. (E) Colony formation assays in SKOV-3 and OVCAR-3 cells. The number of clones formed was reduced after knockdown of CST2, while that of clones formed was increased after overexpression of CST2, with bar charts showing colony numbers. * p < 0.05, ** p < 0.01, *** p < 0.001. SOC: serous ovarian cancer.
CST2 regulates the cell cycle through the Wnt-β-catenin signalling pathway
GO enrichment analyses unveiled that the DEGs’ primary association with regulating ubiquitin protein ligase activities, chromosome segregation, chromosome, centromeric region, kinetochore, cysteine-type endopeptidase inhibitor activities, and endopeptidase regulator activities (). Furthermore, KEGG pathway analyses indicated that CST2’s main involvement in the PPAR signalling pathway, cell cycle, and regulation of lipolysis in adipocytes (). Moreover, the results from GSEA were primarily linked to significant pathways such as the P53 pathway, the Erk1/Erk2 cascade, and the Wnt signalling pathway, all of which are vital for tumorigenesis and cancer progression (Supplementary Figure 5A–F).
Figure 5. CST2 regulates cell cycle through modulating the Wnt-β-catenin signalling pathway. (A) KEGG and GO analyses. (B) Percentage of SKOV-3 and OVCAR-3 cells in each cell cycle phase utilising flow cytometry. (C) Cell cycle factors’ expressions in each group as detected by qPCR. (D) Western blots displaying the expressions of cell cycle factors. (E) qPCR and (F) Western blots displaying the expression levels of relevant genes and proteins involved in the Wnt-β-catenin signalling pathway in each group, respectively. KEGG: Kyoto Encyclopaedia of Genes and Genomes; GO: gene ontology.
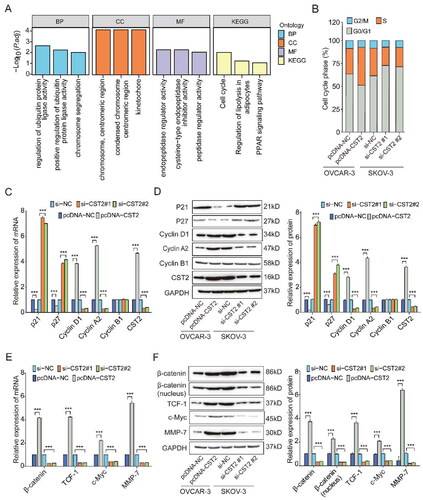
To validate the KEGG enrichment analysis hypothesis, we performed flow cytometry, qPCR, and western blot analyses. Flow cytometric analysis demonstrated that CST2 overexpression significantly decreased the percentage of cells in the G0/G1 phase and increased the percentage of cells in the S phase (). However, CST2 knockdown yielded the opposite results (). The cell cycle results suggest that CST2 may promote SOC cell transition from G1 to S phase, which in turn promotes cell proliferation.
Furthermore, qPCR and western blot analyses revealed that the cytokines cyclinD1 and cyclinA2, pivotal in the G1 and S phases, were upregulated in CST2-transfected cells but downregulated in CST2-silenced cells. Conversely, overexpression of CST2 decreased the expression of the cell cycle inhibitors P21 and P27, whereas silencing the expression of CST2 yielded the opposite result. Moreover, the expression of cyclinB1, functioning in the M phase, showed no significant change (). The expression levels of MMP-7, c-Myc, TCF-1, and β-catenin were significantly upregulated by CST2 overexpression; however, CST2 knockdown yielded contrasting results (). Moreover, western blot analyses showed significantly increased levels of β-catenin expression (including total and nucleus β-catenin) with enhanced CST2 expression but reduced levels with weakened CST2 expression ().
Discussion
Bioinformatics analyses have revealed that CST2 is significantly upregulated in breast cancer tissues compared to that in adjacent tissues (Bao et al. Citation2019). This study suggested that CST2 might be implicated in tumour cell proliferation, migration, and adhesion, thereby offering a novel avenue for the detection and treatment of breast cancer (Bao et al. Citation2019). Furthermore, CST2 expression has been shown to have diagnostic utility in prostate cancer (Cheng et al. Citation2019). Bioinformatics analyses have identified CST2 as a prognostic risk gene for gastric cancer (Liu et al. Citation2018, Wang et al. Citation2017). Moreover, elevated CST2 expression is associated with shorter OS and DFS and advanced clinical stages in patients with colorectal cancer, indicating its potential as a prognostic and diagnostic biomarker for colorectal cancer (Xie et al. Citation2021).
We observed upregulated CST2 mRNA levels in SOC tissues and cells, as evidenced by bioinformatics and qPCR analyses. Additionally, CST2 has been observed in multiple cancer types in pan-cancer analyses. CST2 expression exhibited high diagnostic accuracy in distinguishing ovarian tumour tissues from normal tissues, with an AUC of 0.933 (95% CI: 0.913–0.954) in the ROC analysis. High CST2 expression levels are correlated with advanced clinicopathological features and a poorer prognosis in patients with SOC, as confirmed by Kaplan–Meier survival curves, Wilcoxon rank-sum tests, and the prognostic nomogram. Therefore, CST2 may serve as a useful early prognostic and diagnostic biomarker of SOC.
Despite being a highly immunogenic tumour, SOC remains difficult to treat owing to substantial intrinsic genomic instability, the hallmark of cancer, imparting both antitumor immunologic response evasion and subsequent growth. We investigated the association between CST2 expression and the immune landscape of SOC. We have demonstrated that CST2 is positively correlated with mast cells, eosinophils, NK cells, and CD8+ T cells, which play critical roles in tumour progression, prognosis, and immunotherapy (Au et al. Citation2016, Goode et al. Citation2017, Nersesian et al. Citation2021, Baci et al. Citation2020, Jammal et al. Citation2022). These findings suggest that CST2 is a prospective immunotherapeutic target for SOC.
The highly conserved Wnt-β-catenin signalling pathway is critical for regulating cell differentiation, cell proliferation, and normal embryonic development (Liu et al. Citation2022). Moreover, it exerts a significant influence on tumour promotion (Zhang et al. Citation2020, Yu et al. Citation2021). In the context of cancer, this pathway sustains cancer stem cells, facilitates cell invasion and migration, stimulates cell proliferation, enhances cell survival, confers resistance to therapeutic agents, and potentially participates in tumour angiogenesis and immune suppression in OC (Nguyen et al. Citation2019, Hu et al. Citation2021, Xu et al. Citation2021).
Based on the biological functions and potential mechanisms involved in ovarian carcinogenesis, cell proliferation, and cell cycle regulation, these are considered significant factors in SOC. Consequently, we performed related experiments and observed that CST2 overexpression enhanced cell proliferation and modulated the cell cycle, whereas CST2 knockdown resulted in the opposite effects. Additionally, we scrutinised the expressions of key components in the Wnt cascade, including β-catenin, TCF-1, c-Myc, and MMP-7. Our findings indicate the underlying mechanism is that CST2 orchestrates tumour progression through the Wnt-β-catenin signalling pathway in SOC. Nevertheless, further validation through clinical trials must be undertaken to ascertain whether CST2 can facilitate immune evasion in serous ovarian cancer cells and stimulate proliferation through the activation of the Wnt pathway.
This study has certain limitations. First, our inferences were primarily based on in vitro data and may require confirmation through in vivo experiments involving larger cohorts of clinical samples. Additionally, the development of molecular targeted therapies centred on CST2 holds promise for advancing the prevention and treatment of SOC in clinical settings. These avenues require further investigation and validation in future studies.
Conclusion
In this study, we found a significant correlation between CST2 overexpression and unfavourable outcomes in patients with SOC. CST2 exerts its influence by promoting proliferation and modulating the cell cycle in SOC cells, primarily through activating the Wnt-β-catenin signalling pathway. These findings identified CST2 as a prospective biomarker candidate for early SOC detection and as a therapeutic target in patient management with SOC.
Authors’ contributions
All authors approved the final manuscript as submitted and accepted accountability for all aspects of the work. Xiaohua Wang: writing original draft, formal analysis, conceptualisation, and funding acquisition; Sufen Zhao: supervision, writing–review & editing, and project administration; Yanwei Guo: methodology; Chunhui Wang: data collection; Shuyu Han: investigation; Xingcha Wang: visualisation.
Supplemental Material
Download Zip (1.1 MB)Disclosure statement
The authors declare no potential conflict of interest.
Data availability statement
Data will be available upon requests.
Additional information
Funding
References
- Au, K.K., et al., 2016. STAT1-associated intratumoural TH1 immunity predicts chemotherapy resistance in high-grade serous ovarian cancer. The Journal of Pathology. Clinical Research, 2 (4), 1–11.
- Baci, D., et al., 2020. The ovarian cancer tumor immune microenvironment (TIME) as target for therapy: a focus on innate immunity cells as therapeutic effectors. International Journal of Molecular Sciences, 21 (9), 3125.
- Bao, Y., et al., 2019. Transcriptome profiling revealed multiple genes and ECM-receptor interaction pathways that may be associated with breast cancer. Cellular & Molecular Biology Letters, 24 (1), 38.
- Bindea, G., et al., 2013. Spatiotemporal dynamics of intratumoral immune cells reveal the immune landscape in human cancer. Immunity, 39 (4), 782–795.
- Bray, F., et al., 2018. Global cancer statistics 2018: GLOBOCAN estimates of incidence and mortality worldwide for 36 cancers in 185 countries. CA: A Cancer Journal for Clinicians, 68 (6), 394–424.
- Cheng, A., et al., 2019. A four-gene transcript score to predict metastatic-lethal progression in men treated for localized prostate cancer: Development and validation studies. The Prostate, 79 (14), 1589–1596.
- Geistlinger, L., et al., 2020. Multiomic analysis of subtype evolution and heterogeneity in high-grade serous ovarian carcinoma. Cancer Research, 80 (20), 4335–4345.
- Goode, E. L., et al., 2017. Dose-response association of CD8+ tumor-infiltrating lymphocytes and survival time in high-grade serous ovarian cancer. JAMA Oncology, 3 (12), e173290.,
- Gustavsson, E.K., et al., 2022. ggtranscript: an R package for the visualization and interpretation of transcript isoforms using ggplot2. Bioinformatics (Oxford, England), 38 (15), 3844–3846.
- Hänzelmann, S., et al., 2013. GSVA: gene set variation analysis for microarray and RNA-seq data. BMC Bioinformatics, 14 (1), 7.
- Hu, W., et al., 2021. UBE2S promotes the progression and Olaparib resistance of ovarian cancer through Wnt/β-catenin signaling pathway. Journal of Ovarian Research, 14 (1), 121.
- Jammal, M.P., et al., 2022. Mast cells and M2 macrophages in ovarian cancer. Journal of Obstetrics and Gynaecology: The Journal of the Institute of Obstetrics and Gynaecology, 42 (7), 3094–3100.
- Karnezis, A.N., et al., 2017. The disparate origins of ovarian cancers: pathogenesis and prevention strategies. Nature Reviews. Cancer, 17 (1), 65–74.
- Lheureux, S., et al., 2019. Epithelial ovarian cancer. Lancet (London, England), 393 (10177), 1240–1253.
- Liu, J., et al., 2022. Wnt/β-catenin signalling: function, biological mechanisms, and therapeutic opportunities. Signal Transduction and Targeted Therapy, 7 (1), 3.
- Liu, X., et al., 2018. Identification of potential key genes associated with the pathogenesis and prognosis of gastric cancer based on integrated bioinformatics analysis. Frontiers in Genetics, 9, 265.
- Love, M.I., et al., 2014. Moderated estimation of fold change and dispersion for RNA-seq data with DESeq2. Genome Biology, 15 (12), 550.
- Mueller, S.K., et al., 2019. Escalation in mucus cystatin 2, pappalysin-A, and periostin levels over time predict need for recurrent surgery in chronic rhinosinusitis with nasal polyps. International Forum of Allergy & Rhinology, 9 (10), 1212–1219.
- Nersesian, S., et al., 2021. NK cell infiltration is associated with improved overall survival in solid cancers: a systematic review and meta-analysis. Translational Oncology, 14 (1), 100930.
- Nguyen, V.H.L., et al., 2019. Wnt/β-catenin signalling in ovarian cancer: Insights into its hyperactivation and function in tumorigenesis. Journal of Ovarian Research, 12 (1), 122.
- Robin, X., et al., 2011. pROC: an open-source package for R and S + to analyze and compare ROC curves. BMC Bioinformatics, 12 (1), 77.
- Siegel, R.L., et al., 2022. Cancer statistics. CA: a cCancer jJournal for cClinicians, 72 (6), 524–541.
- Singhania, A., et al., 2018. Multitissue transcriptomics delineates the diversity of airway T cell functions in asthma. American Journal of Respiratory Cell and Molecular Biology, 58 (2), 261–270.
- Subramanian, A., et al., 2005. Gene set enrichment analysis: a knowledge-based approach for interpreting genome-wide expression profiles. Proceedings of the National Academy of Sciences of the United States of America, 102 (43), 15545–15550.
- Wang, Z., et al., 2017. Identification and validation of a prognostic 9-genes expression signature for gastric cancer. Oncotarget, 8 (43), 73826–73836.
- Xie, Q., et al., 2021. Identification of cysteine protease inhibitor CST2 as a potential biomarker for colorectal cancer. Journal of Cancer, 12 (17), 5144–5152.
- Xu, J.Y., et al., 2021. Plant-derived Chinese medicine monomers on ovarian cancer via the Wnt/β-catenin signaling pathway: review of mechanisms and prospects. Journal of Oncology, 2021, 6852867.
- Yu, F., et al., 2021. Wnt/β-catenin signaling in cancers and targeted therapies. Signal Transduction and Targeted Therapy, 6 (1), 307.
- Yu, G., et al., 2012. clusterProfiler: an R package for comparing biological themes among gene clusters. OMICS, 16 (5), 284–287.
- Zhang, W.P., et al., 2020. Cystatin 2 leads to a worse prognosis in patients with gastric cancer. Journal of Biological Regulators and Homeostatic Agents, 34 (6), 2059–2067.
- Zhang, Y., et al., 2020. Targeting the Wnt/β-catenin signaling pathway in cancer. Journal of Hematology & Oncology, 13 (1), 165.