

Abstract
Background
This research investigates the metabolic profiles of follicular fluid (FF) samples from patients with polycystic ovary syndrome (PCOS) undergoing in vitro fertilisation and aims to identify diagnostic and therapeutic biomarkers for PCOS through lipidomic analysis.
Methods
We performed non-targeted lipid analysis of FF samples from women with PCOS (n = 6) and normal controls (n = 6) using ultra-high-performance liquid chromatography–tandem mass spectrometry. Differential lipids between the two groups were screened using multidimensional statistical analysis, followed by fold change analysis and t-tests to identify potential PCOS biomarkers.
Results
Multivariate statistical analysis revealed significant differences in FF lipid levels between the PCOS and control groups. Five different lipids were selected as standards, with p < .05. Phosphatidylcholine (PC), the main differentially expressed lipid, was significantly increased in the FF of the POCS group and was closely related to other lipids.
Conclusions
Using ultra-high-performance liquid chromatography–tandem mass spectrometry, we investigated lipid biomarkers based on FF lipidomics to provide useful information for the discovery of diagnostic markers for PCOS. Our study identified five distinct lipids as potential markers of PCOS, with PC being the primary aberrant lipid found in the FF of patients with PCOS.
Plain Language Summary
Follicular fluid (FF) is a complex microenvironment involved in oocyte growth, follicular maturation and germ cell–somatic cell communication. All metabolites during oocyte growth are collected from the FF. This study used lipidomic analysis to identify differences in FF lipids between normal women and those diagnosed with polycystic ovary syndrome (PCOS). The pathogenesis of PCOS is associated with abnormal metabolism of glyceroglycolipids and sphingomyelin. Here, we found that phosphatidylcholine is the main abnormal lipid in FF in patients with PCOS. Our study informs the future research into the development of diagnostic markers for PCOS to be used in clinical practice.
Introduction
Polycystic ovary syndrome (PCOS) is a common metabolic and reproductive disorder-related disease caused by an endocrinal imbalance in women worldwide. It is a heterogeneous endocrine aberration in reproductive-age women with high prevalence and socioeconomic costs (Sørensen et al. Citation2014). The incidence of PCOS in women of childbearing age is approximately 20%, and the infertility rate of patients with PCOS is as high as 50–74% (Khan et al. Citation2019, Kumariya et al. Citation2021). These patients are characterised by hirsutism, anovulatory menstrual disorders, multiple immature follicles and abnormal endocrine hormones, with typical clinical manifestations of hyperandrogenism and hyperinsulinaemia. PCOS is often associated with obesity, insulin resistance, type II diabetes, cardiovascular disease, metabolic syndrome and gynaecological cancer (Jové et al. Citation2018). Patients with PCOS have also been reported to have a higher risk of obstetric complications, including pre-eclampsia, gestational diabetes mellitus and preterm delivery (Khan et al. Citation2015, Chen et al. Citation2022, Farland et al. Citation2022).
Aberrant alterations in lipid metabolic pathways in reproductive-aged women are closely associated with PCOS (Liu et al. Citation2019, Chen et al. Citation2020). Studies have indicated that differential metabolites in the serum of patients with PCOS are predominantly enriched in the glycerophospholipid and glycerolipid metabolic pathways (Zhang et al. Citation2023). The main manifestations of abnormal blood lipid metabolism are an increase in triglycerides (TGs), total cholesterol and very low-density lipoprotein, and a decrease in high-density lipoprotein (HDL) (Li et al. Citation2019). Follicular fluid (FF) is a complex microenvironment involved in oocyte growth, follicular maturation and germ cell–somatic cell communication (Zhang et al. Citation2019). All metabolites during oocyte growth are collected from the FF. Through lipidomics analysis, abnormalities in TGs, glycerophospholipids and sphingolipids were identified in FF of PCOS patients, which are closely associated with the proportion of high-quality embryos (Qian et al. Citation2024). In obese and insulin-resistant women with PCOS, levels of ceramides (Cer) and free fatty acids (FFAs) in FF were significantly elevated compared to controls, while levels of lysophosphatidylglycerol (LPG) were lower (Ding et al. Citation2022). In non-obese women with PCOS, levels of PGE2 and PGJ2 in FF were negatively correlated with the rate of high-quality embryos, suggesting these metabolic features could be used to assess fertility in PCOS patients (Feng et al. Citation2022). Furthermore, significant differences in three lipid subclasses – TGs, phosphatidylethanolamine (PE) and phosphatidylinositol (PI) – were observed in FF between normal-weight PCOS and control groups, highlighting these differential lipids as potential biomarkers and therapeutic targets in normal-weight PCOS (Ban et al. Citation2021). During IVF treatment, lipid fingerprinting in FF of PCOS patients was closely associated with hyperresponse, with HR groups showing increases in phosphatidylcholine (PC) and PE, suggesting these lipid markers could aid in predicting and managing IVF outcomes in PCOS patients (Cordeiro et al. Citation2015).
In this study, the FF of patients with PCOS was used as the research object, and a non-targeted metabolomic analysis focusing on lipid metabolites was performed to identify potential biomarkers for improving the diagnosis and treatment of PCOS.
Methods
Study population
We conducted a case-control pilot study involving FF from six patients with PCOS and six healthy women at Xuzhou Central Hospital, following the Declaration of Helsinki Ethics Guidelines. FF was collected from patients undergoing in vitro fertilisation or intracytoplasmic sperm injections at the reproductive centre between January and May 2022. Written informed consent was obtained from all participants, and the experimental protocols were approved by the Ethics Committee of Xuzhou Central Hospital. PCOS was diagnosed according to the Rotterdam Consensus criteria (Merviel et al. Citation2021), requiring the presence of two or three of the following features: hyperandrogenism, menstrual irregularities and polycystic ovary morphology. The control group comprised women seeking treatment for tubal infertility or male factors with normal ovarian reserve and BMI (body mass index). Women with endometriosis, glucose metabolism disorders, cancer or other conditions affecting folliculogenesis were excluded. Each participant is required to undergo fasting blood tests to measure baseline serum hormone levels and lipid profile indices, as well as height and weight measurements, on the second or third day of their menstrual cycle before starting IVF treatment.
Chemicals and reagents
Mass Spec grade methanol, acetonitrile and high-performance liquid chromatography grade (HPLC-grade) 2-propanol were purchased from Thermo Fisher Scientific (Waltham, MA). HPLC-grade formic acid and HPLC-grade ammonium formate were purchased from Sigma-Aldrich (St. Louis, MO).
Sample preparation and lipid extraction
Ovarian stimulation was controlled using a gonadotropin-releasing hormone antagonist. The specific follicular stimulation protocol is detailed in Supplementary Table 1. Each participant was administered personalised amounts of follicle-stimulating hormone on the second or third day of the menstrual cycle. Human chorionic gonadotropin was given when follicles reached a mean diameter of ≥18 mm, and FF samples were collected 36 hours later with an 18-gauge single-lumen aspiration needle under ultrasound guidance (Ludwig et al. Citation2003). FF with a diameter of 18–20 mm was collected during ovum pick-up, and clean FF samples without visible blood contamination were collected. The pooled FF samples were centrifuged at 800 rpm for 10 min to remove particles (Ma et al. Citation2022). The centrifuged supernatant was collected and stored at −80 °C until analysis. The methyl-tert-butyl ether (MTBE) method was used to extract the lipids (Xu et al. Citation2023).
LC–MS/MS method for lipid analysis
Similar to the method we published earlier (Xu et al. Citation2023), lipid samples were dissolved in a mixture of isopropanol and acetonitrile and centrifuged before injection into the LC system. A CSH C18 column (1.7 µm, 2.1 mm × 100 mm, Waters, Milford, MA) was used for the LC separation, with a 3 µL injection volume. The mobile phase consisted of acetonitrile and water with formic acid and ammonium formate (mobile phase A) and acetonitrile and isopropanol with formic acid and ammonium formate (mobile phase B) with a flow rate of 0.3 mL/min.
A Q-Exactive Plus instrument was used to acquire mass spectra in both positive and negative ionisation modes. Various ESI parameters were optimised and set as follows: the source temperature was maintained at 300 °C, the capillary temperature was set to 350 °C, the ion spray voltage was set to 3000 V, the S-Lens RF Level was set to 50%, and the instrument scan range was set to m/z 200–1800.
Data processing and statistical analysis
Raw data were processed using the LipidSearch software version 4.2 (Thermo Fisher Scientific, Waltham, MA) with peak alignment, retention time correction and extraction of peak area identification. Ion peaks with more than 50% missing values were excluded from the analysis. After normalisation and integration using the Pareto scaling method, the data were imported into SIMPCA-P 16.1 for multivariate statistical analysis. Lipids with significant differences were identified based on the combination of orthogonal partial least squares discriminant analysis (OPLS-DA) models (multidimensional statistical analysis) and a two-tailed Student’s t-test (p < .05) obtained from PASS16 on raw data (unidimensional statistical analysis), with a statistically significant threshold (VIP > 1) for the effect of variables on projection. Principal component analysis (PCA) was employed to investigate the differences and trends in blood lipid levels between the control and model groups, aiming to identify the lipid molecules that contributed most significantly to the separation of the two groups. Subsequently, a partial least squares discrimination analysis (PLS-DA) model was established to simulate the relation between lipid expression and sample categories using partial least squares regression, thereby predicting the sample categories.
Clinical trial registration
Trial registration number: ChiCTR2300067599. Public title: Expression and regulation of differentially expressed proteins in the FF and granulosa cells of patients with PCOS. Registration Date: 13 January 2023.
Ethics of experimentation
Ethical approval has been obtained from the Xuzhou Central Hospital Biomedical Research Ethics Review Committee, and informed consent has been obtained under relevant circumstances. The approval number is XZXY-LK-20210901-024.
Results
Clinical characteristics of participants
shows the baseline characteristics of patients with PCOS (n = 6) and controls (n = 6). Patients with PCOS exhibited a wide array of metabolic and endocrine alterations, characterised by notably elevated BMI (26.83 ± 1.73 vs. 22.08 ± 1.02 kg/m2, p = .040), significantly increased serum concentrations of anti-Mullerian hormone (AMH) (8.61 ± 1.98 vs. 2.88 ± 0.73 ng/mL, p = .022), testosterone (TT) (65.21 ± 7.19 vs. 37.38 ± 5.95 ng/dL, p = .014), TGs (2.02 ± 0.33 vs. 1.015 ± 0.19 mmol/L, p = .024) and low serum levels of HDL (1.26 ± 0.14 vs. 1.72 ± 0.05 mmol/L, p = .011).
Table 1. Characteristics of clinical baseline groups.
High reliability of experimental quality control
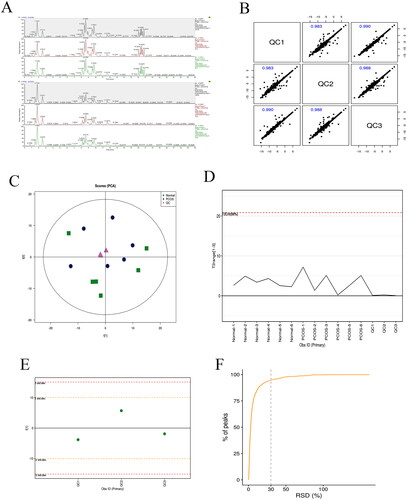
Comparison of the quality control (QC) sample base peak chromatogram (BPC) plots () revealed significant spectral overlap, indicating strong repeatability. Pearson’s correlation analysis () demonstrated high correlation coefficients (>0.9), confirming excellent reproducibility. PCA () showed tight clustering of the QC samples, reinforcing experimental reproducibility. Hotelling’s T2 test, establishing 95% or 99% confidence intervals (), confirmed QC sample consistency within the 99% confidence interval, supporting experimental reproducibility (Siskos et al. Citation2017). The multivariate control chart is a statistical model used to assess the stability of an instrument’s quality management status. In , the QC sample fluctuations were within plus or minus three standard deviations, indicating that the instrument’s fluctuation is normal, and the data can be used for further analysis. As shown in , over 80% of the total peaks in QC samples had a relative standard deviation (RSD) ≤30%. These results indicate good stability of the instrumental analysis system and confirm the usability of the data for subsequent analysis.
Figure 1. Experimental monitoring in positive and negative ion mode. (A) BPC overlapping pattern of positive and negative ions of QC samples. (B) QC sample correlation profiles. (C) PCA score graph for all samples and QC samples. (D) Hotelling’s T2 test of the overall sample. (E) Multivariate control chart (MCC). (F) The plot of the relative standard deviation of QC samples.
Identification of lipid compounds
Lipid composition analysis
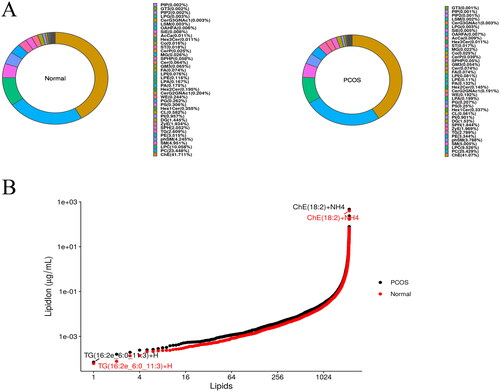
By comparing the results of lipid composition analysis in the PCOS and normal groups, we found that the major lipid composition types were the same in both groups, and the proportion of cholesterol esters in both groups was the highest, followed by PC (). The dynamic range of the content distribution allowed us to analyse the variation in lipid molecules across different samples ().
Figure 2. Lipid composition analysis. (A) Lipid subclass composition. (B) Lipid content dynamic distribution range.
Multidimensional statistical analysis
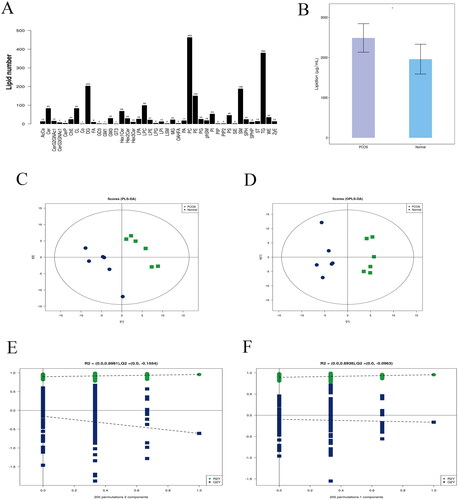
In this study, the Lipid Search analysis identified 42 lipid subclasses and 2214 lipid molecules from the positive and negative ion patterns (). The total lipid content in the PCOS group was higher than that in the control group (). PCA revealed significant differences between the PCOS and control groups (). To enhance the resolution and effectiveness of the model, OPLS-DA was employed, showing significant alterations in lipid metabolism between the two groups (). The stability and reliability of the PLS-DA model were confirmed with R2Y and Q2 values both exceeding 0.6 (). Thus, the robustness of the OPLS-DA model was validated (). These findings suggest a correlation between FF lipid metabolism and the pathogenesis of PCOS.
Figure 3. Multivariate data analysis of human follicular fluid samples metabolites based on UHPLC–MS/MS. (A) Statistical chart of the number of lipid subclasses and lipid molecules. (B) Significant differences in total lipid amounts between the PCOS and control groups. (C) PLS-DA score chart of PCOS–control group. (D) OPLS-DA score chart of PCOS–control group. (E) Permutation test chart for PLS-DA model. (F) Permutation test chart for OPLS-DA model.
Identification of potential biomarkers
Differences in the contents of the 42 lipid subclasses are shown in the bar chart (). We observed significant differences in PC between the two groups (). Additionally, we documented the upregulation or downregulation of the expression of five distinct metabolically altered lipid subclasses in the PCOS and normal groups (Figure S1). To further elucidate the significance of these lipid changes, we conducted univariate analysis, which revealed 130 potential differentially expressed lipid molecules with a fold change greater than 1.5 or less than 0.67 and a p value less than .05. The volcano plot illustrates the overall differences in lipid composition (), and hierarchical clustering analysis, focusing on qualitatively significant lipid molecules (VIP > 1 and p < .05), allowed us to explore alterations in related metabolic processes (). As shown in lipid subclasses met the criteria of fold change > 1.5, p < .05 and VIP > 1.
Figure 4. Multidimensional statistical analysis. (A, B) Lipid class content. (C–E) PC was among the top three lipid percentages and had the most significant change. (F) Rose-red circles are lipid molecules with FC > 1.5 or FC < 0.67, p value < .05. Differential lipid molecules screened by univariate statistical analysis. (G) Using significantly different lipids (VIP > 1, p value < .05) expression for each group of samples for hierarchical clustering. (H) The bubble size represents the significance of the difference, with smaller bubbles indicating significant differences (.01 < p value < .05) and larger bubbles indicating highly significant differences (p value < .01).
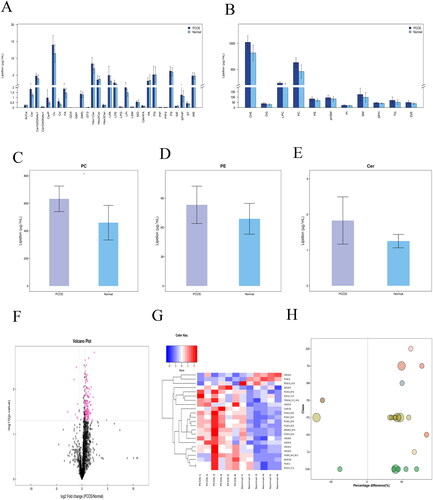
Table 2. Lipid molecules with statistically significant differences between PCOS and control groups.
PC is an important therapeutic target
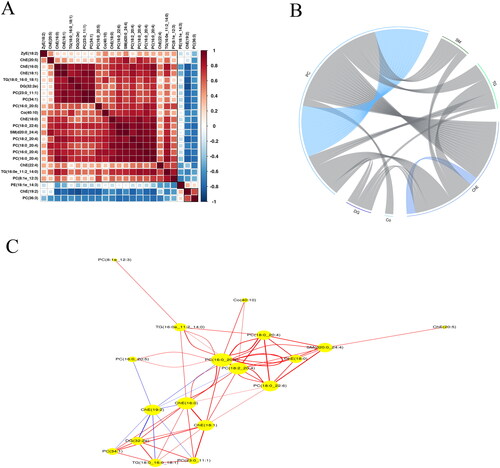
Correlation analysis based on VIP > 1 and p value < .05 elucidated the metabolic associations of different lipids during biological state changes. Positively correlated lipids may indicate that they originate from the same synthetic pathway, while negatively correlated lipids may suggest that they are being broken down for the synthesis of other lipids, indicating a synthesis–conversion relationship. We used correlation analysis to explore the interrelations among these lipids and present the results as a correlation-clustering heatmap (). Converting the lipid correlation matrix into chord and network plots () provided a clearer visualisation of lipid coordination regulation. Our study identified a significant correlation between PC and other lipids, both positively and negatively (). Therefore, we believe that PC plays a crucial role in the development of PCOS and serves as a biologically significant, but understudied, clinical biomarker.
Figure 5. Analysis of 42 differential lipid correlations. (A) The results of the correlation analysis are visualised in the form of a correlation clustering heat map. (B) Chord diagrams can better show correlations between lipid subclasses. (C) Network diagrams can better demonstrate the correlation between lipid molecules.
Discussion
PCOS is a highly heterogeneous disease and the leading cause of anovulatory infertility. The FF is the oocyte fluid microenvironment that surrounds an oocyte and plays a key role in oocyte development and ovulation (Chen et al. Citation2020). Given the characteristics of impaired follicular development and ovulatory dysfunction in PCOS and the significance of FF in follicular development, it is crucial to explore the metabolic patterns of FF.
Non-targeted metabolomics, which focuses on the dynamics of all small molecules that perturb an organism, can provide insights into the pathogenesis of various diseases and biomarker discovery (Ma et al. Citation2017). In obese and insulin-resistant women with PCOS, levels of Cer and FFA in FF are elevated, while levels of LPG are reduced (Ding et al. Citation2022). In non-obese women with PCOS, levels of PGE2 and PGJ2 in FF are negatively correlated with the proportion of high-quality embryos (Feng et al. Citation2022). To further investigate other lipid alterations in the FF of PCOS patients, we investigated lipid profile changes in the FF of patients with PCOS using a UHPLC–MS/MS-based lipidomic approach. We found that PCs, which are closely associated with other lipids, were the most significantly increased in patients with PCOS.
Phospholipid metabolism regulates lipids, lipoproteins and whole-body energy metabolism and is associated with metabolic disorders such as atherosclerosis, insulin resistance and obesity. PC is the most widely distributed and important component of various cell membrane structures. Abnormal levels of PC, FFAs and polyunsaturated fatty acid (PUFA) metabolites in patients with PCOS were found to be significantly higher than those in the non-PCOS group (Iqbal et al. Citation2017). From , we can see that PC (36:4)-CH3 is the lipid molecule with the most obvious changes in the lipid subclass PC, and it may become a molecular diagnostic marker for PCOS.
We identified several lipids with potential diagnostic capabilities for PCOS. As illustrated in Figure S1, compared to the normal group, PC, cholesterol esters, coenzyme Q and (O-acyl)-1-hydroxy fatty acids showed an upward trend, whereas trigalactosylceramide (GT3) showed a downward trend. PC, PE, coenzyme Q and others are associated with inflammation (Izadi et al. Citation2019), hyperandrogenaemia and cell proliferation and apoptosis. This close relation may serve as a diagnostic marker for PCOS. This study provides new insights into the pathogenesis of PCOS and proposes novel potential treatment strategies.
Despite the limited sample size of six due to constraints, we ensured sample representativeness and addressed BMI mismatching as a variable. The diverse BMI distribution in PCOS patients reflects real clinical scenarios, enhancing the clinical applicability of our results. This study lays the groundwork for future larger-scale research, offering new perspectives on lipid metabolism markers and mechanisms in PCOS.
Conclusions
In this study, we observed significant differences in lipid profiles, particularly PC, in the FF between the PCOS and control groups. PC is closely correlated with other lipids, suggesting its potential as a biomarker for PCOS screening. Our findings provide novel insights into the lipid metabolic pathways within the FF associated with the occurrence and development of PCOS. However, these results were obtained from a small sample size because stringent criteria were used to screen patients for inclusion in the pilot study. Therefore, the prospective biomarkers proposed in this study must be validated in an independent cohort. We plan to conduct quantitative studies on PC in future research and explore the interactions between lipid molecular pathways.
Author contributions
Qing He and Xiaoli Guo are co-first authors, contributing equally to experimental design and data analysis. Wenqiang Lv, Junchao Cui, Jing Meng, Xiao Gao and Jiachen Ma also contributed equally to design, execution and analysis. Qing He edited the manuscript. Nan Zhou and Yijuan Cao provided insights, revised the manuscript, and led the research project as corresponding authors. All authors approved the final manuscript.
Supplementary tables.docx
Download MS Word (21.4 KB)Supporting Information.docx
Download MS Word (123 KB)Acknowledgements
We thank all volunteers in this study for their cooperation, and we thank the physicians from the Department of Obstetrics and Gynecology and the Department of Reproductive Medicine Center, the Affiliated Xuzhou Clinical College of Xuzhou Medical University.
Disclosure statement
No potential conflict of interest was reported by the author(s).
Data availability statement
The data that support the findings of this study are available from the corresponding author upon reasonable request.
Additional information
Funding
References
- Ban, Y., et al., 2021. Lipidomics analysis of human follicular fluid form normal-weight patients with polycystic ovary syndrome: a pilot study. Journal of Ovarian Research, 14 (1), 135.
- Chen, X., et al., 2020. Metabolic alterations associated with polycystic ovary syndrome: a UPLC Q-Exactive based metabolomic study. Clinica Chimica Acta, 502, 280–286.
- Chen, X., Gissler, M., and Lavebratt, C., 2022. Association of maternal polycystic ovary syndrome and diabetes with preterm birth and offspring birth size: a population-based cohort study. Human Reproduction, 37 (6), 1311–1323.
- Cordeiro, F.B., et al., 2015. Follicular fluid lipid fingerprinting from women with PCOS and hyper response during IVF treatment. Journal of Assisted Reproduction and Genetics, 32 (1), 45–54.
- Ding, Y., et al., 2022. Follicular fluid lipidomic profiling reveals potential biomarkers of polycystic ovary syndrome: a pilot study. Frontiers in Endocrinology, 13, 960274.
- Farland, L.V., et al., 2022. Polycystic ovary syndrome and risk of adverse pregnancy outcomes: a registry linkage study from Massachusetts. Human Reproduction, 37 (11), 2690–2699.
- Feng, Y., et al., 2022. Follicular free fatty acid metabolic signatures and their effects on oocyte competence in non-obese PCOS patients. Reproduction, 164 (1), 1–8.
- Iqbal, J., et al., 2017. Sphingolipids and lipoproteins in health and metabolic disorders. Trends in Endocrinology and Metabolism, 28 (7), 506–518.
- Izadi, A., et al., 2019. Hormonal and metabolic effects of coenzyme Q10 and/or vitamin E in patients with polycystic ovary syndrome. The Journal of Clinical Endocrinology and Metabolism, 104 (2), 319–327.
- Jové, M., et al., 2018. Lipidomics reveals altered biosynthetic pathways of glycerophospholipids and cell signaling as biomarkers of the polycystic ovary syndrome. Oncotarget, 9 (4), 4522–4536.
- Khan, G.H., et al., 2015. Overlap of proteomics biomarkers between women with pre-eclampsia and PCOS: a systematic review and biomarker database integration. Human Reproduction, 30 (1), 133–148.
- Khan, M.J., Ullah, A., and Basit, S., 2019. Genetic basis of polycystic ovary syndrome (PCOS): current perspectives. The Application of Clinical Genetics, 12, 249–260.
- Kumariya, S., et al., 2021. Autophagy in ovary and polycystic ovary syndrome: role, dispute and future perspective. Autophagy, 17 (10), 2706–2733.
- Li, J., et al., 2019. Alterations of sphingolipid metabolism in different types of polycystic ovary syndrome. Scientific Reports, 9 (1), 3204.
- Liu, Q., et al., 2019. Dyslipidemia involvement in the development of polycystic ovary syndrome. Taiwanese Journal of Obstetrics & Gynecology, 58 (4), 447–453.
- Ludwig, M., Doody, K.J., and Doody, K.M., 2003. Use of recombinant human chorionic gonadotropin in ovulation induction. Fertility and Sterility, 79 (5), 1051–1059.
- Ma, L., et al., 2017. Urinary metabolomic analysis of intrahepatic cholestasis of pregnancy based on high performance liquid chromatography/mass spectrometry. Clinica Chimica Acta, 471, 292–297.
- Ma, Y., et al., 2022. Arachidonic acid in follicular fluid of PCOS induces oxidative stress in a human ovarian granulosa tumor cell line (KGN) and upregulates GDF15 expression as a response. Frontiers Endocrinology, 13, 865748.
- Merviel, P., et al., 2021. Impact of myo-inositol treatment in women with polycystic ovary syndrome in assisted reproductive technologies. Reproductive Health, 18 (1), 13.
- Qian, Y., et al., 2024. Integrated lipid metabolomics and proteomics analysis reveal the pathogenesis of polycystic ovary syndrome. Journal of Translational Medicine, 22 (1), 364.
- Siskos, A.P., et al., 2017. Interlaboratory reproducibility of a targeted metabolomics platform for analysis of human serum and plasma. Analytical Chemistry, 89 (1), 656–665.
- Sørensen, A.E., et al., 2014. MicroRNAs related to polycystic ovary syndrome (PCOS). Genes, 5 (3), 684–708.
- Xu, J., et al., 2023. Serum lipidomics characterization of breast cancer progression in a transgenic mouse model of PyMT-induced breast cancer. Journal of Oncology Research and Therapy, 8, 10164.
- Zhang, F., et al., 2023. Analysis of methylome, transcriptome, and lipid metabolites to understand the molecular abnormalities in polycystic ovary syndrome. Diabetes, Metabolic Syndrome and Obesity, 16, 2745–2763.
- Zhang, X., et al., 2019. TMT based proteomic analysis of human follicular fluid from overweight/obese and normal-weight patients with polycystic ovary syndrome. Frontiers in Endocrinology, 10, 821.