
Abstract
Since 2007, Ireland has suffered a circa 80% reduction in construction output. This has resulted in bankruptcy, unemployment and bad debt. Contractors have attached greater emphasis to production efficiency and cost reduction as a means of survival. An action research (AR) strategy was used to improve processes adopted by a small/medium enterprise (SME) contractor for the control of defects in its supply chain. It is conservatively estimated that rework, typically, accounts for circa 5% of total project costs. Rework is wasteful and presents an obvious target for improvement. The research reported here concerns the (first) diagnosing stage of the AR cycle only, involving: observation of fieldwork, analysis of contract documents, and semi-structured interviews with supply chain members. The results indicate potential for supply chain participants to identify root causes of defects and propose solutions, having regard to best practice to avoid reoccurrence. A lack of collaborative forums to contribute to production improvement was identified. Additionally the processes used to collect, manage and disseminate data were unstructured and uncoordinated, indicating scope for developing more efficient methods. The findings indicate a good understanding of the potential benefits for supply chain collaboration but suggest that the tools and knowledge to collaborate are currently lacking in the SME sector.
Introduction
The construction industry tends to renew its focus on improving production processes, with the aim of removing waste, during times of austerity. Koskela et al. (2012) trace the historical interest in production waste to the start of the twentieth century, noting that it has never been a prevalent concept in construction management or indeed management literature generally.
In times of high demand, building contractors are able to neglect build quality to some extent, in the rush to completion. Thereafter they either avoid remedial works or mask the consequences of rework behind higher profit margins (Sommerville et al., Citation2004). The Barker review on UK housing supply, published in 2004, noted that contractors did not have to deliver a particularly good finished product to secure market share (Barker, Citation2004).
The research reported here was carried out in the Republic of Ireland (Ireland), but should be of value in other jurisdictions. For a number of reasons, including geographical, historical and linguistic the construction production processes used in Ireland are similar to those of the UK (Thomas and Hore, Citation2003). This research reports results from the diagnosing (stage one) and preliminary consideration of action planning (stage two) of an action research (AR) improvement project involving a small/medium enterprise (SME) building contractor. It is intended that the remainder of the AR cycle be reported in future papers.
Ireland suffered a severe economic downturn in 2007. Construction has borne a disproportionate part of the burden in terms of bankruptcy, debt and unemployment. Construction output (baseline figure 100 in 2005) rose to a peak of 106.2 (Q2 2007) and has collapsed to 23.6 (Q1 2013), a decline approaching 80% (Taggart et al., Citation2012; Central Statistics Office Ireland, Citation2013). Prior to 2007, the industry was at the forefront of a property-led boom, although its predominance, at 24% of gross national product, was seen as unsustainable by many commentators (DKN Economic Consultants, 2009; Kelly, Citation2009). The industry is currently undertaking a painful adjustment, shedding over half of its workforce and also adapting to a new reality, with tender prices having reduced by circa 28% from peak (Society of Chartered Surveyors Ireland, Citation2012). Some optimism has returned in 2013, with the Ulster Bank Construction Purchasing Managers’ Index reporting raised orders and the highest optimism since 2007. Employment and current activity are still, however, falling marginally (Ulster Bank, Citation2013).
In response to this environment, contractors focused on lowering tender costs to increase workload. Weaker companies resorted to below cost bidding as a survival strategy (Society of Chartered Surveyors Ireland, Citation2012). Davis Langdon (Citation2011) reported that this practice is now moderating and some stability has returned to pricing levels.
Defects are discovered at many stages of production: during construction, during terminal inspections, after the project has been handed over, or in the subsequent maintenance period (Love and Edwards, Citation2004). The particular focus of this research concerns defects discovered at or near the end of construction projects. Rotimi et al. (Citation2011) define these defects as ‘snags’ and the process of identification and rectification as ‘snagging’. These terms are readily used and understood within the industry, but do not appear with any prominence in the literature (Sommerville et al., Citation2004).
The research is justified by reference to the costs involved. The available literature suggests a figure of 5% of total project cost could conservatively be attributed to rework and defects. Hwang et al. (Citation2009) suggest such a percentage for the United States of America and Love (Citation2002a) applied similar percentages in Australia, both generating frightening results in terms of the amount of money being wasted. Applied to Ireland, such a percentage would mean circa €1.89 billion (2007) was wasted at the peak of the recent boom. In more challenging times (2012) a figure of circa €375 million applies. Economic consultants DKN (2011) suggest that the industry will recover to sustainable levels over the medium term, suggesting that waste associated with rework and defects may likewise ‘recover’ to circa €850 million per annum in the medium term.
Research aims and participants in the research
The purpose of the research and empirical work described herein was twofold. First to assist a small/medium enterprise (SME) to improve its productive processes towards the elimination/reduction of rework and defects. Secondly the work seeks to contribute to theory in the area of defects elimination and management through dissemination of the research findings (Baskerville, Citation1999; Robson, Citation2002). This involved work in the following areas: (1) understanding and improving defects identification and management systems; (2) providing an understanding of the costs involved; (3) providing root cause analysis into defects with the aim of avoiding future repetition; and (4) training and learning.
The construction company involved in the study is a regional SME established in business over 15 years. The company was driven by its managing director and flourished during the boom, but now, like others, finds itself in reduced circumstances in terms of turnover and workload. The company is engaged in industrial, commercial, public works and biomedical projects. Using European Commission Recommendation 2003/361/EC on the classification of companies the company is classified as ‘small’ if it has fewer than 50 employees, less than or equal to €10 million turnover and less than or equal to €10 million balance sheet.
Research strategy: action research
Action research is a pragmatic research strategy since at its core is the epistemological paradigm that the ‘truth’ to be found is based upon the utility of the research (Azhar et al., Citation2010). It is a powerful tool for researchers who are interested in finding out about the interplay of humans, technology, information and social-cultural contexts (McKay and Marshall, Citation2001). AR seeks to address some of the deficiencies found in traditional research approaches in regard to relevancy. Traditional research has tended towards descriptive and explanatory approaches, somewhat at the expense of more prescriptive knowledge, having direct relevance to industry (AlSehaimi et al., Citation2013). AR also involves the adaptation of new approaches or practices to empirical circumstances (Altrichter et al., Citation2002; Bresnen and Marshall, Citation2001). This is, essentially, the goal of this research.
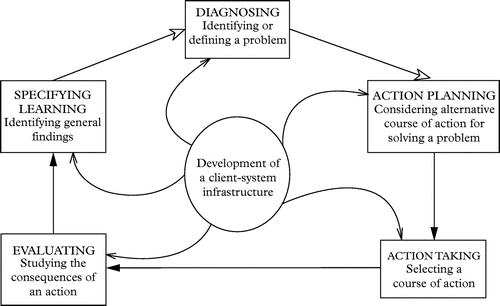
AR seeks to contribute to the practical concerns of people in problematic situations while contributing to scientific knowledge in a collaborative effort (Rapoport, Citation1970; Hult and Lennung, Citation1980; Baskerville and Myers, Citation2004). This stance is supported by Susman and Evered (Citation1978) who additionally suggest that AR should develop the self-help competencies of problem-solvers within organizations. AR typically involves a ‘cycle’ or ‘spiral’ of five project stages (Susman and Evered, Citation1978) (see Figure ). These stages entail: (1) diagnosing, involving identification and defining the scope of the problem; (2) action planning, which requires consideration of alternative actions for addressing the problem; (3) action taking, which involves implementing an improvement plan; (4) evaluating, which requires study of the consequences of the actions; and (5) specifying learning, which is used to identify findings and suggest improvements for further iterations of the cycle.
Figure 1 The action research cycle (Susman and Evered, Citation1978)
AR combines data generation from a social system with an intention to provide positive change. Lewin (Citation1946) noted that the most important factor in social science should be to practically contribute to the change and betterment of both society and its institutions. The AR strategy is founded on five tenets: (1) having clear goals and a commitment to values; (2) contextually focused; (3) the explanation of research materials concerning the changes; (4) active researcher participation in the process; and (5) the dissemination of the research (Elden and Chisholm, Citation1993). AR promotes organizational change, towards the betterment of participants, as well as the normal research outputs of description, understanding and explanation (Robson, Citation2002).
Research methods
Given the nature of AR, a substantial amount of diverse qualitative data was produced. A flexible design approach was selected to manage the data. It is difficult to disaggregate the multiple and interactive causes of defects in any meaningful way or relate them usefully to objective features of the context. Thus the research strategy adopted here allows the problems to be considered holistically (Shammas-Toma et al., Citation1996; Seymour et al., Citation1997). A literature review was conducted to build up knowledge of the problem, first in the area of construction supply chains focusing on collaborative working practices and secondly in the area of construction rework and defects. The supply chain literature is extensive and the defects literature more modest. Sommerville et al. (Citation2004) reported that snagging data and the snagging process itself have rarely been written about in the UK. A field study took place on one of the SME’s projects to assess in detail how they managed rework and defects and to gather data about the root causes of the problems they encountered.
The field researcher (author 1) spent time (typically one half day per week) over a four-month period on the project, and ‘participated’ in the process of snagging data as a participative observer (Vinten, Citation1994; Gill and Johnson, Citation2002). This participation included unstructured observation and photographing of activities (Mulhall, 2003). Semi-structured interviews were conducted with a broad cross-section of project participants to gain understanding of their opinions and to understand the context, with a view to enabling change (Robson, Citation2002). Interviewees included architect, services designers, contracts director, site manager, subcontractors and material suppliers. Additionally, informal conversations with site operatives took place and were summarized and recorded, in field notes. A final means of data gathering was to collate and analyse the documented parts of the snagging process used on the project. This included copies of drawings and specifications, programme, requests for information and terminal snag lists. The research was open and transparent. Posters were placed on site explaining who the field researcher was and his intentions. Stakeholders were free to engage with the research or not as they saw fit (Denscombe, Citation2010).
Definitions
The term ‘rework’ describes work that has to be done for a second time. This results from a variety of errors in execution, but also from client-led changes (Love and Edwards, Citation2004). If the defect is caused by the former it is unlikely the contractor will be paid for rectification, but if the cause is the latter the contractor may be entitled to contractual recompense. Love and Edwards (Citation2004, p. 207) define rework as ‘unnecessary effort of re-doing a process or activity that was incorrectly implemented the first time’. This definition is not entirely satisfactory as it can be seen that, in the context of some client-led changes for instance, the original work may have been implemented correctly, but is now redundant. Thus at a holistic project level it may well have been unnecessary, without necessarily having been implemented incorrectly.
Likewise, Hwang et al. (Citation2009, p. 188) suggest: ‘Rework is the process by which an item is made to conform to the original requirements by completion or correction.’ Again, in some circumstances the item may well conform to the original requirements but must still be changed for some reason. Rework is clearly repeat work, but its definition must and can only be considered in the particular contractual contexts that apply. From the contractor’s perspective it is often a question of whether it will be paid for the rework.
Shammas-Toma et al. (Citation1996) clearly noted that interview discussion on causation of defects in their studies was coloured by an awareness of contractual liability.
The focus here concerns defects identified and remediated at or around the end of projects commonly known in the industry as ‘snagging’, though this is a term not often found in the literature (Sommerville, Citation2007). Other terms used with a similar meaning to snag include faults, repairs, quality failures, deviation, non-conformance and rework. Often these are used interchangeably with the same or similar meaning (Sommerville, Citation2007; Rotimi et al., Citation2011). Precise, agreed definitions in the area of defects and snagging are absent (Georgiou et al., Citation1999; Iiozor et al., Citation2004).
Defects causation
A number of contributions reflect on root causes of defects with a general consensus that cause usually lies deeper than a superficial blaming of construction operatives and managers (Atkinson, Citation1999), albeit that in some cases they are contributors. Broad agreement is found on a common core of practical causes; others explore more theoretical contributions. Sommerville (Citation2007) evaluated work by the Building Research Establishment (BRE), to identify defect causes. This assigned cause to three broad headings: design issues (50%); construction phase issues (40%); and product failures (10%). Josephson et al. (Citation2002) looking at similar areas suggested: design related causes (26%); site production/process (20%); workmanship (20%); materials failure (17%); client issues (6%); and machinery failure (3%). The causation headings are similar, but the allocation of cause is not. This is possibly related to different definitions, conceptual frameworks and models. The influence of design errors (as illustrated above) on defects that occur later in the supply chain is well considered in the literature. Design errors are diverse in nature and in the severity of their impact (Lopez et al., Citation2010). Influencing factors on the propensity of design errors include unrealistic design programmes, organizational culture, lack of quality assurance practices, inadequate scoping of client needs and lack of a common language with which to articulate client wants (Lopez et al., Citation2010).
Love et al. (Citation2009) produced a list of 29 possible rework causes. These are loosely categorized as (1) scope changes; (2) erroneous design/documentation; (3) lack of quality management systems; and (4) poor workmanship. Mining into these headings, a number of factors are prominent, including (1) misinterpretation of drawings and specifications; (2) use of superseded drawings and specifications in the supply chain; (3) poor or imprecise communications; (4) lack of supply chain coordination; (5) poor training and skill levels; and inadequate supervision (Chong and Low, Citation2005).
Love et al. (Citation1999) discussing the work of Shewhart (Citation1931) in a construction context, suggest two root cause factors of defects: first, those that originate because of problems in the production process, termed common causes, for example poor information flow between supply chain participants. Secondly, special causes that arise outside the production process, beyond the contractor’s immediate control, e.g. unilateral client changes. They suggest that 85% of all construction rework emanates from the former and only 15% from the latter (Love et al., Citation1997).
Atkinson (Citation1999) found commonality with others in areas which he terms ‘primary’ and ‘managerial’. These cover causation themes discussed previously. He extends the debate to consider the impact of ‘global’ factors such as organizational culture, economic pressures and societal pressures as contributory root causes. Returning to this theme in 2002, he found a predominance of managerial root causes, albeit with a significant contribution from global factors (Atkinson, Citation2002). Shammas-Toma et al. (Citation1996) in a similar vein differentiate between defects which appear during construction, but are caused by the supply chain, prior to construction (such as design). These are termed ‘management controllable’. A second category concerns defects occurring at the point of production, termed ‘operative controllable’. The authors note that most quality systems they observed in the field are only capable of detecting the latter.
Josephson and Hammarlund (Citation1999) took a broader look at causation in a longitudinal study of seven major projects. They note that motivation to produce good work is insufficient and that operatives must also have the necessary knowledge and information to execute the task correctly. In many cases this was lacking. They noted several factors that contributed to higher defect levels, including: (1) delays in decision-making by clients; (2) late involvement of end user; (3) contractual pressures in terms of cost and time. Conversely they also note some disarmingly simple factors that tend to limit defect levels: (1) stability in the client and design team composition; (2) previous experience of working with project participants; (3) supportive project management; leading to (4) higher motivation.
Love et al. (Citation2009) suggested that underperformance (such as having high defects) is often explained away as an unusual aberration by participants. This is because they do not wish to draw attention to such an unpalatable situation, lest they be harshly judged by customers and others. The cost of such non-conformance can drastically increase overall costs and impact on profit margins. Rooke et al. (Citation2004) note practices whereby contractors manipulate poor design and specification for commercial advantage. The authors reported on the strategy of bidding low to win projects which they perceive as having a high probability of delays and claims. This extended to anticipation of poor design that would prove impossible to execute and manipulating the programme to maximize the chances of delay. The opportunity for such practices is dependent upon procurement and contractual arrangements. The authors noted that such practices increase in times of austerity.
Construction companies tend to rely on the practice of identification of defects during interim and terminal inspections. This is often driven by formal quality systems. This approach however deals with the symptoms, while root causes remain hidden (Shammas-Toma et al., Citation1996). Eradication of root causes provides a long-term solution to the problem of defects. Seymour et al. (Citation1997) agree with this proposition. They note that companies engage in ‘fire-fighting’ what they perceive to be sporadic defects, when in fact they face chronic defects. Little attention is given to understanding and eliminating the latter. The cost of prevention measures is usually minimal when compared to the costs of rework, scrap materials and lost time (Abdul-Rahman, Citation1996).
Cost of rework and defects
While there is some consensus in the literature concerning causation, the literature on the costs of rework and defects is very fragmented. A wide range of suggested cost estimates are allied to a number of disparate models for calculating costs. These models all have differing variables as to what should be counted. No obvious standard approach is found in construction (Fayek et al., Citation2004). Almost all of the cost estimates found are expressed as a percentage of the total project cost (TPC). The defects found in snagging are generally attributable to specific contractor organizations and individuals. They can thus be measured and costs aggregated to act as a baseline for improvement targets (Sommerville et al., Citation2004). The actual cost of rework and defects is seldom measured by contractors so they have no reliable basis for accurate analysis (Love, Citation2002a).
Josephson et al. (Citation2002), discussing the work of Feigenbaum in a construction context, suggest that costs should be considered on three levels to obtain a holistic view:
Failure costs: defects that are found either before or after handover.
Appraisal costs: the costs of checks and inspections.
Prevention costs: the costs of systems and preventative measures.
The authors do not underestimate the difficulties of implementing measures to capture the costs associated with these elements. Return visits to complete rework and defects are a common factor. They are a very inefficient practice and often lead to multiple cost implications, particularly if the return visits take place during the maintenance period. This often involves extra expenditure on elements such as travelling time, non-productive time, additional access, equipment and plant. This phenomenon can be considered in terms of direct costs (specifically associated with the defect) and indirect costs (associated with the return visit) (Love and Edwards, Citation2004). The latter authors describe one case where the indirect costs were 22.5 times the direct costs. On similar lines, Nielsen et al. (Citation2009) differentiate between ‘physical’ defects where documentation, material or structure lacks abilities according to contract or good practice. These are contrasted with ‘process’ defects, where the process takes place in a fashion that represents a significant time or resource loss compared to the optimum.
A small number of field studies are available providing empirical evidence of costs, usually presented as a percentage of TPC. Most urge caution in terms of generalization and suggest consideration of the particular context is essential. Love et al. (Citation2004) note that a range of rework costs ranging from 3% to 23% are reported in the literature, but caution that much of the data is estimated due to lack of factual cost reporting. Love et al. (Citation1999) had suggested that holistic costs of rework could range as high as 12.4% of TPC. Love and Li (2000) carried out two detailed case studies and reported that rework costs in those were 3.15% and 2.4%, also suggesting that use of a formal quality management system can substantially reduce costs of rework and defects. Love and Sohal (Citation2003) reported that the Singapore Development Board suggested that between 5% and 10% of TPC was being wasted on defects and rework costs. Nielsen et al. (Citation2009), discussing Denmark, anecdotally report that defects are considered to represent an economic loss of around 10% of construction turnover.
In their longitudinal study, Josephson and Hammarlund (Citation1999) suggested that rework costs ranged from 2% to 6% during construction and additionally from 3% to 5% during the maintenance period. Josephson et al. (Citation2002) looked at construction related rework (excluding that related to design), finding costs came to 4.4% of TPC; the additional time required to rectify the defects was however 7.1% of time. The authors suggest that on typical projects contractors spend at least three weeks per year doing rework. American studies indicate a figure of 5% in rework and defects mitigation (Hwang et al., Citation2009). Aoieong et al. (Citation2002) reported that nearly 60% of American contractors had not tried to measure rework costs; those that had, returned a figure of around 5% of TPC. In studies in Hong Kong, they also noted that main contractors have no great interest in unearthing the true cost of rework, as the majority of it is carried out by subcontractors. To some extent the main contractors are concerned with the end product only, not the process that delivers it. As they were not directly suffering any financial loss, they were unconcerned.
Love (Citation2002b) suggests that many costs are hidden in the process and could well range up to 25% in some cases. Noting the lack of any uniformity of suggested cost models, he suggests that field reports should not be taken as definitive, but viewed only as an illustrative source of reference.
Collaboration in the supply chain
The production model in Ireland is generally one of ‘shell’ main contractors, arranging the work of numerous and fragmented subcontractors, selected on the basis of lowest cost (Green and May, Citation2003). This structure tends to inhibit the levels of collaboration needed to address problems such as defects (Seymour et al., Citation1997). The Irish industry is at once very adversarial, while also having a sophisticated understanding of the possibilities and benefits from collaborative working practices. A substantial majority in the industry feel that collaboration, or at least, better cooperation is an essential element of their future success (Taggart et al., Citation2012).
Karim et al. (Citation2006) noted that subcontractors viewed the main contractor as their ‘customer’ and showed little concern for other subcontractors with whom they had to interact or indeed the ultimate project customer. The result of this lack of integration with other subcontractors is that defects and unfinished work often get left behind, until they appear on snag lists. Problems as described are often generated in one part of the process, but not detected until some later stage, tending to multiply the impact of the problem (Koskela et al., Citation2006). A supply chain collaboration approach to the defects drives an agenda of stopping and fixing the problems as early in the process as possible (Liker, Citation2004). This necessitates management of a process that supports earlier detection of defects and dissemination of information and an integrated approach to problem-solving. This suggests a greater role for collaboration and planning between participants. Improvement can be achieved, but requires better ways of measuring and capturing data, from which improvement metrics can be determined (Lee and Amaral, Citation2002). Tools selected to address the issue must strike a balance between the resources expended upon inspection and prevention of the defects and the consequential cost savings from fewer defects (Nielsen et al., Citation2009). In the context of the Irish industry and particularly the limited resources of the SME sector, they must be seen both to improve the process, by reducing snags while also reducing costs holistically.
The emergence of affordable information technology (IT) at site level offers potential for significant improvements in supply chain collaboration. The construction industry still relies heavily on traditional approaches, such as paper and pen surveys of defects information. This approach creates bottlenecks in information dissemination and the data are often out of date soon after being issued (Craig and Sommerville, Citation2007). The latter authors describe the use of one patented snagging management system that was also reported in field trials with major UK contractors (Comit, Citation2005). The reviews are generally very favourable and cite analysis of cost and time savings, but purchase/set-up costs of circa £4000+ and additional annual running costs of £6000+ may potentially deter use by SMEs.
The cost of mobile devices has reduced significantly, making them easily accessible to the SME market. A low cost, effective software solution for defects management, appropriate to the needs of the SME market is needed to allow collaborative and real-time management of the production process for defects.
Pilot case study overview
As part of wider PhD research, a pilot field study using an AR strategy was undertaken. The first element was to gather knowledge and understanding about practices and attitudes concerning the management of defects and rework in the subject company. AR adopts an inductive approach based on a research cycle, which has as its first step identification and scoping of a problem (Susman and Evered, Citation1978). The results presented herein are principally related to the first or ‘diagnosing’ phase. The problem for the SME was the time and costs involved in ongoing rectification of snagging works in a very demanding economy. The problem has a detrimental impact on the SME’s profitability and cash flow.
The project was a health department building. The contract was traditional in nature with design provided by the client. The contractor was selected following a two-stage process. They pre-qualified to the tender list following submittal of extensive information regarding the company and its relevant experience. Tenderers subsequently bid against each other, based on the design provided. The lowest priced tender was selected. Project value was circa €1.4 million. Participants reported that it was generally held as being a ‘successful’ project.
Study limitations
The results presented are limited to the diagnosing stage of the AR cycle. This involved the field researcher attending site during the latter part of the construction phase and covers the period just after practical completion. The reporting here does not consider defects manifesting during the defects liability period. Such defects are important and costly to the SME and will be addressed in later reporting of the AR cycle.
Results
Anatomy of a snag
A considerable concern in the construction management literature is the lack of systematic root cause analysis of supply chain problems (Fellows, Citation2010). This lack of understanding and learning is a contributory factor to the repetitive nature of snags, whereby the same defects tend to be repeated in multiple projects (Lopez et al., Citation2010; Rotimi et al., Citation2011). One of the objectives for this AR cycle was thus to establish the potential for collaborative effort by the supply chain participants in the project towards investigation of root causes of the defects found, with a view to their elimination on future projects.
The site manager’s terminal snag list was analysed. This was the first of several terminal snag lists prepared on the project. It is common in the industry for main contractors to ‘pre-snag’ the works in this way, prior to inspections by the designers. This action in itself is somewhat of a duplication of effort, time and cost, but is seen as a prudent measure by most contractors.
The manager’s list contained 157 separate items. A summary analysis is provided in Table . In terms of the cost of rework on the project, discussions took place with the contractors’ quantity surveyor (CQS). He confirmed that they did not know the actual costs of defects and rework on the project. The CQS said his company did not measure such costs but typically they allowed 1–1.25% for snagging in their tenders and he found that was usually satisfactory. It transpired in the discussion that this figure was provided to cover the main contractor’s management costs for the snagging process (costs of quality), not for rectification of any actual snags. The CQS stated he did not know what snagging provision costs the subcontractors allowed in their prices, but he agreed they would indeed provide for them. He did however agree that a substantial ‘cost to client/customer’ would accrue if all cost streams were aggregated.
Table 1 Summary analysis of site manager’s snag list
To better understand and make visible the costs of snagging, the researcher and CQS priced the site manager’s list using daywork rates (typically €23.00 per hour for general trades and €30.00 per hour for specialists). A site inspection was used to allocate estimated hours to the snags listed. Plant and materials estimates and cost were similarly deduced. The agreed estimate for the work on the site manager’s list was equal to circa 1.3% of the TPC. It is accepted that this approach is ‘ballpark’ in nature and simplistic. It was however intended to provide illustrative rather than conclusive evidence. Additionally the costs of the architect, electrical engineers, mechanical engineer and client snag lists must be added. Furthermore costs from additional defects lists, prepared after the elapse of the defects maintenance period, may be considered. In this case the defects maintenance period is 12 months. The CQS accepted that in aggregate, 5% or more of TPC (circa €65 000+) could well be spent on defects and snagging rework and snagging process management on this otherwise ‘successful’ project.
Table categorizes the 157 snags found on the site manager’s list in terms of broad underlying causes. Factors included poor workmanship such as crooked radiator pipes and work which was damaged after being completed. Other factors concerned work that was only partially completed, such as missing pipework insulation and elements of work that were missing altogether, such as mirrors in the toilet cubicles. A number of snags were directly related to poor design and often needed additional design input/specification to rectify them. This included specification of additional mastic pointing to mask unsightly joints between different materials in various locations. Defects however often have deeper and multiple root causes.
Table 2 Classification of site manager’s snag list
To investigate and highlight the potential for root cause analysis of defects by the supply chain participants, a selection of snags from the manager’s list were identified and subjected to consideration in terms of causation. Six of the listed snags concerned defects associated with co-located electrical sockets. From a subsequent walk around with the site manager, it was noted that there were 15 locations on the site with co-located electrical sockets. Thus 40% of co-located electrical sockets on site were noted on the snag list as requiring some form of rework. Although they are relatively minor defects, most could not be rectified in one visit alone and required several visits, for example, for filling, preparation and painting.
Initial discussions with the manager and the site trades people involved found them in agreement that these types of snags were fairly ‘normal’; they had all seen them many times before. There was an acceptance that they were simply part of the job, another part of the process. This routine acceptance of defects is noted by Sommerville et al. (Citation2004) and others. In an Irish context the recent boom saw publication of The Irish Homebuyers Guide to Snagging, (Boyle, Citation2006). A consumer guide for the industry’s disaffected customers, so that they could better manage the inevitable long list of defects associated with their new homes. That such a book exists clearly illustrates the entrenched nature of the problem and reflects negatively on the industry.
A site assessment of the co-located socket snags was conducted by the field researcher. This found that of the 15 co-located sockets those that were close together (0–50 mm) tended to have snags, while those further apart (>50 mm) had no snags. It was also found that all of the co-located sockets had different spacing distances and appeared to be randomly spaced. By way of a double check a second small project, recently completed by the SME, was inspected and 11 co-located sockets were found. Again the spacing appeared to be totally random. These observations were discussed at a workshop meeting with the contracts director, site manager, and electrical and decorating subcontractors with photographs available (provided by the field researcher), and yielded the following insights:
Regarding the random spacing, the group found that the electrical design drawings used computer-aided design (CAD) symbols to illustrate the approximate location of the sockets. No dimensional layout was usually given. The various electricians executing the work thus randomly decided themselves on what spacing to use.
Follow-on trades were then presented with difficulty due to the (usually) small distance between the sockets. This is not linked to the individual materials used and was found to be common with plaster, plasterboard, paint or tile for example. The issue was the difficulty for operatives, in handing and tooling small slithers of the materials. Larger pieces are easier to handle cleanly and would yield fewer or no snags.
The organization responsible for final rectification of the snags here, mainly the decorators, is typically one of the finishing trades. However the root cause of the snags occurred earlier in the supply chain with the design and electrical installation work. These stakeholders however escape without consequences. The snags are thus often passed off and classified as ‘poor workmanship’ but are strongly influenced by the lack of explicit design, as root cause.
The participants’ proposed solution to this snag is relatively simple. As the defect is related to the space between the sockets, simply make that spacing larger and remove the random element. The participants suggested that a standard spacing of 100 mm be adopted. A walk around site confirmed there were no dimensional issues preventing such a spacing being adopted. Further discussion suggested that manufacturers (of plastic or metal electrical conduit) could simply supply pre-made and pre-threaded spacers of 100 mm to obviate this problem entirely. In effect, adoption of a ‘lean’ approach is suggested. This part of the process is to be standardized and if pre-manufactured components were used consistent spacing would be achieved (Koskela et al., Citation2006). There would also be some other potential, modest cost savings in the original work as cutting and threading of conduit on site would be avoided by the electrician. The solution also provides for a more consistent and aesthetically pleasing end product.
Dissemination of this information to the workforce will be achieved by simple and visual A4 instruction sheets. Drafts of such sheets were prepared for consideration and will be further developed and tested as part of future phases of the AR cycle with the SME.
The example presented above suggests that the supply chain certainly has the technical knowledge and experience to determine root causes of common defects and to contribute towards viable, cost effective solutions to prevent their reoccurrence. Other defects from the list were subjected to similar scrutiny, yielding potentially promising results.
Overview of management systems
The second area of interest in the problem scoping or ‘diagnosing’ part of the AR cycle, involved an evaluation of the management systems and processes used to manage the defects and snagging process. The field researcher was generally given free access to all site records and other design information and discussed these data freely with many of the key participants, both informally on the site and formally in interviews. During the course of the production phase of the project the researcher visited the site regularly, on a weekly basis. This helped to break down interpersonal barriers with the workforce who became progressively more engaged in discussing the work openly, as time went on.
During the project both the site management team and the design team carried out ad hoc walk around ‘quality’ inspections, usually on the site meeting day (fortnightly). These were informal in nature and did not follow any structured format, but did identify a number of defects that were rectified prior to handover. The subcontractors on the site did not formally inspect and sign off their own work, but rather left that job to the site manager and design team to do in terminal snag lists. The manager’s list reflected many defective snags, but also a number of unfinished items, which were not in themselves defective. However, these items needed to be completed, prior to final inspection. Unfinished work also carries a contingent risk of further defects being created during return visits to complete such items.
Often the subcontractors would start, but not fully complete work because of coordination issues with other trades or information deficits for example. They left the site or moved on to other work on the site, while awaiting return visits to fully complete that activity. This common facet of construction was identified as a type of waste called ‘making do’ (Koskela, Citation2004), and its impacts are well described in Emmitt et al. (Citation2012) who suggested that this approach is a contributor to higher levels of snags and defects.
On this project there were four snag lists prepared towards the end of the project and one afterwards. Lists were supplied by: (1) the site manager; (2) electrical engineer; (3) mechanical engineer; and (4) the architect. Additionally after handover the client supplied a small list of snags they noted during early occupancy. The basic process of each involved a walk around inspection, at which time snag details were recorded with pen and paper. Upon returning to the office, the details were transcribed to a computer. Regarding the first list, the site manager issued copies by email to the subcontractors for action. No copy was given to the design team as contractually the site manager did not view it a design team matter. The data were supplied as a simple list using Microsoft Excel. The services engineers’ lists were similarly compiled and sent to both the main contractor and the specialist electrical and mechanical contractors. Any items of a general nature (not for the specialists) were referred to the main contractor, rather than any named subcontractor. One list was supplied in Microsoft Word, the other used PDF format. The architect’s list was similarly compiled and sent solely to the main contractor for action. PDF was the chosen format.
Upon receipt of the designer’s lists, the site manager had to modify and adapt the lists and decide which subcontractor was responsible for each item listed, then issue them for subcontractor action. At an appropriate stage, the site manager decided that the snagging process was completed and re-inspected his list and signalled the designers to re-inspect theirs.
Shammas-Toma et al. (Citation1996) noted severe weaknesses in the ‘inspection list’ approach to defects detection, as described herein. They report finding many items that had been ‘checked off’ were in fact defective in some way (albeit, many in a minor way). Additionally they found many additional defects that had not been detected at all. Patton (Citation2013) agrees that many defects (including failure to meet specifications) are simply never detected, leading to a permanent and significant loss of customer value. He terms this phenomenon ‘task diminishment’.
The four snag list approaches adopted here were compared to best practice, suggested by Sommerville et al. (Citation2004), to assess the completeness and robustness of the data provided in the lists (see Table ). These results and additional observational assessments on site yielded the following insights emanating from discussions with project participants:
The lists are idiosyncratic. For example, the two engineers worked for the same design consultancy, yet their lists are not consistent with each other, let alone with lists of the other parties. Participants felt that this approach was normal on the projects they had worked on and mirrored their previous experiences. This process is open to inconsistent operation, duplication of effort and communication failures due to lack of any standardized (but flexible) approach.
Several items listed are general in scope and do not well serve the process. The architect’s list for instance has a catch-all item of ‘Touch up all scuffs on walls, ceiling, access panels, woodwork etc.’ This is unquantifiable and contains no specific locations. It is also open to narrow or wide interpretation by recipients. The implication here is that imprecise communication/language will lead directly to misunderstanding and delay in execution of the works required.
Several items listed are simply unfinished or missing, rather than necessarily being defective. They need to be completed before they can be properly inspected. Unfinished or missing items can be in that state for many possible reasons. Examples from this project included: (1) ‘making do’ as previously described; (2) operative carelessness; (3) delivery delay/lack of materials/late instruction; (4) poor scheduling/trades coordination; (5) design/specification issues.
Some snags involved collaboration by more than one subcontractor to achieve rectification. This was not clearly reflected in the snag lists. Thus the responsible subcontractor may attend and find they cannot remediate the work alone. An example snag involved remedial work to a timber pipe boxing. This was allocated to the carpenter, who rectified it. However following rectification works it then needed to be redecorated; this aspect was not communicated (to the decorator) on the snag list and thus the latter work was ignored.
The electrical snag list contains a clause indicating that no re-inspection will take place unless the contractor confirms work is completed by signature beforehand. The engineer stated that he had, in the past, been called back many times to find many defects on his lists still outstanding or only partially addressed. The participants generally agreed that this was also a common occurrence in their experience. Many stated that snag list work tended to be an iterative process with several cycles of inspection and follow-up rework activity. This has implications in regard to ‘costs of quality’ since repeat inspection cycles increase costs. Repeat contractor visits to attend to rework are also disproportionately expensive as previously discussed.
The four lists were disseminated using three different software programs and using inconsistent styles. This meant the contractor had to manipulate the lists into new documents that could be sent to subcontractors. Similar issues also prevent viable post-contract analysis and reporting from the lists. None of the participants proffered any particular reasons why this was the case; they all stated they would have no objection if a consistent approach was agreed and adopted from the outset. The issue appears to stem simply from a lack of coordination. Such coordination would of course improve communication and the data-handling processes.
The lack of simple data elements such as individual snag numbers and snag completion dates makes it difficult to track completed work and also makes post-contract analysis difficult without data re-entry. Again the participants offered no real explanation of why this was the case, other than the disengaged and idiosyncratic nature of the management process being used. Participants clearly understood the logic of allowing better tracking of the project data and also post-project analysis for learning purposes and generally supported adoption of a more structured approach. They were simply never asked to do so.
At any given stage of the process there is little real-time information on progress. A full re-inspection is required to ascertain any current status position. Participants noted real frustration in the lack of any real-time indication of ‘where they were’ with the snagging process (both here and in their experience). This was particularly evident where subcontractors needed to prove work was complete to release payments (valuations/retentions).
The client was not consulted on the snagging process and unilaterally added their own small, post-contract list of snags, requiring additional return visits. Participants reported mixed experiences. On some projects clients were heavily involved in the day-to-day workings of projects, while others take a ‘hands off’ approach, having little involvement. No particular consensus was agreed by participants in terms of how the client should be involved in the snagging process.
Table 3 Data content of pilot study snag lists compared to best practice (adapted from Sommerville et al., Citation2004)
The results of this overall assessment were discussed with the participants who confirmed that this snagging management process was ‘fairly typical’ in their experience and that the structure and content of the snag lists were also typical. They generally agreed that a more coordinated and collaborative supply chain effort could have a significant impact in streamlining and improving this area of process management. All noted however that there was no formal forum to address such matters in the current project process used in this project (or on their other projects). All efforts to mitigate defects and rework were unstructured and informal.
All parties agreed that normal practice was to carry out the snagging process individually. Nobody had any experience of any coordinated efforts to eliminate or better manage snagging. It was evident that no shared or collaborative IT systems were used on this project. The architect noted that he had some experience of such systems from one previous project. The remainder of the parties had no experience of working with collaborative IT.
Suggested avenues for future research
This paper focuses primarily on the first or diagnosing stage of the AR cycle with the SME. Some preliminary observations on measures for the second or action planning stage are also made. Future reports will describe the results of the concluding steps in the AR cycle, where an agreed improvement plan is put into action and then evaluated to study its impact on the problem. Further iterations of the cycle may then be required, to improve the original plan.
Conclusions
This research has considered information gained from the first phase of an AR cycle with an SME main contractor. Like other construction companies it has suffered in the Irish economic downturn and faces very significant financial and resource pressures. The data presented reveal problems within its productive processes for the management of defects and snagging. These results allow some preliminary conclusions to be drawn in terms of improvement potential in these processes. A root cause analysis of a common defect was presented, one of several such defects investigated on the pilot project. The results indicate that the supply chain participants, when adopting more collaborative and proactive approaches, can identify root causes and suggest possible cost effective solutions to avoid future recurrence. Literature examined from around the world indicates that defects aggregate to substantial wasted costs and that even modest improvement would yield significant and worthwhile savings throughout the supply chain. The Irish economic situation suggests that the industry will take many years to recover. It is thus likely that any significant improvement in the fortunes of the SME must come via improved productivity and efficiency. Inefficiency can no longer be masked by boom time conditions. The current production process used by the SME to manage defects and snagging does not however provide any forum for, or seek the input of its supply chain towards, collaboration into such matters.
The shortcomings in the management system used to collect snagging data and the subsequent process to rectify the defects used by the SME are clearly evident and have been fully exposed herein. Addressing these shortcomings provides a suitable starting point for future process improvement in terms of stage two of the action research cycle (action planning), namely: (1) the adoption of a collaborative supply chain approach; (2) the adoption of a standardized management process to manage defects and rework; (3) the adoption of cost effective IT solutions appropriate for SMEs; (4) the adoption of a simple/basic cost modelling method; and (5) a focus on learning and continuous improvement. The perilous financial position of the Irish industry is noted. Thus all initiatives to reduce defects (and thus also costs) must be rigorously balanced against any added inspection or process management costs. Collaborative supply chain approaches offer the potential to reduce defects, without adding significant costs to the process, allowing a positive cost result overall.
The results also support the conclusion that participants in the Irish industry profess a desire for more collaborative ways of working. They also have a sophisticated understanding of the potential benefits that such an approach could yield. Sadly they do not, as yet, adopt processes and procedures to match their ambitions for the industry.
References
- Abdul-Rahman, H. (1996) Some observations on the management of quality among construction professionals in the UK. Construction Management and Economics, 14(6), 48–95.
- AlSehaimi, A., Koskela, L. and Tzortzopoulos, P. (2013) Need for alternative research approaches in construction management: case of delay studies. Journal of Management in Engineering, 29(4), 407–13.
- Altrichter, H., Kemmis, S., McTaggart, R. and Zuber-Skerritt, O. (2002) The concept of action research. The Learning Organization, 9(3), 125–31.
- Aoieong, R.T., Tang, S.L. and Ahmed, S.M. (2002) A process approach in measuring quality costs of construction projects: model development. Construction Management and Economics, 20(2), 179–92.
- Atkinson, A.R. (1999) The role of human error in construction defects. Structural Survey, 17(4), 231–6.
- Atkinson, A.R. (2002) The pathology of defects: a human error approach. Engineering Construction and Architectural Management, 9(1), 53–61.
- Azhar, S., Ahmad, I. and Sein, M.K. (2010) Action research as a proactive research method for construction engineering and management. Journal of Construction Engineering & Management, 136( Special Issue: Research Methodologies in Construction Engineering and Management), 87–93.
- Barker, K. (2004) Review of Housing Supply, HMSO, Norwich.
- Baskerville, R.L. (1999) Investigating information systems with action research. Communications of the AIS, 2(3es), 4.
- Baskerville, R. and Myers, M.D. (2004) Special issue on action research in information systems: making IS research relevant to practice – Foreword. MIS Quarterly, 28(3), 329–35.
- Boyle, J. (2006) The Irish Homebuyer’s guide to snagging, Liberties Press, Dublin.
- Bresnen, M. and Marshall, N. (2001) Understanding the diffusion and application of new management ideas in construction. Engineering, Construction and Architectural Management, 8(5), 335–45.
- Central Statistics Office Ireland (2013) Production in Building and Construction Index, available at http://goo.gl/nImBXT ( accessed 27 September 2013).
- Chong, W.K. and Low, S.P. (2005) Assessment of defects at construction and occupancy stages. Journal of Performance of Constructed Facilities, 19(4), 283–9.
- Comit (2005) A case study assessment of the ‘Snagmaster’ system on a Taylor Woodrow project, Construction Opportunities for Mobile IT, available at http://goo.gl/zYSYOq ( accessed 15 October 2012).
- Craig, N. and Sommerville, J. (2007) Records management and information processing on construction sites using digital pen and paper. Records Management Journal, 17(3), 201–15.
- Davis Langdon (2011) Davis Langdon Ireland Annual Review 2011, Davis Langdon, Dublin.
- Denscombe, M. (2010) The Good Research Guide: For Small Scale Social Research Projects, 4th edn, Open University Press, Maidenhead.
- DKM Economic Consultants (2009) Review of the Construction Industry 2008 and Outlook 2009–2011, DKM Economic Consultants Ltd, Dublin.
- Elden, M. and Chisholm, R.F. (1993) Emerging varieties of action research: introduction to the special issue. Human Relations, 46(2), 121–42.
- Emmitt, S., Pasquire, C. and Mertia, B. (2012) Is good enough ‘making do’? An investigation of inappropriate processing in a small design and build company. Construction Innovation: Information, Process, Management, 12(3), 369–83.
- Fayek, A.R., Dissanayake, M. and Campero, O. (2004) Developing a standard methodology for measuring and classifying construction field rework. Canadian Journal of Civil Engineering, 31(6), 1077–89.
- Fellows, R. (2010) New research paradigms in the built environment. Construction Innovation: Information, Process, Management, 10(1), 5–13.
- Georgiou, J., Love, P.E.D. and Smith, J. (1999) A comparison of defects in houses constructed by owners and registered builders in the Australian State of Victoria. Structural Survey, 17(3), 160–9.
- Gill, J. and Johnson, P. (2002) Research Methods for Managers, 3rd edn, Sage, London.
- Green, S.D. and May, S.C. (2003) Re-engineering construction: going against the grain. Building Research & Information, 31(2), 97–106.
- Hult, M. and Lennung, S. (1980) Towards a definition of action research: a note and bibliography. Journal of Management Studies, 17(2), 241–50.
- Hwang, B.G., Thomas, S.R., Haas, C.T. and Caldas, C.H. (2009) Measuring the impact of rework on construction cost performance. Journal of Construction Engineering and Management, 135(3), 187–98.
- Iiozor, B.D., Okoroh, M.I., Ebgu, C.E. and Archicentre (2004) Understanding residential house defects in Australia from the State of Victoria. Building and Environment, 39, 327–37.
- Josephson, P.E. and Hammarlund, Y. (1999) The causes and costs of defects in construction. Automation in Construction, 8(6), 681–7.
- Josephson, P.E., Larsson, B. and Li, H. (2002) Illustrative benchmarking rework and rework costs in Swedish construction industry. Journal of Management in Engineering, 18(2), 76–83.
- Karim, K., Marosszeky, M. and Davis, S. (2006) Managing subcontractor supply chain for quality in construction. Engineering, Construction and Architectural Management, 13(1), 27–42.
- Kelly, M. (2009) The Irish credit bubble. University College Dublin, Working Paper Series WP09/32, UCD School of Economics, Belfield, Dublin 4.
- Koskela, L.J. (2004) Making do – the eighth category of waste. Paper presented at the 12th Annual Conference of the International Group for Lean Construction, Helsingor, Denmark, 3–5 August.
- Koskela, L., Henrich, G., Owen, R. and Vrijhoef, R. (2006) Theory based production and project management. Paper presented at the 3rd International Salford Centre for Research and Innovation (SCRI) symposium, Delft, Netherlands.
- Koskela, L.J., Sacks, R. and Rooke, J.A. (2012) A brief history of the concept of waste in production, in Walsh, K. (ed.) Proceedings of the 20th Annual Conference of the International Group for Lean Construction, San Diego, USA, 17– 22 July, International Group for Lean Construction, 321–330.
- Lee, H.L. and Amaral, J. (2002) Continuous and sustainable improvement through supply chain performance management. Paper presented at the Stanford Global Supply Chain Management Forum, SGSCMF-W1-2002, Stanford University.
- Lewin, K. (1946) Action research and minority problems. Journal of social issues, 2(4), 34–46.
- Liker, J.K. (2004) The Toyota Way, McGraw-Hill, New York.
- Lopez, R., Love, P.E.D., Edwards, D.J. and Davis, P.R. (2010) Design error classification, causation and prevention in construction engineering. Journal of Performance of Constructed Facilities, 24(4), 399–408.
- Love, P.E. and Li, H. (2000) Quantifying the causes and costs of rework in construction. Construction Management & Economics, 18(4), 479–490.
- Love, P.E.D. (2002a) Influence of project type and procurement method on rework costs in building construction projects. Journal of Construction Engineering & Management, 128(1), 18–29.
- Love, P.E.D. (2002b) Auditing the indirect consequences of rework in construction: a case based approach. Managerial Auditing Journal, 17(3), 138–46.
- Love, P.E.D. and Edwards, D.J. (2004) Forensic project management: the underlying causes of rework in construction projects. Civil Engineering and Environmental Systems, 21(3), 207–28.
- Love, P.E.D. and Sohal, A.S. (2003) Capturing rework costs in projects. Managerial Auditing Journal, 18(4), 329–39.
- Love, P.E.D., Wyatt, A.D. and Mohamed, S. (1997) Understanding rework in construction, in Proceedings of the International Conference on Construction Process Re-engineering, Griffith University Gold Coast, Australia, 14–15 July, pp. 13–25.
- Love, P.E.D., Li, H. and Mandal, P. (1999) Rework: a symptom of a dysfunctional supply-chain. Journal of Purchasing & Supply Management, 5(1), 1–11.
- Love, P.E.D., Irani, Z. and Edwards, D.J. (2004) A rework reduction model for construction. IEEE Transactions on Engineering Management, 51(4), 426–40.
- Love, P.E.D., Edwards, D.J., Smith, J. and Walker, D.H.T. (2009) Divergence or congruence? A path model of rework for building and civil engineering projects. Journal of Performance of Construction Facilities, 23(6), 480–8.
- McKay, J. and Marshall, P. (2001) The dual imperatives of action research. Information Technology & People, 14(1), 46–59.
- Mulhall, A. (2003) In the field: notes on observation in qualitative research. Journal of advanced nursing, 41(3), 306–313.
- Nielsen, J., Hansen, E.J.D.P. and Aagaard, N.J. (2009) Buildability as a tool for optimisation of building defects, in Ceric, A. and Radujkovic, M. (eds) Construction Facing Worldwide Challenges, CIB Joint international Symposium, Dubrovnik, Croatia, 27–30 September, pp. 1003–12.
- Patton, J.R. (2013) Task diminishment: construction value loss due to sub-optimal task execution, PhD dissertation, Indiana State University, USA.
- Rapoport, R.N. (1970) Three dilemmas in action research: with special reference to the Tavistock experience. Human Relations, 23(6), 499–513.
- Robson, C. (2002) Real World Research, 2nd edn, Blackwell, Oxford.
- Rooke, J., Seymour, D. and Fellows, R. (2004) Planning for claims: an ethnography of industry culture. Construction Management and Economics, 22(6), 655–62.
- Rotimi, F.E., Tookey, J., Craig, N. and Rotimi, J.O.B. (2011) Opportunities for defect reporting in new residential buildings: a case for New Zealand, in Egbu, C. and Lou, E.C.W. (eds) Proceedings 27th Annual ARCOM Conference, Bristol, 5–7 September, Association of Researchers in Construction Management, Reading, pp. 643–52.
- Seymour, D., Shammas-Toma, M. and Clark, L. (1997) Limitations of the use of tolerances for communicating design requirements to site. Engineering, Construction and Architectural Management, 4(1), 3–23.
- Shammas-Toma, M., Seymour, D. and Clark, L. (1996) The effectiveness of formal quality management systems in achieving the required cover in reinforced concrete. Construction Management and Economics, 14(4), 353–64.
- Shewhart, W.A. (1931) Economic Control of Quality of Manufactured Product, Macmillan, London.
- Society of Chartered Surveyors Ireland (2012) The Irish Construction Industry 2012, Society of Chartered Surveyors Ireland, Dublin.
- Sommerville, J. (2007) Defects and rework in new build: an analysis of the phenomenon and drivers. Structural Survey, 25(5), 391–407.
- Sommerville, J., Craig, N. and Bowden, S. (2004) The standardisation of construction snagging. Structural Survey, 22(5), 251–8.
- Susman, G.I. and Evered, R.D. (1978) An assessment of the scientific merits of action research. Administrative Science Quarterly, 23(4), 582–603.
- Taggart, M., Koskela, L. and Rooke, J. (2012) Collaborative supply chain practices during severe economic downturn in the Republic of Ireland, in Smith, S.D. (ed.) Proceedings 28th Annual ARCOM Conference, Edinburgh, 3–5 September, Association of Researchers in Construction Management, pp. 687–95.
- Thomas, K. and Hore, A.V. (2003) A reflection on the development, activities and deliverables of the Construction IT Alliance (CITA) in Ireland, in CIB W89, International Conference on Building Education and Research, Salford, UK, 9–11 April, pp. 506–17.
- Ulster Bank (2013) Ulster Bank Construction PMI Report, available at http://goo.gl/0d9IOS ( accessed 27 September 2013).
- Vinten, G. (1994) Participant observation: a model for organizational investigation? Journal of Managerial Psychology, 9(2), 30–8.