
Abstract
Visual Management (VM) is an important Lean method to enhance information flow and reduce waste in construction. However, its adoption is hindered by several barriers. Scientific works mention that emerging technologies can support or replace conventional VM practices, but empirical evidence is missing. Based on an in-depth literature review, we derived the research questions (RQs), arguing if Augmented Reality (AR) could mitigate VM implementation barriers. Thus, a corresponding AR measurement model was developed. Through a case study of mechanical, electrical, and plumbing (MEP) installations in a multi-story apartment building, the RQs were answered using an AR head-mounted display (HMD). To gather the necessary empirical evidence, the data was collected through direct observations on-site and through semi-structured interviews. The study findings show that (1) AR provided time savings and generally satisfactory accuracy levels. (2) AR demonstrably reduced the training effort to better support MEP marking work. (3) The use of AR reduced the resistance to change to adopt VM practices, although concerns were raised about poor ergonomics and work safety risks. Future research activities should consist of investigating the potential of other emerging technologies to overcome the common Lean implementation barriers in construction.
Introduction
Mechanical, Electrical, and Plumbing (MEP) systems are an essential part of building services. Typical activities of MEP include the installation of subsystems such as heating, ventilation, and air conditioning systems (HVAC), electrical power and lighting systems, firefighting, and fire protection systems, as well as water supply and drainage systems. A high degree of interdisciplinary coordination among various skilled workers is required to manage the complex and time-consuming nature of MEP installations (Chen et al. Citation2012), which commonly accounts for 40–60% of the total cost of construction projects (Khanzode Citation2010). Compared to the manufacturing industry, the construction industry is characterised by a relatively lower productivity (Aslam et al. Citation2020). According to Lean Institute (Construction Industry Institute Citation2005), Aziz and Hafez (Citation2013), value-adding activities in construction amount for only 10%, while in manufacturing they account for 62% of all activities. MEP work makes up a considerable part of construction in terms of the cost, function, and value increases, therefore playing an important role in project performance (Bandara et al. Citation2018). Furthermore, on-site construction and assembly are characterised by budget and time constraints, as well as the complexity of managing multiple simultaneous processes and actors (Braglia et al. Citation2020).
Compared to manufacturing where the product and process flow is visible and traceable from start to finish due to a fixed location and clear working procedures, construction faces different challenges (Formoso et al. Citation2002). As the project progresses, the site layout changes frequently depending on the type of material and equipment used. Furthermore, the work processes and therefore the needed material and equipment are strictly linked to the trades and subcontractors working on-site. This means that the direct observation of the processes involved by the workforce is often hindered by non-removable visual barriers such as erected walls and slabs during construction (Formoso et al. Citation2002). This leads to: (1) non-transparent processes, e.g. the main process flow is not visible and understandable due to the regular modifications throughout the project which hinders the information sharing and decision-making among and of the project stakeholders (Brandalise et al. Citation2018, Lundberg et al. Citation2021) (2) an impact on worker safety, e.g. frequent modifications to the site layout and construction itself impedes the effective communication of safety risks using visuals (Abdelkhalek et al. Citation2019), and (3) reduced collaboration between the team members and trades, e.g. the frequent change of the site environment prevents an effective exchange of information between the different trades (Valente et al. Citation2019).
One methodology that helps to minimise these issues on-site is Visual Management (VM). VM in construction encompasses a set of Lean management techniques with the aim of passing on specific information and instructions to the workforce using visual tools (Tezel and Aziz Citation2017b). Four main areas for implementing VM directly in the workplace can be identified (Viana et al. Citation2014, Brady et al. Citation2018). First, there are visual devices that display relevant information (“information giving”) such as “One-Point-Lessons (OPL)” consisting of one-page long operating instructions to standardise and optimise workflows. Second, there are visual devices that attract attention via signals (“signalling”), like “Kanban,” which involves visual control cards that indicate if materials or parts need to be replenished. Third, there are visual devices that control human responses (“limiting”), such as fences or site layouts which provide a safe enclosure, while also creating transparency by making the processes observable. Fourth, there are visual devices that intentionally warn (“guaranteeing”), such as “Poka-Yoke” or “Andon” devices, by either preventing mistakes or defects from arising or making any mistakes or defects immediately apparent.
Recent research has emphasised that emerging information and communication technologies (ICTs) can facilitate or even replace the existing VM systems on construction sites, but these are still in the early stages of implementation (Dave et al. Citation2013, (Gurevich and Sacks 2014) , Tezel and Aziz Citation2017a). Technologies like Building Information Modelling (BIM), Mobile Computing, Laser Scanning, and Augmented Reality (AR) can potentially be used to improve process transparency (Tezel and Aziz Citation2017a, Lundberg et al. Citation2021). However, most AR applications developed to date have been conceived to support the work of managers and inspectors rather than on-site operational workers (Valente et al. Citation2019). The use of emerging technology to support and enhance Visual Management (VM) practices on construction sites would have great promise but currently it faces a shortage of personnel that are competent in both Lean Construction and new technologies. This is in addition to a lack of case studies and best practices, as well as a lack of proof of return on investment (Tezel and Aziz Citation2017b). Thus, conventional VM tools in the construction industry are frequently paper-based and without proper digital support. In detail, VM in construction is often hindered by several specific barriers (Schulze and Dallasega Citation2020). These include the lack of a systematic approach for adopting VM on construction sites (Tezel et al. Citation2015, Brady et al. Citation2018), a lack of how to quantify VM benefits (Tezel et al. Citation2017), a lack of know-how (Abu et al. Citation2019; Basu and Dan Citation2020), and insufficient training of the workforce (Dora et al. Citation2016, Lodgaard et al. Citation2016, Cherrafi et al. Citation2017).
We believe that emerging technologies such as AR in combination with BIM have the potential to support current VM practices and overcome some of the limitations by improving how information is visualised. This is also underpinned by more recent work (Dave et al. Citation2013, Tezel and Aziz Citation2017a). AR allows the user to work in a real-world environment while visually projecting digital objects generated by BIM. On-site VM practices in particular would benefit from BIM and AR integrated visualised information becoming interactive and context aware (Wang et al. Citation2013b, Tezel and Aziz Citation2017a).
Studies have shown the potential of AR systems to increase productivity in maintenance (Jetter et al. Citation2018, Loizeau et al. Citation2019), logistics (Remondino Citation2020), and training tasks (Hou et al. Citation2017). In the literature, AR is used to support assembly tasks by guiding workers step-by-step through complex manual tasks (Wang et al. Citation2013b, Hou et al. Citation2017) and to support supervisory control and checking for installation or assembly errors (Kuo et al. Citation2013).
Considering construction, Williams et al. (Citation2015) pointed out that AR is particularly suitable for supporting users in their routine tasks like assembly, marking and laying tasks. AR is not yet widely applied in construction as there is no hard evidence of its benefits (Delgado et al. Citation2020a). However, the experiences from other sectors suggest that benefits can also be achieved in the construction sector (Delgado et al. Citation2020b). Recent studies indicate that emerging technologies like AR could even help to overcome the VM implementation barriers (Tezel et al. Citation2016a, Tezel and Aziz Citation2017a, Citation2017b, Valente et al. Citation2019). In this direction, Tezel and Aziz (Citation2017b) pointed out the lack of a measurement model to identify the benefits of AR for construction projects. They suggest that AR could support the following conventional VM systems and tools in construction: 5S, One-Point-Lessons, and Last Planner meeting boards. However, this has only been examined conceptually without empirical validation. In this direction, Delgado et al. (Citation2020) highlighted that practical use cases of AR in construction should be conducted to justify the investment required to adopt AR in this sector.
Based on this, our research aims to empirically validate if AR could help to overcome the traditional VM implementation barriers in construction. Specifically, the paper empirically validates the following research questions (RQs). RQ1: Does the application of AR to support VM practices result in measurable benefits while performing MEP marking work in construction? RQ2: Does AR reduce the training effort to support marking work of MEP construction projects? RQ3: Does the application of AR to support marking work of MEP construction projects reduce the resistance to adopt VM practices?
The article is structured as follows. Section two presents the literature review and derives the RQs to be answered. Section three proposes the AR measurement model and section four describes the research methodology used. Section five presents the results of the case study application, which are discussed in section six, including the implications for research and practice, limitations, and future research directions.
Literature review
The following chapter describes the application of VM in construction (section “Visual management in construction”), the general Key Performance Indicators (KPIs), and the measurement indicators of AR which are also used in contexts not directly related to construction (section “ General KPIs of AR”) as well as the use of AR in construction (section “AR applications in construction”). In section “Derivation of research questions”, the RQs to be investigated in our research are derived.
Visual management in construction
Visual Management (VM) is often mentioned in the literature as one of the main Lean methods (Erthal and Marques Citation2018, Babalola et al. Citation2019) aimed at increasing process transparency (Tezel et al. Citation2016a, Verbano et al. Citation2017), measurement and the improvement of organisations by using devices to project information and improve communication in the work environment (Brady et al. Citation2018, Singh and Kumar Citation2021). This means creating a visual workplace where the VM tools support the management in the fields of performance, quality, human resources, and safety (Tezel et al. Citation2015).
VM is commonly applied in advanced manufacturing (Liker and Morgan Citation2006, Tezel and Aziz Citation2015) and less often in construction due to the frequent changes in site layout and the simultaneous and overlapping work of different trades and subcontractors on-site (Bryde and Schulmeister Citation2012, Tezel et al. Citation2015, Citation2016a, Tjell and Bosch-Sijtsema Citation2015, Brady et al. Citation2018, Singh and Kumar Citation2021).
VM tools can be categorised into visual indicators (a simple display of information, such as safety advisory boards), visual signals (attention-seeking devices, such as sirens), visual control (tool to impact behaviour, such as speed bumps), and visual guarantees (fool-proof devices to allow only the right thing to happen) (Galsworth Citation1997). Typical VM tools and techniques applied to construction include:
Heijunka boards to level the demand and control variability in material and equipment usage (Tezel and Aziz Citation2017b, Singh and Kumar Citation2021).
Visual performance boards and Obeya (big rooms) where the KPIs are located and displayed, and meetings and continuous improvements are facilitated (Tezel et al. Citation2017, Singh and Kumar Citation2021).
Andon systems as signalling boards to draw the supervisors’ attention to sustain Continuous Improvement Process (CIP) efforts (Tezel et al. Citation2017, Singh and Kumar Citation2021).
Project production control systems such as Location-Based Management Systems (LBMS), conventional Gantt charts or Last Planner System (LPS) plans with construction site tasks (Tezel et al. Citation2017, Singh and Kumar Citation2021).
Last Planner System (LPS) as an important Lean Construction method for collaborative construction planning and control (Ballard Citation2000).
A3 method for visualising the CIP process or Plan-Do-Check-Act (PDCA) cycle on an A3 sheets (Tezel and Aziz Citation2017a).
One-Point Lessons (OPL) to visually train people on changed procedures, revised standards, etc. using one-page sheets as effective on-the-job training tools (Tezel and Aziz Citation2017a).
5s as a system performance tool to create a disciplined, clean and orderly work environment (Singh and Kumar Citation2021).
Poka-yoke, a quality assurance technique originally developed by Toyota, to eliminate defects in a product by preventing mistakes as early as possible (Tezel and Aziz Citation2015).
VM faces numerous implementation barriers in construction. It is often applied in isolation and unsystematically to individual processes, resulting in different levels of VM practices and standards in different sites run by the same company (Tezel et al. Citation2016a, Tezel and Aziz Citation2017a, Brady et al. Citation2018). Furthermore, the fragmentation of the construction industry, its project-based character, and the duplication of information also hampers its implementation (Tezel and Aziz Citation2017a). Specifically, paper-based documents that include 2D construction drawings, construction diaries, and schedules generally account for most of the technical information needed in day-to-day practice. This often leads to different levels of knowledge and misunderstandings between stakeholders, as well as an incomplete vision of the actual situation which hinders informed decision-making (Ratajczak et al. Citation2019).
Adopting on-site VM practices during the application phase is also hindered by construction workers who fear making mistakes and who resist changing from the traditional ways of working (Tezel et al. Citation2015). This can be attributed to the often very low level of education and the high turnover of operators in general (Tezel et al. Citation2015). To increase the successful implementation of VM, the literature emphasises the importance of adequate operator training, especially for complex VM practices that are not widely used on construction sites (Tezel et al. Citation2015, Brady et al. Citation2018, Brandalise et al. Citation2018). However, the site managers responsible for Lean and VM initiatives often report a lack of time and financial resources to appropriately train employees (Tezel et al. Citation2017).
Another main barrier when implementing VM is the missing knowledge on how to objectively measure and quantify the effectiveness of the different visual tools and systems (Marodin and Saurin Citation2014, Tezel and Aziz Citation2015, Citation2017a, Tezel et al. Citation2016b, Brady et al. Citation2018, Johari and Jha Citation2021).
General KPIs of AR
Several Key Performance Indicators (KPIs) for measuring the benefits of AR, specifically developed for the manufacturing industry, have been identified in the literature (Jetter et al. Citation2018, Chuah Citation2019, Frutos-Pascual et al. Citation2019, Loizeau et al. Citation2019, Ratajczak et al. Citation2019, Remondino Citation2020). The application fields include automotive maintenance (Jetter et al. Citation2018), aeronautical maintenance (Loizeau et al. Citation2019), logistics (Remondino Citation2020, Wang et al. Citation2020), control cabinet production (Khokhlovsky et al. Citation2019), and construction (Ratajczak et al. Citation2019). summarises the identified KPIs and their definitions. The most commonly cited quantitative KPIs are time, such as a reduction in the time it takes to complete a certain task, errors, such as a decrease in the number of errors committed during a specific task (Loizeau et al. Citation2019, Remondino Citation2020, Jasche et al. Citation2021), and costs, such as a reduction in training costs or the costs for personnel and equipment used for a certain task (Loizeau et al. Citation2019, Ratajczak et al. Citation2019, Remondino Citation2020). Furthermore, qualitative KPIs include cognitive load (Jetter et al. Citation2018, Loizeau et al. Citation2019, Jasche et al. Citation2021), spatial representation (Jetter et al. Citation2018), perceived ease of use, perceived usefulness, attitude towards using, and the behavioural intention to use AR (Jetter et al. Citation2018, Loizeau et al. Citation2019).
Table 1. Identified KPIs in the literature to measure the benefits of AR systems.
Jetter et al. (Citation2018) as well as Loizeau et al. (Citation2019) stated that KPIs could be substantially improved with the use of AR compared to traditional information systems such as paper-based manuals. AR helps to speed up the training process of assembly routines and increase the working memory capacity by supporting information processing and cognition (Jetter et al. Citation2018, Loizeau et al. Citation2019). In both studies, older participants with more work experience reported there to be benefits in terms of greater decreases in the perceived “Cognitive Workload,” confirming the seemingly intuitive use of AR technology. Loizeau et al. (Citation2019) found that AR shortens the understanding phase of a task (time to understand the maintenance instructions) and increases the action phase (time to complete the task), allowing users to more effortlessly focus on the execution phase. Similar results were obtained by Remondino (Citation2020) and Wang et al. (Citation2020) regarding the application of AR technology in the logistics industry to support staff training, storage operations, warehouse management, and transport optimisation. According to their studies, AR is especially suitable for the staff training as logistics companies often employ temporary resources. AR usage reduces the errors made by the unqualified workforce and reduces the training requirement for employing temporary workers. In logistics in particular, AR digitises work processes such as warehouse operations to switch from “pick-by-paper” to “pick-by-vision.” In this direction, Khokhlovsky et al. (Citation2019) found that the use of AR reduces the number of decisions to be made by the assembly workers while decreasing the qualification needs and the risk of errors in the assembly processes.
Further measurement indicators were identified by Frutos-Pascual et al. (Citation2019) who compared different freehand AR HMDs in a task-based interaction. Usability, interactivity, precision, ease of use, the field of view, and hand tracking accuracy were measured. According to the authors, more powerful AR tracking and visualisation devices will lead to improved usability, comfort, and accessibility in the future.
Chuah (Citation2019) highlighted that KPIs for Extended Reality (XR) are not yet properly defined as XR is a relatively new technology. XR is an umbrella term that refers to all real and virtual combined environments generated by computer technology and wearables that encompass Augmented Reality (AR) and Virtual Reality (VR). VR refers to technology that places the user in a complete digital environment while blocking his view of the real world. AR refers to technology that enables the user to see the real and digital worlds simultaneously. According to Chuah (Citation2019), companies applying XR technology need to formulate KPIs based on their specific situation. summarises the KPIs identified in the literature used to measure the benefits of AR.
AR applications in construction
Wang et al. (Citation2013b) demonstrated the application of an AR HMD which allowed real-time information to be gathered without the need to obtain information from drawings and photographs, while allowing hands-free working. Cognitive tasks related to construction work on site (e.g. reading through drawings and instructions between work steps) took significantly less time as a result. In this direction, Hou et al. (Citation2017) proposed a training framework for VR and AR systems to teach complex procedures and to increase the skill levels found in the oil and gas industries. It has been reported that it takes less time and there are fewer errors when completing the tasks as well as less learning time compared to the traditional way of using text and photographs. The authors suggest using head-mounted VR or AR systems to further improve these benefits. Chalhoub and Ayer (Citation2018) compared the performance of two groups of participants for the assembly of prefabricated electrical conduits. The design information was provided either through the means of an AR HMD (Microsoft HoloLens) or using traditional drawings. The main results were faster assembly operations, less time needed to understand the given tasks, and fewer errors. Interestingly, participants with no prior conduit assembly experience accomplished the best times. Similarly, Kwiatek et al. (Citation2019) analysed the impact of a hand-held AR application for assembling pipe spools in construction compared to a conventional approach and its impact on human spatial cognitive abilities. As a result, the AR application helped significantly to reduce the time it took to complete the pipe assembly tasks. Participants with low spatial skills benefitted twice as much from the AR application as their counterparts with high spatial skills. Therefore, AR does seem to be very suitable for training purposes such as when onboarding apprentice pipefitters. Ratajczak et al. (Citation2019) presented a BIM-based AR application that displays context-specific information about the construction project and tasks, as well as KPIs on the construction progress and performance. The system showed there to be benefits like increasing the process transparency. However, it was only tested experimentally.
In the field of facility management, El Ammari and Hammad (Citation2019) developed a BIM-based Augmented Reality approach to facilitate remote collaboration and visual communication between the office and on-site operators. The field workers used an AR application on their tablet while in the office, the managers used an Immersive Augmented Virtuality (IAV) application on their desktop computer, giving them the same view as the fieldworkers. The identified benefits included time saving in terms of the data collection, model navigation, approvals, as well as the reduction of on-site errors. Similarly, Chen et al. (Citation2020) created a fire safety equipment (FSE) inspection and maintenance system using AR to provide the inspectors and engineers with the necessary information when performing maintenance and repair work. Significantly higher levels of performance and fewer errors have been reported compared to the traditional paper-based method. Again, the researchers suggest applying an AR headset with gestures and gaze recognition technology to further improve performance.
In summary, AR has been applied primarily to support training, assembly, and maintenance tasks in the gas, oil, and construction industries. However, it has emerged that the knowledge in the field of evaluating the benefits of AR is still scarce and dispersed. In the literature, mainly quantitative measurement indicators such as the reduction of execution times and errors are considered. This is also underpinned by the work of Wang et al. (Citation2013a) who emphasised the importance of evaluating the performance of AR systems to achieve further improvements. According to them, different models like the “Balanced Score Card (BSC), IS Success Model, Control Objectives for Information and Related Technology (COBIT), Information Economics have been applied to suggest measures that can evaluate the performance of information systems by considering diverse perspectives.” Due to the unique characteristics of AR systems such as “portability, mobility, nomadicity, information load, congruence, and cognitive load,” the existing approaches used to evaluate information systems are not appropriate (Chen et al. Citation2020). Similarly, Chuah (Citation2019) points out that established models and technology acceptance theories such as the Technology Acceptance Model (TAM), the Unified Theory of Acceptance and Use of Technology (UTAUT) model, or the Technology-Organization-Environment (TOE) framework are insufficient to explain the user reactions to AR technologies and to measure their benefits. According to Liu et al. (Citation2018), the TAM model would benefit from including more measurable indicators for each of the parameters such as perceived usefulness, perceived ease of use, and external variables, thereby supporting quantitative studies with statistically reliable results.
Derivation of research questions
Tezel and Aziz (Citation2017a) pointed out that there is still limited knowledge among construction managers on how to quantify the benefits of VM. Moreover, a systematic approach to support the successful adoption of VM in construction is lacking (Tezel and Aziz Citation2017a). The literature mainly focuses on the indicators suitable for measuring the benefits of AR in the automotive (Jetter et al. Citation2018), aeronautics (Loizeau et al. Citation2019), and logistics (Remondino Citation2020) industries. The main focus is on the time (Loizeau et al. Citation2019, Remondino Citation2020), error (Loizeau et al. Citation2019, Ratajczak et al. Citation2019, Remondino Citation2020), and cost aspects (Loizeau et al. Citation2019, Ratajczak et al. Citation2019, Remondino Citation2020). In terms of construction, recent works indicate that AR could support VM leading to an increase in performance (Tezel and Aziz Citation2017b, Tezel et al. Citation2020). However, these works lack adequate empirical validation and confirmation. This leads to the first RQ to be answered:
RQ1: Does the application of AR to support VM practices result in measurable benefits while performing MEP marking work in construction projects?
As analysed by Tezel et al. (Citation2015, Citation2017b), complex VM practices require adequate operator training to achieve the associated benefits. Sustaining advanced VM tools like the 5s requires a lot of scrutiny and commitment from the workforce. Despite emphasising that operator training is essential to VM implementation, construction managers often mention that they do not have enough time to adequately train them (Tezel et al. Citation2015, Tezel and Aziz Citation2017b). The recent literature shows the applicability of AR as an effective training tool for operators in logistics (Remondino Citation2020), electric cabinet production (Khokhlovsky et al. Citation2019), maintenance work in automotive assembly (Jetter et al. Citation2018), aeronautical maintenance (Loizeau et al. Citation2019), learning complex procedural skills in the construction, engineering, and medical fields (Hou et al. Citation2017), and the inspection and maintenance of fire safety equipment (Chen et al. Citation2020). However, the work is mainly focussed on the manufacturing environment and less knowledge is available for the construction industry.
One of the main differences between construction and manufacturing is its high level of fragmentation as trades and suppliers are frequently exchanged between different projects. Due to the high turnover rate of construction operators, a high training effort is needed (Hee and Ling Citation2011). Additionally, construction often does not allocate a specific budget (and time) for proper operator training. Therefore, knowledge about safety, health and standard practices is rarely renewed (Wolf et al. Citation2019) and not very effective (Edirisinghe and Lingard Citation2016). Consequently, construction trades such as scaffolders, roofers, steel workers, plumbers, etc. have not yet benefitted from training supported by emerging technologies (Carozza et al. Citation2013). Additionally, existing training methods such as self-learning, hands-on-learning and supervised-learning for construction operators are ineffective and outdated (Moore and Gheisari Citation2019). Therefore, AR-based training offers the opportunity to provide safe and more effective instructions to construction operators at a reduced time and cost (Moore and Gheisari Citation2019). The second RQ is derived accordingly:
RQ2: Does AR reduce the training effort to support marking work of MEP construction projects?
For the successful implementation of VM in construction, the authors also mention the importance of overcoming conventional working habits (Tezel et al. Citation2015, Tezel and Aziz Citation2017b). The workers’ adherence to traditional working methods is further impeding the broader adoption of VM in construction (Tezel et al. Citation2015, Mano et al. Citation2020, Sahu et al. Citation2021). Resistance to change to new organisational processes and methods is one of the main barriers to successfully putting VM into practice (Tezel et al. Citation2015, Tezel and Aziz Citation2017a, Sahu et al. Citation2021). This includes the scepticism of employees towards the management’s commitment (Dora et al. Citation2016), as well as the missing support of the middle management in the implementation processes of VM (Marodin and Saurin Citation2014). In addition, the adoption of VM is impaired by the employee’s fear of the unknown, fear of failure (Tezel and Aziz Citation2017b) and complacency, fear of making mistakes, as well as the fear of job loss due to Lean rationalisation (Salonitis and Tsinopoulos Citation2016, Cherrafi et al. Citation2017, Abu et al. Citation2019). Based on Tezel et al. (Citation2015), this can be attributed to the often very low level of education and the high turnover of operators in general. On the other hand, according to Jetter et al. (Citation2018) and Remondino (Citation2020), operators intuitively understand the support provided by AR systems. As described in detail in section 2.3, various drivers such as perceived ease of use, perceived usefulness, and cognitive workload influence the acceptance of AR by construction operators. Users perceive the AR system to be user-friendly because of its simple, fast, precise, and reliable application (Jetter et al. Citation2018, Loizeau et al. Citation2019, Remondino Citation2020). Thus, the third RQ aims to practically validate the previous statements.
RQ3: Does the application of AR to support marking work of MEP construction projects reduce the resistance to adopt VM practices?
AR measurement model
The literature review identified several KPIs that measure the performance of AR. They served as a starting point to develop our measurement model.
First, we selected several KPIs from the literature to test and answer the research questions derived in section “Derivation of research questions”. In addition, certain KPIs suitable to validate the research questions not been found in the literature were added by the research group. The following criteria were used when selecting the suitable KPIs. (1) Relevance: a KPI must help the user to validate the research questions. (2) Reliability: the KPI should be measurable as accurately as possible. (3) Comparability: the KPIs should enable the users to identify the similarities and differences present between the two sets of results. (4) Understandability: the KPIs should be easily interpretable and understandable by a broad range of users.
We selected the KPI Work Safety because potential work safety risks were observed during the initial on-site testing of the AR HMD (i.e. tripping hazards from cables or equipment on-site). The indicator Training was added because we wanted to measure the effort required to learn how to use new equipment. From a research perspective, we wanted to have some insights into the impact of training on the participants’ performance (Johari and Jha Citation2021). Furthermore, the case company complained about the weight of the AR HMD during the first tests which were still in the office and not on the construction site. We therefore decided to introduce an indicator for measuring Ergonomics.
To validate RQ1, the KPIs in terms of Cycle Time (CT) and Accuracy (ACC), defined as the deviation from the design, were selected. The KPI CT refers to the total time from the beginning to the end of the considered construction operation (e.g. marking operations on-site). It meets the time that is needed for value-adding and supporting operations. ACC refers to the total deviations from the design made during a given task (e.g. marking operations). It considers absolute deviations from the design in the X and Y axes (ACCXY) as well as in the Z axis (ACCZ). The indicator Perceived Usefulness was selected because it is interpreted as a performance-based metric used to evaluate whether AR improves job performance (Davies 1989). For example, an intelligently designed user interface of a system that only contains the necessary functions will not disrupt the user experience and thus support the initial user acceptance and sustained use of the system (Venkatesh Citation2000). These KPIs were selected because they allow for a performance measurement and enable a direct comparison between the use of AR and the use of conventional methods such as paper-based manuals and drawings.
To answer RQ2, the following KPIs were considered. The Training of the AR technology considers factors such as posture, gestures, and the interactions of the applicant with the AR HMD. This includes the adjustability and operation controls within the system’s user interface. Since complex VM procedures require a high training effort (Tezel and Aziz Citation2015, Citation2017a), we decided to select a specific KPI that measures the training endeavour. Specifically, we considered the RU/A ratio which allows for a comparison between the tasks carried out with AR support and those carried out using traditional methods such as drawings, photographs, hand-written notes, as well as a pen and tape measure (Loizeau et al. Citation2019).
To answer RQ3, we applied the metrics from Davis (Citation1985, Citation1989) Technology Acceptance Model (TAM). We used this TAM model because it is a widely tested model used to explain the acceptance of information technology and systems in industry (Praveena and Thomas, Citation2014, Liu et al. Citation2018). The indicator Perceived Ease of Use was chosen due to the AR HMD’s intuitive use through simple gestures and its user friendly interface (Chuah Citation2019) which aims to reduce the effort needed when implementing the technology in practice (Davies 1989, Liu et al. Citation2018). We selected this indicator because if the applicant believes that the system is easy to use and requires little effort, the resulting acceptance level will be increased (Davis Citation1985). The KPIs, Perceived Ease of Use, a process expectancy, and Perceived Usefulness, an outcome expectancy, are the two decisive factors influencing user intention and usage behaviour, thus supporting the user acceptance of a technology (Venkatesh Citation2000).
The KPI Cognitive Workload was used to answer RQ3 since a user-oriented interface and the intuitive gestures of the AR HMD are likely to decrease the user’s mental effort and thus lead to a higher acceptance (Voskamp and Urban Citation2009, Knaepen et al. Citation2015). Typical cognitive demands like thinking, deciding, calculating, looking, searching, and remembering are presumably relieved with the AR HMD during the construction tasks.
Ergonomics describes the influence of the AR HMD on a user’s gestures and form when performing a particular task. It considers whether the user’s wellbeing is affected by the AR HMD or how the gestures affect the user’s posture and the overall performance of the system (Aromaa et al. Citation2018). For example, the form factor of the AR HMD hardware, such its burdensome weight and low user field of view, causes the users to become potentially tired or to exert themselves in unsafe body positions during the task execution. Therefore, this KPI was selected to answer RQ3.
The indicator Work Safety was used to answer RQ3 since occupational safety plays an important role in the acceptance of the AR HMD. This is because it could have a positive or negative influence on work ability, job performance, and the health of the workers using the AR HMD. On the one hand, work safety could be impaired by the narrowed field of view of the AR HMD (Kim et al. Citation2016, Vorraber et al. Citation2020). However, AR could help reduce the risk factors and error rates by superimposing safety warnings onto the AR HMD (Li et al. Citation2018).
The indicator Attitude Towards Using a system or technology was used to answer RQ3 because positively valued outcomes when using the AR HMD could increase the user’s feelings towards the technology (Jackson et al. Citation1997) and thus raise the user’s acceptance of a system and their Behavioural Intention to Use it (Venkatesh Citation2000, Praveena and Thomas, 2014).
The indicator Behavioural Intention to Use was chosen as a metric because, as stated in the TAM model, it is able to measure the actual use of the AR technology in practice and thus helped to determine its acceptance level (Davis Citation1985, Davies 1989). According to Luarn and Lin (Citation2005), Behavioural Intention to Use is affected by the user’s attitude regarding the perceived positive or negative performance effects of the AR technology, as well as the subjective norms regarding the perceived opinion of others in terms of whether the individual should apply the AR technology. Behavioural Intention to Use is significantly influenced by Perceived Usefulness and Perceived Ease of Use (Wong Citation2013).
Research methodology
Analysis and model development
First, a literature review was carried out to determine the specific KPIs used to measure the benefits of AR applications in construction and other industries (). Moreover, an overview of VM in construction as well as the specific implementation barriers has been given. Based on the analysis of the literature review, we derived the research questions RQ1, RQ2 and RQ3. The AR measurement model () was defined by selecting suitable KPIs from the literature review as well as defining new metrics with the final aim of empirically answering the RQs.
Table 2. AR measurement model.
Case study selection
The case study methodology, as proposed by Yin (Citation2009, Citation2011), was adopted because it is suited to empirically observing and researching occurrences or contemporary social phenomena in their practical and cultural context (Eisenhardt, Citation1989, Yin, Citation1992, 2011). The case study methodology allows for the gaining of a novel understanding that would be otherwise difficult to obtain through purely analytical or statistical analyses (Yin Citation2011, Robson and McCartan Citation2016). We selected this research methodology because it allowed us to explain, through the collection of real-world data, how the application of AR in construction can help to overcome VM implementation barriers.
We used the purposeful sampling technique (Palinkas et al. Citation2015) to select the project case and participants as this non-random technique allows for the targeting of participants based on the necessary information that they can provide on the ideas and topics in question (Tongco Citation2007, Campbell et al. Citation2020). Purposeful sampling was applied to better match the objectives of the research to the sample, thus increasing the rigidity of the study and the reliability of the data and results (Campbell et al. Citation2020).
The case study company was medium-sized and specialised in supplying MEP systems for residential construction projects. Since there were several projects to choose from (e.g. industrial building, hotel building and others), we used purposeful sampling to select a multi-story apartment building located in northern Italy with five apartments on three levels. Two apartments were on the ground floor, two apartments on the first floor, and one apartment on the top floor. The apartment building was chosen for the following reasons: (i) It was of a manageable size, so as not to be too complex nor too large for the practical tests. (ii) The apartments on the ground and the first floor are very similar and therefore suitable for comparing the work processes with and without AR support. (iii) The case study company was responsible for the construction and MEP work consisting of heating, ventilation, sanitary, and electric installations.
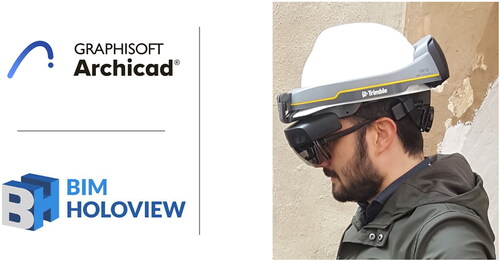
Before the construction began, the suitable work processes were selected to be supported with AR. In agreement with the case study company, it was decided to use AR to support the marking work for the installation of electrical, heating, ventilation, and sanitation pipes in the apartments (). The marking work was chosen to be supported by AR as corrections could easily be made in the case of errors. Usually, this marking work is done using drawings, a tape measure and spray cans to mark where the tubes, pipes, and cables need to be routed and installed. The focus was on comparing the marking activities with and without AR support. A Trimble XR10 safety helmet containing the Microsoft HoloLens II was selected as the AR HMD device. The BIM software Graphisoft Archicad 24 and the AR application BIM Holoview were used to develop and visualise the design information (). The implementation period was from June to September 2020.
Figure 1. Marking work supported by the AR HMD of the UFH (left) and an extract of the AR Hologram (right).
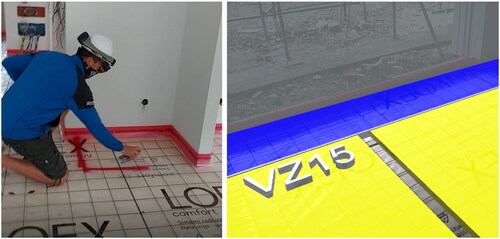
Figure 2. Used BIM software and AR application (left) as well as AR HMD (right).
The following criteria were used to select the case study company participants: (i) in-depth experience of carrying out the selected tasks on-site, (ii) involvement in the project from start to finish, and (iii) a strong affinity with technology. The BIM coordinator (Interviewee 1) and four foremen (Interviewee 2 until Interviewee 5) participated in the case study. Two foremen (Interviewee 3 and 4) were responsible for the heating ventilation and sanitary (HVS) work, another for the electrical installation (Interviewee 5), and one for the underfloor heating (UFH) installation (Interviewee 2). The BIM coordinator (Interviewee 1) was a trained mechanical engineering technician with 11 years of professional experience. Foremen 2–5 were all certified installers with 10 years, 8 years, 20 years, and 12 years of working experience, respectively.
Special attention was also paid to ensure that the foremen responsible for the HVS, UFH and electrical work were not exchanged between the marking work on the ground floor (with the AR HMD) and the marking work on the first floor (conventionally).
The workflow started with the laser scanning of the shell construction of the apartment building. Using the collected data, the architectural BIM model was updated to a BIM model in the “as-built” state of the existing shell. The created as-built BIM model was then loaded into the AR HMD and registered. The required registering was done using two physical QR-markers per construction location. The positioning of the markers was done on straight and not two different walls to avoid potential deviations coming from the construction execution.
The wall openings for heating, ventilation, and electrical lines were then marked. The user performed the marking by looking at the hologram at an angle of 90° in order not to lose accuracy during the marking work. For comparison, the markings for the trenches on the first floor were created conventionally and on the ground floor with the AR HMD. Another laser scan of the installed heating and ventilation ducts and electrical pipes followed. Consequently, the existing as-built BIM model of the shell construction was updated to match the as-built BIM model with the completed MEP work. Again, the as-built BIM model with the finished MEP work was loaded into the AR HMD. Next came the floor markings for the underfloor heating (UFH). The AR HMD displayed the respective construction sections in which the underfloor heating had to be installed. For comparison, the markings for the UFH were carried out conventionally on the first floor and with the AR HMD on the ground floor by the same foreman. It should be noted that the employees considered the assembly of the laid mesh rather than the effective geometry of the projected hologram, resulting in deviations between the design and execution.
Data collection and analysis
Two types of data were collected within the case study: (i) performance data by direct observation and the measurement of KPIs (such as cycle time CT) while the participants performed their assigned tasks, and (ii) perceptual data in the form of semi-structured interviews following DiCicco-Bloom and Crabtree (Citation2006) recommendations.
Specifically, we used the work sampling (WS) method to quantify the labour time utilisation through direct observations of construction labour work (Gong et al. Citation2011). We selected WS because the case study project lasted about 6 months, giving us sufficient time to apply the method. Moreover, the tasks measured on-site had a relatively long cycle time (in the range of several minutes). In addition, the analysed tasks were not highly repetitive, meaning that they also consist of several subtasks which can be stated as another characteristic for the suitability of the WS method (Neve et al. Citation2020). Considering accuracy, only the ACCX and ACCY indicators were measured because the BIM model showed some errors and inconsistencies considering the height of the objects. This is because the company focuses on having high accuracy levels in the x and y axis and intends to leave some freedom for the foremen when installing objects on the z axis (the height of objects). The cycle time (CT) was measured through video recordings of the chosen tasks to ensure the traceability of the recorded values.
The interviews were conducted face-to-face in a semi-structured form and took between 45 and 60 min. After the interviews were completed, the records were transcribed. Verbatim comments have been included in this paper to enrich the description with the real-life experiences of the participants. Compared to structured interviews which use pre-determined questions with fixed wording to ask each respondent the same thing, semi-structured interviews allow for more flexibility in terms of structure, question design, order and wording (Brinkmann Citation2013). They also allow the interviewer to ask for more details, as well as clarification and follow-up questions (Rubin and Rubin Citation2011). Semi-structured interviews rely on an interview guide which includes open-ended questions, cues, and notes for the interviewer to explore the topics and research questions prepared by the researcher (Zainal Citation2007, Brinkmann Citation2013). We applied the semi-structured interview method because it is difficult to formulate the appropriate question-answers precisely in advance and it leaves more space to add new questions during the dialogue based on the flow and information given in the interviews (Robson and McCartan Citation2016). shows the interview protocol that was used as the basis for the semi-structured interviews.
Table 3. Interview protocol.
The validation of the case findings and conclusions were supported by follow-up presentations with company representatives in face-to-face meetings and discussions with three peer academics.
Case study application
In the following section, the application of the AR measurement model presented in section 3 () to answer the RQs in the case study is presented.
RQ1: cycle time (CT)
shows the relative time expenditures when marking the heating, ventilation, sanitary (HVS), underfloor heating (UFH) and electrical work using the AR HMD compared to conventional means.
Figure 3. Relative time effort compared to the traditional method of MEP and UFH work (negative values represent time saved and positive values additional time expenditure).
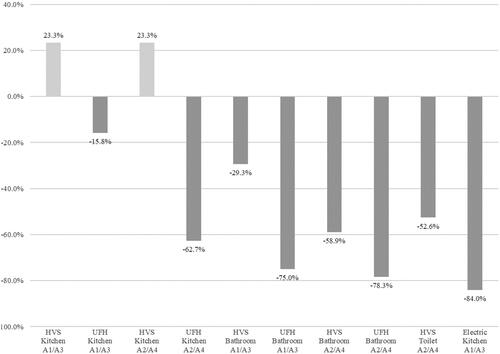
The marking work for the trenches and slots in the eat-in-kitchens took around 37 s with the AR HMD and 30 s with the conventional marking method. On the other hand, the marking of the trenches for the bathrooms in apartment 1 (A1) and apartment 2 (A2) with the AR HMD took 46 and 53 s, respectively, compared to the conventional approach which took 30 and 35 s in A3 and A4, respectively. The marking work using the AR HMD support for the UFH in the eat-in-kitchens A1 and A2 took 48 and 25 s, respectively. The conventional marking work for the UFH in the eat-in-kitchens A3 and A4 took 57 and 67 s, respectively. The marking work with the AR HMD support for the UFH in bathrooms A1 and A2 took 9 and 10 s, respectively. The conventional marking work for the UFH in the bathrooms A3 and A4 took 36 and 46 s, respectively.
The marking work for trenches in the toilet A2 took 83 s with the AR. In A4, it took 175 s using the conventional marking approach. Comparing the results between the conventional marking work on the first floor and the AR HMD on the ground floor gave mixed results. Marking slots with the AR HMD in the eat-in-kitchens took 23% longer (). In contrast, marking the slots in the bathrooms took between 29% and 59% less time compared to the conventional approach (). Depending on the area, a time saving of between 15.8% and 78.3% was achieved when marking the MEP work using the AR HMD. In particular, the electrical work took an average of just 7 min compared to 45 min using traditional methods, a time saving of 84%. In total, a time saving of 18.8% was achieved for the marking of HVS in the eat-in-kitchens, bathrooms, and toilets, and a time saving of 57.9% for the marking of the UFH in the eat-in-kitchens and bathrooms.
RQ1: accuracy X-Y-axis
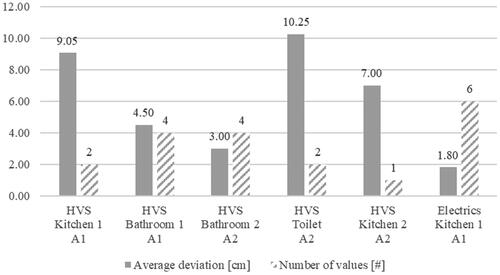
displays the average accuracy of the execution versus the design of the HVS marking work. Here, the indicator ACCXY was measured. Depending on the number of measurements, the accuracy of the marking work for MEP in the eat-in-kitchens ranged from 1.80 cm and 9.05 cm (). Likewise, the marking work for MEP in the bathrooms and toilets showed deviations between 3.00 cm and 10.25 cm. Two measurements showed a deviation of 10.25 cm, and six and four measurements showed deviations of between 1.80 cm and 4.5 cm, respectively (). In summary, it appears that the accuracy increases with the number of measurements for the markings carried out. AR provides the highest accuracy in complex areas where the operator needs to look for up-to-date plans and take many measurements. The accuracy results have an average deviation of 3.47 cm when marking HVS installations and 1.80 cm when marking electrical work.
Figure 4. Average accuracy of the marking HVS compared to the design (bars in dark grey show average accuracy X–Y and bars with scattered grey visualise the number of measurements).
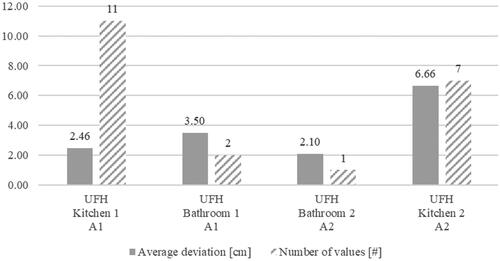
displays the average accuracy compared to the design of the marking work carried out for the UFH installation using the AR HMD. Again, only the ACCXY indicator was measured. The accuracy of the marking work for the UFH in the eat-in-kitchens resulted in 2.46 cm in A1 and 6.66 cm in A2. The accuracy in the bathrooms was 3.5 cm in A1 cm and 2.1 cm in A2 (). In summary, the average accuracy of marking the UFH with the AR HMD was 3.76 cm. From this, it can be concluded that the AR HMD showed an accuracy in the X and Y axes between 2 cm and 4 cm. According to the semi-structured interviews, Interviewee 4 reported that the accuracy level of the AR HMD is insufficient for the bathrooms where a 0.5 cm precision is required. Interviewee 4 observed that “the price-performance ratio is still unclear and questionable.”
Figure 5. Average accuracy of the marking UFH compared to the design (bars in dark grey show the average accuracy X–Y and bars with scattered grey visualise the number of measurements).
RQ1: Usefulness
All interviewees noted that the AR HMD was perceived “to be very useful.” Specifically, the participants stated that “the technology enables my work to be executed with high quality” (Interviewee 2, 4 and 5), that “the technology increases the effectiveness of my work” (Interviewee 3 and 5), and that “the technology increases the efficiency of my work” (Interviewee 2 and 4). In line with the measurement of the C/T indicator, all participants responsible for the construction execution stated and confirmed that “the technology helped me reduce the time it took me to complete my work” (Interviewee 2, 3, 4 and 5).
RQ2: Training
Before starting the marking work, the research team gave the case study participants a brief introduction on how to use the AR HMD in practice. The training had a duration of 15 min. It consisted of a brief explanation of how to wear and position the AR HMD and how to interact with the Microsoft HoloLens. Interviewees 4 and 5 both stated that “there was no extensive training required to use the AR HMD” when supporting the marking work on-site. Thanks to the very intuitive interaction option with the AR HMD (by using gestures), the training content was able to be applied very easily into practice (Interviewees 1, 2 and 3).
RQ2: understanding/action ratio to total time “U/a ratio”
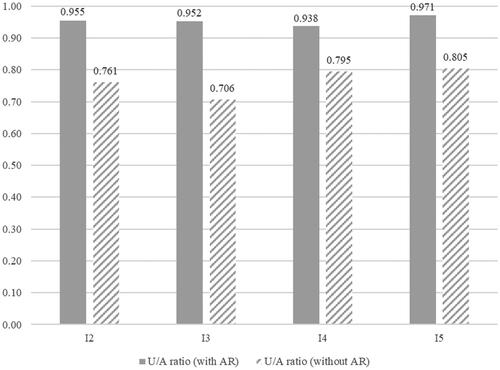
shows the calculated U/A ratio for each foreman (Interviewee 2 until Interviewee 4) who used the AR HMD to support the marking work on-site. The time measurements were extracted from the registered videos of the marking work carried out. Comparing the works with and without AR, the U/A ratio showed a gain of 19.3%, 24.6%, 14.3% and 16.6% for the foremen involved, respectively. Considering the average, a value of 95.4% (with AR) and 76.7% (without AR) of the U/A ratio was calculated, resulting in an average gain of 18.7% for all users. Similarly, Loizeau et al. (Citation2019) achieved an average 14% increase in the U/A ratio, thus supporting AR aeronautical assembly tasks. Reducing the understanding time and increasing the action time confirms that AR adds value by making it easier for the operators to process the necessary instructions.
Figure 6. Comparison of U/A ratio with AR (left) and without AR (right).
RQ3: perceived ease of use
All interview participants confirmed that “the technology was very easy to use” (Interviewees 1, 2, 3, 4 and 5). Most of the participants in the case study liked interacting with gestures using the Microsoft HoloLens 2. Interviewees 1, 2 and 3 reported that “the use of the technology was intuitive.” During the case study, we used an AR-application in the HMD that uses QR-markers to register the digital models. Interviewee 4 tested the registering, and it took 13 s with two QR-markers to register the digital model. Furthermore, he tested two AR applications, one that used QR-markers and one that did not use markers for the registering. Interviewee 4 stated that the AR applications with markers were “appropriate for my work environment as they do not require much time and specific training to be used on-site.” If the registering is done with a marker-free AR application, it is “too difficult and time consuming to learn for a conventional foreman on-site” (Interviewee 4).
RQ3: cognitive workload
All survey participants confirmed that using the AR HMD requires a high level of concentration or in other words, more concentration to perform the marking work on-site than the traditional working method. However, Interviewees 1, 4 and 5 reported that “using the technology does not lead to mental fatigue” especially “when the AR HMD is not used continuously but only for some specific tasks (like marking work on-site).” Similarly, the respondents stated that using the technology “requires more attention” (Interviewees 3,4 and 5) but it “does not interfere with daily work” (Interviewee 2).
RQ3: ergonomics
To assess the ergonomics, the BIM manager decided to also use the AR HMD to support the installation activities which generally take longer than marking work on-site. Here, Interviewee 2 used the AR HMD to install the underfloor heating system in sleeping room 1 of apartment 2. He explained that “a different posture is required to use the technology” and that wearing the AR HMD for a long period of time leads to “increased strain to the neck, which causes pain.” This is mainly caused by the increased weight of the AR HMD. On the other hand, the participants noted that “the helmet was ergonomically designed” and that “the helmet is comfortable to wear” (Interviewees 1, 3, 4 and 5). From this, it can be deduced that the ergonomics should be significantly improved in order to use the AR HMD over a longer time span (Kerr et al. Citation2011).
RQ3: work safety
The survey participants noted that the use of the technology “has an impact on work safety” (Interviewees 1, 2, 3, 4 and 5). Specifically, there is a possible negative influence “due to an impaired field of vision (Interviewee 2)” and “due to increased attention” (Interviewee 5) was also mentioned. Specifically, Interviewee 5 mentioned potential trip hazards (e.g. through cables or pipes) and a risk of the occupants falling (e.g. through unsecured danger areas). These occupational safety risks cannot be recognised by the operator due to the overlaying of digital objects with the physical environment. Interviewee 2 stated that “if the construction operator pays more attention to the hologram, potential danger spots on-site could be overlooked.”
RQ3: attitude towards using
Considering the level of acceptance or in other words the resistance to change, the statements “the technology was very useful” (Interviewees 4 and 5) and “it increases the effectiveness and efficiency of my work” (Interviewees 2 and 3) were recorded. Moreover, it had also been noted that “the technology makes my work easier” (Interviewee 5) and that “the technology helped me reduce the time it takes to get my job done” (Interviewees 2 and 4). However, given the level of quality, not all participants agreed that the AR HMD would bring in benefits. Specifically, Interviewee 2 stated that “the registering is too imprecise” and Interviewee 3 pointed out that “the AR HMD has not helped to reduce errors in surveying and marking work.”
RQ3: behavioural intention to use
Here, Interviewees 4 and 5 noted that “the technology is suitable for my work environment” and Interviewee 3 stated “I like the use of technology in my job.” Along these lines, Interviewee 4 emphasised that “the AR HMD is generally a help for my job” and Interviewee 1 pointed out that “it is generally a helpful solution.” Moreover, the statements “I would use the technology after the test phase” (Interviewees 3, 4 and 5) and “I would recommend the technology to my colleagues” (Interviewees 1 and 2) were also recorded.
Discussion
AR systems have been used and tested mainly in industries like logistics, aeronautics, and the automotive industry (Jetter et al. Citation2018, Khokhlovsky et al. Citation2019, Loizeau et al. Citation2019, Remondino Citation2020). We believe that AR helps to overcome the traditional implementation barriers of VM practices in construction, resulting in performance improvements.
Considering RQ1, the literature reports difficulties when measuring the benefits of VM implementations in construction due to a lack of KPIs and appropriate measurement metrics (Tezel et al. Citation2016a, Citation2017, Tezel and Aziz Citation2017b). Remondino (Citation2020) suggests using managerial KPIs such as time reduction and accuracy improvements to measure the benefits of AR in logistic processes. Jetter et al. (Citation2018) suggest that KPIs should allow for a comparison with conventional working methods and that each AR application should be analysed in detail to identify the most appropriate performance indicators.
In our research, we have empirically validated that AR-supported VM practices result in significant time savings for marking works of MEP construction projects compared to the conventional work approach. On average, about 18% less time was spent on HVS marking work, around 58% less time on UFH marking work, and about 84% less time on electrical marking work. According to the surveyed foremen, AR has the greatest benefit in areas with numerous markings as it saves time when reviewing the plans and undergoing collision control. This has also been reported in the literature by Wang et al. (Citation2020). However, considering the levels of accuracy, the application of AR in our case study did not fully meet all customer requirements. The average deviations of the marking work range between 3.47 cm for HVS, 3.76 cm for the UFH, and 1.80 cm for electrical work. Areas with many objects (such as bathrooms with washbasins, a toilet, bidet, bathtub, shower cabin, etc.) require an accuracy level with a maximum deviation of 0.5 cm. Furthermore, the accuracy of the UFH marking was partially compromised by following the underlying metal grid rather than the AR HMD’s projected hologram (). Future research activities should consider a specific distinction between the accuracy levels of the technology as the surveying technology in use (e.g. laser scanner) in terms of the AR application including its registering functionality (e.g. 2, 3, or 4 markers) and the errors induced directly by the human operator.
The benefits of the AR HMD are also supported by the participants’ subjective perception of “Perceived Usefulness.” The foremen reported a substantial increase in work efficiency and perceived the AR HMD to be easy to use in their work. This is also confirmed by the work of Jetter et al. (Citation2018) who identified a strong correlation between the reduction in time required for assembly tasks, the reduction in errors, and the KPI “Perceived Usefulness.” Based on the case study results, the AR HMD led to measurable benefits in terms of time saving and perceived usefulness. Furthermore, the use of the AR HMD for MEP layout and marking tasks resulted in generally acceptable accuracy values except for certain locations (e.g. bathrooms) where higher accuracy was required by the customer. According to the semi-structured interviews, it should be examined how accuracy can be improved at these locations. However, AR applications in other areas of MEP or construction works may be sufficiently accurate. Considering electrical work, devices are often installed to the nearest stud which may create an additional 2–4 cm deviation that may be tolerable in practice. Therefore, the acceptable level of accuracy depends directly on the activities where AR is applied. Thus, RQ1, asking if the application of AR to support VM practices leads to measurable benefits while performing MEP marking work in construction, could be answered with yes with minor exceptions.
Considering RQ2, we could see in our case study that the AR HMD significantly reduced the time required to train employees. Likewise, Remondino (Citation2020) pointed out that due to its immersive, interactive, and training-by-doing approach, training is one of the main processes that benefit the most from AR. In our case, with minimal training, the participants were able to quickly learn how to navigate and handle the AR HMD on-site for their specific tasks. This is also confirmed by the improved U/A ratio which increased by an average of 18.7% with the AR HMD support. A similar increase in action time and decrease in understanding time was recorded in the studies by Kwiatek et al. (Citation2019) and Loizeau et al. (Citation2019), further reinforcing the positive impact of the AR HMD on user training. The AR HMD was adopted without hesitation due to the intuitive hand gestures used to navigate the superimposed hologram. The participants reported that they were able to apply the training content in practice without any problems and that the operation of the AR technology was perceived to be easy to learn. Similar to the findings of Kwiatek et al. (Citation2019) who analysed the impact of AR and spatial cognition on assembly in construction, we observed that experienced foremen expressed the benefits in terms of the reduced “cognitive workload,” thus supporting the potentially intuitive application of AR HMD in their daily work. In summary, AR reduces the training effort to support marking work of MEP construction projects answering so RQ2.
Considering RQ3, in the literature, Brady et al. (Citation2018b) demonstrated that construction workers have often resisted the adoption of VM tools. Other articles mention the unwillingness of employees to engage in Lean processes as one of the main barriers to the implementation of Lean methods in practice ( Gupta and Jain, Citation2013, Jadhav et al. 2014 , Lodgaard et al. Citation2016, Salonitis and Tsinopoulos Citation2016, Abu et al. Citation2019, ). Regarding the indicator “Perceived Ease of Use,” all interviewees confirmed that the AR technology was “easy to use” and very “intuitive to handle.” However, when considering the registering, the interviewees stated that the use of QR-markers is indispensable for using the AR HMD in daily practice. In addition, the AR HMD was perceived to decrease the “Cognitive Workload.” Here, most of the interviewees indicated that the use of the technology required “a high level of concentration” but at the same time, it “does not impair the daily work activities.” This is in line with the research by Jetter et al. (Citation2018) and Loizeau et al. (Citation2019) who both found that with AR, the cognitive load decreased where the participants were able to concentrate better on the task execution. In terms of ergonomics, the foremen indicated a lack of comfort, especially when the AR HMD was used for an extended period. This is underpinned by the fact that an AR HMD should not be worn all day but only to support specific activities (such as on-site marking tasks). In this direction, we have defined some further indicators to measure the impact of the AR HMD on work safety. Here, most of the participants indicated a potential negative impact on work safety as the field of vision is slightly impaired by the AR HMD. This can lead to tripping hazards on-site. This was also observed by Vorraber et al. (Citation2020) who assessed the use of AR for remote-assisted maintenance in production.
Most of the case study participants reported a positive “Attitude Towards Using” the technology and rated the experience of visualising information via holograms as very positive. The “Behavioural Intention to Use” was also rated highly by the participants which was underpinned by the semi-structured interviews as the respondents recommended the AR HMD to their colleagues. Taking into account RQ3, asking if AR to support marking work of MEP construction projects reduces the resistance to adopting VM practices, the results of the case study paint a mixed picture. A high “Perceived Ease of Use,” a low “Cognitive Workload,” and a high “Behavioural Intention to Use” demonstrate that the application of the AR HMD could help to reduce doubts or scepticism and thus increase acceptance. However, concerns have been registered regarding poor ergonomics and potential occupational safety risks that could negatively impact the acceptance of AR in construction. Therefore, RQ3 could only be partially approved. Summing up, the main contributions of the paper are the following:
It demonstrates, based on a practical case study, how AR technology can help to overcome VM implementation barriers in construction;
It proposes an AR-measurement model (consisting of quantitative and qualitative KPIs) to evaluate the benefits as well as risks of applying AR in construction;
It proposes some practical insights, based on a MEP case study, for improving technological as well as organisational aspects of AR applications in construction.
Implications for practitioners
Practitioners can use our measurement model as a guide for implementing AR in construction, specifically for successfully implementing VM practices within emerging technologies. Moreover, the model can serve as a tool to help quantify the benefits as well as the risks of AR HMDs as support systems for construction operators. There is some advice given to practitioners in terms of defining the AR implementation plans by considering appropriate training efforts. This is as well as the efforts needed when selecting appropriate devices and software applications. This is especially important as AR can be defined as an emerging technology. Additionally, our research points out that the level of accuracy is influenced by the AR HMD device, the AR software application used, and the registering functionality, as well as the human operator. Considering the latter, a key finding of our research is that AR reduces the amount of training required to support construction operators. However, according to our case study results, a minimum level of training is required to successfully put the technology into practice without sacrificing accuracy. Important information for defining the guidelines of operator training can be derived from our research (e.g. the requirements for the use of holograms and the requirements for geo-referencing). To increase the adoption of AR in the construction industry, the proposed measurement model may lead to the faster penetration of AR HMDs.
Research limitations
The following are the research limitations:
Accuracy deviations were calculated by not specifically differentiating between deviations caused by the AR technology, the BIM model as well as those due to the human operator. Moreover, the accuracy of registering the BIM Model in the AR HMD was not specifically measured.
Just the ACCXY accuracy indicators were measured because the BIM model showed some errors and inconsistencies considering the height of the objects. To extend the size of the dataset, future research activities will also consider the ACCZ indicator.
The results of the semi-structured interviews mainly reflect the subjective perceptions of the participants. However, the interviews were carried out individually after completing the tasks, allowing for the recording of the specific perspective of each individual. Therefore, the qualitative results were not biased.
The added value of an AR HMD was demonstrated through the analysis of MEP marking work. The scope should be expanded to consider other construction operations that are suitable to be supported by AR.
The selection of the participants in this case study was based, among other things, on the criterion of “strong affinity for technology.” This includes the capability of participants to use new technologies (e.g. smartphones, smart glasses, personal computers and others). This could have influenced the subjects’ evaluation of AR technology. Thus, future research should investigate if “technology affinity” has an influence on the benefits of using AR to support construction projects.
Further research directions
The following opportunities for developing this line of research further are listed below.
The proposed measurement indicators should be analysed for interdependence. How do the quantitative and qualitative KPIs influence each other? As Stricker et al. (2017) point out, it is crucial to identify and characterise the connections and interdependencies between two or more KPIs. By better assessing the impact of KPIs on performance measurement and user adoption, researchers and practitioners can access the root causes of potential issues and make better decisions when applying AR in its specific construction context. For example, how does shortening the execution time affect the cognitive workload? With increased efficiency, foremen can be responsible for not just one but multiple construction sites, drastically increasing their cognitive workload. In this regard, user interfaces could be developed further which minimise cognitive and physical demands. However, the current literature does not indicate how distinct voice- and/or gesture/touch-based interactions influence attentional resources and musculoskeletal systems in relation to various working conditions (Kim et al. Citation2016). Another example is the impact of training on users’ perceived usefulness. User-oriented and tailored training could help to quickly get familiarised working with AR support, thus increasing satisfaction with the technology.
The AR measurement model developed in this case study should be applied to and empirically validated in other construction fields and trades to better understand the benefits of AR applications in construction. Other suitable application areas, related to our case study, are the use of AR to support the pipe assembly work, electrician work, plumbing work and carpentry work. For example, electrical construction practitioners could use the AR HMD for completing electrical device layout tasks instead of traditional paper documentation (Chalhoub and Ayer Citation2018). Similarly, the AR HMD could be applied for assisting the assembly of pipe spools and plumbing work in the boiler room of the building (Kwiatek et al. Citation2019).
When measuring the accuracy levels of AR, deviations induced by the human operator should not be neglected. These could be for example the not correctly positioning of the QR-markers causing so deviations in the registering process or the not appropriate visualising of the digital objects in the HMD. Therefore, future research activities should consider the human factors (Shin and Dunston Citation2008), specifically the field of human data interaction in the further development of AR systems.
Future technological innovations of AR should consider the integration of real-time data as well as the bi-directional flow of information between physical and digital objects. According to Hou et al. (Citation2017), this scenario could create context-aware learning and execution experiences that lead to more accurate responses and decision-making awareness in real functional settings. Real-time sensor technologies such as RFID, Ultra-Wide Band (UWB) tracking systems, GPS, and motion detectors can identify and synchronise the real location in space. With the help of advanced cameras and software supported by Artificial Intelligence (AI), the real world can be precisely captured, analysed, and compared with the projected model, allowing for the automatic updating of the BIM models, for example. Consequently, context-aware just-in-time information can support the user in making better decisions and helping to reduce potential work safety risks. Based on our case study, the AR-HMD could not only display information to support the execution of tasks, but even control the correct execution of them. As an example, the AR HMD could display where to place electric sockets and after the execution of the task it could immediately control their correct positioning.
Another important future research activity is the appropriate preparation of digital models to be correctly visualised in the AR HMD. Here, the correct level of detail of digital objects should be chosen to display them appropriately in the AR HMD. Kim et al. (Citation2016) suggest understanding how information influences situational awareness of safety risks in various working conditions. They propose preparing information to be visualised in the AR HMD by specifically considering potential work safety risks (e.g. tripping over objects).
In our research, we investigated whether and how AR could overcome the traditional VM implementation barriers in construction. We believe that other emerging technologies have the potential to overcome the traditional implementation barriers of other Lean methods (Schulze and Dallasega Citation2021). An example is the application of AR for the Lean method Andon, which is a visual control device or system to notify management or maintenance staff in case of possible or actual problems (i.e. quality). When integrating Andon and AR, quality control can be carried out promptly with the AR HMD. For example, when installing electrical sockets in the shell the system could identify not correct placements/positionings and warn immediately.
Conclusion
Visual Management (VM) is a fundamental principle of Lean Construction with the aims of increasing the process transparency and the communication between stakeholders, as well as minimising waste and thereby increasing customer value on construction sites. However, its implementation in construction is hindered by several barriers including (1) missing measurement of the benefits, (2) insufficient training of the workforce, and (3) resistance of operators to change their existing working methods and to adopt new ones. Recent research has emphasised that emerging information and communication technologies (ICTs) can facilitate or even replace the existing VM systems on construction sites, but these are still in the early stages of implementation ( Tezel and Aziz Citation2017a). Experiences from other industries such as automotive and aeronautics suggest that AR could bring in measurable benefits to construction as well (Delgado et al. Citation2020b). However, there is currently a lack of empirical evidence based on practical use cases and best-practice projects as well as proof of the return on investment of AR in construction (Liu et al. Citation2018).
Our research empirically answers the research question (RQ) if AR can help to overcome traditional VM implementation barriers in marking work of MEP construction projects. Based on the literature review, three specific RQs were derived: RQ1: Does the application of AR technology to support VM practices result in measurable benefits while performing MEP marking work in construction? RQ2: Does AR technology reduce the training effort to support marking work of MEP construction projects?, RQ3: Does the application of AR to support marking work of MEP construction projects reduce the resistance to adopt VM practices? To answer the RQs, an AR measurement model consisting of Key Performance Indicators (KPIs) to quantify the benefits of AR in construction was developed. It was applied to a case study consisting of a mechanical, electrical, and plumbing (MEP) installation in a multi-story apartment building. An AR Head Mounted Display (HMD) was deployed to support the foremen with their marking work. Empirical evidence was collected using direct on-site observations and semi-structured interviews, leading to the following results. (i) AR can save time and leads to generally satisfactory levels of accuracy with minor exceptions. (ii) AR proved able to reduce the amount of training required to support the MEP marking work in construction projects. (iii) AR reduced the resistance to implement VM practices for MEP marking work, although concerns were raised about poor ergonomics and work safety risks.
Future research activities should consist of investigating the potential interdependencies of KPIs. Here it should be examined if and how KPIs can influence each other. It should be empirically validated whether other emerging technologies have the potential to overcome the traditional implementation barriers of further Lean methods. AR technology should be further developed to not only visualise design information on-site but also to achieve a bi-directional flow of information between the physical building to be erected and its digital model. These technological developments should also specifically consider aspects of human data interaction to minimise potential negative impacts on accuracy by the human operators.
Acknowledgments
The authors thank the Department of Innovation, Research, University and Museums of the Autonomous Province of Bozen/Bolzano for covering the Open Access publication costs. The authors would also like to thank the involved company Mader GmbH for its valuable contribution to the research.
Disclosure statement
No potential conflict of interest was reported by the author(s).
References
- Abdelkhalek, E.S., et al., 2019. Analysis of visual management practices for construction safety. In: 27th Annual Conference of the International Group for Lean Construction. IGLC, 1069–1080. https://doi.org/10.24928/2019/0175
- Abu, F., et al., 2019. The implementation of lean manufacturing in the furniture industry: a review and analysis on the motives, barriers, challenges, and the applications. Journal of cleaner production, 234, 660–680. https://doi.org/10.1016/j.jclepro.2019.06.279
- Aromaa, S., et al., 2018. Human factors and ergonomics evaluation of a tablet based augmented reality system in maintenance work. In: ACM International Conference Proceeding Series, 118–125. https://doi.org/10.1145/3275116.3275125
- Aslam, M., Gao, Z., and Smith, G., 2020. Exploring factors for implementing lean construction for rapid initial successes in construction. Journal of cleaner production, 277, 123295. https://doi.org/10.1016/j.jclepro.2020.123295
- Aziz, R.F., and Hafez, S.M., 2013. Applying lean thinking in construction and performance improvement. Alexandria engineering journal, 52 (4), 679–695. https://doi.org/10.1016/j.aej.2013.04.008
- Babalola, O., Ibem, E.O., and Ezema, I.C., 2019. Implementation of lean practices in the construction industry: a systematic review. Building and environment, 148, 34–43. https://doi.org/10.1016/j.buildenv.2018.10.051
- Ballard, G., 2000. The last planner system of production control. Ph.D. Thesis. University of Birmingham.
- Bandara, D.G.B.S., Sandanayake, Y.G., and Ekanayake, B.J. 2018. Application of value engineering concept to MEP works in Sri Lankan construction industry: a case study. In: The Tenth International Conference on Construction in the 21st Century (CITC-10). Springer, 9.
- Basu, P., and Dan, P.K., 2020. A comprehensive study of manifests in lean manufacturing implementation and framing an administering model. International journal of lean six sigma, 11, 797–820. https://doi.org/10.1108/IJLSS-11-2017-0131
- Brady, D.A., et al., 2018. Improving transparency in construction management: a visual planning and control model. Engineering, construction and architectural management, 25 (10), 1277–1297. https://doi.org/10.1108/ECAM-07-2017-0122
- Braglia, M., Dallasega, P., and Marrazzini, L., 2020. Overall Construction Productivity: a new lean metric to identify construction losses and analyse their causes in Engineer-to-Order construction supply chains. Production planning and control, 1 (1), 1–18. https://doi.org/10.1080/09537287.2020.1837931
- Brandalise, F. M. P., Valente, C. P., Viana, D. D., and Formoso, C. T. 2018. Understanding the effectiveness of visual management best practices in construction sites. In: González, VA, ed. IGLC 2018 - Proceedings of the 26th Annual Conference of the International Group for Lean Construction: Evolving Lean Construction Towards Mature Production Management Across Cultures and Frontiers, 2. Chennai, India, 754–763. https://doi.org/10.24928/2018/0452
- Brinkmann, S., 2013. Qualitative interviewing. Oxford, UK: Oxford University Press.
- Bryde, D.J., and Schulmeister, R., 2012. Applying Lean principles to a building refurbishment project: experiences of key stakeholders. Construction management and economics, 30 (9), 777–794.
- Campbell, S., et al., 2020. Purposive sampling: complex or simple? Research case examples. Journal of research in nursing, 25 (8), 652–661. https://doi.org/10.1177/1744987120927206
- Carozza, L., Bosché, F., and Abdel-Wahab, M. 2013. Image-based localization for an indoor VR/AR construction training system. In: Proceedings of the 13th International Conference on Construction Applications of Virtual Reality (CONVR), October, London, 363–372. https://web.sbe.hw.ac.uk/fbosche/publications/conference/Carozza-2013-CONVR.pdf
- Chalhoub, J., and Ayer, S.K., 2018. Using Mixed Reality for electrical construction design communication. Automation in construction, 86 (May 2017), 1–10. https://doi.org/10.1016/j.autcon.2017.10.028
- Chen, Y.J., Feng, C.W., and Lee, K.W., 2012. The application of BIM Model in MEP construction coordination. Applied mechanics and materials, 188 (1), 236–241.
- Chen, Y.J., Lai, Y.S., and Lin, Y.H., 2020. BIM-based augmented reality inspection and maintenance of fire safety equipment. Automation in construction, 110, 103041. https://doi.org/10.1016/j.autcon.2019.103041
- Cherrafi, A., et al., 2017. Barriers in green lean implementation: a combined systematic literature review and interpretive structural modelling approach. Production planning and control, 28 (10), 829–842. https://doi.org/10.1080/09537287.2017.1324184
- Chuah, S.H.W., 2019. Wearable XR-technology: literature review, conceptual framework and future research directions. International journal of technology marketing, 13 (3–4), 205–259. https://doi.org/10.1504/IJTMKT.2019.104586
- Construction Industry Institute, 2005. Lean principles in construction. Research summary. https://www.construction-institute.org/resources/knowledgebase/knowledge-areas/general-cii-information/topics/rt-191
- Dave, B., et al., 2013. Implementing lean in construction: lean construction and BIM. CIRIA Guide C725. https://eprints.qut.edu.au/71034/1/71034.pdf
- Davis, F.D., 1989. Perceived usefulness, perceived ease of use, and user acceptance of information technology. MIS Quarterly, 13 (3), 319–340. https://doi.org/10.5962/bhl.title.33621
- Davis, F. D., 1985. A technology acceptance model for empirically testing new end-user information systems: theory and results. Thesis (PhD). Massachusetts Institute of Technology.
- Delgado, J.M.D., et al., 2020a. A research agenda for augmented and virtual reality in architecture, engineering and construction. Advanced Engineering Informatics, 45, 101122. https://doi.org/10.1016/j.aei.2020.101122
- Delgado, J.M., et al., 2020. Augmented and virtual reality in construction: drivers and limitations for industry adoption. Journal of construction engineering and management, 146 (7), 04020079. https://doi.org/10.1061/(asce)co.1943-7862.0001844
- DiCicco-Bloom, B., and Crabtree, B.F., 2006. The qualitative research interview. Medical education, 40 (4), 314–321. https://doi.org/10.1111/j.1365-2929.2006.02418.x
- Dora, M., Kumar, M., and Gellynck, X., 2016. Determinants and barriers to lean implementation in food-processing SMEs - a multiple case analysis. Production planning and control, 27 (1), 1–23. https://doi.org/10.1080/09537287.2015.1050477
- Edirisinghe, R., and Lingard, H., 2016. Exploring the potential for the use of video to communicate safety information to construction workers: case studies of organizational use*. Construction management and economics, 34 (6), 366–376. https://doi.org/10.1080/01446193.2016.1200736
- Eisenhardt, K.M., 1989. Making fast strategic decisions in high-velocity environments. Academy of Management Journal, 32 (3), 543–576. 10.2307/256434
- El Ammari, K., and Hammad, A., 2019. Remote interactive collaboration in facilities management using BIM-based mixed reality. Automation in construction, 107, 102940. https://doi.org/10.1016/j.autcon.2019.102940
- Erthal, A., and Marques, L., 2018. National culture and organisational culture in lean organisations: a systematic review. Production planning and control, 29 (8), 668–687. https://doi.org/10.1080/09537287.2018.1455233
- Formoso, C.T., Santos, A. d., and Powell, J.A., 2002. An exploratory study on the applicability of process transparency in construction sites. Journal of construction research, 3 (1), 35–54.
- Frutos-Pascual, M., Creed, C., and Williams, I., 2019. Head mounted display interaction evaluation: manipulating virtual objects in augmented reality. In: Lecture notes in computer science (including subseries lecture notes in artificial intelligence and lecture notes in bioinformatics), 11749 LNCS, 287–308. https://doi.org/10.1007/978-3-030-29390-1_16
- Galsworth, G. D., 1997. Visual systems: harnessing the power of the visual workplace. New York: American Management Association, 320.
- Gong, J., Borcherding, J.D., and Caldas, C.H., 2011. Effectiveness of craft time utilization in construction projects. Construction management and economics, 29 (7), 737–751.
- Gupta, S., and Jain, S.K., 2013. A literature review of lean manufacturing. International Journal of Management Science and Engineering Management, 8 (4), 241–249.
- Gurevich, U., and Sacks, R., 2014. Examination of the effects of a KanBIM production control system on subcontractors' task selections in interior works. Automation in Construction, 37, 81–87. 10.1016/j.autcon.2013.10.003
- Hee, C.H.S., and Ling, F.Y.Y., 2011. Strategies for reducing employee turnover and increasing retention rates of quantity surveyors. Construction management and economics, 29 (10), 1059–1072. https://doi.org/10.1080/01446193.2011.637569
- Hou, L., et al., 2017. A framework of innovative learning for skill development in complex operational tasks. Automation in construction, 83, 29–40. https://doi.org/10.1016/j.autcon.2017.07.001
- Jackson, C.M., Chow, S., and Leitch, R.A., 1997. Toward an understanding of the behavioral intention to use an information system. Decision sciences, 28 (2), 357–389.
- Jadhav, J.R., Mantha, S.S., and Rane, S.B., 2014. Exploring barriers in lean implementation. International Journal of Lean Six Sigma, 5 (2), 122–148.
- Jasche, F., Hofmann, S., and Ludwig, T. 2021. Comparison of diferent types of augmented reality visualizations for instructions. In: Conference on Human Factors in Computing Systems - Proceedings. New York: Association for Computing Machinery. https://doi.org/10.1145/3411764.3445724
- Jetter, J., Eimecke, J., and Rese, A., 2018. Augmented reality tools for industrial applications: what are potential key performance indicators and who benefits? Computers in Human Behavior, 87, 18–33. https://doi.org/10.1016/j.chb.2018.04.054
- Johari, S., and Jha, K.N., 2021. Learning curve models for construction workers. Journal of Management in Engineering, 37 (5), 04021042. https://doi.org/10.1061/(asce)me.1943-5479.0000941
- Kerr, S. J., et al., 2011. Wearable mobile augmented reality: evaluating outdoor user experience. In: Proceedings of the 10th International Conference on Virtual Reality Continuum and Its Applications in Industry, New York: Association for Computing Machinery, 209–216.
- Khanzode, A., 2010. An integrated, virtual design and construction and lean (IVL) method for coordination of MEP. Unpublished Technical Report, Stanford University 187.
- Khokhlovsky, V. N., et al., 2019. Modernisation of a control cabinet production process using multicriteria optimization logic and augmented reality. Annals of DAAAM and proceedings of the international DAAAM symposium, 30(1), 500–507. https://doi.org/10.2507/30th.daaam.proceedings.067
- Kim, S., Tech, V., and Forest, W., 2016. Augmented reality “smart glasses” in the workplace : industry perspectives and challenges for worker safety and health. IIE transactions on occupational ergonomics and human factors, 4 (4), 253–258. https://doi.org/10.1080/21577323.2016.1214635
- Knaepen, K., et al., 2015. Psychophysiological response to cognitive workload during symmetrical, asymmetrical and dual-task walking. Human movement science, 40, 248–263.
- Kuo, C., Jeng, T., and Yang, I., 2013. An invisible head marker tracking system for indoor mobile augmented reality. Automation in construction, 33, 104–115. https://doi.org/10.1016/j.autcon.2012.09.011
- Kwiatek, C., et al., 2019. Impact of augmented reality and spatial cognition on assembly in construction. Automation in construction, 108 (November). https://doi.org/10.1016/j.autcon.2019.102935
- Li, X., et al., 2018. A critical review of virtual and augmented reality (VR/AR) applications in construction safety. Automation in construction, 86, 150–162. https://doi.org/10.1016/j.autcon.2017.11.003
- Liker, J.K., and Morgan, J.M., 2006. The Toyota way in services: the case of lean product development. Academy of management perspectives, 20 (2), 5–20.
- Liu, D., Lu, W., and Niu, Y., 2018. Extended technology-acceptance model to make smart construction systems successful. Journal of construction engineering and management, 144 (6), 04018035. https://doi.org/10.1061/(asce)co.1943-7862.0001487
- Lodgaard, E., et al., 2016. Barriers to lean implementation: perceptions of top managers, middle managers and workers. Engineering, construction and architectural management, 57 (2), 159–167. https://doi.org/10.1016/j.procir.2016.11.033
- Loizeau, Q., et al., 2019. Evaluating added value of augmented reality to assist aeronautical maintenance workers—experimentation on on-field use case. Lecture notes in computer science, 11883, 151–169.
- Luarn, P., and Lin, H.H., 2005. Toward an understanding of the behavioral intention to use mobile banking. Computers in human behavior, 21 (6), 873–891. https://doi.org/10.1016/j.chb.2004.03.003
- Lundberg, O., Nylén, D., and Sandberg, J., 2021. Unpacking construction site digitalization: the role of incongruence and inconsistency in technological frames. Construction management and economics, 1–16. https://doi.org/10.1080/01446193.2021.1980896
- Mano, A.P., Gouvea da Costa, S.E., and Pinheiro de Lima, E., 2020. Criticality assessment of the barriers to Lean Construction. International journal of productivity and performance management, 70 (1), 65–86. https://doi.org/10.1108/IJPPM-11-2018-0413
- Marodin, A.G., and Saurin, T.A., 2014. Managing barriers to lean production implementation: context matters. International journal of production research, 53 (13), 3947–3962. https://doi.org/10.1080/00207543.2014.980454
- Moore, F.H., and Gheisari, M., 2019. A review of virtual and mixed reality applications in construction safety literature. Safety, 5 (3), 1–16. https://doi.org/10.3390/safety5030051
- Neve, H., et al., 2020. Learning to see value-adding and non-value-adding work time in renovation production systems. Production planning & control, 33 (8), 1–13.
- Palinkas, L.A., et al., 2015. Purposeful sampling for qualitative data collection and analysis in mixed method implementation research. Administration and policy in mental health and mental health services research, 42 (15), 533–544.
- Praveena, K., and Thomas, S., 2014. Continuance intention to use Facebook: A study of perceived enjoyment and TAM. Bonfring International Journal of Industrial Engineering and Management Science, 4 (1), 24–29.
- Ratajczak, J., Riedl, M., and Matt, D.T., 2019. BIM-based and AR application combined with location-based management system for the improvement of the construction performance. Buildings, 9 (5), 118. https://doi.org/10.3390/buildings9050118
- Remondino, M., 2020. Augmented reality in logistics: qualitative analysis for a managerial perspective. International journal of logistics systems and management, 36 (1), 1–5. https://doi.org/10.1504/IJLSM.2020.107218
- Robson, C., and McCartan, K., 2016. Real world research. Chichester: John Wiley & Sons Ltd.
- Rubin, H. J., and Rubin, I. S., 2011. Qualitative interviewing: the art of hearing data. Thousand Oaks, CA: Sage Publications Ltd.
- Sahu, A.K., Padhy, R.K., and Dhir, A., 2021. Determinants and barriers of implementing lean manufacturing practices in MSMEs : a behavioural reasoning theory perspective. Production Planning and Control, 33 (12), 1–16. https://doi.org/10.1080/09537287.2020.1857449
- Salonitis, K., and Tsinopoulos, C., 2016. Drivers and barriers of lean implementation in the Greek manufacturing sector. Procedia CIRP, 57, 189–194. https://doi.org/10.1016/j.procir.2016.11.033
- Schulze, F., and Dallasega, P., 2020. Industry 4.0 concepts and lean methods mitigating traditional losses in engineer-to-order manufacturing with subsequent assembly on-site : a framework. Procedia Manufacturing, 51, 1363–1370. https://doi.org/10.1016/j.promfg.2020.10.190
- Schulze, F., and Dallasega, P., 2021. Barriers to lean implementation in engineer-to-order manufacturing with subsequent assembly on-site: state of the art and future directions. Production Planning and Control. https://doi.org/10.1080/09537287.2021.1888159
- Shin, D.H., and Dunston, P.S., 2008. Identification of application areas for Augmented Reality in industrial construction based on technology suitability. Automation in Construction, 17 (7), 882–894.
- Singh, S., and Kumar, K., 2021. A study of lean construction and visual management tools through cluster analysis. Ain Shams Engineering Journal, 12 (1), 1153–1162. https://doi.org/10.1016/j.asej.2020.04.019
- Stricker, N., Micali, M., Dornfeld, D., Lanza, G., Considering interdependencies of KPIs–possible resource efficiency and effectiveness improvements. Procedia Manufacturing, 2017.
- Tezel, A., and Aziz, Z. 2015. Visual controls at the workface of road construction and maintenance: preliminary report. Salford, UK: University of Salford. http://eprints.hud.ac.uk/id/eprint/29093/
- Tezel, A., et al., 2015. Visual management in Brazilian construction companies: taxonomy and guidelines for implementation. Journal of Management in Engineering, 31 (6), 1–18. https://doi.org/10.1061/(ASCE)ME.1943-5479.0000354
- Tezel, A., et al., 2016a. Visual management condition in highways construction projects in England. In: Poceedings of the 24th Annual Conference of the International Group for Lean Construction. Boston, MA: IGLC,133–142.
- Tezel, A., Koskela, L., and Tzortzopoulos, P., 2016b. Visual management in production management: a literature synthesis. Journal of manufacturing technology management, 27 (6), 766–799. https://doi.org/10.1108/JMTM-08-2015-0071
- Tezel, A., and Aziz, Z., 2017a. From conventional to it based visual management: a conceptual discussion for lean construction. Journal of information technology in construction, 22, 220–246.
- Tezel, A., and Aziz, Z., 2017b. Visual management in highways construction and maintenance in England. Engineering, construction and architectural management, 24 (3), 486–513. https://doi.org/10.1108/ECAM-02-2016-0052
- Tezel, A., Koskela, L., and Aziz, Z., 2017. Lean thinking in the highways construction sector: motivation, implementation and barriers. Production planning and control, 29 (3), 247–269. https://doi.org/10.1080/09537287.2017.1412522
- Tezel, A., et al., 2020. Lean construction and BIM in small and medium-sized enterprises (SMEs) in construction: a systematic literature review. Canadian Journal of Civil Engineering, 47 (2), 186–201. https://doi.org/10.1139/cjce-2018-0408
- Tjell, J., and Bosch-Sijtsema, P.M., 2015. Visual management in mid-sized construction design projects. Procedia economics and finance, 21 (2014), 193–200. https://doi.org/10.1016/s2212-5671(15)00167-7
- Tongco, M.D.C., 2007. Purposive sampling as a tool for informant selection. Ethnobotany research and applications, 5, 147–158.
- Valente, C.P., Brandalise, F.M.P., and Formoso, C.T., 2019. Model for devising visual management systems on construction sites. Journal of construction engineering and management, 145 (2). https://doi.org/10.1061/(ASCE)CO.1943-7862.0001596
- Venkatesh, V., 2000. Determinants of perceived ease of use: integrating perceived behavioral control, computer anxiety and enjoyment into the technology acceptance model. Information systems research, 11 (4), 342–365.
- Verbano, C., Crema, M., and Nicosia, F., 2017. Visual management system to improve care planning and controlling: the case of intensive care unit. Production planning and control, 28 (15), 1212–1222. https://doi.org/10.1080/09537287.2017.1358830
- Viana, D., et al., 2014. The role of visual management in collaborative integrated planning and control for engineer-to-order building systems. In: 22nd Annual Conference of the International Group for Lean Construction: Understanding and Improving Project Based Production, IGLC 2014. Oslo, Norway: IGLC and Akademika forlag, 775–786.
- Vorraber, W., et al., 2020. Assessing augmented reality in production: remote-assisted maintenance with HoloLens. Procedia CIRP, 88, 139–144. https://doi.org/10.1016/j.procir.2020.05.025
- Voskamp, J., and Urban, B. 2009. Measuring cognitive workload in non-military scenarios criteria for sensor technologies. In: International Conference on Foundations of Augmented Cognition. Berlin: Springer-Verlag, 204–310.
- Wang, X., et al., 2013a. Augmented reality in built environment: classification and implications for future research. Automation in Construction, 32, 1–13. https://doi.org/10.1016/j.autcon.2012.11.021
- Wang, X., et al., 2013b. A conceptual framework for integrating building information modeling with augmented reality. Automation in Construction, 34, 37–44. https://doi.org/10.1016/j.autcon.2012.10.012
- Wang, W., et al., 2020. Application of augmented reality (AR) technologies in inhouse logistics. In: E3S Web of Conferences. Les Ulis, France: EDP Sciences, 145. https://doi.org/10.1051/e3sconf/202014502018
- Williams, G., et al., 2015. BIM2MAR: an efficient BIM translation to mobile augmented reality applications. Journal of Management in Engineering, 31 (1), A4014009. https://doi.org/10.1061/(asce)me.1943-5479.0000315
- Wolf, M., Teizer, J., and Ruse, J.-H. 2019. Case study on mobile virtual reality construction training. In: Proceedings of the International Symposium on Automation and Robotics in Construction, ISARC, 36. IAARC Publications, 1231–1237.
- Wong, K.T., 2013. Understanding student teachers’ behavioural intention to use technology: Technology Acceptance Model (TAM) validation and testing. Online Submission, 6 (1), 89–104.
- Yin, R.K., 1992. The case study method as a tool for doing evaluation. Current Sociology, 40 (1), 121–137. https://doi.org/10.1177/001139292040001009
- Yin, R. K., 2009. Case study research: design and methods. 5th ed. Thousand Oaks, CA: Sage Publications Ltd.
- Yin, R. K., 2011. Applications of case study research. 3rd ed. Thousand Oaks, CA: Sage Publications Ltd.
- Zainal, Z., 2007. Case study as a research method. Jurnal Kemanusiaan, 5 (1), 1–6.