
Abstract
The importance of renovations is widely recognized, for example, due to renovation backlogs in the developed countries. The urbanization megatrend, among many other factors, is still increasing the need for renovations in the long run. One approach to review the renovation issue is the profitability of the companies that will tackle the increasing demand in the sector. By applying mainly quantitative methods, using the 15-year timeframe (2005–2019) and earnings before interest, taxes, depreciation, and amortization (EBITDA) and return on assets (ROA) as measures, this study reviewed the profitability of the building renovation (BR) companies from two perspectives: how does focusing on certain special services (specialized BR) fare compared to focusing on a wide range of services (wide BR) and what are the profitability differences among specialized BR companies? The results show that, when reviewing the research timeframe in total, there are no differences in profitability between wide BR and specialized BR companies. However, an annual review reveals that specialized BR companies are profitability-wise more vulnerable to economic cycles. Among the specialized BR companies, there are several differences in profitability; classically, specialization in a niche market with a deliberate customer base and low competition level is gainful. The research provides new information about an unresearched area encouraging companies to re-think their strategic choices considering service specialization and performance.
Introduction
Recent discussions about companies’ performance have expanded from profitability to broader measurements, such as ESG (environmental, social and governance) performance indicators (Deng and Cheng Citation2019, Ajibike et al. Citation2021). However, it is important to notice that profitable business is often a key factor enabling the progress also in these broader performance indicators (Kravatzky and Stephens Citation2021). Thus, the importance of profitability should not be ignored in general (Geamănu Citation2011) and not least in the construction industry; the industry is known for tight competition, risky projects and thin margins (Bilal et al. Citation2019). The same features and need for profitability improvements extend to an important part of the construction industry – the building renovation business (Shehu et al. Citation2014, Rajala et al. Citation2022).
Building renovation (BR) is defined to comprise all repair works, maintenance and improvements to existing buildings (Jensen and Maslesa Citation2015). The significance of the BR business has increased in recent decades, especially in the developed countries, where aging dwelling stocks, maintenance backlog and the need to reduce CO2 emissions via energy-efficiency renovations have boosted the sector (Jensen and Maslesa Citation2015, Jonsson et al. Citation2017, Finnish Association of Civil Engineers RIL Citation2019). In addition, the urbanization megatrend is raising the dwelling stock all over the world (Aslam et al. Citation2020) and the renovation sector’s importance will increase in the long run. To be able to respond to these renovation needs we need BR companies. We must have companies who, for example, improve the energy efficiency of existing buildings and renovate leaking roofs. This need for BR companies is where profitability plays an important role – it is a requirement for companies’ business continuity (Geamănu Citation2011).
Profitability is described by Geamănu (Citation2011) as follows: Profit, as one element of profitability, is an absolute measure and is usually defined as the difference between revenue and cost. Relative profitability, as another element of profitability, strongly interests investors and other stakeholders by describing a company’s capability to create a return on investment. As profitability is a comprehensive concept, there are diverse researched factors that influence it in the construction industry; competition environment (Sanders and Cooper Citation1991), strategy formulation (Li and Ling Citation2012), contract forms (Teng et al. Citation2017) and project management (Arslan and Kivrak Citation2008) – to name but a few. Recent research has approached profitability and the construction industry from perspectives like value chains (Nagarkar and Gore Citation2020), ESG (Pero et al. Citation2017, Ajibike et al. Citation2021) and digitalization (Kavuri et al. Citation2020). In digitalization, especially various data-driven methods to ease project selection from the profitability perspective have been on display (Kasprowicz et al. Citation2022). In addition, intangible resources, such as client trust and experience of employees, have been researched lately (Asamoah et al. Citation2020).
Through the ages, one profitability related factor across industry boundaries has been the level of companies’ service specialization (Porter Citation1985, Alam and Islam Citation2017). Such, quite a traditional, perspective is seen as appropriate to approach an unresearched topic that this study covers – the profitability of BR business companies (Vainio Citation2011, Henn and Hoffman Citation2013). Hence this research examines what kind of an effect specialization in services has on profitability in the BR sector. Specialization is a good example of a strategic choice that is considered as especially important in turbulent times (Mankins and Gottfredson Citation2022). This is very topical at the time of this research: in the past years, we have lived in exceptionally turbulent times due to the Covid-19 pandemic and the Russian invasion of Ukraine in 2022 with their consequences. The consequences, such as inflationary pressures and raw material and labour shortages, have negative effects on the profitability of BR companies (Singh et al. Citation2014, Bilal et al. Citation2019, Rani et al. Citation2022), and for sure, various specializations have their own strengths and weaknesses regarding various consequences.
In this study, the profitability of the companies is first reviewed by comparing profitability differences between companies that are focused on only certain services (specialized BR) and companies that offer a wide range of services (wide BR). Secondly, profitability differences are examined more precisely among the specialized BR companies by evaluating various specialized services. The research data covers 15 years and is based on Finnish BR companies. Earnings before interest, taxes, depreciation, and amortization (EBITDA) and return on assets (ROA) are the chosen measures describing the companies’ profitability. The aim of the research is to encourage BR companies to re-think their strategic choices considering service specialization and performance by utilizing the deepened profitability information this research offers. The study answers the following research questions:
How do specialized BR companies fare compared to wide BR companies in terms of profitability?
What are the profitability differences among specialized BR companies?
After the introduction, the research is organized as follows. The literature review presents characteristics about service specialization and how it is approached in the context of profitability and the construction industry in the academic sphere. The research design includes details about the research data and methodology. The findings and discussion are divided into two separate sections: one broad and another deeper approach to the topic. The last section deals with conclusions, limitations of the research and implications for future research.
Literature review
Characteristics of service specialization
Before delving into specialization and profitability, let us briefly review the service concept in general and show how we approach the concept. The often-applied definition in academic research has been service offering (Rabetino et al. Citation2015). Service offering is stated to include various elements and it is acknowledged to be strongly related also to marketing and customer relationships (Storey and Easingwood Citation1998, Den Hertog et al. Citation2010). However, this study focuses on the core parts of service offering: products and services – the elements that customers acquire from the service provider (Storey and Easingwood Citation1998). In the construction industry, the products and services typically cover (1) building types and (2) work types (Sanders and Cooper Citation1991, Toszewska-Czerniej Citation2018). In this study, for specialization in one or both of these types, we use the term service specialization. It is good to note that building types, in many cases, also cover the customers. For example, in pipe renovations of apartment buildings, the owners of the apartments invariably are the customers (Ministry of the Environment Citation2013). The characteristics of the chosen service specialization elements are broadly based on the scientific literature that we present next. The literature is focused on specialization and profitability at strategy level across industry boundaries.
From the specialization and profitability perspectives, Porter presented similar elements of specialization as in this study already in 1985. In his publication about the focus strategy and its differentiation perspective, Porter stated that focusing on only a few markets, services or customers with special needs to fulfil and less competition compared to broader markets can lead to better profitability compared to rivals. The focus strategy is one of Porter’s generic competitive strategies defined to aid companies to face the competitive forces that Porter presented earlier in 1979.
Even though Porter’s competitive strategies are well-known and proven, the strategies have also been criticised (Viltard Citation2017). Perhaps it is due to the criticism that various hybrid models related to companies’ performance and profitability have since evolved from traditional strategies, like Porter’s (Alnoor et al. Citation2022). One of the newest strategies in this genre is Blue Ocean Strategy (BOS), created by Kim and Mauborgne (Citation2015). BOS presents that, to be able to achieve competitive advantage, companies should not respond to competition but find and develop new markets where they do not need to compete that much. New markets can be found, for example, by doing business in a totally new way, such as creating a new service based on customer needs or focusing on a core competence.
A business model concept is another approach to achieve competitive advantage. The concept has been on display in academic research for the past 25 years (Nielsen et al. Citation2018). Naturally, the concept has developed during the years, but the basic idea has remained the same: the model describes how a company generates and captures value (Pekuri et al. Citation2013, Lanzolla and Markides Citation2021). The business model has established its place also in terms of innovations; the term business model innovation can be seen related to service specialization since the term is defined as the process to discover new ways of doing business by re-evaluating value creation and capturing in a company (Bashir and Verma Citation2017).
Profitability and service specialization in the construction industry
The extent of service specialization is a typical choice to be done when companies in the construction industry evaluate their strategy, and it sheds light on how, for example, economies of scale and other specialization-related factors show up in terms of profitability (Arslan and Kivrak Citation2008, Ariffin et al. Citation2016). Still, profitability and specialization in services seem to have gotten only limited attention in the academic research focused on the construction industry (Pekuri Citation2015).
To be able to find the most relevant publications regarding profitability and service specialization in the construction industry, we used the semi-systematic review. The method can be used to map the field of the research, and it is particularly useful for detecting different themes, general issues, perspectives and components within a specific field of research (Snyder Citation2019). The method was chosen since we considered it accurate enough to extract themes related to profitability and specialization. The accuracy level of more precise methods, such as a systematic review (Snyder Citation2019), was not considered necessary.
In practice, we carried out the semi-systematic review as follows: (1) Google Scholar was used as a web search engine to find academic literature across an array of databases and publishing formats, (2) the keywords, such as “profitability”, “renovation”, “construction industry”, “specialization” and “service”, were searched, (3) relevant studies were identified and selected, and (4) content analysis was used for analysing the publications. presents – from history to recent years – the publications found in the semi-systematic review. The chosen publications were seen as the most relevant for our research.
Table 1. Publications about specialization’s effects on profitability in the construction industry.
Even though the publications have in many ways had a similar approach to research specialization as our study, we did not discover publications that – like our study – focused systematically on the effects of specialization on profitability in the BR sector. Only Bilal et al. (Citation2019) partially delved into the BR sector when they compared profitability between new construction and the BR sector. Their finding regarding the sector comparison was that, due to the limited design flexibility and demolition issues, the BR sector is less profitable compared to the new construction sector. Similar to our study, the authors also assessed the sectors more in detail by reviewing various work types. In terms of the BR sector, they used a division into maintenance and refurbishment. In their findings, Bilal et al. interestingly detected that maintenance actually had the best profit margins in the total evaluation including the three sub-work types of new construction. However, refurbishment had the second lowest profit margins. Unfortunately, the reasons for the observations were not given and a more detailed breakdown was not made. In addition, the research focused more on the evaluation of projects than on the companies, while the focus in our study is at the company level.
Overall, the publications in have mainly focused on specialization in the construction industry in general. The publications of Kale and Arditi (Citation2002), Sanders and Cooper (Citation1991), Mohamad et al. (Citation2013), Arslan and Kivrak (Citation2008) and Li and Ling (Citation2012) all had the general perspective. With the general perspective, we mean that the construction industry is researched as a whole including, for example, new building construction, the BR sector and the infrastructure sector – or the publications did not specify the sector at all.
Akintoye and Skitmore (Citation1991) were the only ones who, similar to the firstly introduced study of Bilal et al., reviewed the construction industry from the perspective of various sectors. The sectors were house building, building and civil engineering works and construction-related work. Considering the specialization perspective, there is variation between the studies; Mohamad et al., Arslan and Kivrak and Li and Ling, for example, reviewed both service and customer specialization. Kale and Arditi focused only on service specialization, and Sanders and Cooper focused on specialization in types of works via the end use of the built facilities (can also be seen as building types as in our research). The way the reviewed studies have approached profitability has generally been through absolute measures of profitability, such as profit margin, as Bilal et al. and Akintoye and Skitmore. The strength in our study is that we include both absolute (EBITDA) and relative (ROA) profitability measures in the analyses.
Although most of the studies do not deal with the BR sector, they provide many interesting observations about the effects of specialization on profitability in the construction industry. Thus, the studies have a clear connection to our study. One observation is that offering a large scale of services seems to be more profitable compared to service specialization where a company has a narrow service offering. For example, Kale and Arditi (Citation2002) stated that both service approaches, the narrow and the broad approach, have their pros and cons. However, the companies that differentiate in their services face challenges in terms of performance (which included profitability as one criteria) due to the issue that the companies are not capable of influencing the quality, costs and innovation of the offered services enough. The study of Kale and Arditi did not distinctly open up the reason behind the influence challenges, but the feature that the construction industry is very dependent on other actors, such as material suppliers, was referred.
A very similar observation regarding the broad or narrow service offering is detected by Li and Ling (Citation2012). They researched how the offering of services for only a specific group of clients affects profitability; no correlation with profitability was detected, but instead, they present that a comprehensive service offering for customers correlates with profitability. The study of Li and Ling also included a broader analysis of three well-known strategy theories (Porter’s competitive strategies, Sun Tzu’s Art of War and the networking approach) where the strategies’ effects on the companies’ financial performance were compared. Porter’s differentiation strategy, Sun Tzu’s adaptability and market intelligence practises as well as network strategy were all significantly correlated with profitability. However, interestingly in terms of our research, Porter’s focus strategy was not significantly correlated with profitability.
Other observations about the effects of specialization on profitability were the level of competition, experience in the chosen market and construction material related factors. Akintoye and Skitmore (Citation1991) presented findings regarding competition. They detected that civil engineering works had – due to the tighter competition – lower profit margin levels compared to house building and construction related works. Arslan and Kivrak (Citation2008) presented findings regarding experience in the chosen market. In their study, the companies in the industry address that the most important thing for profitable business is to specialize in the market where the company has the best experience. Sanders and Cooper (Citation1991) detected that construction materials, specialization and profitability can affect each other. Their observation was related to the research of various building types; building sales facilities and storage facilities, like warehouses and large maintenance facilities, were the most profitable business, and they strongly doubted the result was related to the efficiency of steel structures. Even though the study of Sanders and Cooper is relatively old, it is very timely. The Covid-19 pandemic and the Russian invasion of Ukraine in 2022 with their consequences have had significant effects on construction material prices (Paché Citation2022, Rani et al. Citation2022). The observation yet emphasizes the importance of the topic of our study – strategic choices regarding specialization are very important.
Research design
As statistics about the BR sector are limited in Finland (NAOF Citation2014), and Europe in general (Murillo et al. Citation2019), a notable amount of background work was needed in order to get the research data into an analysable form. presents the main characteristics of the data and the analysis methods.
Figure 1. The main characteristics of the data and the analysis methods.
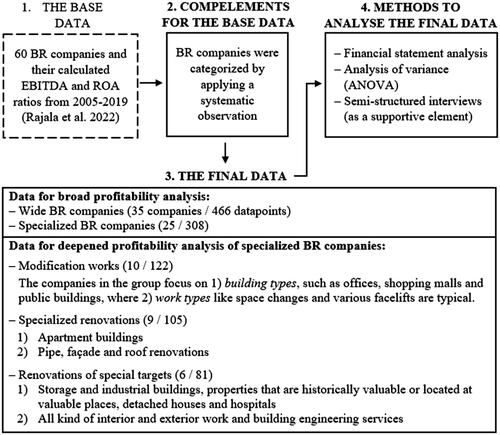
The base data – the first step in – has also been utilized in another study (Rajala et al. Citation2022) and the details of that data are presented in Appendix A. The complements for the base data were conducted by applying a systematic observation; the method where existing data, for example, texts on web pages as in this study, are observed to be able to find aspects determined in advance (Vilkka Citation2007). To be able to verify whether the companies offer a wide range of services or only certain services, the following three-step prioritizing was obeyed during the observation:
Clear promotions; the company promotes being specialized in a certain work type (e.g. pipe renovations) and/or building types – or vice versa, promotes offering a wide range of services. For example, a company offering a wide range of services presents its focusing area on its web site as follows: “The services of the company cover all the renovation needs for actors in the field: companies, the public sector, housing companies and privates. We have offered, with success, all renovation-related services for our customers in the capital city region since 1983.” In turn, a specialized company presents its focus area on the web site as follows: “The company is a 1998-founded expert in modification works of premises. Our customers are domestic and international real estate property trusts and companies from the public sector.”
Service specializations; If the company’s services presented on the web site include more than three work types, the service specialization is categorized as wide – otherwise as specialized.
Reference lists; If the majority, approximately 80%, of the references presented on the web site included certain work types or building types, the company was categorized as specialized – otherwise as wide.
In some uncertain cases (5/60), where the web page based three-step observation did not clarify the service specialization, the category was confirmed from the companies by phone. In these calls, categorizing was done by applying steps two and three. In order to be convinced by the categories, and to make sure that they would cover the entire research timeframe comprehensively, we also double-checked the financial statements for the slightly uncertain years of a few companies. In the financial statements, some of the companies have presented an annual activity report, which lists finished, ongoing or future projects with fairly accurate descriptions (including often, for example, work and building types).
The above mentioned three-step observation brought up both wide BR and specialized BR companies. To be able to analyse specialized BR companies in more detail, we categorized the specialized companies into three groups. The report “Repair, maintenance and improvement work in Finland” (Vainio et al. Citation2002) was chosen among many renovation-related studies to be applied to forming the more precise specialized groups. The report was published by the fully state-owned limited liability company VTT Technical Research Centre of Finland. presents the formed groups and the main phases on how the specialized groups were formed by utilizing the report.
Figure 2. The specialized groups and the process of forming the groups. Note: The bold thick arrows address the main alignment of how the work and building types are related to the created specialization groups. The dash lines address that they can in some cases be linked also to other groups.
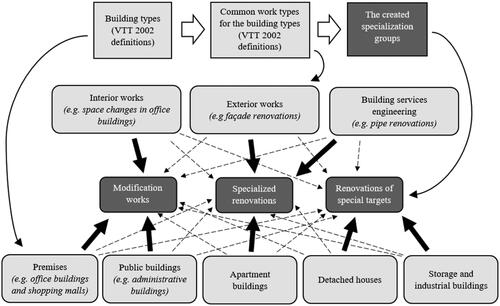
As presents, the forming of the specialized groups is – similar to the systematic observation – based on building and work types. Therefore, the categorizing of specialized BR companies was straightforward. However, when the categorizing into specialized groups was being done, we needed to take into consideration that the BR companies selected in the study represent a comprehensive group of the most significant renovation companies in the Finnish renovation sector (Rajala et al. Citation2022). For example, detached houses covering a significant part of the renovation needs in total are largely renovated in a DIY-way or by very small contractors (Vainio et al. Citation2002). As there are quite a few actors among the significant specialized BR companies that focus on detached houses, these companies, for example, are in this study categorized to the group renovations of special targets. Instead, the majority of the significant specialized BR companies seems to focus on larger entities where work types like pipe, façade (included in the group specialized renovations) and various modification works (included in the group modification works) are typical.
Primarily quantitative methodologies – analysis of variance (ANOVA) and financial statement analysis – were used to analyse the results. ANOVA is seen as an appropriate method when analysing means between various groups, as the method estimates the relative significance of the variance between group means to the mean variance within groups (Kim Citation2014). Financial statement analysis, instead, is a method that evaluates a company’s economic operating condition by examining financial statements and calculated financial ratios (Fridson and Alvarez Citation2011).
The assessments carried out with the executives of certain BR companies of this study are also a part of the research. The method of carrying out the assessments with the executives could be described as semi-structured interviews. The interviews include determined, but open-ended, questions, and the actual focus is on the interviewees who offer their subjective experiences to support the objective knowledge about the researched topic (Blandford Citation2004). The assessments were used in situations where clear reasons behind the results were not completely found from literature or by using financial statement analysis. The main details regarding the conduct of the assessments are presented in .
Table 2. Details of the conducting of the assessments.
The assessments were carried out by phone calls. For each assessment, the companies were randomly selected, but they represented the group where an unknown observation was detected. In the calls, the detected unknown observation was briefly described to the executives and then they were asked what the reasons behind the detected result could be. For example, executives of two companies from the group renovations of special targets were asked why companies in their group seem to be less vulnerable to economic cycles. Eventually, the most relevant observations regarding the conversations were written down and summarized in the Findings and Discussion section. All the assessment-based statements are referred to below in the analyses.
Findings and discussion
As the companies in the research are Finnish, a brief overview of the Finnish BR sector provides a background for the profitability analyses below. The BR sectors’ share of the total construction industry in Finland has increased from the 1980s’ 30% to today’s almost 50% (Statistics Finland Citation2019). The significance of the BR sector will remain and even increase as there is a detected renovation backlog covering 10% of the built properties in Finland with a total value of 500 billion (Finnish Association of Civil Engineers RIL Citation2019).
As construction companies in Finland have had difficulties in renovation projects impacting companies’ overall profit margins negatively, strategic choices in terms of specialization have taken up (Mölsä Citation2019). Due to these profitability issues, some companies are, for example, trying to avoid renovations of properties that are historically valuable or located at valuable places, and instead put effort on pipe renovations, seeing that business as more profitable. From the academic perspective, it has been presented that the trend for EBITDA and ROA medians in Finland has been decreasing for the renovation sector in total in 2005–2019 (Rajala et al. Citation2022).
Both profitability analyses below were begun by visually reviewing for exceptionally high or low values in the data. As these kinds of values – outliers – were found, the reasons behind them were estimated on a case-by-case basis. For example, the values were excluded in situations where companies were just starting their operations, or an accounting method clearly had caused the unusual values. The groups where outliers (12 out of 619 datapoints) were detected are presented more specifically in the analyses below.
Broad profitability analysis
When reviewing the sectors in total within the 15-year timeframe, the ANOVA comparison between specialized BR and wide BR companies did not reveal statistically significant differences in EBITDA margins or ROA ratios ().
Table 3. ANOVA results for sectors in total.
The result differs from the study of Li and Ling (Citation2012); they presented that, in the construction industry in general, companies offering a wide range of services are more profitable compared to companies offering certain focused services. Overall, the levels of the examined ratios can be seen as typical for the construction industry. Ahonen et al. (Citation2020) detected similar EBITDA margins in the Finnish construction industry (ca. 7%) and slightly better values in Sweden and Denmark (ca. 8%). Lai et al. (Citation2014) also detected fairly comparable profitability levels (ca. 5%) when they researched a similar period, in Malaysia though, and the ratio was net profit margin. Net profit margin considers interest, taxes, depreciation and amortization, which are not considered in the EBITDA margin (Committee for corporate analysis Citation2009). The levels of ROA are fairly high compared to the construction industry in general, but as researched, companies in the BR sector have fairly high ROA ratios due to light balance sheets consisting mostly of current assets (Rajala et al. Citation2022).
The nearly equal profitability results between specialized and wide BR companies can be seen as appropriate when reflecting on them with Mason’s (Citation1939) analysis of traditional, but also criticised (Porter Citation1979), Structure-Conduct-Performance (SCP) paradigm. The SCP states that the performance of companies in an industry is determined mainly by the industry structure, including, for example, the behaviour of buyers and sellers as well as the general level of competition. A high competition level decreases and equalizes the profitability levels in the industry. This is observed in very competitive industries, which the BR sector absolutely is (Pardalis et al. Citation2019). The SCP is dealt mainly with large companies but, in the context of renovation business, it seems to be valid for smaller companies as well. The nearly equal mean values also indicate that specialization does not seem to change the fact that the construction industry in general is strongly – in good and bad – dependent on value chains, including, for example, material suppliers and sub-contractors (Kale and Arditi Citation2002, Tennant and Fernie Citation2014).
Even though significant differences in the sectors’ profitability in total were not found in ANOVA, an annual median review, trend lines and confidence intervals for EBITDA and ROA indicate several interesting details ().
Figure 3. EBITDA and ROA medians, trend lines and confidence intervals for the wide and specialized BR companies in 2005–2019.
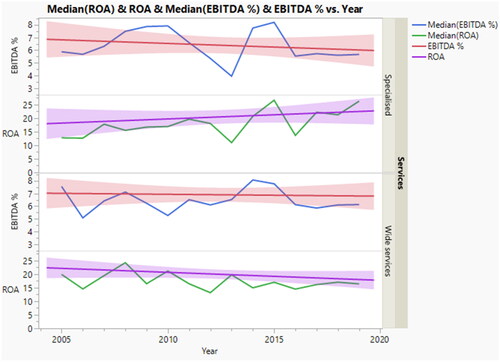
At first, both researched groups’ EBITDA and ROA ratios seem to behave similar when compared to each other, and there is a positive correlation. Spearman’s rank correlation coefficient between ROA and EBITDA in the total 15-year timeframe is 0.69 for the group specialized BR and 0.78 for the group wide BR. The closer the number is to one, the stronger the positive correlation (Artusi et al. Citation2002). The trend lines are slightly decreasing except for ROA for specialized BR companies due to certain, exceptionally strong years at the end of the research period and a few clearly weaker years in the beginning of the research period.
The second clear observation in is related to the EBITDA results from the specialized BR companies in 2009–2013. The results show that Finland’s several years of moderate economic development after the 2008–2009 financial crisis (Sariola and Pönkä Citation2020) particularly reflected on the specialized BR companies. The observation indicates that profitability-wise specialized BR companies seem to be more vulnerable to economic cycles. The statement seems coherent since it is presented that, as recessions decrease demand in the construction industry, competition surges among contractors, and many of them need to gather projects that they are not specialized in or do not otherwise have required competence for (Arditi et al. Citation2000). In these situations, especially specialized BR companies can suffer from the small market segment, and they need to expand – at the expense of profitability – to the segments they are not familiar with. Wide BR companies can instead utilize their capability for taking advantage of market opportunities from many market segments thus reducing their risks in terms of market cycles (Kale and Arditi Citation2002, Sexton and Barrett Citation2003).
Another observation in is the clear peaks in EBITDA margins around 2014 for both sectors due to an exceptionally large government expenditure program for renovation works (Ministry of the Environment Citation2014, Pajakkala Citation2014, Rajala et al. Citation2022). These kinds of stimulus packages have been strongly related to the profitability of the companies (Thangaraj and Chan Citation2012, Christopoulos et al. Citation2016). The mentioned expenditure program is even more visible in the specialized BR companies as the program especially supported specialized modernisation and rebuilding works (ARA Citation2013).
Even though both groups’ EBITDA margins have developed positively during the years around 2014, ROA in that time – and actually in the 15-year timeframe in total – has been slightly steadier for the wide BR companies. However, the difference is narrow – the standard deviations for ROA are 18.9 for the wide BR companies and 22.3 for the specialized BR companies in the total research timeframe. Financial statement analysis did not completely clarify the reasons behind the slight difference as there was a lot of variety detected on how, for example, current assets are specified in the balance sheets.
Assessments with Executives (Citation2021) still raised up several interesting factors that, depending on the situation, can steady or decrease the effectiveness of capital management, thus affecting ROA. One factor was the property development approach where companies purchase an existing property, renovate and sell it. These kinds of projects hold more capital and – albeit they are not very common in general – they are more typical for the wide BR companies. A slight difference in some situations can also follow from materials; wide BR companies can have more diverse reserves while specialized companies can be more effective in terms of their more specific material needs. Another raised issue regarding effective capital management is goodwill. Goodwill raises the balance sheet, thus decreasing ROA (Committee for Corporate Analysis Citation2009). Of course, the bought company is usually expected to bring more profits, but, for example one executive presented that sometimes profits do not follow acquisitions right away and goodwill’s share can be significant in the balance sheet. In the research data, there were only some cases detected, but that is a good point to notice in general, especially among companies that grow by acquisitions.
Another interesting observation considering advances received was detected in both groups (wide and specialized). The mean share of advances received in the balance sheets was mainly higher (around 10% difference to smaller companies) for the largest companies in the research data. As advances received are subtracted from balance sheets when calculating ROA (Committee for Corporate Analysis Citation2009), they relieve the balance sheet influencing the ROA positively. The observation concerns not only bigger single projects that larger companies usually have and where advances received are typical (Assessments with Executives Citation2021), but also stronger contract negotiation power compared to smaller players (Porter Citation1979, Pervan and Visic Citation2012). However, the calculated turnover of receivables did not confirm the negotiation power observation as there were no significant differences detected overall – for the groups wide and specialized, the mean time was 37 days for each.
Deepened profitability analysis of specialized companies
In the deepened analysis, also done by using ANOVA, the specialized companies are divided into smaller samples. The summary of the results () covers means for EBITDA and ROA ratios in the 15-year timeframe.
Table 4. ANOVA for various specialization groups.
Overall, the profitability results for the specialized BR companies indicate typical levels as presented above in the section Broad Profitability Analysis. The companies specialized in renovations of special targets have the best mean EBITDA margin differentiating statistically significantly from the group specialized renovations. The best result reflects the chosen niche markets; the companies try to operate in environments where there is less competition (Assessments with executives Citation2021). The ploy is classical. Porter (Citation1985) already proposed that it leads to higher profitability levels compared to more competed environments. On top of the competition level, client characteristics can positively affect the best EBITDA result; for example, the clients in the group renovations of special targets – such as owners of the properties that are historically valuable or located at valuable places – are usually not the ones who are the strictest in terms of prices but appreciate that works are done promptly. This observation is also supported by academic research; customers are ready to pay more for high quality services or products (Tani et al. Citation2021). Another reason for the best EBITDA margin for the group renovations of special targets can be the often-applied cost-plus basis contract form – the form that also Sanders and Cooper (Citation1991) justified to be notably profitable. However, ROA shows that companies specialized in renovations of special targets have the worst mean value, even though there are no statistically significant differences compared to other groups.
Generally, as the group specialized renovations includes many pipe renovation companies, the worst EBITDA margin trend line in is worrying; there is still a lot of workload in the coming years, though the peak of pipe renovations in the Finnish market is presently achieved as the massive dwelling stocks of the seventies are being renovated (Toivanen Citation2018). also presents EBITDA medians and confidence intervals; ROA values are excluded from the figure still correlating positively with EBITDA margins.
Figure 4. EBITDA medians, trend lines and confidence intervals of the specialized BR groups.
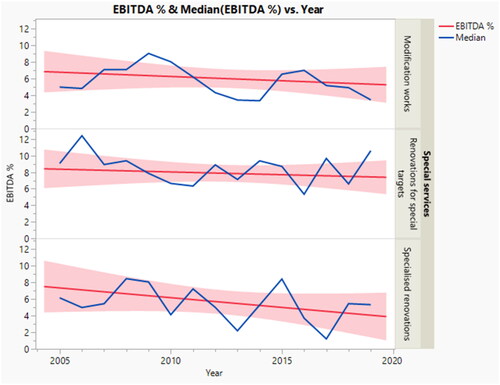
The EBITDA curves reveal another interesting matter considering the group specialized renovations: as the expenditure program in 2013–2014 covered pipe and façade renovations (ARA Citation2013), especially the companies in the group specialized renovations seem to have benefited from the program in terms of profitability. Unfortunately, the good period was followed by two years of clear decline. According to the Assessments with Executives (Citation2021), the workload multiplied during the expenditure program, but when the program ended, the load decreased, tightening competition and further affecting profits.
As is also visible in the curves, the EBITDA of the group specialized renovations seesaws. There was no exact reason to be found for the phenomenon, but the interviewed executives (Assessments with Executives Citation2021) stated that, for example, in the case of pipe renovation companies whose projects are relatively large, companies can usually have only a few projects running simultaneously, and moving to the next project often causes significant revenue recognition challenges in terms of the accounting period – thus affecting financial ratios.
Considering the group specialized renovations, documenting and invoicing additional works is also seen as challenging (Assessments with Executives Citation2021). The contractors see that additional works often end up at the expense of the contractor, thus influencing profitability negatively.
The EBITDA curve for the companies specialized in modification works shows that companies in this group benefited from the construction boom of premises just before the 2008–2009 financial crisis (Pajakkala Citation2014). The good levels at the time are in line with Sanders and Cooper (Citation1991) who found, though in the new building business, that building sales and storage facilities are quite a profitable business in the construction industry. However, the detected growth for the group modification works was also followed by the long-lasting decline that has been visible again in 2016–2019 after a short recovery. It is stated that the Covid-19 pandemic can in the long run boost modification works as many buildings need to be made more adaptable or even transformed to other uses in the future (Bereitschaft and Scheller Citation2020, Lättilä Citation2021).
The group renovations of special targets seems to have performed the most evenly among the specialized BR companies – the standard deviations confirm that observation. The group renovations of special targets has a standard deviation of 4.6, while the group modification works has 6.2 and the group specialized renovations 7.4. One reason why renovations of special targets seem to be less vulnerable to the cycles can be the client portfolio. The Assessments with Executives (Citation2021) supported that observation. The executives confirmed that renovations of hospitals or properties that are historically valuable are typically not as sensitive to financial cycles as, for example, modification works of premises are.
Another interesting detail that often rose up in the Assessments with Executives (Citation2021), was that the contractors see that the buyer organization also has a lot of influence on how the project is carried out. Especially pipe renovations (specialized renovations) were highlighted; many housing companies are seen as one-time buyers who do not have the experience to help carry out the project in the best possible way. Instead, owners of premises are an example of a buyer organization that usually has experience in modification works, and they might even have their own resources for construction related project management. Johnson and Babu (Citation2018) presented similar findings considering challenges with customers in the construction industry in general.
Conclusions
This research delved into companies’ profitability in an increasingly significant sector of the construction industry –building renovations. The research questions we were seeking answers to were: how does the profitability of specialized BR companies fare compared to wide BR companies, and what are the profitability differences among specialized BR companies?
Statistically significant differences in profitability between wide BR companies and specialized BR companies were not detected when considering the total 15-year timeframe. The annual median review still shows that the specialized companies are more vulnerable to economic cycles. In addition, expenditure programs by governments can have a positive influence on the profitability of BR companies when it comes to both wide BR and specialized BR companies.
The deepened profitability analysis of specialized companies revealed certain profitability differences among the specialized BR companies. The companies in the group renovations of special targets have the best EBITDA margins and the most even profitability performance considering the economic cycles. In turn, the companies in the group modification works have been more exposed to the economic cycles, and this feature reflects on the profitability levels both positively and negatively. The construction boom of premises just before the 2008–2009 financial crisis boosted the modification works sector, and it is assumed that the long-term effects of the Covid-19 pandemic can similarly support the groups’ profitability; the workloads are expected to increase due to the need of renovating premises to become more adaptable or even transformed to other uses. Specialized renovations showed up as the most worrying group, not only because of the decreasing trend in EBITDA margin, but because of the pipe renovation companies that the group included. In pipe renovation projects, the contractors see buyer organizations (typically housing companies) as such unexperienced partners that they hamper to carry out projects in a profitable manner.
The main findings presented above lead to the following conclusions. Firstly, the strategic choice of a BR company to only specialize in certain building, work or customer types seems to be sensitive profitability-wise in terms of downturns. Therefore, it would be important for both companies in the industry and academia to research ways and practices to improve the profitability of specialized BR companies in terms of the downturns. Regarding the specialized companies, only the group Renovations of special targets seems to have succeeded in retaining their good profitability levels in downturn circumstances. This seems to be due to careful client selection that enables low competition levels and minor cyclical effects. Secondly, pipe renovation companies’ issues with unexperienced partners also offer practitioners and academia a clear development need. Resolving this challenge could improve profitability for the companies in the sector. Thirdly, the finding that government’s expenditure programs can clearly influence the BR companies’ profitability positively is an important take away for decision makers.
The conclusions raised a few interesting topics for further research. On top of these, the following ones could be added. As the review perspective of this research was quite traditional, future research considering profitability and BR could be more focused on current topics, such as digitalization and ESG. Moreover, the long-term effects of the Covid-19 pandemic and the Russian invasion of Ukraine in 2022 with their consequences would be important to research from the perspective of BR and profitability. In addition, it would be important to increase the number of researched BR companies, and that would be most rewarding to do by expanding the research to other countries. In fact, the minor limitations of this study are related to the width of the research data. For example, small companies making up the largest part of the data and the geographical concentration of the companies in the capital city region limited a deeper breakdown in these sections, as sample sizes would not be large enough for reliable analyses. In addition, the 2008–2009 financial crisis is the only significant crisis that the research timeframe covers. However, it is a crisis that really had clear impacts on Finnish building construction (Rajala et al. Citation2022) and, as a global crisis, it can be seen as the best solution in terms of the reproducibility of the study in other countries.
Disclosure statement
No potential conflict of interest was reported by the author(s).
References
- Ahonen, A., et al., 2020. The competitiveness of the construction industry and the quality of construction in Finland. Helsinki, Suomi: Publications of the Government’s Analysis, Assessment and Research Activities, 209.
- Ajibike, W.A., et al., 2021. The impacts of social responsibility on the environmental sustainability performance of the Malaysian construction industry. International journal of construction management, 23 (5), 780–789.
- Akintoye, A., and Skitmore, M., 1991. Profitability of UK construction contractors. Construction management and economics, 9, 311–325.
- Alam, S., and Islam, M.T., 2017. Impact of blue ocean strategy on organizational performance: a literature review toward implementation logic. IOSR journal of business and management, 19 (1), 1–19.
- Alnoor, A., et al., 2022. The hybrid strategy on the basis of Miles and Snow and Porter’s strategies: an overview of the current state-of-the-art of research. International journal of engineering business management, 14, 1–18.
- Arditi, D., Koksal, A., and Kale, S., 2000. Business failures in the construction industry. Engineering, construction and architectural management, 7 (2), 120–132.
- Ariffin, S. T., et al., 2016. Factors of economies of scale for construction contractors. In: IConTES, international congress on technology, engineering, and science, Kuala Lumpur, Malaysia 13–14 February, 2016.
- Arslan, G., and Kivrak, S., 2008. Critical factors to company success in the construction industry. International journal of social, behavioral, educational, economic, business and industrial engineering, 2 (9), 561–564.
- Artusi, R., Verderio, P., and Marubini, E., 2002. Bravais-Pearson and Spearman correlation coefficients: meaning, test of hypothesis and confidence interval. The international journal of biological markers, 17 (2), 148–151.
- Asamoah, R.O., et al., 2020. Identifying intangible resources to enhance profitability strategies of Small-Medium Scale Construction Firms (SMSCFs) in developing countries. International journal of construction management, 22 (11), 2207–2214.
- Aslam, M.S., Huang, B., and Cui, L., 2020. Review of construction and demolition waste management in China and USA. Journal of environmental management, 264, 110445–110445.
- Assessments with Executives, 2021. Semi-structured interviews for nine executives of the building renovation companies. 15 November–22 December 2021.
- Bashir, M., and Verma, R., 2017. Why business model innovation is the new competitive advantage. IUP journal of business strategy, 14 (1), pp. 7–17.
- Bereitschaft, B., and Scheller, D., 2020. How might the COVID-19 pandemic affect 21st century urban design, planning, and development? Urban science, 4, 56.
- Bilal, M., et al., 2019. Investigating profitability performance of construction projects using big data: a project analytics approach. Journal of building engineering, 26, 1–11.
- Blandford, A., 2004. Semi-structured qualitative studies. In: M. Soegaard and R.F. Dam, eds. The encyclopedia of human-computer interaction. 2nd ed. Aarhus: The Interaction Design Foundation. Available from: http://www.interaction-design.org/encyclopedia/
- Christopoulos, A., et al., 2016. Investigation of the relative efficiency for the Greek listed firms of the construction sector based on two DEA approaches for the period 2006–2012. Operational research: an international journal, 16, 423–444.
- Committee for Corporate Analysis, 2009. Yritystutkimuksen tilinpäätösanalyysi. Tampere: Gaudeamus. 105 p.
- Deng, X., and Cheng, X., 2019. Can ESG indices improve the enterprises’ stock market performance? An empirical study from China. Sustainability, 11 (4765), pp. 1–13.
- Den Hertog, P., van der Aa, W., and de Jong, M.W., 2010. Capabilities for managing service innovation: towards a conceptual framework. Journal of service management, 21 (4), 490–514.
- European Commission (EC), 2003. Entrepreneurship and Small and medium-sized enterprises (SMEs). Available from: https://ec.europa.eu/growth/smes/sme-definition_en
- Finnish Association of Civil Engineers RIL, 2019. Rakennetun omaisuuden tila 2019. Helsinki, Suomi: Rakennusinsinööriliitto, 52. Available from: https://www.ril.fi/media/2019/roti/roti_2019_raportti.pdf
- Fonecta, 2022. The company search service web page Finder. Available from: https://yrityksille.fonecta.fi/en-about-fonecta/
- Fridson, M. S., and Alvarez, F., 2011. Financial statement analysis: a practitioner’s guide. New Jersey: John Wiley & Sons, 396.
- Geamănu, M., 2011. Economic efficiency and profitability. Seria StiinŃe Economice Anul, 21/2011 (2), 116–119.
- Henn, R., and Hoffman, A., 2013. Constructing green: the social structures of sustainability. Cambridge: MIT Press, 403.
- Johnson, R.M., and Babu, R.I.I., 2018. Time and cost overruns in the UAE construction industry: a critical analysis. International journal of construction management, 20, 402–411.
- Jonsson, T., et al., 2017. Developing a business model for sustainable renovation of public housing. 9th Nordic conference on construction economics and organisation. Göteborg, Sweden 13–14 June, 2017. Published in Chalmers University of Technology. Vol. 13, 242–252.
- Jensen, P., and Maslesa, E., 2015. Value based building renovation – a tool for decision-making and evaluation. Building and environment, 92, 1–9.
- Kale, S., and Arditi, D., 2002. Competitive positioning in United States construction industry. Journal of construction engineering and management, 128 (3), 238–247.
- Kasprowicz, T., Starczyk-Kołbyk, A., and Wójcik, R.R., 2022. The randomized method of estimating the net present value of construction projects efficiency. International journal of construction management. https://doi.org/10.1080/15623599.2022.2045426
- Kavuri, A. S., et al., 2020. Scenarios for the digitalisation of the construction industry. In: 36th conference of Association of Researchers in Construction Management, UK, 7-8 September, 2020. Published in proceedings of Researchers in Construction Management, Vol. 36, 425–434.
- Kim, H.-Y., 2014. Analysis of variance (ANOVA) comparing means of more than two groups. Restorative dentistry & endodontics, 39, 74–77.
- Kim, W., and Mauborgne, R., 2015. Blue ocean strategy. Expanded ed. Boston: Harvard Business Review Press. 287 p.
- Kravatzky, A., and Stephens, M., 2021. Twelve reasons why boards and executives should be clear that profit is not the purpose of their company. Board leadership, 2021 (175), 1–8.
- Lai, H.Y., Aziz, A.R., and Chan, T.K., 2014. Effect of global financial crisis on the financial performance of public listed construction companies in Malaysia. Journal of financial management of property and construction, 19 (3), 246–263.
- Lanzolla, G., and Markides, C., 2021. A business model view of strategy. Journal of managmement studies, 58 (2), 540–553.
- Li, S., and Ling, F., 2012. Critical strategies for Chinese architectural, engineering and construction firms to achieve profitability. Engineering, construction and architectural management, 19 (5), 495–511.
- Lättilä, H., 2021. Suurimpien korjausrakentajien koko viiden kärjen liikevaihto kutistui –” Jatkuvaa painiahan tämä on nyt hinnankorotuksia vastaan. Rakennuslehti, 22, Available from: https://www.rakennuslehti.fi/2021/06/suurimpien-korjausrakentajien-koko-viiden-karjen-liikevaihto-kutistui-2020-aktiviteetti-taloyhtiomarkkinoilla-on-nyt-palautunut/
- Mankins, M., and Gottfredson, M., 2022. Strategy-making in turbulent times: a dynamic new model by Michael Mankins and Mark Gottfredson. Harvard Business Review, September–October 2022 Issue.
- Mason, E.S., 1939. Price and production policies of large-scale enterprise. American economic review, 29 (1), 61–74.
- Ministry of the Environment, 2013. The release: Putkiremontti vaihe vaiheelta. Available from: https://www.ymparisto.fi/putkiremontti/
- Ministry of the Environment, 2014. The release: Asunto- ja viestintäministeri Pia Viitanen Lahdessa: Asuntojen perusparannusten käynnistysavustukset mahdollistavat miljardin investoinnit sekä tukevat työllisyyttä ja lähiöiden korjaamista. Available from: https://ym.fi/-/asunto-ja-viestintaministeri-pia-viitanen-lahdessa-asuntojen-perusparannusten-kaynnistysavustukset-mahdollistavat-miljardin-investoinnit-seka-tukevat-tyollisyytta-ja-lahioiden-korjaamista
- Mohamad, H., Ibrahim, A., and Massoud, H., 2013. Assessment of the expected construction company’s net profit using neural network and multiple regression models. Ain Shams engineering journal, 4, 375–385.
- Murillo, P., Rocha, E., and Rodrigues, M., 2019. Construction sectors efficiency analysis on seven European countries. Engineering, construction and architectural management, 26 (8), 1801–1819.
- Mölsä, S., 2019. Korjaaminen oli viime vuonna riskibisnestä varsinkin Lehdolle ja Constille. Rakennuslehti, 27. Available from: https://www.rakennuslehti.fi/2019/05/korjaaminen-oli-viime-vuonna-riskibisnesta-varsinkin-lehdolle-ja-constille/
- Nagarkar, J., and Gore, N., 2020. Eva Analysis of the building materials sector in the global construction industry. International journal of modern agriculture, 9 (3), 1267–1304.
- Nielsen, C., et al., 2018. Business models: a research overview. New York: Routledge, Taylor and Francis Group, 142.
- Paché, G., 2022. The invasion of Ukraine by Russian troops: a violent shock for supply chains. Strategic management quarterly, 10 (1), 1–8.
- Pajakkala, P. 2014. Kuumenevatko korjausrakentamisen markkinat. Seminar release by Rakennuslehti & Ruukki Oy. Finland, 3 October 2014. Available from: https://www.rakennuslehti.fi/2014/10/valuuko-valtion-taloyhtioille-maksama-korjausavustus-hintoihin/
- Pardalis, G., Mahapatra, K., and Mainali, B., 2019. Swedish construction MSEs: simply renovators or renovation service innovators? Building research & information, 48, 67–83.
- Pekuri, A., 2015. The role of business models in construction business management. Dissertation. University of Oulu, Faculty of Technology.
- Pekuri, A., Pekuri, L., and Haapasalo, H., 2013. The role of business models in Finnish construction companies. Australasian Journal of. Construction economics and building,13 (3), 13–23.
- Pero, M., et al., 2017. Environmental collaboration for sustainability in the construction industry: an exploratory study in Italy. Sustainability, 9 (125), 1–25.
- Pervan, M., and Visic, J., 2012. Influence of firm size on its business success. Croatian operational research review, 3, 213–223.
- Porter, M. E., 1985. Competitive advantage. New York: The Free Press, 580.
- Porter, M.E., 1979. How competitive forces shape strategy. Harvard Business Review, 57 (2), 137–145.
- Rabetino, R., et al., 2015. Developing the concept of life-cycle service offering. Industrial marketing management, 49, 53–66.
- Rajala, P., et al., 2022. Profitability in construction: how does building renovation business fare compared to new building business. Construction management and economics, 40 (3), 223–237.
- Rakennuslehti. 2022. Media rate cards. Available from: https://www.rakennuslehti.fi/wp-content/uploads/2022/07/rakennuslehti-mediakortti-2022.pdf
- Rani, H.A., et al., 2022. Impact of COVID-19 on construction projects: the case of India. Buildings, 12 (6), 1–20. pp.
- Sariola, M. & Pönkä, H. 2020. Koronakriisin syvyys ja siitä palautuminen. Euro ja Talous, Publication of Bank of Finland. Available from: https://www.eurojatalous.fi/fi/2020/6/koronakriisin-syvyys-ja-siita-palautuminen/
- Sanders, S., and Cooper, T., 1991. Analyzing construction company profitability. Cost engineering, 33 (2), 1–7.
- Sexton, M., and Barrett, P., 2003. Appropriate innovation in small construction firms. Construction management and economics, 21, 623–633.
- Shehu, Z., et al., 2014. Cost overrun in the Malaysian construction industry projects: a deeper insight. International journal of project management, 32, 1471–1480.
- Singh, Y., et al., 2014. Investigation of contemporary performance measurement systems for production management of renovation projects. Journal of construction engineering, 417853, 1–9.
- Snyder, H., 2019. Literature review as a research methodology: an overview and guidelines. Journal of business research, 104, 333–339.
- Statistics Finland, 2019. Statistics of renovations. Available from: https://www.tilastokeskus.fi/til/kora/2018/03/kora_2018_03_2019-12-11_tie_001_fi.html
- Storey, C., and Easingwood, C.J., 1998. The augmented service offering: a conceptualization and study of its impact on new service success. Journal of product innovation management, 15, 335–351.
- Tani, A., de Sousa Saldanha, E., and Barreto, D.M.B., 2021. The role of customer satisfaction on the relationship between service quality, price and word of mouth (WOM): the experience of EDTL.EP in Dili, Timor-Leste. Timor-Leste journal of business and management, 3 (2), 1–16.
- Teng, Y., et al., 2017. Using cooperative game theory to determine profit distribution in IPD projects. International journal of construction management, 19 (1), 32–45.
- Thangaraj, R.K., and Chan, T.K., 2012. The effects of the global financial crisis on the Australian building construction supply chain. Australasian journal of construction economics and building, 12 (3), 16–30.
- The Housing Finance and Development Centre of Finland (ARA), 2013. Search instructions for the renovation stimulus package. Available from: https://www.ara.fi/fi-FI/Ajankohtaista/Uutiset_ja_tiedotteet/Uutiset_ja_tiedotteet_2013/Asuntojen_perusparannuksen_kaynnistysavu(26197)
- The Confederation of Finnish Construction Industries RT (CFCI), 2022. Introduction of the organisation. Available from: https://www.rakennusteollisuus.fi/English/Frontpage
- The National Audit Office of Finland (NAOF), 2014. Suhdanneluonteinen korjausavustus. An evaluation report of the results of the expenditure program. Helsinki: Edita Prima Oy, 99.
- Toivanen, E. 2018. Putkiremontit ovat lisääntyneet vauhdilla – onko buumin huippu jo saavutettu? Statistics Finland’s publication Tieto&Trendit. Available from: https://www.stat.fi/tietotrendit/artikkelit/2018/putkiremontit-ovat-lisaantyneet-vauhdilla-onko-buumin-huippu-jo-saavutettu/
- Toszewska-Czerniej, W., 2018. Service portfolio as a key element of service strategy. European journal of service management, 26 (2), 283–292.
- Vainio, T. & Jaakkonen, L. & Nippala, E. & Lehtinen, E. & Isaksson, K. 2002. Repair, maintenance and improvement work in Finland. Espoo 2002. Research Notes 2154 by VTT Technical Research Centre of Finland. Available from: https://www.vttresearch.com/sites/default/files/pdf/tiedotteet/2002/T2154.pdf
- Tennant, S., and Fernie, S., 2014. Theory to practice: a typology of supply chain management in construction. International journal of construction management, 14, 72–87.
- Vainio, T., 2011. Building renovation – a new industry? In: Conference on management and innovation for a sustainable built environment, Amsterdam, Netherlands, 20–23 June 2011.
- Vilkka, H., 2007. Tutki ja mittaa: Määrällisen tutkimuksen perusteet. Helsinki: Tammi, 188.
- Viltard, L.A., 2017. Strategic mistakes (avoidable): the topicality of Michael Porter’s generic strategies. Independent journal of management & production, 8 (2), 474–497.
Appendix A.
The details of the base data
presents the selection process of 60 significant Finnish BR companies that form the base for this study. The company selection process is originally presented in the publication of Rajala et al. (Citation2022). New building construction companies (NB) were a part of the original research and are therefore also presented in the figure. In this study, we are only focusing on BR companies.
Figure A1. The company selection process.
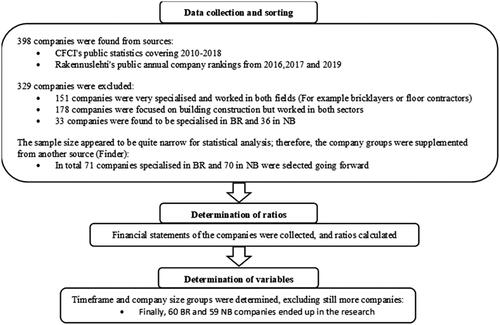
As can be seen in , the calculation of EBITDA margin and ROA ratios was also a key part of the selection process of the companies. The calculated ratios for 60 BR companies from 2005–2019 also work as the base data for the profitability analyses of this study.
In addition, below follows a few details regarding the selected companies and the calculation of the ratios:
Notions regarding the sources of the company selection process:
○ The Confederation of Finnish Construction Industry RT (CFCI) is the joint interest organization representing the construction sector in Finland (CFCI Citation2022).
○ Rakennuslehti is a Finnish construction trade journal owned by many associations related to Finnish construction, including CFCI (Rakennuslehti Citation2022).
○ Finder is a general and public Finnish company search service owned by Fonecta (Citation2022).
In the case of company size, the companies in the study represent the European Commission’s (EC) definition of small and medium sized companies (EC Citation2003) by turnover or balance sheet total. The small companies make up the largest part in the research data.
Geographically the companies have been mainly focused on projects in the capital city region.
The chosen profitability ratios were all calculated based on the data collected from the companies’ financial statements and formulas defined by the Committee for Corporate Analysis (Citation2009).