
 ?Mathematical formulae have been encoded as MathML and are displayed in this HTML version using MathJax in order to improve their display. Uncheck the box to turn MathJax off. This feature requires Javascript. Click on a formula to zoom.
Abstract
Sustained total factor productivity (TFP) growth of firms is essential to achieve sustained supply growth, which is necessary to solve the housing shortage and affordability problems. Existing productivity literature focuses on large firms whilst smaller firms make a significant contribution to the total supply. This paper investigates the productivity of 363 Indonesian real estate construction firms of medium and large sizes. We estimate Färe-Primont TFP measures under the meta-frontier framework, accounting for differences in the overall technologies under which each group of firms operates. Results deliver several important findings. First, large firms have higher productivity levels than medium firms, but average productivity levels are very low. Second, the productivity growth of large and medium firms is negative, which contributes to the growth of the housing shortage in Indonesia from 2012 to 2016. Third, in case of easier transfer or spill-over of production technologies between two firm groups, firms could enhance further their efficiency and productivity. Fourth, those factors related to branch numbers, legal structure and experience of doing business have positive correlations with the productivity performance of firms in both large and medium groups. Additionally, medium firms could gain higher productivity by diversifying their income. Importantly, our study shows evidence to support that government subsidies have a positive influence on the productivity level of medium firms.
Introduction
The global housing affordability crisis is caused by many factors on the supply and demand sides of the market (Oikarinen Citation2009, Hsieh and Moretti Citation2019). On the supply side, increased urbanization, sustained population growth and increased income of the middle-class population are the main factors driving the rapid growth in total demand. On the supply side, while the supply of land and housing units has increased, their growth is much less than the demand growth, leading to a supply shortfall. Undoubtedly, the balance of supply and demand is essential to obtain affordability in the long run (Samad et al. Citation2017).
As a typical developing country, Indonesia has experienced a significant housing affordability problem (Cruz Citation2008). Jakarta, the capital city of Indonesia, has been cited as worse than other cities belonging to the Association of South East Asian Nations. Cruz (Citation2008) reports that the house price to income ratio in Jakarta was 23.5 which is higher than those recorded for Kuala Lumpur (6.1), Singapore (7.3), Bangkok (9.2) and Manila (20.5). Similar to other countries of both developed and developing worlds, due to urbanisation and strong growth in the middle-class population, the demand for housing units increased dramatically. This increased demand has been attributed to the pushing of housing unit prices in Indonesia (Andrea, 2015). In fact, the main driving factor of the past affordability problem in Indonesia is the sustained housing shortfall (Pitoko Citation2016). According to Rukmana (Citation2018), until 2015, the combined production of housing units by private and state developers reached 850,000 housing per year, which met only half of the housing demand. The remaining households need to resort to self-built houses, which are known as “informal housing” in many areas and mostly without sufficient facilities and infrastructure (Rahmawati and Rukmana Citation2022).
More recently, the Indonesian middle-class population is expected to reach 135 million in 2030 from 52 million people in 2019 (Tarigan Citation2017, Wai-Poi et al. Citation2019). This strong population growth drives the total demand for housing to continue to rise. Given the strong and sustained growth in housing demand, there is a need for a faster and more sustained increase in housing supply to meet both the current deficiency and the growing future demand. Multiple factors, such as the availability of land, the cost-effectiveness of constructions, the economies of scale of large development projects, etc., contribute to the sustained growth of the housing supply. The efficacy of policies pertaining to urban planning, land, financing, and the sustainable supply of materials, etc., are of equal importance (Goldblum and Wong Citation2000, Monkkonen Citation2013). Long-term economic theories imply that the expansion of real estate and construction firms (RECFs) is required for the supply to grow robustly and sustainably. In the literature, the number of firms and their productive performance are cited as the two primary aspects of firm growth.
However, Monkkonen (Citation2013) shows that increasing the number of RECFs in the context of Indonesia does not appear to have a sufficient influence on the total level of housing supply. Concerning productive performance at the firm level,Footnote1 there are two important related dimensions: efficiency and productivity. In the context of performance benchmarking, efficiency analysis focuses on analyzing the relative performance of differing firms in how they use various inputs in productive or operational processes to generate outputs or business outcomes. On the other hand, productivity analysis focuses more on how productive or operational performance changes over time. Of notable importance is that productivity analysis gives answers to an important question as if firms experience any technological changes. The technological improvement observed at the firm level is the main force improving productivity observed at the industry level, which in turn leads to aggregate multi-factor productivity growth which drives the entire economy.Footnote2
In the Indonesian context, Hoang et al. (Citation2022) formally examine the productive efficiency of 832 Indonesian RECFs of differing sizes including small, medium, and large sizes from 2012 to 2016. This research reports that the large group of firms obtains the highest average efficiency levels (i.e. these firms are the most efficient). The medium group of firms records the second-largest average efficiency levels while the small firms are ranked last. On average, large firms are found to be able to reduce their input consumption by 30.6% given the same level of output produced. Medium and small firms, on the other hand, have the potential to reduce their input use by 47.1 and 52.1%, respectively. More importantly, this research demonstrates that the overall productive technologies used by these groups of firms are very different, justifying the use of a meta-frontier framework to analyse the performance of RECFs. However, this study does not examine the issues related to productivity.
Previous studies on total factor productivity (TFP) focus mainly on large firms or firms that are listed in major stock markets. Azman et al. (Citation2019) appear to be the most relevant study in this limited literature. The authors use the meta-frontier framework to examine the TFP level and temporal change of 37 construction companies listed in the Malaysian stock markets from 2003 to 2016. The authors argue that the meta-frontier framework is the most suitable for these Malaysian firms as they operate in different business segments which include the construction of buildings, heavy and civil engineering construction, and specialty trade contractors. Very few studies focus on the smaller-sized firms’ productivity as the key suppliers of housing for low- and medium-income people. To fill in this gap in the empirical literature, the present paper aims to investigate the productivity performance of both medium and large RECFs using the meta-frontier framework.
The study is structured as follows. After presenting a brief literature review, we briefly discuss our research methodology. This is followed by our discussions on the background of Indonesia RECFs and the data used. We focus on empirical findings and implications that can be drawn from these findings. Finally, the conclusion gives the final remarks of this study.
Literature review
We adopt O’Donnell (Citation2016) in defining production technology as a technique, method, or system for transforming multiple inputs into multiple or single outputs and total factor productivity (TFP) as a ratio of outputs over inputs. Within the existing literature review, some studies focus on real estate companies while others focus on construction companies. There are a limited number of studies that investigate the productivity of real estate companies, particularly medium firms. provides a summary of key published papers on the productivity aspects of firms in both real estate and construction sectors in several developing and developed countries. Note that these studies use the data envelopment analysis (DEA) technique as a non-parametric technique in measuring performance. Also, there are more empirical studies on the productivity of firms in the construction sector (Dixit et al. Citation2019) but most studies focus on large construction firms. Importantly, most of these studies implicitly assume that all firms in the datasets used to have the same production technology.
Table 1. Summary of key papers on productivity in real estate and construction sectors using data envelopment analysis framework.
Methodologically, most studies attempted to measure productivity levels and decompose temporal changes in productivity levels into various components. When measuring productivity levels, analysts need to specify a form of production technologies (i.e. abstract mathematical presentation capturing relationships between outputs and inputs in the production process of firms). There are other strands of literature using the stochastic frontier analysis to measure efficiency and productivity (Wang et al. Citation2021, Azman et al. Citation2022, Citation2023) or estimating the total factor productivity as a residual from the production function (Camino‐Mogro and Bermudez‐Barrezueta Citation2021). Stochastic analysis rely on specific function forms of the production function while the parametric estimation of the production function is not free of econometric issues (Bournakis and Mallick Citation2018). Additionally, these methods often require price data. On the other hand, non-parametric methods as done in our empirical work can avoid these issues.
One important gap in the literature is the lack of inclusion of production technologies differentiation. Specifically, most empirical models assume that all firms use the same production technology. One exception is Azman et al. (Citation2019) estimate the efficiency and TFP of 37 construction companies listed in the Malaysian stock markets (from 2003 to 2016) operating in different business segments. The study is using the meta-frontier framework to quantify the TFP level and change.
Empirical studies often examine temporal changes in productivity levels and decompose these productivity temporal changes into differing components. This type of decomposition allows analysts to identify aggregate sources of TFP changes. Decomposition is dependent on some forms of productivity index. As reviewed by Azman et al. (Citation2019), existing studies in construction and real estate often use Malmquist or Luenberger indices which do not process critical statistical properties such as identity and transitivity (O’Donnell Citation2012). In contrast to these indices, the F–P index is characterized by these statistical properties, hence it is more accurate. In our review, only Azman et al. (Citation2019) illustrate using the F–P index to analyse construction firms. Particularly, the empirical results in Azman et al. (Citation2019) show that productivity growth occurs mainly due to improvement in Technical Efficiency (TE) and Scale-Mix Efficiency (SME). Additionally, this study documents significant technological gaps among different groups of firms. To address this gap in the empirical literature, our paper also uses the F-P index to identify aggregate sources of productivity change for Indonesian RECFs.
Another important gap in the literature is the lack of empirical research looking at TFP efficiency. The TFP efficiency differs from TFP levels. More specifically, measures of TFP efficiency indicate how well firms solve the problems of maximizing their TFP levels (O’Donnell et al. Citation2017). Measuring the TFP efficiency of real estate and construction industries is very relevant because most firms would like to maximize their TFP levels. Interestingly, methodological literature has shown that changes in this TFP efficiency are parts of TFP changes (O’Donnell Citation2016, 2018, O’Donnell et al. Citation2017). We aim to provide one of the first applications of this analysis in the real estate and construction industry.
Additionally, most studies do not investigate the determinants of variations in productivity performance. Understanding factors that drive productivity is important for management and policy analysis; hence, we aim to investigate these determinants of productivity for Indonesian RECFs. Due to the publicly available data on listed large real estate firms, most studies did not focus on other-sized firms. On the contrary, a significant amount of housing is produced by medium-sized real estate and construction firms.
Background on Indonesia’s real estate industry
Formal statistics estimate an average annual housing demand of around 800,000 units and an annual supply of 500,000 units in the early 2010s (Indonesia Statistic Citation2017). Industry data shows that the total supply quantity has increased recently from 699,770 in 2015 to 904,758 in 2017 (Global Construction Review Citation2019) but supply is still smaller than demand. According to Hutapea (Citation2019), the sustained gap between supply and demand has led to a prolonged housing shortage which reached its peak of around 7.6 million of housing units in 2019. The housing shortage mostly consisted of housing units which were mainly supplied by medium RECFs, while luxurious houses were largely supplied by the large RECFs (Ramadhiani Citation2016). Note that the increased shortage in the medium segment of the market was partly due to a sharp increase in the price of land, which decreases the profit margin for most RECFs. This in turn has pushed large RECFs to focus on the more luxurious segments.
The average prices of housing units in Indonesia have also fluctuated, particularly from 2013 to 2017 (Federal Reserve Bank Citation2019). This has been partly caused by macroeconomic factors, uncertainty in the political environment, and fiscal/monetary policies. Notably, the loan borrowing segment of the housing industry also experienced a remarkable change in its financial environment with the loan-to-value (LTV) policy controlled by the Bank of Indonesia falling sharply between 2013 and 2014 (Bank of Indonesia Citation2019). Also, capital gain also plays an important role in increasing the housing price (Susilawati Citation2018). In sum, there are multiple factors in place to explain low housing affordability in general and a lack of supply in particular (Hoang et al. Citation2022).
Also, to stimulate low-cost housing production, Indonesia’s government has given subsidies to development projects that sell low-cost units. Most of these subsidies are investments in public facilities such as water sanitation, parks, and roads. The subsidy scheme follows MPWH Regulation No.38/2015 revised by MPWH Regulation No.3/2018 regarding Guidance on Public Facility Subsidy. Note that medium-sized RECFs account for most firms participating in the production of low-cost housing.
Recently, Hoang et al. (Citation2022) provide some useful background information on the legal structures of RECFs in Indonesia. Nearly all large and medium firms register as limited liability company (LL) which has a minimum initial capital requirement (i.e. Rp 50 million). Also, most of the firms are in Java Island because this region is the national center of economic activity and population. Hoang et al. (Citation2022) also argue that large, medium, and small firms appear to operate in distinct business environments, which supports the use of the meta-frontier framework to obtain more accuracy in efficiency analysis. In their study, the group frontier encompassing all small firms is found to be closest to the meta-frontier, followed by the group-frontier of the medium firms. One reason for this result could be because small firms account for more than 56% of the entire sample size. Additionally, in practice, medium firms are easier to grow into large firms in several years; hence, for the productivity analysis in the present study, it is more reasonable to focus on large and medium firms and exclude small firms.
Methodology
This study takes a two-stage methodological approach. The first stage measures the total factor productivity (TFP) performance of firms while the second stage identifies important factors that explain variations of the TFP performance across time and firms. The literature on productivity measurement favors TFP indices to quantify both levels and temporal changes in productivity. The index-type TFP measures rely on a particular index formula (O'Donnell Citation2012). We refer readers to Azman et al. (Citation2019) for more discussions on other index formulas used in relevant empirical literature. In this article, we use the Färe–Primont (F–P) index as detailed in O’Donnell et al. (Citation2017) and O'Donnell (Citation2018) for several reasons. First, this index is quite general as it does not require any additional restrictions on the production technology apart from those necessary for the distance function to be well-defined. Second, this index is appropriate in the context of constant and variable returns to scale (VRS) specification of the production technology. Third, this index satisfies important axioms including linear homogeneity, identity, commensurability, proportionality, time-space reversal, circularity, and transitivity. Lastly, this index can be decomposed into several components because this index is multiplicatively complete.
Measurement and decompositions of TFP
When firm i uses multiple inputs to generate multiple outputs, its TFP can be expressed as aggregate output () to the aggregate input (
):
(1)
(1)
Following O'Donnell (Citation2018) we use the output distance function to aggregate various outputs into the aggregate output. The respective aggregate input is also constructed from various inputs using the input distance function. Under the input orientation where firms are assumed to have more control over the use of inputs, their TFP can be decomposed into four parts: TFP Efficiency (TFPE), input-oriented technical efficiency (ITE), input-oriented mixed efficiency (IME) and residual input-oriented scale efficiency (RISE). These are in fact productivity-oriented measures of efficiency which capture how well firms have maximized productivity when variables that form productive environments have been predetermined (see Section 5.6 in O'Donnell Citation2018 for more details). Note that the last three components form the technical and scale-mix efficiency (TSME) of a firm as defined elsewhere (O’Donnell et al. Citation2017, O'Donnell Citation2018).
(2)
(2)
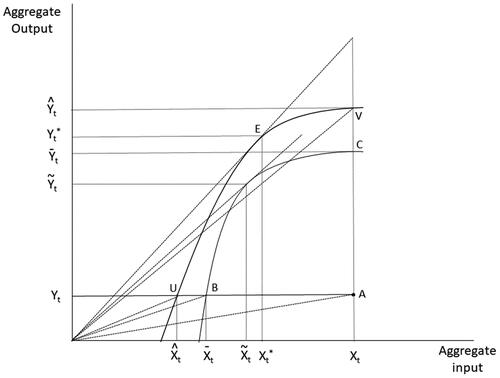
captures key concepts of these four components under restricted and unrestricted frontiers. The restricted frontier refers to situations in which the mix of inputs or the mix of outputs is held constant while these mixes of inputs and outputs are allowed to vary in the absence of technological constraints in the unrestricted frontier. Using this unrestricted frontier, Point E has the highest TFP level. Any inefficient decision-making unit (DMU) (i.e. firm) as point A stays below the frontiers. Firms as points B and C are efficient with respect to the restricted frontier. DMUs as points U, E and V are efficient with respect to the unrestricted frontier. Ultimately, point A should be benchmarked against point E. Under input orientation, the path of improving efficiency from point A to point E can happen by moving from points A to B, then B to U, then U to E. A movement from A to B captures then B to U captures
and U to E captures
The TFP efficiency
is defined by the ratio of TFPit to
The numerator refers to empirically observed TFP for each firm and the denominator refers to the maximum TFP level. Note that all of these indicators are subject to the available technology at time t.
Figure 1. Different components of TFP in aggregate input-output framework. Different components of TFP for any observed firm staying below the frontier in an aggregate input-output framework.
Measurement and decompositions of TFP change
It is useful to track changes in the TFP level of firms over time and identify the main drivers of TFP changes. Comparing TFP of firm i in period t with the TFP of firm k in period s can be done by constructing the following index (TFPI):
(3)
(3)
Following O’Donnell et al. (Citation2017), the temporal change in the TFP level can be decomposed into environment and technology index (ETI) and changes in the TSME. ETI is a combined measure of environmental and technological change while TSMEC can be further decomposed into changes in ITE, IME and RISE as in EquationEquation (2)(2)
(2) . Hence, we have
(4)
(4)
(5)
(5)
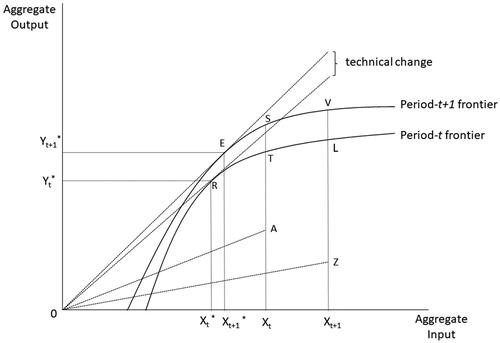
ETI denotes if the unrestricted production technologies have progressed (i.e. its value being greater than unity) or regressed (i.e. its value being smaller than unity) from period s to period t while three latter components reflect the temporal changes with respect to the three components of the TSME. displays an example of the unrestricted frontiers in period t and period t + 1. The unrestricted frontier can shift from one period t to the next period t + 1, which is captured by ETI. ETI having a value bigger than unity suggests that technical change has progressed.
Figure 2. Temporal changes in TFP. Conceptualizing different components of temporal changes in TFP.
Meta-frontier framework
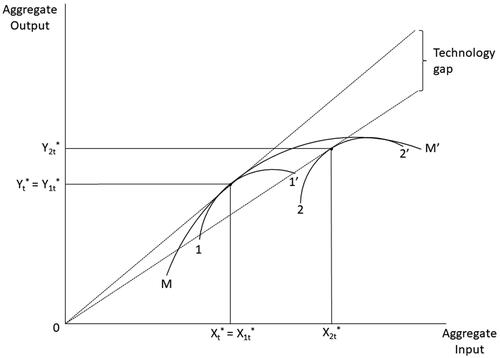
The meta-frontier approach models firms operating on differing technological frontiers to account for differing production technologies used by firms. In our empirical context, firms are classified into two distinct groups: medium and large. Using the meta-frontier approach, we can construct two group frontiers (i.e. one group frontier for firms of medium size and one group frontier for firms of large size) and the meta-frontier (all firms). depicts the meta-frontier being the curve M-M’ with two group frontiers being and
All meta- and group frontiers can be expressed as unrestricted frontiers discussed in .
Figure 3. The concepts of the meta-frontier. Conceptualizing two group-frontiers and meta frontier.
With the assumption that firm i is part of group g, we can decompose productivity efficiency (TFPE) as follows:
(6)
(6)
In this way, an input-oriented meta-technology ratio, comparies the maximum
possible in group
environment to the maximum
possible in the meta environment.
on the other hand, compares the
of a DMU i and the maximum
possible in group
environment (i.e. under its relevant group frontier).
Analysis of determinants for TFP performance
With regard to analysis of what driving factors behind the TFP level across firms and over years, we estimate the following regression model:
(7)
(7)
Note that the explanatory variables were chosen for multiple reasons. In addition to variables such as revenue, asset, and salary, which are used as output and input in the first stage of analysis, we attempted to capture the possible effect of firm scales on productivity. Only the number of branches among the available data can be used to capture this scale effect. Second, we use years of establishment to capture business experience and number of experts to capture industry expertise aspects in the labour and management structure of the firm, as these dimensions may play important roles in explaining variation in firm-level productivity. Thirdly, we utilise the legal structure to capture other business management aspects. A subsidy dummy is utilised to evaluate the potential impact of subsidies on firm productivity. Location-specific dummies are utilised to capture differences in demand and other macro factors across Indonesian regions. Note that our selection of variables is constrained by the availability of data.
Description of data
We utilize the same data as described in Hoang et al. (Citation2022).Footnote3 The data is provided by the Ministry of Finance, which is the formal supplier of statistical data on registered firms in Indonesia. The original data covered all registered firms located in 27 provinces and 111 districts across Indonesia. There are many firms recorded with incomplete data or detected with outliers on key variables, and hence they are removed. The final sample size with complete data contains 363 firms, of which 110 are classified as large, and 253 as medium. We followed Law No. 8/2008 to classify firms into these two groups using total revenue value, with a threshold of Rp 50 billion for medium firms and Rp 50 billion for large firms.
Medium and large RECFs are mostly located in Java, Sumatera, Sulawesi, Kalimantan and Bali.
The production function is assumed to have one single output (i.e. revenue) and four inputs (materials used, salaries, operational expenditure, and total assets). These inputs and output are expressed in monetary values (converted into USD where USD 1 is equivalent to Rp 15,083) and have been used in previous literature. More specifically, material inputs refer to the total monetary value of materials used in production. Wages, bonuses, and other allowances are all included in the salary input for employees. Operational expenditure consists of advertising and marketing, interest expenses, and other associated expenditure. shows the descriptive statistics of these variables.
Table 2. Descriptive statistics of key input, output and determinant variables.
Following Hoang et al. (Citation2022), we apply moving averages to calculate the final inputs and output. Medium and large RECFs undertake their business on the basis of differing projects. Each project often has two stages. The first stage involves land preparation and construction while the second stage mainly sells housing units. A relatively large project has an average completion time of between one and four years. For example, Prawira (Citation2014) indicates that housing projects located in North Sumatera often take fifty eight weeks to complete. Therefore, we argue that two years moving average would be suitable, hence, data were converted to contain four periods: from 2012–2013 to 2015–2016.
We follow empirical literature in selecting the explanatory variables to estimate EquationEquation (7)(7)
(7) . Data availability, however, also restricts our choices. also presents the descriptive statistics of other attributes of firms of the two groups which are considered as the determinants of productivity variations. These include the number of years from the first year of establishment, the number of experts working in the firm, the number of branches, the monetary value of any income generated as revenue from a side business other than the main business (i.e. side income), and other dummy variables. Dummy for regional location refers to those firms having their headquarters in non-Java regions. Another dummy captures the situation where firms are involved in projects in which the government has provided some form of subsidy. The legal structure of firms is captured by another dummy where limited liability is the base category and unlimited liability includes sole proprietorship.
Table 3. Descriptive statistics of efficiency and productivity determinants.
Empirical results and discussions
Group frontier estimates
presents geometric mean scores for productivity levels and their respective components. Differences in the TFP levels are displayed by the maximum unrestricted frontier TFP level for each group (i.e. ) and
is decomposed further into three components:
and residual
Table 4. Average TFP level and its components using group-specific frontiers as in EquationEquation (2)(2)
(2) .
On average, large firms record higher TFP levels than medium firms. TFP levels of two groups of firms are relatively low and mostly lower than 0.5 (except for large firms during 2015–2016). The main cause of low TFP levels in both firm groups is the low performance in TFPE. Among the three components of TFPE, for large firms, scale inefficiency appears to be the main driving factor behind the low TFPE level while for medium firms, technical inefficiency is the main cause. In other words, the ITEg and IMEg levels are higher for firms in the large groups than the medium groups. This result implies that large firms, on average, are more efficient than medium firms concerning the use of input and the choice of input mix. The RISEg level of the medium group, however, is higher than that of the large group. This suggests that firms of the medium group, on average, have a more optimal scale of production. shows an increasing trend for the productivity level of the large group but a decreasing trend for the medium group.
Figure 4. Total factor productivity level with respect to group frontiers. Displaying average TFP levels with respect to group frontiers in each period of analysis.
The geometric scores for temporal (i.e. year-on-year) changes in the TFP levels are shown in . The overall temporal changes for both groups of firms are negative. Specifically, the group of large firms experienced an average negative growth of 1.1% per period. Similarly, the group of medium-sized firms experienced an average negative growth of 1.81% per period. Differences in the overall TFP changes between the two groups are small. However, the results indicate that the main drivers of these temporal changes are not the same between the two groups. Technological and environmental regress captured in ETI was reported for large firms but this regress was offset partly by remarkable growth in their efficiency levels. However, the magnitude of reduction in technological and environmental change is less for medium-sized firms where temporal growth in the efficiency levels was much smaller. Both large and medium groups were found to exhibit positive growth in the residual scale efficiency for the entire period. However, there are reductions in two other TFPE components. These findings are in favor of a common view that regressions in the TFP of RECF partly explain the housing shortage problems in Indonesia.
There are differences in the fluctuations of both the TFP level and temporal changes during the periods surveyed. Results in clearly show that large firms achieved the largest growth in their TFP levels in period 4 (2015 and 2016) while the TFP of the medium-sized firms reach their high record in period 1 (2012 and 2013). Also, large firms saw their TFP levels increasing over time while the medium-sized firms show a different pattern in their TFP levels: their TFP levels decreased from period 1 to period 3, and then increased in period 4. Similarly, different components of TFP change show differing patterns of change between two groups of firms.
Table 5. Average TFP change and its components using group-specific frontiers as in EquationEquation (6)(6)
(6) .
The results of the meta-frontier
Geometric scores of levels with respect to the frontier of the meta-technology are reported in . As expected, the average scores of all components of the
for both groups of firms under the meta-frontier are lower than those under the group frontiers discussed above. Still, TFPE is the main driving force behind the low TFP levels across all firms. Among the three components of TFPE, firms could improve their TFP efficiency by improving their technical and scale efficiency.
Table 6. TFP level and its components under the meta-frontier specification as in EquationEquation (2)(2)
(2) .
presents TFP temporal change and its decomposition. In general, TFP both for the entire period and for each period showed a decreasing trend. One exception is the positive growth in ETI in 2013–2014 over 2012–2013, representing the progress in the meta-environment. One important result is that RISE experienced positive growth across the entire period, which offset the negative growth in other components such as changes in environmental and technological efficiency, technical efficiency and input mix efficiency.
Meta-technological ratio (MTR)
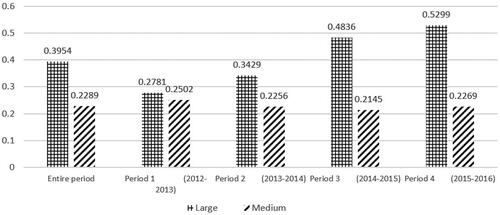
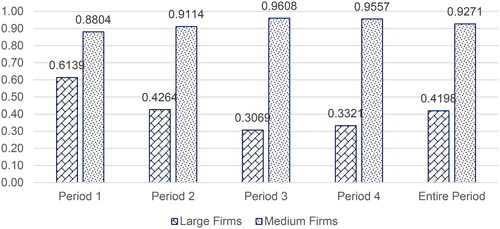
The MTR assesses the potential improvement in efficiency and consequently productivity performance of firms of one group given they can gain access to the best practice in the production of the two groups. For periods 1 to 4, the MTR estimated for the firms of the medium size is higher, indicating the medium firms stayed closer to the meta-frontier. The MTR for the firms of the large group is estimated to be 0.4198, meaning that on average the large firms can enhance their overall productive efficiency by 58.02 percent if they access to the best practice in the production captured by the meta-technology. The MTR for medium-sized firms is estimated to be 0.9271, suggesting that these medium firms, on average, could boost their overall productive performance by 7.29% if they are able to access the meta-technology. Altogether, these results imply that in consideration of possible policies and interventions on possible ways to improve the productivity of RECFs, the firms of the medium group should receive higher priority as the impact would be stronger for the entire industry ().
Figure 5. Meta-technology ratios over time.
Determinants of Indonesian RECFs productivity
presents results for EquationEquation (7)(7)
(7) for three groups: large firms only (large group frontier), medium firms only (medium group frontier), and the entire sample (meta-frontier). The entire sample model shows the robustness of the results observed in the two respective groups. The year of establishment is statistically significant in the large firms and meta-frontier specifications but not in the specification for the medium group. On the other hand, the TFP level is found to be positively correlated with the number of experts and branches in the group and meta-frontier specifications. The positive correlation between the number of experts and TFP is reasonable in the context of Indonesia industry as firms having more experts could be correlated with better project and business management which leads to more productive performance at the firm level. As shown earlier, estimated scale efficiency scores are low, suggesting that most firms are operating below their optimal scale. While the number of branches is not a perfect variable to capture the scale or size of firms, the positive sign of the number of branches variable may indicate an association between a bigger firm scale and higher productivity.Footnote4
Table 7. Analysis of determinants of productivity variation.
Having income from activities other than their main business activity appears to have a positive impact on the productivity of the medium firm. This provides evidence to support the argument that income diversification could also improve productivity. Subsidy variables are found to be positively correlated with productivity levels, which is in line with the finding reported elsewhere (Bernini and Pellegrini Citation2011). However, this result does not necessarily suggest the causal effects of the government subsidies on firm productivity. Nevertheless, further examination of the effectiveness of government subsidies policy is worthwhile.
Across three specifications, unlimited liability firms are found to be less productive than limited liability firms. This finding is reasonable in the context of the Indonesian economy where the majority of unlimited liability firms are family-managed firms and most of the limited liability firms have an independent and a higher quality of board management. Note that higher quality of board management is found to have a significant influence on the performance of firms (Dahya and McConnell Citation2005). Also, Arregle et al. (Citation2007) argue that the nature of the family-based business model and the lack of operational transparency of the unlimited liability firms could cause difficulty in gaining external funding, which leads to higher costs in terms of financing and daily operation.
Discussion and conclusion
Benchmarking the productivity performance of firms in terms of their levels and temporal changes is the first step in the evidence-based firm management and policy intervention approach. In a typical analysis, one can measure productivity performance and identify the drivers of performance. Based on this type of analysis, useful information can be fed into the management and policy framework so that possible interventions could affect those drivers to improve productivity. However, existing literature on productivity analysis in real estate and construction sectors has a strong focus on only large firms. Echoed by the essential roles of medium-sized firms in the supply of housing units in developing economies such as Indonesia, a productivity analysis of medium firms is needed.
This study has applied the meta-frontier approach to estimating Färe-Primont TFP for medium and large firms in Indonesia during the 2012–2016 period. The sectoral background for this study is that the level of the supply of housing units has always been smaller than the demand level and this supply shortage has led to a prolonged affordability crisis. This has been cited as the main reason why housing units have become increasingly unaffordable. However, the productivity aspect of firms in the industry has not been analyzed in the literature. Our empirical results demonstrate that TFP levels are low for two groups of firms. The main driver for this low productivity level is technical and scale inefficiency.
On average, large firms are found to perform at a relatively higher TFP level than medium-sized firms with respect to their own production frontier. Especially, large firms, on average, perform better in terms of the levels of technical and input mix efficiency. The level of scale efficiency of the medium firms, however, is estimated to be marginally higher. Large firms are found to have a larger technological gap than medium firms. This suggests that enhancing scale flexibility for large firms could deliver a remarkable potential improvement in their TFP. On the other hand, the improvement of the productivity of the medium firms could have a more immediate impact on the housing shortage.
Another notable finding is that annual changes in total factor productivity levels are negative in most periods for both groups, mainly due to regressions in the overall environmental and technological aspects. This finding could present another explanation for the increased shortage of supply and worsening affordability of housing in Indonesia. Temporal growth in other dimensions of efficiency has partly offset the negative impacts of the regression in the overall environmental and technological component.
Our analysis of what factors drive TFP changes also yield several findings. First, the years of establishment and the number of experts are statistically significant and positive, which indicates the importance of business experience and expertise for the growth of firms in the Indonesian context. Those variables such as the legal structure of unlimited liability and the number of branches are positively correlated with the productivity of both large and medium firms. Given that most of firms with unlimited liability structures have a smaller size than the limited liability firms while our efficiency analysis indicates high levels of scale inefficiencies, these results suggests that most of firms are on the path of increasing to scale. This implies that most Indonesian firms might gain productivity benefits from economies of scale. Importantly, income diversification appears to deliver productivity benefits to medium-sized firms. Last but not least, our results suggest medium-sized firms which received subsidies from the government in their low-cost housing development projects area associated with higher TFP levels. This result, however, does not suggest any causal effects of government subsidies in low-cost housing projects. The effectiveness of government subsidies itself presents important research topics.
Note that these empirical results in terms of the determinants of firm productivity might be only specific to Indonesia. However, our empirical work demonstrates that non-parametric modelling of the meta-frontier framework, aggregate efficiency and productivity, and technological gaps are highly applicable in empirical research in other countries. Additionally, while our research does not aim to draw any causal relationship between slow productivity growth and affordability problem, we believe that productivity analysis is an important component of research efforts trying to solve housing affordability problems experienced in many cities and countries around the world.
Disclosure statement
No potential conflict of interest was reported by the author(s).
Data availability statement
Several elements of data and codes can be made available from the second author upon reasonable request.
Notes
1 The literature on efficiency and productivity is extensive. Empirical analysis can be done at many levels which include plant, firm, industry, and regional and national aggregate levels. Ahmed and Bhatti (Citation2020) provide a review of the most frequently used methods in the empirical literature.
2 Another strand of literature decomposes aggregate productivity into various components that capture the productivity change of surviving firms, changes in market shares, and firm entry and exit (Baily et al. Citation1992, Melitz and Polanec Citation2015, Dias and Marques Citation2021). While the present article has a focus on firm-level analysis, it is desirable to investigate productivity issues around the linkages from firms to the industry level.
3 It is desirable to undertake analysis at a more disaggregated level, for example, between low-cost housing projects and other projects. However, because the data provided is aggregated at the firm level and there are no possible criteria that can be reasonably used to disaggregate at the project level, such an analysis is not possible in the present article.
4 Note that it is possible that a firm becomes a large firm due to its higher productive performance (efficiency and productivity) in the past. This means that larger firms are not more productive simply because they are large. In this sense, productivity analysis in dynamic settings taking into account entry and exit issues could provide useful insights. We thank one of the reviewers for noticing of this important issue.
References
- Ahmed, T., and Bhatti, A.A., 2020. Measurement and determinants of multi‐factor productivity: a survey of literature. Journal of economic surveys, 34 (2), 293–319.
- Arregle, J.-L., et al., 2007. The development of organizational social capital: attributes of family firms. Journal of management studies, 44 (1), 73–95.
- Azman, M.A., et al., 2019. A meta-frontier method of decomposing long-term construction productivity components and technological gaps at the firm level: evidence from Malaysia. Construction management and economics, 37 (2), 72–88.
- Azman, M.A., et al., 2022. How technological, environmental and managerial performance contribute to the productivity change of Malaysian construction firms. Engineering, construction and architectural management.
- Azman, M.A., et al., 2023. The impact of the change in institutional regulation on construction productivity: firm-level evidence in a developing economy. Construction management and economics. DOI: 10.1080/01446193.2023.2227286.
- Baily, M.N., et al., 1992. Productivity dynamics in manufacturing plants. Brookings papers on economic activity. Microeconomics, 1992, 187–267.
- Bank of Indonesia 2019. Loan to value of collateral for property credit and consumption purpose. Jakarta, Indonesia: Bank of Indonesia.
- Bernini, C., and Pellegrini, G., 2011. How are growth and productivity in private firms affected by public subsidy? Evidence from a regional policy. Regional science and urban economics, 41 (3), 253–265.
- Bournakis, I., and Mallick, S., 2018. Tfp estimation at firm level: the fiscal aspect of productivity convergence in the UK. Economic modelling, 70, 579–590.
- Camino‐Mogro, S., and Bermudez‐Barrezueta, N., 2021. Productivity determinants in the construction sector in emerging country: new evidence from Ecuadorian firms. Review of development economics, 25 (4), 2391–2413.
- Cruz, P.C.R., 2008. Transaction costs and housing affordability in Asia. International real estate review, 11 (1), 128–150.
- Dahya, J., and McConnell, J.J., 2005. Outside directors and corporate board decisions. Journal of corporate finance, 11 (1–2), 37–60.
- Dias, D.A., and Marques, C.R., 2021. From micro to macro: a note on the analysis of aggregate productivity dynamics using firm-level data. Journal of productivity analysis, 56 (1), 1–14.
- Dixit, S., et al., 2019. Evolution of studies in construction productivity: a systematic literature review (2006–2017). Ain Shams engineering journal, 10 (3), 555–564.
- Federal Reserve Bank. 2019. Real residential prices for Indonesia. St Louis, USA: Federal Reserve Bank of St Louis.
- Global Construction Review. 2019. Indonesia hits million-home target for first time in 2018, Global Construction Review News. Chartered Institute of Building.
- Goldblum, C., and Wong, T.-C., 2000. Growth, crisis and spatial change: a study of haphazard urbanisation in Jakarta, Indonesia. Land use policy, 17 (1), 29–37.
- Hoang, V.-N., Raharjo, J.P., and Susilawati, C., 2022. Meta-frontier efficiency analysis of real estate and construction firms in Indonesia. Construction management and economics, 40(10), 1–11.
- Hsieh, C.-T., and Moretti, E., 2019. Housing constraints and spatial misallocation. American economic journal: macroeconomics, 11 (2), 1–39.
- Hutapea, E., 2019. Backlog Rumah 7,6 Juta Unit [Housing shortage is 7.6 million units] [in Bahasa Indonesia]. Kompas: Kompas properti.
- Indonesia Statistic, 2017. Population projection by province period 2010–2035. Jakarta, Indonesia: Indonesia Bureau Statistic.
- Kapelko, M., and Abbott, M. 2017. Productivity Growth and Business Cycles: Case Study of the Spanish Construction Industry. Journal of Construction Engineering and Management, 143 (5), Article 05016026.
- Lee, Y.S., Kim, J.-J., and Lee, T.S., 2016. Measuring productivity changes in the Korean construction management industry. KSCE Journal of Civil Engineering, 20, 2154–2161.
- Melitz, M.J., and Polanec, S., 2015. Dynamic Olley‐Pakes productivity decomposition with entry and exit. The RAND Journal of Economics, 46 (2), 362–375.
- Monkkonen, P., 2013. Urban land-use regulations and housing markets in developing countries: evidence from Indonesia on the importance of enforcement. Land Use Policy, 34, 255–264.
- Nabavieh, A., et al., 2019. Assessing productivity changes using the bootstrapped Malmquist index: the case study of the Iranian construction industry. In: International conference on industrial engineering and operations management. Bangkok, Thailand.
- O’Donnell, C. J. 2012. An aggregate quantity framework for measuring and decomposing productivity change. Journal of productivity analysis, 38(3), 255–272.
- O’Donnell, C.J., 2016. Using information about technologies, markets and firm behaviour to decompose a proper productivity index. Journal of econometrics, 190 (2), 328–340.
- O’Donnell, C.J., Fallah-Fini, S., and Triantis, K., 2017. Measuring and analysing productivity change in a metafrontier framework. Journal of productivity analysis, 47 (2), 117–128.
- O'Donnell, C. J., 2018. Productivity and efficiency analysis an economic approach to measuring and explaining managerial performance. Singapore: Springer Singapore.
- Oikarinen, E., 2009. Interaction between housing prices and household borrowing: the Finnish case. Journal of banking & finance, 33 (4), 747–756.
- Pitoko, R. A., 2016. Bantah Bps, Pengamat Bilang 'Backlog’ Rumah Bertambah Menjadi 15.7 Juta [Arguing with Indonesia Statistic Board, the observer said the housing backlog becomes 15.7 million] [in Bahasa]. Kompas: Kompas properti.
- Prawira, G.A., 2014. Pengendalian proyek dengan metode keseimbangan garis (line of balance) [Supervising the project using line of balance method] [Bahasa Indonesia]. Jurnal teknik sipil USU, 3 (1), 1–12.
- Qi, W. and Jia, S., 2010. The empirical study on productivity of Chinese real estate enterprises based on DEA-based Malmquist model. In: Second International Conference on Communication Systems, Networks and Applications. Hong Kong, China: IEEE, 248–251.
- Rahmawati, D., and Rukmana, D., 2022. The financialization of housing in Indonesia: actors and their roles in the transformation of housing production. Cities, 131, Article 103918. https://doi.org/10.1016/j.cities.2022.103918
- Ramadhiani, A., 2016. "Bangun Rumah Mewah, Margin Pengembang 100-1000 Persen [Build the luxurious houses, the developer’s profit margin is 100-1000%].[in Bahasa]. Kompas property. Kompas.
- Rukmana, D., 2018. Upgrading housing settlement for the urban poor in Indonesia: an analysis of the Kampung Deret Program. In: B. Grant, C. Liu, L. Ye, eds. Metropolitan governance in Asia and the Pacific rim: borders, challenges, futures, 75–94.
- Samad, D., et al., 2017. Malaysian affordability housing policies revisited. Open house international, 42 (1), 44–51.
- Susilawati, C., 2018. Housing policy and social development in Indonesia. Housing policy, wellbeing and social development in Asia (Routledge Studies in International Real Estate). New York: Routledge, 226–249.
- Tarigan, S. G., 2017. Housing, homeownership and labour market change in greater Jakarta, Indonesia [PhD Thesis]. Newcastle University.
- Wai-Poi, M. G., et al., 2019. Aspiring Indonesia-expanding the middle class. Washington, DC: The World Bank.
- Wang, X., et al. 2013. A total factor productivity measure for the construction industry and analysis of its spatial difference: A case study in China. Construction Management and Economics, 31(10), 1059–1071.
- Wang, Y., et al., 2021. Total factor productivity growth and its decomposition in the Chinese construction industry since China’s accession to the world trade organization. Engineering, Construction and Architectural Management, 29(3), 1258–1283.
- Wang, Y., et al., 2022. Total factor productivity growth and its decomposition in the Chinese construction industry since China’s accession to the World Trade Organization. Engineering, Construction, and Architectural Management, 29(3), 1258–1283.
- Xue, X., et al., 2008. Measuring the Productivity of the Construction Industry in China by Using DEABased Malmquist Productivity Indices. Journal of Construction Engineering and Management, 134, 64–71.
- Zheng, J., Han, X., and Pan, Z., 2013. Analysis on TFP growth and convergence in real estate development companies based on Malmquist index method. China Soft Science, 3, 141–151.