
 ?Mathematical formulae have been encoded as MathML and are displayed in this HTML version using MathJax in order to improve their display. Uncheck the box to turn MathJax off. This feature requires Javascript. Click on a formula to zoom.
ABSTRACT
Millions of people use mobile map applications like Google Maps on a regular basis. However, despite these applications' ubiquity, the literature contains very little information about how these applications are used in the real world. As such, many researchers and practitioners seeking to improve mobile map applications may not be able to identify important challenges and may miss major opportunities for innovation. To address this paucity of usage information, we collected and analysed data during unsupervised usage of Google Maps by replacing the standard application with a wrapped version called MapRecorder. In two studies we recorded data from locals and tourists using our application and collected over 580 minutes of actual application usage from 34 users, spanning 555 unique sessions. We identify typical usage scenarios, observe a large amount of map exploration and elucidate generalisable interaction patterns.
1. Introduction & motivation
Mobile map applications like Google Maps are extremely popular. For instance, the annual ComScore report on application usage in the United States indicates that Google Maps is the fifth-most-used mobile application (Frommer Citation2017). Other studies have found Google Maps to be the fourth-most-used application in terms of total usage time (Böhmer et al. Citation2011). And while Google Maps is the most widely used, other mobile map applications like Apple Maps, Waze or OpenStreetMap are popular alternatives featuring similar user interfaces and functionality. However, while we know that mobile map applications are used quite often, we know very little about how they are used. For instance, what is the most prominent action users take within these applications? Are there reoccurring interaction patterns? How are they making use of the search functionality? Do different user groups show different kinds of behaviour?
Usage data from commercial providers is not publicly available, and this situation is likely to persist owing to the extensive competitive and privacy concerns associated with releasing this type of information.
Outside of the mobile map space, HCI studies that examine foundational application usage behaviour have received extensive attention thanks to the research and design guidance they afford. These studies help not only to understand general smartphone and application usage (Böhmer et al. Citation2011; Hintze et al. Citation2017) but shed light on specific domains like information search (Kamvar and Baluja Citation2006; Chua, Balkunje, and Goh Citation2011; Carrascal and Church Citation2015) and notifications (Pielot, Church, and de Oliveira Citation2014). This paper seeks to extend the benefits of this literature to the important and prominent domain of mobile map applications. To do so, we take inspiration from Carrascal and Church (Carrascal and Church Citation2015) who used an in-situ approach to investigate mobile search application behaviour from 18 participants by creating an application which acted as a ‘wrapper’ for a popular search engine on Android. We developed such a ‘wrapper’ application for Google Maps called MapRecorder which ‘wraps’ the Google Maps mobile website. This allows researchers to capture rich behavioural logs while affording a very similar experience to the standard application. We performed two separate studies. The first study took place in Bremen, Germany and was conducted with 28 local participants who used MapRecorder for four weeks. We captured 483 minutes of interaction with MapRecorder across 443 sessions. The second study took place in Madeira, Portugal, and was conducted with 6 cruise-ship tourists (non-locals) who used MapRecorder for one day. We captured 97 minutes of interaction with MapRecorder across 112 sessions. We analysed usage across the four main interaction states of Google Maps: Search, Place, Direction and Map-View Manipulation.
Our main finding is the prevalence of exploratory behaviour in the form of panning and zooming, supporting the notion of ‘user-as-explorer’ (Hecht et al. Citation2012; Bellino Citation2015) in mobile map applications. Indeed, this exploratory behaviour made up more than 60% of users usage time with MapRecorder in both studies. As we discuss below, this may have important implications for the development of mobile maps which currently focus mostly on text search to enable way finding rather than geographic exploration. As our results show, mobile maps are no longer just a means to get directions from A to B but enable users to find information about their surroundings in an exploratory fashion.
Besides our results associated with exploration, we also noticed a number of other behaviour patterns with significant potential design implications. For instance, we observed that search behaviours demonstrated a clear preference for named places (e.g. a specific restaurant) rather than entity classes such as ‘restaurants’ or other near me options. Our findings also suggest that users exhibit similar patterns of use in order to get directions to a specific location with a high percentage of sessions displaying specific transitions across usage states within the map application.
We provide the anonymised data set upon request. Please contact the first author.
2. Related work
Descriptive studies of smartphone and smartphone-app usage behaviour have been of interest to the HCI community since the inception of smartphones. While some studies focus more on the evaluation of general mobile phone usage throughout users daily life (e.g. time of day of use, location of use, length of usage session) (Böhmer et al. Citation2011; Chua, Balkunje, and Goh Citation2011; McGregor, Brown, and McMillan Citation2014; Church et al. Citation2015; Bhavnani et al. Citation2017), others are more concerned with more technical analyses about the time and overuse (Lee et al. Citation2014) as well as the impact of network and energy usage (Falaki et al. Citation2010; Widdicks et al. Citation2017) of mobile phones. Further work in this area covers the categorisation of different types of interactions (Banovic et al. Citation2014; Hintze et al. Citation2017), analysis and prediction of interaction patterns (Shin, Hong, and Dey Citation2012; Srinivasan et al. Citation2014), privacy and security (Ferreira et al. Citation2015), notifications (Pielot, Church, and de Oliveira Citation2014; Sahami Shirazi et al. Citation2014) or other types of usage contexts (sometimes including qualitative user data) (Nakhimovsky et al. Citation2010).
However, few studies have engaged in descriptive analyses of within-application usage (Carrascal and Church Citation2015). The lack of information about how people interact with applications is due, at least in part, to the understandable hesitancy of developers to release this information. This hesitancy is compounded by the challenges inherent in outside parties attempting to collect organic, unbiased within-application usage information (Church et al. Citation2015).
In the sections below, we review in more detail the literature that helped motivate our methodological choices while being an external party attempting to collect high-quality within-application usage data. More importantly we provide our motivation for collecting information about mobile map usage behaviour in the first place, as we show that studying map usage behaviour has already been done in the era of paper maps and still holds its justification in the mobile age, even though or rather because publicly available data in this domain is very scarce.
2.1. Collecting usage behaviour
User testing of novel application designs provides useful information when developing new products, but these test cases are usually conducted in a controlled environment to discover glitches before a product is released. In comparison, unsupervised usage data collection occurs naturally, with organic situations and outcomes, but can be difficult to organise and collect (Church, Cherubini, and Oliver Citation2014; Church et al. Citation2015). To give a widespread example of unsupervised usage data collection, commercially provided data such as Google Analytics can provide detailed information about items such as site visits or page views, and thus can be used to infer some details on unsupervised use – such as examining the usability of E-Commerce sites (Hasan, Morris, and Probets Citation2009).
An application-specific study which was successful in collecting unsupervised usage data was developed by Lettner and Holzmann (Citation2012) to examine screen-to-screen navigation within applications and identify navigation errors. This method was able to provide the developers with a large amount of naturalistic data and some usability insights, but only works for those applications where between-screen navigation is used, and does not collect associated data, so has limited use in other contexts.
A larger data set was analysed by Böhmer et al. (Citation2011) (4125 users over 163 days) with over 22,000 sessions of application usage recorded. As with Do, Blom, and Gatica-Perez (Citation2011), a logging application was developed and deployed so as not to interfere with the general user experience. Data such as local time and location was collected, in addition to the time an app was open and previous app interaction. Within this data set, Google Maps usage was collected and was shown to be the fourth-most-used application in terms of time spent in-app, and although a peak in early evening usage suggested peaks in user engagement, no in-app behaviour data could be collected.
In contrast to the large-scale application studies, single application usage behaviour has also generated a lot of interest (e.g. McMillan et al. Citation2010). Here, the redesign and deployment of a Windows PDA game onto a new mobile platform was investigated using in-app communication with users, as well as evaluations taken from social media sites. As the developers, the in-app access was unbarred, and this freedom was used to gather complex data about the game Hungry Yoshi and its users, although most researchers do not have this luxury.
An alternative to gather application usage data requires an additional programme to ‘contain’ the application in question and run in the background while normal use occurs. The data collected by such studies is also of high quality (in comparison to the above), and allows us to get a glimpse of what happens whilst the user is interacting with the application. The in-situ approach used by Carrascal and Church investigated mobile search application behaviour by creating an application which acted as a ‘wrapper’ for a popular search engine on Android. The resulting logged data of the application from 18 users, together with qualitative interviews and a daily on-line diary over the course of two weeks revealed how this data can be used to enrich the mobile search experience and help users complete their information search (Carrascal and Church Citation2015).
2.2. Map usage
Although there is limited information about interaction with mobile map applications, the study of user engagement with maps has already been a subject of research back in the era of paper maps. In 1987, Blades and Spencer (Blades and Spencer Citation1987) wrote a review about some of the current research on maps designed for navigation. Despite of the importance of these maps themselves, they acknowledged the little research that had been done on how people actually use them. Blades and Spencer were mainly concerned with the cognitive abilities that go into using a map for way finding and the usability of the map itself but highlight the lack of empirical studies that produce sufficient data on everyday map use to make these analyses.
The current situation does not look different. There are only a few studies that have sought to understand how people interact with mobile maps and these have been limited to in-situ recording, self-reporting, corpus analysis of offline data sets, or do not produce in-app usage data. Methods such as self-reporting and taking screenshots during normal use produced a valuable overview of issues with navigation (in particular when driving) for Google Maps (Nakhimovsky et al. Citation2010), but this data was limited to analysis of user behaviour and comments as a result of application usage, and did not record the issue in real time.
Corpus analysis has proven valuable in identifying feature gaps in map applications from analysis of themes common in catastrophic accidents (Lin et al. Citation2017), and can identify omissions in particular map areas. These themes also enable application developers to generate new routeing software which takes into account features such as inclement weather and improving instruction quality, however – although there is no real-time usage data of the application to provide detailed analysis of user behaviour, this work shows the value of studying user behaviour to identify patterns.
Of the literature reviewed, the most in depth analysis of Google Maps (or any other map application) was conducted by Google, but as a result, only limited data was shared with the research community (Riegelsberger and Nakhimovsky Citation2008). As developers, they had unparalleled access to user data, and used their findings to improve the Google Maps experience. To collect the data, 24 participants (from four countries) were recruited from a pool of volunteers, and paid to use a version of the main application for a period of two weeks. The data collection also included a qualitative component (as with Carrascal and Church Citation2015) of telephone interviews and a debriefing session in order to understand particular usage behaviours during the study period. With this being the first field study that investigated Google Maps usage they were able to understand ‘real’ goals of users which they could address in the interviews and ‘real’ intervening factors that could be addressed by future design changes. This highlights the benefits of collecting ‘real’, organic data to identify ‘real’ problems and characteristics of mobile map usage behaviour.
Although the previous work is the most comprehensive view of Google Maps to date, it was not a completely unsupervised data collection, and focused on a now outdated version of the application (2007). The above paragraphs highlight a need for current, detailed, usage data for mobile map applications from real-world usage which can only be obtained by tracking in-app behaviours from unsupervised users. We use Google Maps in the mobile environment to gather unsupervised usage data as it is not only the fourth-most-popular application (Frommer Citation2017), but it is the most used mobile map application within our two samples. We follow the naturalistic application use in order to provide an in-depth analysis of mobile map application behaviour with which we can enhance our understanding of this type of app and suggest implications for the ongoing design and development of the navigation and exploration experience.
3. Experimental studies
In order to answer the questions posed in the introduction this paper presents two studies. Study 1 was conducted in Bremen, Germany with 28 local participants over the course of four weeks using our MapRecorder application. Study 2 was conducted in Madeira, Portugal with 6 tourists (non-locals) during a period of one week using the MapRecorder application. The following section will describe both study designs and their differences.
Study 1 employed a three-stage process in order to collect mobile map application data involving a large-scale pre-survey, the use of our ‘wrapper’ application MapRecorder and a qualitative interview at the end. Study 2 did not include any interviews and had a post-survey after the use of the MapRecorder application.
The details of participant recruitment, the design of MapRecorder and its functions as well as the design of the interview are described in the following sections.
3.1. Survey & participant recruitment
3.1.1. Study 1
Online survey participants (n=159) were recruited via the university's social media sites (Facebook and Twitter), by word of mouth, and from internal advertising. Our survey comprised of five sections and covered basic demographic data, type of smartphone, map application preference, how often the map application was used, and what it was used for (e.g. getting directions, searching for the location of a place).
At the end of the survey, participants were invited to sign up for the user-study by downloading the MapRecorder application. As iOS was the preferred operating system among survey participants they then received a link to download MapRecorder from the Apple App Store and were asked to use the app for all of their mobile map-needs for the next four weeks. Participants who signed up and completed the MapRecorder study were given a 20 Euro voucher.
159 participants completed the survey and 49 downloaded and installed the MapRecorder application and used it at least once. To ensure a valid comparison between the two different user groups (locals and tourists) and to only count ‘active’ users, we filtered out non-local participants and participants with less than five sessions in the study period. In total, 28 participants (15 male and 13 female) from the local area (within 100 km from the university) between the ages of 20 and 47 completed the survey and used the MapRecorder application regularly until the end of the study period (which they were reminded of one week in advance). The data of these 28 participants was later on used in the analysis. The consent to take part in the study and data collection was given on the splash screen of the MapRecorder application at its first launch. After the experiment eight participants agreed to a follow up interview.
3.1.2. Study 2
Six cruise ship tourists (4 male and 2 female) between the ages of 38 and 58 were recruited on three different days (arrival days of the cruise-ships) within the week the experiment was conducted. Since they spent only up to a day on the island and had the cruise ship as a fixed start and end point of their visit, they made for the ideal tourist group to approach. After they agreed to take part in the study and data collection, by signing a consent form, they could choose a device with their preferred operating system (iOS or Android, as we were not able to determine their preferred operating system beforehand) with the MapRecorder application already installed. They were then free to explore the island on their own terms. The average day trip during which they used the application lasted 4 hours and 15 minutes (sd: 86 minutes) and was mainly taking place in the capital Funchal. Upon return they handed back the smartphone. At the end of the experiment they were asked to fill out a survey which comprised of three sections and covered basic demographic data, map application preference, how often the map application was used, what it was used for (e.g. getting directions, searching for the location of a place) and whether they use their map application differently on vacation.
Our sample, usage period and methodology are in line with other influential studies which explore similar user behaviours and are documented at prominent HCI conferences. We ensure that we have sufficient participant numbers to be able to make sound inferences about the data as with (Rahmati and Zhong Citation2013; Baltrunas et al. Citation2015; Carrascal and Church Citation2015), and that the study period covers at least several weeks to gain an accurate overview of what constitutes regular use (Böhmer et al. Citation2011; Do, Blom, and Gatica-Perez Citation2011).
3.2. MapRecorder application
In order to collect detailed, organic user behaviour data we designed and developed a mobile application called MapRecorder. As noted above, MapRecorder is a ‘wrapper’ application that allows users to interact with the Google Maps website as normal and unobtrusively records usage data. We make use of the WebView class provided by the Android and iOS SDK respectively to display the Google Maps website within our MapRecorder application. This allows us to deliver the same user experience as the original website and at the same time record device and website data as described in the next sections.
MapRecorder was built to run on iOS and Android devices and allows the Google Maps web-interface to be shown in full screen. A session with a unique ID is generated from the time the application is opened until it is sent to the background, and the resulting session data is sent to a remotely hosted server.
3.3. Logged data & interaction
The MapRecorder application is able to record the following information for each session (a session is defined from the time the user opens the application until the time it is sent to the background):
Unique session ID,
User ID
Device information: Phone type (e.g. iPhone 6S), resolution (e.g. 667 x 375), network connection type (e.g. GSM or Wi-Fi)
Start of a session (as a timestamp)
Duration of a session
URL
Timestamped interaction with the device: Compass orientation, device orientation (portrait/landscape), coordinates of touch-points on the screen, type of the touch interaction (e.g. pinch, tap), keyboard input
Timestamped interactions with the map (e.g. change in zoom level, current centre point of the map, current position of the user)
With this information we can subdivide the interaction with the mobile map application into four main states (see ) that also correspond to the main roles and functions of maps in general as described in Kraak and Ormeling (Citation2011), Perkins (Citation2003), Kraak (Citation1998). Therefore we subdivided the interaction with the mobile map application into Search, Place, Directions and Map-View Manipulation corresponding to traditional GIS functionality such as answering questions like ‘where is … ’, ‘what is … ’, ‘what is the shortest route between … ’ and ‘exploration’ (Kraak Citation1998; Kraak and Ormeling Citation2011). In our framework the Search state starts from the time the user starts typing a search query, until the time that they are redirected to a result, either by choosing one of Google's autocomplete results or by immediate redirection. The Place state covers the time after a user has clicked on a place icon on the map or has been redirected to a place (e.g. a restaurant or a neighbourhood) after a search. The user leaves the Place state when they either click on the map directly (discarding the place information) or they begin the directions to a place, which triggers the Directions state. During the Directions state the user is able to look up routes between a start and goal location. Users enter this state by either clicking on the directions button in the lower right corner of the application, or requesting directions whilst in the Place state. Users remain in this state as long as they interact or view the route or a route description, or as long as a start and destination is chosen. It is important to note that it is not possible to use the in-app navigation within MapRecorder since the mobile web version of Google Maps does not allow for it. On requesting navigation users get redirected to their natively installed version of Google Maps thus navigation could not be tracked. The state of Map-View Manipulation includes all interactions that are needed to manipulate the map view, e.g. panning, zooming and viewing the map.
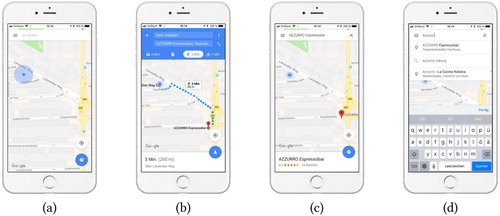
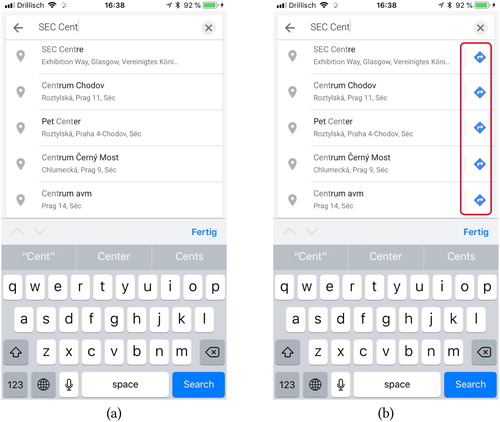
Figure 1. Screenshots of the MapRecorder application for each of the states: Map-View Manipulation (a), Directions (b), Place (c) and Search (d). Map data and image © 2019 Google.
3.4. Interviews
Study 1 included a semi-structured interview after the experiment with participants who have agreed to take part in a follow-up interview. With the help of a semi-structured interview guide the participants were asked questions about their behaviours and habits regarding their use of online maps and the patterns that became apparent through the map recording. This semi-structured guide allowed an open approach to the participants and their statements but also offered a focus to keep in mind while conducting the interviews. The interview guide, therefore, covered six aspects: (1) Personal background, (2) map use, (3) perception of space, (4) linking to other services, (5) data privacy and (6) views and opinions. The participants gave permission for the interviews to be recorded and transcribed. In total, eight participants agreed and were interviewed for 15 minutes each via phone or Skype. The interviews were then transcribed and evaluated by two coders. Significant statements were paraphrased, coded and analysed. Study 2 did not include any interviews.
4. Results
This section presents the results of both study 1 and study 2 separately. Study 1 presents a study with 28 participants and focuses on how local users use mobile map applications over a period of four weeks. We exhibit that locals in our study show a high percentage of map exploration, a tendency to search for specific places instead of entity classes and that they utilise specific usage patterns within the application as well as other user behaviours. Study 2 on the other hand presents a study with 6 participants that tries to understand the mobile map usage behaviour of tourists. We find a lot of overlap in the results of both groups but cannot find indicators for usage patterns in tourist's usage behaviour.
4.1. Study 1
The results for the preliminary survey and the MapRecorder analysis are outlined below providing a statistical overview of the study, as well as describing the user-states identified within the Google Maps application (e.g. Map-View Manipulation, Directions, Place and Search). This is followed by an analysis of patterns of interaction between those states and a detailed breakdown and analysis of specific findings for each state.
4.1.1. Online survey
The survey recruited 159 participants between 19 and 65 years of age (average: 28). Ninety of the participants were students and other occupation types ranged from journalists, to nurses and engineers. Over 61% of respondents were from Germany (98 people) and device type was split between three types of operating systems with the most popular being iPhone (49%) and Android (48%). The results indicate that Google Maps was the preferred map application with nearly 80% of users favouring it over its competitors such as Apple Maps (14.5%) or Waze (around 2%) amongst others. Within the subset of iPhone users, exactly two thirds chose Google Maps as their preferred map app, despite the availability of the iOS native Apple Maps. We see the same trends in our smaller MapRecorder user group which utilised the application throughout the study period.
For general map application usage, 11.3% of participants reported that they use a mobile map application every day, 39% use it multiple times in a week, 27% use it only a few times a week, 19.5% use it only a few times a month and 3.2% use it very infrequently. This high usage pattern is consistent with recently measured map application popularity (Frommer Citation2017). The reasons given for using the applications were (in order of popularity): to search for a location or place (86.1%), for walking directions (83.6%), for driving directions (71.7%), to explore the map (50.9%), or to get public transportation directions (49.7%). Of these 159, 28 (15 male and 13 female) were local users (within 100 km from the university) between the ages of 20 and 47 (avg: 30) who used the application more than five times during the study period. These 28 participants were used for the following data analysis. Twenty-two of them were university students from different subjects, the remaining participants came from a variety of disciplines.
4.1.2. Overview of MapRecorder data
In total 443 sessions were recorded for 28 participants, resulting in 483 minutes of total application usage time. This corresponds to an average of 15 (median: 11) sessions and 17 (median: 8.6) minutes per participant over the study period. The average application session lasted 65 (median: 44) seconds (similar to the 71.56 second average found in Böhmer et al. (Citation2011)), with a range of 3–751 seconds. In the following sections we first analyse the high-level user-data, looking at how the previously defined usage-states are distributed across users and user-sessions. We then provide insights into the usage-patterns that can be observed between users. We also present analyses of the four usage states individually as well as examining other user preferences and interests.
4.1.3. Overview of interaction states
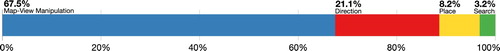
When analysing the average session states (Map-View Manipulation, Directions, Place and Search), we found that users spent around 67.5% of the length of a session in the Map-View Manipulation (M) state, 21.1% in the Directions (D) state, 8.2% in the Place (P) state and the remaining 3.2% in the Search (S) state. The average session states for all users can be seen in Figure .
Figure 2. Distribution of map usage states averaged over all users (study 1).
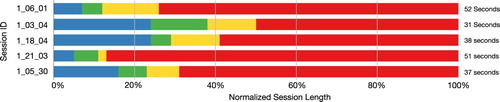
Further analysis revealed a repeating usage pattern across sessions by different users across the data set. When looking at the user transition between states, we discovered that MSPD (Map-View Manipulation–Search–Place–Directions) is a typical session pattern. An example of MSPD session data is shown in . The two most common sequences were MSPD (12.1% of all sessions – 54/443) and MD (13% of all sessions – 58/443), indicating that at least 25.1% of all sessions resulted in getting directions.
Figure 3. Example MSPD sessions. From left to right: Map-View Manipulation (Blue), Search (Green), Place (Yellow), Directions (Red). The session ID is composed of: Study_ParticipantID_SessionID.
In the case of the MSPD pattern, users typically started by examining the map for a short amount of time (M). This ranged from a few seconds (for example thinking about their search term) to 20+ seconds of proper map interaction including touch input. They then began to enter a query into the search bar (S). After issuing the search request they then got directed to the place that they were searching for (P). Finally, they use the directions button to bring up directions menu for the currently active place (D), usually with their current location set as the origin.
To explore additional user interactions, we also plotted a typical MSPD session (session 30 from user #5) with annotations including the zoom levels (automatic/user) and URL data (e.g. mode of transport) in . This is indicative of a typical user session with Google Maps from our data. The graph shows how the automatic changes (dotted lines) in zoom levels are co-located with the state transitions. Transitioning from Search to Place automatically redirects the centre point of the map to the searched location, and then adjusts the zoom level as necessary to fit the content of the screen. Google tries to estimate zoom levels according to the area around a certain place, or according to the distance between two locations (e.g. automatically zooming out for places that are further apart). Users also sometimes manually adjust these zoom levels which is indicated by the solid lines.
Figure 4. Usage-session annotated with zoom level; user 5 session 30.
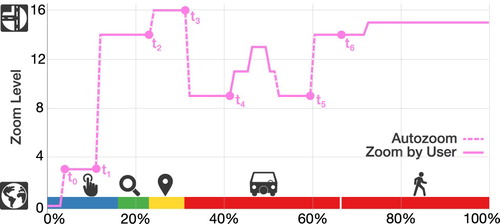
shows the following interactions: (1) After loading the map (), the default location of Google Maps is displayed –
indicates the time at which the application locates the users' position and automatically redirects the centre point of the map towards them; (2) The user issuing a search query results in a place (
) and the app again auto-zooms and pans toward that location; (3) Timestamp
indicates the point at which the user touches the ‘directions’ button, and thus requests directions to the chosen place (resulting again in an automatic zoom and map adjustment to match the route); (4)
demonstrates a short time frame within which the user manually adjusted the zoom level; (5) The user then changes the start and endpoint of the route, and the map automatically adjusts again (
); (6) At
the user changed the mode of transportation from car to foot, and finished the session by zooming in, probably to get a better look at the exact route.
4.1.4. Map-View Manipulation analysis
Map-View Manipulation yields the highest average usage time of any state during the study (67.5%). The data collected for this includes panning, zooming, ‘glancing’ and map loading times (the latter accounting for 7.6% of all sessions). This shows that users are generally interested in exploring the map in an organic manner (Hecht et al. Citation2012; Bellino Citation2015). MapRecorder is able to log the zoom level of a session as well as the various centre points throughout the session from which we are able to infer panning behaviour. For these behaviours, it is difficult to distinguish between (1) zooming/panning behaviour by the system and (2) zooming/panning behaviour of the user, but we are able to infer individual incidences of this behaviour (as in ).
We discovered that 221 sessions out of 443 only contained the Map-View Manipulation state. In 167 of these cases, participants simply used panning and zooming to explore the surroundings, but we were able to record an average of 290 touch events (user making contact with the screen) per session. Further, 54/221 sessions did not contain any touch events and 20 of those we classify as glances, meaning that users reopened a session shortly after sending it to the background and glanced at the map without additional interaction.
4.1.5. Directions analysis
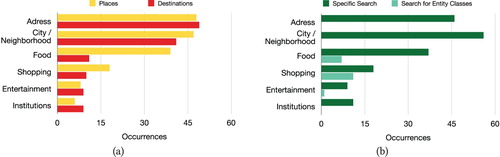
Although users were not able to use the in-app navigation in our wrapped version of Google Maps, Directions was the second most frequently used state (21.1%) apart from Map-View Manipulation (requesting navigation redirected users to their own installed version of Google Maps). This shows that our participants were using it to inquire about distances and modes of transportation between two locations. We analysed and categorised the destinations for which users requested directions to get an overview of the types of destination that users were interested in ((a)). We used Google's Places API to generate low level categories for each of the destinations and summarised these into six top level categories: street addresses, city/neighbourhood, food, shopping, entertainment and institutions. Almost 70% of all destinations were categorised as street addresses or city/neighbourhood as can be seen in .
Figure 5. Total occurrences of places and destinations (a), Total occurrence of specific- and entity class searches (b).
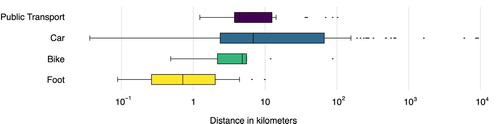
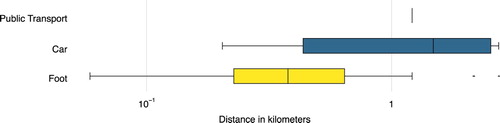
Additionally, we were able to observe the preferred mode of transportation from the URL between two locations. shows that the Car routeing seems to be used for most distances (median: 6.86 km), with motorised transportation of all types being increasingly chosen for trips over longer distances.
Figure 6. Relation of distance and mode of transportation.
4.1.6. Place analysis
In our data set, 8.2% of the average interaction time was related to places (). After categorising the individual places (in the same manner as presented above) we found that most places referred to specific street addresses and city/neighbourhood names, followed by food related places like restaurants and cafes. The categories shopping, entertainment and institutions (in this order) were also popular places users explored (see (a)).
We also explored the distance of places that users were interested in. The median distance from the place users were examining compared to their current location was 8.02 kilometres. This rules out immediate walking distance as an option (walking 8km takes an average of 100 minutes), but as a large number of the locations studied lie within 100 kilometres we consider this being in the local area.
4.1.7. Search analysis
MapRecorder is able to log the character-by-character input for search queries. This allows us to analyse not only what participants search for, but also their general search behaviour patterns. As Search in most cases acts simply as a means to reach the users' goal or point of interest on the map, it accounts only for a small part of the session time – but this is still an integral part of the Google Maps experience – as Search was used in every second session. In our data the search behaviour accounts for 3.2% of the total recorded time ().
To examine the semantics of search behaviour, we evaluated all 254 search queries contained within our data set (see (b)) and categorised them into specific search types (address, Antonio's Pizzeria, etc.), and entity classes (restaurant, hotel near me, etc.). We discovered our users made 220 specific searches, and 29 entity class searches, which suggests that users typically knew the name of the place they were looking for in advance, but since our sample was local to the area, we would expect the number of entity class searches to be low (locals have existing knowledge of particular locations). Additional investigation also revealed that 162 of all searches made use of the autocomplete function, meaning that Google Maps is successfully pre-empting the users' input in more than 50% of all searches.
Finally, we take a look at the differences and connections between the Search, Place and Directions categories from . Since we have found a very prominent usage pattern we wanted to see what conclusions we can draw with the MSPD usage pattern in mind. Generally, all the occurrences in the categories between the states overlap rather well, which is what we assume because of the MSPD pattern. A search term results in a place, which then gets chosen as the destination for directions. But for some of the categories we see differences. Most interestingly, in the food category a place does not usually result in a destination. This could be explained by the nature of how Google Maps displays information about restaurants. Things like opening hours, the menu and reviews can be enough of a reason to look at a place without the immediate need to look at directions for it.
4.1.8. Interviews
The qualitative content analysis of the eight interviews showed three topics to be significant in using mobile maps: (1) Additional benefits in using Google Maps, (2) triangulation of navigation options and (3) data security. Interviewees described several features of Google Maps as particularly useful in addition to the actual navigation services. These were real-time information on traffic and traffic jams, reviews for restaurants, bars and the option to, for example, look at their websites and menus directly, information on public transport and exploring places as in mobile sightseeing tours, e.g.‘[I also use Google] if I'm just looking for the nearest ATM or a good restaurant. [ … ] And then you can immediately have a look at reviews and stuff’ (ID 1_03).
While Interviewees appreciated the benefits of using Google Maps, they simultaneously expressed a mistrust of traditional navigation systems (such as in-built car navigation software). As a consequence, they perform a triangular navigation when planning a trip: They use traditional maps, navigation apps on mobile devices and plan the route beforehand using a navigation web-service on a computer in order to check that the options given are optimal, e.g.‘So, in the car I have a TomTom. [ … ] I then use Google in between because sometimes the routes are a little different or you want to see if actually the map is the way the navigation system sends you and if it makes any sense’ (ID 1_19). If participants have local knowledge, they will also juxtapose their own past navigation experiences with information currently received through the devices mentioned.
A third theme which transpired through the interview material is that of data security. Especially tracking services were considered with a degree of ambivalence. On the one hand, they simplify navigation and support participants in their everyday life. On the other hand, the participants are not certain that their data is handled in an ethical and responsible way, e.g. ‘I'm really bickering about the insane support I have through such [navigation apps] and the loss of self-control and that feeling of being remotely controlled’ (ID 1_26). Interestingly, we found two re-occurring story lines in the interview data: People had either ‘given up’ and tried not to think about their digital traces any longer. Or alternatively, they were engaging in some form of a resistance or ‘minimal data’-strategy by activating the geolocation service as little as possible. Thinking about current and future development within the realm of mobility brought similar results regarding a sense of ambivalence and ultimately, for some of our interview partners, raised questions around freedom, decision making and possible mismatch of information they needed to make informed choices and information withheld by a variety of agents.
4.1.9. Summary
Our analysis outlines a combination of high and low-level findings, highlighting usage patterns that occur repeatedly throughout the data set. We have shown a coherent model of an example session that demonstrates the range of data that the MapRecorder application is able to collect (). We also show how the different characteristics of each state within Google Maps are linked through the usage patterns that we identified during the study period. It is apparent that the most used – and maybe therefore most interesting – interaction is the Map-View Manipulation. This challenges our notions of prescriptive user behaviour in navigating with online maps. From the interviews we learn that users intentions and behaviour are not only driven by in-app factors but are also influenced by secondary factors like trust and security. How we can utilise these results, and what the implications of the findings are, is explored in the discussion.
4.2. Study 2
The results of study 2 are presented in the same order as the results of study 1. We describe the survey results and the analysis of the MapRecorder data, provide a statistical overview over the study and as before the usage data is classified according to the usage states (M, D, P, S). Even though we compare some of the results from study 1 with the results of study 2, it is important to keep in mind that study 1 focused on local users using the application over a four week period whereas study 2 investigated non-locals' behaviour over one day of application usage.
4.2.1. Survey
The survey was taken by all 6 participants whose age ranged between 38 and 58 years (average: 52) with the occupations of electrical engineer, druggist, clerk and plumber. Five respondents were from Germany and one from Switzerland (all German speaking). Three of them have never been to Madeira before, two answered that they have been on the island once and one participant was there multiple times before. The results indicate that Google Maps was the most preferred map application with 83.3% of users favouring it over its competitors. The only alternative map application that was mentioned by one participant was Ulmon (which is popular with tourists for its elaborate offline functionality). For general map application usage, 33.3% of participants reported that they use a mobile map application multiple times a day, the rest uses it only occasionally. The reasons given for using the applications were (in order of popularity): To search for a location or place (83.3%), for walking and driving directions (66.7%), to explore the map (33.3%), or to get public transportation directions (16.7%). Half of the participants reported that they are using their map application differently when being on vacation. They use it more often, more detailed or they do not look up traffic information, whereas at home they do (which is in line with our results from study 1).
4.2.2. Overview of mapRecorder data
In total, we recorded 112 sessions for 6 participants, resulting in 97 minutes of total application usage time. Every participant produced an average of 19 (median: 19) sessions and used the application for 16 (median: 13.1) minutes over the study period. The average application session lasted 52.29 (median: 35.32) seconds, ranging from 1.4 -- 303 seconds. In contrast to study 1 we found that users had shorter and overall more sessions. In the following sections we analyse the high-level user-data, looking at the distribution of usage-states across users and user-sessions. We examine the data for some of the usage-patterns that we found in study 1 (e.g. MSPD, MD) and present analyses of the four usage states (Map-View Manipulation, Directions, Place and Search).
4.2.3. Overview of interaction states
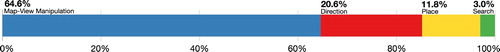
When looking at the usage states of the tourist users we found that they spent around 64.6% of their overall usage time in the Map-View Manipulation state, 20.6% in the Directions state, 11.8% in the Place state and the remaining 3.0% in the Search state. shows the overall average of this distribution.
Figure 7. Distribution of map usage states averaged over all users (study 2).
In contrast to study 1 we did not find any particular usage patterns (e.g. MSPD, MD) across the data set. The most common sequences were exclusively Map-View Manipulation (56/112) and exclusively Directions (15/112). This shows that in half of all sessions participants just used Map-View Manipulation, similar as in study 1.
4.2.4. Map-View manipulation analysis
With 64.6% Map-View Manipulation also yields the highest average usage time of any state during this study. We discovered that 56 sessions out of 112 only contained the Map-View Manipulation state. In 45 we found touch gestures suggesting that participants used panning and zooming to explore the the surroundings. This observation leaves 11/56 sessions without any interaction, which we were not able to classify.
4.2.5. Directions analysis
Directions was the second most frequently used state (20.6%) in our data set. We again analysed and categorised the types of places for which users requested directions to get an overview of the top six categories of destination within the area, which were very different from the ones we found in study 1: culture, area, park, food, shopping, church. The destinations were more evenly distributed across those categories than in study 1 as (a) shows. In total 39 destinations were searched for of which 21 used information for navigation by foot, 17 by car and 1 by public transport. shows that participants inquired mainly about very close distances (median: 0.378 km) to be reached by foot. For transportation by car the median distance was 1.74 km. This can be explained by both the size of the island (76.15 km2) and the short time they spent there (less than a full day).
Figure 8. Total occurrences of places and destinations (a), Total occurrence of specific- and entity class searches (b).
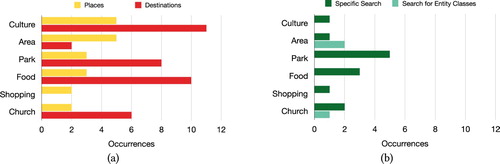
Figure 9. Relation of distance and mode of transportation.
4.2.6. Place analysis
11.8% of the average interaction time was related to places (). The places participants were interested in all relate to sightseeing, food or shopping and were located quite close to the participants location. As Funchal, the capital of Madeira is quite small and cruise ship tourists usually spend the day close to the ship we expected tourists to not travel too far from there. This was confirmed by our data as we found a median distance of 490 metres between the users current location and the place on the map they were interested in.
4.2.7. Search analysis
The search behaviour accounts for 3.0% of the total recorded usage time () which is made up of 19 searches in total (a relatively low number compared to study 1). We discovered that of these 19 search queries our users made 16 specific-, and 3 entity class searches (see (b)). So tourists do not seem to search for entity classes more than locals do.
By looking at the difference between (a,b), we can make assumptions about what kind of places are being most often explored with or without search. Two of the most prominent examples where we can observe this are the Culture and the Food category. Here searches are very limited even though those are the most frequent categories when it comes to places and destinations. Also the destinations have a lot more occurrences than the places. This suggests that participants more often got directions to a place directly without going through the Place state first which is supported by Directions being the second most frequently used usage pattern.
4.2.8. Summary
The analysis of the data collected from tourists gives first insights into how this user group uses mobile map applications. We have shown a general overview over the state distribution that indicates a high portion of it being Map-View Manipulation. We found that users are mostly interested in places that are within walking distance and that they do not search a lot for entity classes and places related to Culture and Food are usually explored without search. Being a small study the results presented above should not be generalised (even though some results look promising due to their similarity) but guide future studies that want to investigate tourists as mobile map users.
5. Discussion
Mobile map application usage is a complex set of behaviours and interactions that tells us a lot about how people explore the world around them in the digital age. We have shown that our approach makes it possible to collect valuable data to give insight into the regularities and exceptions of mobile map usage behaviour. Looking at two different user groups we can give first insights into how mobile map usage behaviour may vary between different users and think about consequences this can have for future designs of mobile maps. In the following we discuss the findings, compare some of the results and talk about limitations of our approach.
People like to explore maps, either through necessity or curiosity, and this is reflected through the high usage times in the Map-View Manipulation state in both studies. When taken in context of the other states of map use, this might be indicative of a preference for agency during search. This predisposition of users to engage largely in the Map-View Manipulation state is a suggestion that this interaction should be made as rich and meaningful as possible. This fits evidence stating that exploratory search is a widely adopted behaviour to look for information on the web (Hecht et al. Citation2012), and that users enjoy panning and zooming to explore their area (Bellino Citation2015). In the interviews users mentioned exploration and information retrieval, like looking up restaurants' menus or homepages, as crucial parts of the mobile map experience. Some of our users even reported using Google Maps without location services turned on completely neglecting the navigation aspect of it (referring to the native application). These behaviours support our intuition that mobile map applications are no longer just used to get from A to B but also serve as an important source of information beyond that.
We see indications that this is already picked up on by industry with Google's ever increasing number of Place Icons within its maps (O'Beirne Citation2017) as well as the recent introduction of the ‘explore menu’ (Lin Citation2018) to Google Maps. This menu exactly taps into the Map-View Manipulation state and introduces new ways of exploring your surroundings and finding the information you need more quickly. Only future investigations can show whether this is an adequate substitute for exploring the map yourself.
5.1. Implications
In study 1 we were able to identify complex usage patterns whilst examining the whole corpus of data collected over the month the study was active. Patterns like MSPD or MD showed us that users find different ways of accomplishing their goal of information retrieval in an mobile map application. This information could potentially influence the design of future mobile map services as with the knowledge about usage patterns effective shortcuts can be developed (see ). Study 2 however did not reveal those patterns. This could hint towards a unique quality of tourist users but could also be explained by the lack of a sufficiently big enough data set.
Figure 10. Example of design changes inspired by the MSPD and MD pattern. Original interface (a) versus design changes (b). Map data and image © 2019 Google.
The low usage incidence of searching for entity classes was observed in both studies showing that most of all users locals and tourists alike rather search for the actual name instead of the entity class. We think this points toward the conclusion that text search is not the preferred way to look for entity class information. Again here we find support in the current developments in industry. Instead of searching for restaurants or hotels ‘around you’ Google now offers this information within their ‘explore menu’ (Lin Citation2018), which our data suggests will be helpful for local and tourist users alike.
5.2. Limitations
Our results and findings are based on a thorough data collection and analysis. We incentivised users to comply with this data collection and found no indications in our data, that they did not. By excluding participants with less than five sessions, we also tried to filter out participants who would only do minimum work to receive the reward (they were not informed about the five session threshold). Still, unsupervised data collection bears the risk of collecting artificial usage data or missing out on a certain amount of usage data that is produced outside the tracking possibilities of the study. As we report earlier MapRecorder is not able to track in-app navigation. Thus whenever participants wanted to use this feature they were redirected to their native Google Maps application. This is a common challenge researchers face in unsupervised data collection and is discussed in related literature as well (Carrascal and Church Citation2015). We saw consistent usage over the whole study period, and session lengths that are line with other large scale mobile app usage study and thus cannot raise any concerns.
Even though we are confident to have recorded genuine and organic usage behaviour, with study 1 featuring 28 and study 2 featuring six participants we want to highlight generalisability as another important limitation. We agree with Church et al. (Citation2015) that our results can only be interpreted in connection to the participants of our study. We present quantitative findings and comparisons about usage behaviour that is unlikely to hold to another population. We also agree that these studies still have great value, as the research community is able to combine and contrast different studies on usage behaviour in different situations with different populations. This way we can build a better overall understanding of mobile users as we tie more of these behaviours together.
The large engagement in the Map-View Manipulation state is one of our most intricate findings. Due to the coarse categorisation of the Map-View Manipulation we find it challenging to formulate well defined implications. Our study was supposed to explore this unexplored territory of mobile map usage behaviour. In our findings on Map-View Manipulation and Google's recent design changes to Google Maps we see great potential for future research that will be able to analyse this exploratory behaviour in more detail.
6. Conclusion & future work
Our analysis considered the behaviour of two user groups, namely local users and tourists. Study 1 looking at local users found a variety of behaviours, of which the most prominent are: A prevalence of exploratory behaviour indicated by the Map-View Manipulation state, a search preference for named places instead of entity classes, and the use of specific usage patterns. Study 2 found similar results for the amount of Map-View Manipulation and the search behaviour but is lacking any indication of usage patterns. The results of study 2 can give first insights into how different user groups use mobile map applications differently (or like in our case, similarly).
With the technical constraints on recording in-app navigation this paper puts its focus on the actual map interaction and exploration. Nevertheless we acknowledge that there is already a big research corpus dealing with mobile navigation (e.g. May et al. Citation2003; Hipp et al. Citation2010; Brown and Laurier Citation2012; Wenig et al. Citation2015; Lin et al. Citation2017) and that contributing to this corpus with unsupervised usage data of navigation applications is a worthwhile goal to pursue. Adding a navigation component to MapRecorder could also give us valuable data to complement our findings presented in this study. Looking into other mobile map applications than Google Maps could help us making steps into this direction in the future and could then tell us not only a lot about how we explore but also navigate the world around us. Till then this paper begins the process of shining a light on the high-profile black-box that is among the most used applications in the world.
We present an organic map application usage study using our MapRecorder wrapper application and Google Maps to understand and explore user behaviour within mobile maps. In addition to two surveys of device and map application usage, we provide analysis for four main states of map interaction. We give one example of how this data can be used to compare ways in which different users (locals and non-locals) typically engage with these applications. We hope that these findings can help to provide context for mobile map research and practice, as well as to encourage the investigation of real-world, unsupervised application usage for other programmes and in other domains.
Disclosure statement
No potential conflict of interest was reported by the authors.
Additional information
Funding
References
- Baltrunas, L., K. Church, A. Karatzoglou, and N. Oliver. 2015. “Frappe: Understanding the Usage and Perception of Mobile App Recommendations In-The-Wild. arXiv preprint arXiv:1505.03014”.
- Banovic, N., C. Brant, J. Mankoff, and A. Dey. 2014. “Proactivetasks: The Short of Mobile Device Use Sessions.” Proceedings of the 16th International Conference on Human-computer Interaction with Mobile Devices & Services (MobileHCI '14), 243–252, New York, NY: ACM. doi:10.1145/2628363.2628380.
- Bellino, A. 2015. “Two New Gestures to Zoom: Enhancing Online Maps Services.” Proceedings of the 24th International Conference on World Wide Web (WWW '15 Companion), 167–170, New York, NY: ACM. doi:10.1145/2740908.2742823.
- Bhavnani, Y., K. Rodden, L. C. Guarnotta, M. T. Lynn, S. Chizari, and L. Granka. 2017. “Understanding Mobile Phone Activities Via Retrospective Review of Visualizations of Usage Data.” Proceedings of the 19th International Conference on Human-Computer Interaction with Mobile Devices and Services (MobileHCI '17), New York, NY: ACM, Article 58, 10 pages. doi:10.1145/3098279.3119841.
- Blades, M., and C. Spencer. 1987. “How Do People Use Maps to Navigate Through the World.” Cartographica: The International Journal for Geographic Information and Geovisualization 24: 64–75. doi: 10.3138/815T-6410-3764-7485
- Böhmer, M., B. Hecht, J. Schöning, A. Krüger, and G. Bauer. 2011. “Falling Asleep With Angry Birds, Facebook and Kindle: A Large Scale Study on Mobile Application Usage.” Proceedings of the 13th International Conference on Human Computer Interaction with Mobile Devices and Services, 47–56. ACM.
- Brown, B., and E. Laurier. 2012. “The Normal Natural Troubles of Driving With GPS.” Proceedings of the SIGCHI Conference on Human Factors in Computing Systems, 1621–1630. ACM.
- Carrascal, J. P., and K. Church. 2015. “An In-Situ Study of Mobile App & Mobile Search Interactions.” Proceedings of the 33rd Annual ACM Conference on Human Factors in Computing Systems, 2739–2748. ACM.
- Chua, A. Y. K., R. S. Balkunje, and D. H. -L. Goh. 2011. “Fulfilling Mobile Information Needs: A Study on the Use of Mobile Phones.” Proceedings of the 5th International Conference on Ubiquitous Information Management and Communication, pages 92:1–92:7. ACM. doi:10.1145/1968613.1968721.
- Church, K., M. Cherubini, and N. Oliver. 2014. “A Large-Scale Study of Daily Information Needs Captured in Situ.” ACM Trans. Comput.-Hum. Interact., 21, 2, Article 10 (Feb. 2014), 46 pages. doi:10.1145/2552193.
- Church, K., D. Ferreira, N. Banovic, and K. Lyons. 2015. “Understanding the Challenges of Mobile Phone Usage Data. Proceedings of the 17th International Conference on Human-Computer Interaction with Mobile Devices and Services, 504–514. ACM. doi:10.1145/2785830.2785891.
- Do, T. M. T., J. Blom, and D. Gatica-Perez. 2011. “Smartphone Usage in The Wild: A Large-Scale Analysis of Applications and Context.” Proceedings of the 13th international conference on multimodal interfaces, 353–360. ACM.
- Falaki, H., R. Mahajan, S. Kandula, D. Lymberopoulos, R. Govindan, and D. Estrin. 2010. “Diversity in Smartphone Usage.” Proceedings of the 8th International Conference on Mobile Systems, Applications, and Services (MobiSys '10) 179–194, New York, NY: ACM. doi:10.1145/1814433.1814453.
- Ferreira, D., V. Kostakos, A. R. Beresford, J. Lindqvist, and A. K. Dey. 2015. “Securacy: An Empirical Investigation of Android Applications' Network Usage, Privacy and Security.” Proceedings of the 8th ACM Conference on Security & Privacy in Wireless and Mobile Networks (WiSec '15)ACM, New York, NY, Article 11, 11 pages. doi:10.1145/2766498.2766506.
- Frommer, D. 2017. “These are the 10 Most Popular Mobile Apps in America.” Blog. Accessed August 28, 2017 from http://www.recode.net/2017/8/24/16197218/top-10-mobile-apps-2017-comscore-chart-facebook-google.
- Hasan, L., A. Morris, and S. Probets. 2009. “Using Google Analytics to Evaluate the Usability of E-Commerce Sites.” Human Centered Design, 697–706.
- Hecht, B., S. H. Carton, M. Quaderi, J. Schöning, M. Raubal, D. Gergle, and D. Downey. 2012. “Explanatory Semantic Relatedness and Explicit Spatialization for Exploratory Search.” Proceedings of the 35th International ACM SIGIR Conference on Research and Development in Information Retrieval, 415–424. ACM.
- Hintze, D., P. Hintze, R. D. Findling, and R Mayrhofer. 2017. “A Large-scale, Long-term Analysis of Mobile Device Usage Characteristics.” Proceedings of the ACM on Interactive, Mobile, Wearable and Ubiquitous Technologies 1 (2): 13:1–13:21. doi: 10.1145/3090078
- Hipp, M., F. Schaub, F. Kargl, and M. Weber. 2010. “Interaction Weaknesses of Personal Navigation Devices.” Proceedings of the 2Nd International Conference on Automotive User Interfaces and Interactive Vehicular Applications (AutomotiveUI '10), 129–136, New York, NY: ACM. doi:10.1145/1969773.1969796.
- Kamvar, M., and S. Baluja. 2006. “A Large Scale Study of Wireless Search Behavior: Google Mobile Search.” Proceedings of the SIGCHI Conference on Human Factors in Computing Systems, 701–709. ACM. doi:10.1145/1124772.1124877.
- Kraak, M.-J. 1998. “The Cartographic Visualization Process: From Presentation to Exploration.” The Cartographic Journal 35 (1): 11–15. doi:10.1179/000870498787074100. doi: 10.1179/caj.1998.35.1.11
- Kraak, M.-J., and F. Ormeling. 2011. Cartography: Visualization of Spatial Data. New York, NY: Guilford Press.
- Lee, U., J. Lee, M. Ko, C. Lee, Y. Kim, S. Yang, K. Yatani, G. Gweon, K.-M. Chung, and J. Song. 2014. “Hooked on Smartphones: An Exploratory Study on Smartphone Overuse Among College Students.” Proceedings of the SIGCHI Conference on Human Factors in Computing Systems, 2327–2336. ACM. doi:10.1145/2556288.2557366.
- Lettner, F., and C. Holzmann. 2012. Automated and Unsupervised User Interaction Logging as Basis for Usability Evaluation of Mobile Applications.” Proceedings of the 10th International Conference on Advances in Mobile Computing & Multimedia, 118–127. ACM.
- Lin, S. 2018. “Explore and Eat Your Way Around Town With Google Maps. Website. Accessed June 5, 2018 from https://www.blog.google/products/maps/explore-around-town-google-maps/.
- Lin, A. Y., K. Kuehl, J. Schöning, and B. Hecht. 2017. Understanding Death by GPS: A Systematic Study of Catastrophic Incidents Associated With Personal Navigation Technologies.” Proceedings of the 2017 CHI Conference on Human Factors in Computing Systems, 1154–1166. ACM.
- May, A. J., T. Ross, S. H. Bayer, and M. J Tarkiainen. 2003. “Pedestrian Navigation Aids: Information Requirements and Design Implications.” Personal and Ubiquitous Computing 7 (6): 331–338. doi: 10.1007/s00779-003-0248-5
- McGregor, M., B. Brown, and D. McMillan. 2014. “100 Days of Iphone Use: Mobile Recording in the Wild.” CHI '14 Extended Abstracts on Human Factors in Computing Systems (CHI EA '14), 2335–2340, New York, NY: ACM. doi:10.1145/2559206.2581296.
- McMillan, D., A. Morrison, O. Brown, M. Hall, and M. Chalmers. 2010. “Further Into the Wild: Running Worldwide Trials of Mobile Systems.” 210–227. Berlin: Springer.
- Nakhimovsky, Y., A. T. Miller, T. Dimopoulos, and M. Siliski. 2010. “Behind the Scenes of Google Maps Navigation: Enabling Actionable User Feedback at Scale.” CHI'10 Extended Abstracts on Human Factors in Computing Systems, 3763–3768. ACM.
- O'Beirne, J. 2017. “A Year of Google & Apple Maps.” Website. Accessed September 14, 2017. https://www.justinobeirne.com/a-year-of-google-maps-and-apple-maps.
- Perkins, C. 2003. “Cartography: Mapping Theory.” Progress in Human Geography 27 (3): 341–351. doi: 10.1191/0309132503ph430pr
- Pielot, M., K. Church, and R. de Oliveira. 2014. “An In-Situ Study of Mobile Phone Notifications.” Proceedings of the 16th International Conference on Human-computer Interaction with Mobile Devices & Services, 233–242, ACM. doi:10.1145/2628363.2628364.
- Rahmati, A., and L Zhong. 2013. “Studying Smartphone Usage: Lessons From a Four-month Field Study.” IEEE Transactions on Mobile Computing 12 (7): 1417–1427. doi:10.1109/TMC.2012.127. doi: 10.1109/TMC.2012.127
- Riegelsberger, J., and Y. Nakhimovsky. 2008. “Seeing the Bigger Picture: A Multi-Method Field Trial of Google Maps for Mobile.” CHI'08 Extended Abstracts on Human Factors in Computing Systems, 2221–2228, ACM.
- Sahami Shirazi, A., N. Henze, T. Dingler, M. Pielot, D. Weber, and A. Schmidt. 2014. “Large-Scale Assessment of Mobile Notifications.” Proceedings of the SIGCHI Conference on Human Factors in Computing Systems, pages 3055–3064, ACM.
- Shin, C., J.-H. Hong, and A. K. Dey. 2012. “Understanding and Prediction of Mobile Application Usage for Smart Phones.” Proceedings of the 2012 ACM Conference on Ubiquitous Computing (UbiComp '12), 173–182, New York, NY, ACM. doi:10.1145/2370216.2370243.
- Srinivasan, V., S. Moghaddam, A. Mukherji, K. K. Rachuri, C. Xu, and E. M. Tapia. 2014. “Mobileminer: Mining your Frequent Patterns on Your Phone.” Proceedings of the 2014 ACM International Joint Conference on Pervasive and Ubiquitous Computing (UbiComp '14), 389–400, New York, NY, ACM. doi:10.1145/2632048.2632052.
- Wenig, D., J. Schöning, B. Hecht, and R. Malaka. 2015. “Stripemaps: Improving Map-Based Pedestrian Navigation for Smartwatches.” Proceedings of the 17th International Conference on Human-Computer Interaction with Mobile Devices and Services (MobileHCI '15), 52–62, New York, NY, ACM. doi:10.1145/2785830.2785862.
- Widdicks, K., O. Bates, M. Hazas, A. Friday, and A. R. Beresford. 2017. “Demand Around the Clock: Time use and Data Demand of Mobile Devices in Everyday Life.” Proceedings of the 2017 CHI Conference on Human Factors in Computing Systems, 5361–5372, ACM.
Appendix
A.1. Interview guide
Thank you for taking the time for this interview. The data collected here is for a research project of the University of Bremen and will be used exclusively for this purpose. Therefore it is important that this conversation is recorded. Your personal data will be anonymised so that the information you provide here cannot be traced back to you. Is that all right with you?
Personal background:
(1) Can you briefly tell me something about your life situation? (age, education, profession)
(2) What were or are the most important places in your life? (childhood, favourite places, place of residence …, spending time)
Map use:
(1) What do you use Google Maps for? (To find new places in the city, only for long distances (highways)
)
(2) On which devices do you use Google Maps? (Do the occasions differ/when do you use it on your laptop/cell phone/PC?)
(3) What is your experience with Google Maps? (Good, bad, would recommend/delay using it, because …)
(4) What features, apart from navigation, do you use on Google Maps? (Ratings restaurants, current traffic news, public transport information, sightseeing)
(5) What setting or feature are you missing on Google Maps? (What could be improved?)
(6) What other navigation services have you used in the past?
(7) Do you still have old-fashioned paper maps? (Still in use, in the car, in the house, why are they still used or no longer used)
(8) I can see from your usage data that you looked around a lot in the map view. So you scrolled around in the map view without entering a specific location or destination. Can you tell me something about that?
(9) Possibly more questions about the data
Perception of space:
(1) What do you concentrate on when planning a route with Google Maps? (Settings -shortest/fastest route, avoid motorway
(2) Have you ever planned an excursion/a walk with a navigation service? (To what extent have you used the navigation service for this?)
(3) Do you have the feeling that by using Google Maps you are getting to know your surroundings better or in a different way? How do you perceive your surroundings while navigating with Google Maps? (New streets discovered or beautiful places / has your space 'enlarged'?)
(4) You probably know such situations: You're at a big event with a lot of people on big premises (Christmas market, festival…). Suppose you wanted to meet a friend. How would you arrange the meeting place? How would you have done that ten years ago?
(5) Have you ever shared your point of view with friends/family? (If so, in which situations and through which ministry?
(6) Do you know Google Street View? Have you used this feature before or do you use it sometimes? (If so, in which situations?)
Linking to other services:
(1) When you use navigation, do you trust Google Maps to find the best route for you? (Do you trust the route calculation or do you rather let it run while paying attention to signs/maps?)
(2) What would you think if Google Maps cooperated with other services such as Facebook, giving you more personalised routes? (e.g. if your workplace is specified on Facebook and Google Maps creates the optimal route to work on each working day with calculated arrival time depending on the current traffic situation).
(3) Can you imagine further links with navigation apps?
Data privacy:
(1) Are there situations where you don't want to use Google Maps?
(2) What settings have you made on your smartphone regarding location/GPS (Smartphone/Tablet: Always on/is consciously switched on/off…)
(3) If the GPS is on, what do you think about Google (and other services) having access to your location?
Views and opinions:
(1) How would you describe the importance of navigation apps in your everyday life?
(2) There has been a change from map navigation to mobile navigation devices and now navigation apps in the last 10–15 years. How do you see the future of navigation in another ten years? (And does this idea scare you/If so, why?)
(3) The future will probably be even more computer-based. There are smart cars that only need an address or an instruction like 'I want to visit my friend Ben' and the car will know where to navigate and may even drive without our help. What do you think?
(4) Is there anything else you would like to add? Is there perhaps an aspect that is important to you that has not yet been covered in this conversation?
(5) Thank you again for your time.