
ABSTRACT
This study aimed to investigate the roles of a text-highlighting tool and readers’ re-reading behaviour in their integrated understanding of multiple documents. University students (N = 95) read five partly conflicting documents on a health-related issue on a touch display with or without a text-highlighting tool. Integrated understanding of documents was assessed by the number of intertextual connections in essays written after reading and by a source-content mapping task. The provision of the text-highlighting tool resulted in longer initial reading times even when subtracting the time taken for highlighting, but shorter re-reading times, particularly for participants with a high number of re-readings. Further, only for participants with a high number of re-readings, the provision of the text-highlighting tool resulted in more intertextual connections than when no text-highlighting tool was provided. Participants’ source-content integration was positively related to the number of re-readings, regardless of whether the text-highlighting tool was provided. Finally, additional exploratory eye-tracking analyses revealed that for two out of the five documents, participants in the with-highlighting condition focused on significantly smaller parts of the documents during re-reading than controls.
1. Introduction
In today’s information society, due to the ease of accessing a multitude of documents on almost any topic, reading multiple documents on a particular issue has become a common reading task. For example, when turning to the Internet to inform oneself about the health effects of ultraviolet (UV) radiation, multiple documents stemming from various sources, such as different publishers of newspapers, magazines, or books, can provide consistent, complementary, or even conflicting information on the issue at hand (Bråten et al. Citation2014). Thus, to gain an overarching understanding of the issue addressed in multiple documents, readers do not only need to understand information within individual documents, but also to compare, evaluate, and integrate information across multiple potentially conflicting documents (e.g. Britt and Rouet Citation2012; Mahlow et al. Citation2020; Primor and Katzir Citation2018; Wineburg Citation1991). This is a challenging task for most readers (e.g. Kiili and Leu Citation2019; List et al. Citation2019), and failure to integrate information across multiple documents can lead to an incomplete or even one-sided understanding of complex subject matter (e.g. Anmarkrud, Bråten, and Strømsø Citation2014; List and Du Citation2021). Therefore, during the past few years, research into characteristics of the reading environment that can foster multiple document integration has increased considerably (e.g. Britt et al. Citation2004; Haber, Nacenta, and Carpendale Citation2014; Lombard et al. Citation2018; Margolin et al. Citation2013; Olive et al. Citation2008; Salmerón et al. Citation2009, Citation2010, Citation2018; Salmerón and Llorens Citation2019). Reading environments, for instance, can differ with respect to whether they provide computer-based tools that make it possible to highlight or annotate text (for recent overviews of support tools investigated, see, e.g. Barzilai, Zohar, and Mor-Hagani Citation2018; Britt and Rouet Citation2012). However, the beneficial effects of such tools, in general, might depend on how readers interact with these tools or how they interact with the reading environment as a whole, that is, which reading actions readers perform while reading (e.g. Bråten et al. Citation2014; Du and List Citation2020; Ferguson and Bråten Citation2013; Freund, Kopak, and O’Brien Citation2016; Goodwin et al. Citation2020; List and Alexander Citation2017, Citation2020; Rouet, Britt, and Durik Citation2017).
In line with this reasoning, a recent study by Leroy et al. (Citation2021) has shown that the provision of a text-highlighting tool supported readers’ integrated understanding of multiple partly conflicting documents only for readers with a higher number of re-accesses to previously read documents. In contrast, for participants who infrequently re-accessed previously read documents, no difference was found between those who were provided with a text-highlighting tool and those who were not. While building on that previous work by Leroy et al. (Citation2021), the study presented here extends these previous findings in two main ways: First, in addition to the same measure of integrated understanding that Leroy et al. (Citation2021) assessed (that is, the number of intertextual connections, which was their sole dependent measure), we were also interested in how the possibility to highlight text and the number of re-accesses to previously read documents would relate to a second important measure of readers’ integrated understanding, that is, their source-content integration (for details see Section 2.1). Second, we used eye-tracking methodology to define and examine re-accesses to documents in greater detail than in previous work. Eye-tracking methodology ‘provides information on the distribution of visual (overt) attention in terms of what objects (e.g. words, parts of graphics) are attended to, for how long, and in what order’ (Scheiter and Van Gog Citation2009, 1209). According to the eye-mind-assumption introduced by Just and Carpenter (Citation1980), ‘the eye remains fixated on a word as long as the word is being processed. So the time it takes to process a newly fixated word is directly indicated by the gaze duration’ (330). Thus, eye-tracking data can be considered a key indicator for individuals’ cognitive processing (Rayner Citation1998, Citation2009).
In sum, with the present study we aimed to expand prior research (a) by obtaining a more complete picture of the interplay between the provision of a text-highlighting tool and readers’ re-reading behaviour on their integrated understanding of multiple documents (i.e. by assessing an additional measure thereof) and (b) by using eye-tracking data to define readers’ re-accesses to documents and to examine potential differences in individuals’ re-reading behaviour when text-highlighting is possible versus when it is not.
In what follows, we first outline theoretical considerations of how readers integrate multiple documents, and of the role that re-reading previously read documents might play in gaining an integrated understanding. Then, we review literature on theoretical considerations of why text-highlighting might benefit text comprehension and discuss why it might especially benefit readers who engage in re-reading. We also discuss how the re-processing of previously read documents might be different when text can be highlighted during reading versus when it cannot.
2. Theoretical and empirical background
2.1. Readers’ integrated understanding of multiple documents
According to the Documents Model Framework (DMF; Britt et al. Citation1999; Britt and Rouet Citation2012; Perfetti, Rouet, and Britt Citation1999), an adequate mental representation of multiple documents, a so-called documents model, comprises information on how statements from different documents relate to each other or how documents as a whole relate to each other, respectively (i.e. intertextual integration) and information about which content stems from which source (i.e. source-content integration). Thus, to build an integrated understanding of multiple documents, readers need to compare, contrast, connect, and evaluate information from different documents and sources (e.g. Afflerbach and Cho Citation2009; Barzilai, Zohar, and Mor-Hagani Citation2018; List and Alexander Citation2018), which might be achieved by engaging in reading actions, such as re-reading (parts of) previously read documents (e.g. Anmarkrud, Bråten, and Strømsø Citation2014; Goldman et al. Citation2012; Latini, Bråten, and Salmerón Citation2020; List and Alexander Citation2017; Wineburg Citation1991).
Furthermore, as an extension of the DMF, the RESOLV (REading as problem SOLVing) model (Britt, Rouet, and Durik Citation2018; Rouet, Britt, and Durik Citation2017) suggests that the effects of characteristics of the reading environment (e.g. whether or not particular computer-based support tools are provided) on readers’ integrated understanding of multiple documents depend on the reading actions they perform and vice versa. In support of this notion, in the abovementioned study by Leroy et al. (Citation2021), the provision of a text-highlighting tool yielded better intertextual integration for readers with a higher number of re-accesses to previously read documents, but not of readers with a low number of re-accesses. Likewise, only when the text-highlighting tool was provided, the extent of re-accessing previously read documents was positively related to readers’ intertextual integration, but not when no text-highlighting tool was provided.
Regarding readers’ source-content integration, to our knowledge, no previous study has examined the interplay between text-highlighting and re-reading behaviour. Yet, also supporting the assumption made by the RESOLV model that reading behaviours play an important role for readers’ integrated understanding, two previous studies are indicative that re-reading may also be positively related to source-content integration. In a study by List and Alexander (Citation2018), participants who had re-accessed at least one previously read document included more source citations in essays written after reading six documents on a political issue than participants who had not re-accessed any document. Hence, during re-reading, participants may have paid additional attention to source information, which is an integral part of source-content integration. Furthermore, Delgado et al. (Citation2020) asked participants to read four documents on the effects of UV radiation on health in a hypertext environment. Results showed that the more often participants opened hyperlinked pop-up windows that provided hints about conflicting information in another document together with the source of that document, the better their source-content integration was after reading. However, whether source-content integration is also positively related to the extent of re-reading previously read documents when no hints about conflicting information across documents are provided remains an open question which is addressed in the present study.
2.2. Mechanisms of text-highlighting
Since the seminal work of Fowler and Barker (Citation1974), which provided first indications that active text-highlighting supported text comprehension, two distinct mechanisms have been discussed as to why (see e.g. Dunlosky et al. Citation2013; Winchell, Lan, and Mozer Citation2020): First, active text-highlighting might serve an encoding function, because readers have to make active decisions about which parts of the text to highlight (Ponce and Mayer Citation2014; Yue et al. Citation2014). Second, highlighted text might serve a retrieval function, because highlighted text stands out (or ‘pops out’; e.g. Leroy et al. Citation2021; Strobelt et al. Citation2016; Winchell, Lan, and Mozer Citation2020). It can thus be relocated and reviewed more easily than non-highlighted text (e.g. Chi, Gumbrecht, and Hong Citation2007; Yeari, Oudega, and Van den Broek Citation2017). Furthermore, Yeari, Oudega, and Van den Broek (Citation2017) assume that during re-reading readers ‘presumably focus mostly on the highlighted parts and thus save time and effort in reprocessing the textual content’ (2). Hence, text-highlighting should be particularly beneficial for comprehension when readers engage in re-reading. Overall, however, it should be noted that empirical evidence for the beneficial effects of text-highlighting for comprehension is rather inconclusive (cf. Dunlosky et al. Citation2013; Miyatsu, Nguyen, and McDaniel Citation2018). This might be due to the existence of factors that moderate the effectiveness of text-highlighting (e.g. Ben-Yehudah and Eshet-Alkalai Citation2018; Goodwin et al. Citation2020; Kobayashi Citation2009; Li, Tseng, and Chen Citation2016; for recent overviews, see Dunlosky et al. Citation2013; Winchell, Lan, and Mozer Citation2020). One such moderating factor might be the extent to which readers engage in re-reading (Leroy et al. Citation2021).
2.3. The effects of text-highlighting on integrated understanding
In the context of multiple document comprehension, to our knowledge only three previous studies examined the effects of text-highlighting (Kobayashi Citation2009; Leroy et al. Citation2021; Li, Tseng, and Chen Citation2016). In the study by Kobayashi (Citation2009)Footnote1, participants were asked to read in a self-paced manner six documents on the introduction of English education into elementary schools in Japan, and to find relations between texts. Afterwards, they had to write an argumentative essay on the topic as well as to recall as many arguments from the documents as possible. While they were reading, participants were either allowed or not allowed to use external reading strategies such as text-highlighting, underlining, or annotating which make information ‘pop out’. Among the participants who were allowed to use external reading strategies, text-highlighting was the most frequently used strategy. Regarding comprehension outcomes, results showed that the groups did not differ in the number of arguments they recalled from individual texts. Yet, participants who were allowed to use external reading strategies included more intertextual connections in their essays than participants who were not. In contrast, in a study by Li, Tseng, and Chen (Citation2016) the provision of a text-highlighting tool neither had an effect on participants’ recall of keywords from individual texts, nor on their intertextual integration when reading a set of hypertext documents on the topic of cancer. While these inconclusive findings regarding readers’ intertextual integration might be due to methodological differences across these two studies (i.e. for example the use of hypertext in the study by Li et al. versus the use of non-hypertext, i.e. regular text, in the study by Kobayashi, see Freund, Kopak, and O’Brien Citation2016), the possibility that highlights might be especially beneficial during re-reading (see Section 2.2) was not addressed in either of these studies. Kobayashi (Citation2009) did not report at all on participants’ re-reading behaviour. Li, Tseng, and Chen (Citation2016) only reported that the overall number of accesses to documents (i.e. the length of the navigation path) did not differ between groups. It thus remains unclear from these studies whether there was a moderating role of participants’ re-reading behaviour on the effectiveness of text-highlighting, as Leroy et al. (Citation2021) found.
Specifically, Leroy et al. (Citation2021) asked participants to read five partly contradicting documents on the effects of UV radiation on human health in order to write an argumentative essay about the issue. The number of re-accesses to documents was assessed from logfiles as an indication of how much participants had engaged in re-reading. As for the overall number of document-accesses in Li, Tseng, and Chen (Citation2016), Leroy et al. (Citation2021) also reported a comparable number of document re-accesses in the with-highlighting and without-highlighting conditions. However, with respect to readers’ intertextual integration (as measured by the number of intertextual connections in essays that participants wrote after reading), findings by Leroy et al. (Citation2021) revealed a statistically significant interaction between the possibility to highlight text and the number of re-accesses to documents. The provision of the text-highlighting tool supported intertextual integration only for readers who had re-accessed previously read documents to a considerable extent, but not for participants with only few document re-accesses. Furthermore, intertextual integration and the number of document re-accesses were positively related only for participants who were provided with the text-highlighting tool.
The finding that text-highlighting supported intertextual integration only for participants with a high number of document re-accesses might be due to the fact that highlighted information is easier to re-locate during re-accesses. This is because it pops out and thus might save readers time in reprocessing textual content (cf. Yeari, Oudega, and Van den Broek Citation2017). However, to our knowledge, no previous study has investigated a potential difference in the distribution of readers’ visual attention during re-reading or in their re-reading time when text-highlighting is possible versus when it is not. With regard to reading times, previous research has only investigated effects of text-highlighting on the overall time devoted to the task, indicating that with the possibility to highlight text, overall reading times were longer than without the possibility to highlight text (e.g. Ben-Yehudah and Eshet-Alkalai Citation2018; Johnson Citation1988; Leroy et al. Citation2021; Li, Tseng, and Chen Citation2016). This could, however, be explained by the fact that highlighting itself takes time (i.e. for deciding what to highlight and for executing the highlighting). As highlights seem to be made predominantly during initial readings of documents (Leroy et al. Citation2021; Peterson Citation1991), these longer overall reading times might stem from longer initial reading times rather than from longer re-reading times. Using eye-tracking methodology to distinguish between initial readings and re-readings of documents, the present study thus aimed to contribute to this line of research by examining whether the possibility to highlight text results in longer initial reading times, but in shorter re-reading times and more focused (i.e. less distributed) re-readings.
2.4. Present study
With the present study, first, we aimed to replicate the finding by Leroy et al. (Citation2021) that the beneficial effect of a text-highlighting tool on intertextual integration was moderated by the extent to which readers engaged in re-reading of documents. Similar to the study by Leroy et al. (Citation2021), participants were asked to read five one-paged, partly conflicting documents on the effects of UV radiation on human health in order to write an argumentative essay on the issue afterwards. Importantly, the present study sought to extend the findings by Leroy et al. (Citation2021) in several ways: First, in addition to readers’ intertextual integration, a second important measure of integrated understanding was assessed, namely readers’ source-content integration (i.e. their mental representation of which information stems from which source; Britt and Rouet Citation2012). For this purpose, after the essay-writing task participants had to complete a source-content mapping task (also see Delgado et al. Citation2020; Kammerer, Meier, and Stahl Citation2016; Stang Lund et al. Citation2017, Citation2019; Strømsø, Bråten, and Britt Citation2010). Second, eye-tracking methodology was used to distinguish between first readings and re-readings of documents more precisely, on the one hand, and to examine potential differences in participants’ re-reading behaviour when highlighting was possible versus when it was not, on the other hand. Specifically, we wanted to investigate the effects of the use of a text-highlighting tool on the time taken to re-read documents (assessed from logfiles based on the distinction between first readings and re-readings via eye-tracking data) as well as on readers’ distribution of visual attention on text during re-reading. Thereby, we aimed to extend Leroy et al.’s (Citation2021) previous work by more fine-grained analyses. Leroy et al. (Citation2021) had defined each re-access to a previously opened document as re-reading when the duration of the document access exceeded 1 sec. Yet, since the choice of threshold directly affects the number of re-readings, it might also affect the resulting interactive effect between the possibility to highlight text and the number of re-readings on integrated understanding. Using a combination of eye-tracking and logfile data, in the present research we therefore differentiated more precisely than Leroy et al. (Citation2021) between initial full readings (rather than first accesses) and re-readings of documents. In order to explore whether it was adequate to use a threshold of 1 sec to define re-readings, then, (1) we examined how many fixations were directed towards a document during short re-readings between below 1 sec and up to 5 sec (i.e. we used 5 different thresholds) and (2) tested whether the interactive effect between text-highlighting and the number of re-readings on readers’ integrated understanding depended on the choice of the threshold for re-readings. Overall, we had the following research questions (RQ) and hypotheses:
(RQ1) Does the number of re-readings moderate the effect of text-highlighting on readers’ multiple document comprehension?
In line with the results by Leroy et al. (Citation2021), we expected an interaction effect between the possibility to highlight text and the number of re-readings on intertextual integration (H1). Specifically, we expected that for participants with a higher number of re-readings, the possibility to highlight text would result in more intertextual connections than without the possibility for text-highlighting; in contrast, for participants with a lower number of re-readings, we expected no differences between the with-highlighting and without-highlighting conditions regarding the number of intertextual connections. Looking at the interaction from the other perspective, we expected the number of intertextual connections in essays to be positively related to the number of re-readings for participants in the with-highlighting condition, but not for those in the without-highlighting condition. Likewise, we expected a similar interaction effect for our second measure of integrated understanding, that is, for source-content integration (H2).
(RQ2) How does the possibility to highlight text affect readers’ re-reading behaviour?
Assuming that participants would make most of their highlights during initial readings (Kobayashi Citation2007; Leroy et al. Citation2021), we expected initial reading times to be longer when text-highlighting was possible than when it was not, even when excluding the time taken for highlighting (H3). In contrast, the time taken to re-read documents was expected to be shorter for participants who had the possibility to highlight text (H4), because they might use highlights to navigate their attention, thus potentially saving time in re-locating information (Yeari, Oudega, and Van den Broek Citation2017). This potential time-saving effect was furthermore expected to increasingly come to bear with a higher number of re-readings; thus, we expected an interaction effect between the possibility to highlight text and the number of re-readings on re-reading time (H5). Finally, we explored whether participants in the with-highlighting condition would also re-read a smaller proportion of the texts than participants in the without-highlighting condition, because the highlights might guide their visual attention. For this explorative analysis, we used eye-tracking methodology to generate heatmaps, in which fixations made during re-readings were accumulated for each document. This allowed us to assess the percentage of the document’s area that had been fixated during re-readings.
3. Method
3.1. Participants and experimental design
One hundredFootnote2 university students (75.00% female; M = 22.68 years, SD = 3.27 years) from different majors of a large German university participated in this experiment. They were compensated with 10€ for their participation. The study was approved by the local ethics committee and participants gave their written consent at the beginning of the study.
Participants were randomly assigned to one of two conditions, which differed in whether a text-highlighting tool was provided (with-highlighting condition) or not (without-highlighting condition). One participant did not read all documents (one document was only opened for around 4 s) and was thus excluded from all analyses. Furthermore, due to problems with calibration (e.g. due to astigmatism), we were not able to record eye-tracking data for four participants. Since most analyses required a differentiation between initial readings and re-readings based on a combination of eye-tracking and logfile data, these four participants were also excluded from all analyses. This resulted in a final sample of N = 95 participants, with 47 and 48 participants serving in the with- and without-highlighting condition, respectively.
3.2. Task and documents
Participants’ task was to read five documents dealing with the topic of the effects of UV radiation on human health in order to write an argumentative essay about the topic afterwards without having the documents available. The document set comprised five partly conflicting, one-paged documents. The documents were slightly adapted (and translated) versions of documents used in previous studies (e.g. Ferguson and Bråten Citation2013; Leroy et al. Citation2021; Strømsø et al. Citation2016). As in Leroy et al. (Citation2021), the sources of the five documents were a reputable liberal-conservative German newspaper (‘FAZ – Frankfurter Allgemeine Zeitung’), a medical science magazine (‘Ärztezeitung’), a university research magazine (‘Mundo – Wissenschaftsmagazin der TU Dortmund’), the German national cancer association (‘DKG – Deutsche Krebsgesellschaft’), and a German school book publisher (‘Cornelsen’). Overall, two documents took a positive stance on UV radiation by stating that it had positive effects on health by promoting the production of vitamin D (‘Ärztezeitung’ and ‘FAZ – Frankfurter Allgemeine Zeitung’). Two documents took a negative stance on UV radiation by stating that it had negative effects on health by promoting skin cancer (‘DKG – Deutsche Krebsgesellschaft’ and ‘Mundo – Wissenschaftsmagazin der TU Dortmund’). One document gave general and neutral information about UV radiation without taking a stance (‘Cornelsen’). Complementary information was provided by each pair of documents (e.g. one positive document stated that people with Mediterranean skin type can expose themselves to sunlight at a UV index of 8 for up to 40 min without risk, while one negative document stated that people with skin type IV should not expose themselves for more than 40 min to sunlight at a UV index of 8). In addition, the two positive and two negative documents, respectively, provided conflicting claims (e.g. ‘UV radiation damages genetic material, which can lead to cell death or even cancer' vs. ‘UV radiation promotes Vitamin D production, which, in turn, counteracts cell degeneration'). The documents with the same stance provided consistent claims (e.g. each positive document reported positive effects of UV radiation). Each of the four documents taking a stance reported on an interview with a professor who worked in the respective research area. For a more detailed description of the documents’ contents, see Table S1 of the Supplemental Material. All documents were comparable in length (M = 24.00 sentences, SD = 1.92; M = 352.40 words, SD = 27.32) and readability (with an average LIX score of M = 52.06, SD = 2.65; Björnsson Citation1968). All documents contained two to three subheadings and a source logo at the top of the page displaying the name of the source.
The documents were presented in one of two defined document orders. In one document order, the documents in the first and fifth positions took a positive stance, whereas in the other document order they took a negative stance. Moreover, the documents in the second and fourth positions took an opposing stance to those in the first and fifth positions. The document in the third position was always the one giving general information about UV radiation without taking a stance. This resulted in two sets of partly conflicting documents arranged in direct succession (i.e. those in the first and second as well as those in the fourth and fifth positions took opposing stances, whereas documents in the first and fifth as well as those in the second and fourth positions took the same stance). Overall, 25 participants in the with-highlighting and 24 participants in the without-highlighting condition were presented a positive document first, and, accordingly, 22 and 24 participants in the respective conditions were presented a negative document first.
3.3. Documents presentation
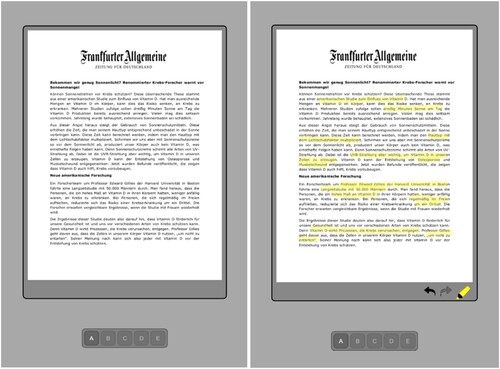
Because we sought to replicate previous findings of a study where participants had read documents on a multi-touch display where highlighting was done with the finger (Leroy et al. Citation2021), in the present study we also presented documents on a touch display. Specifically, documents were presented sequentially (i.e. one at a time) on an upended 27″ touch display (3M Multi Touch M2767PW, resolution: 1920 × 1080 px) which was diagonally positioned on a height-adjustable table. Thus, the upper end of the screen was higher than the lower end, and participants could interact with it more easily than had it been either lying flat or standing vertically on the table (see ). For each participant, the table was adjusted in height until they felt that interacting with the user interface was comfortable. Each document could be opened from a menu at the bottom of the display, which then was displayed in the centre of the screen in a size slightly bigger than A4 (33.9 cm x 23.9 cm). In the with-highlighting condition, participants could highlight text (in yellow) with their finger by using a swiping gesture over the text. Highlighting could be (de-)activated by tapping a button in the bottom-right corner of the document’s frame, the most recently generated highlight could be undone by tapping a left-arrow button, and the last undone highlight could be retrieved by tapping a right-arrow button. These buttons were also positioned at the bottom of the document’s frame (see ).
Figure 1. Re-enactment of a participant standing in front of the height-adjustable table with the inclined display on which the documents were presented.

Figure 2. Experimental user interface without highlighting-tool (left) and with highlighting-tool (right). Highlighting could be activated by tapping the highlighter-button which, in activated mode, would appear yellow. Text could then be highlighted with the finger.
3.4. Measures
3.4.1. Integrated understanding
Participants’ integrated understanding was assessed with two dependent measures. First, we assessed their intertextual integration through the number of intertextual connections included in their argumentative essays (e.g. Kobayashi Citation2009; Leroy et al. Citation2021; List et al. Citation2019; Salmerón, Gil, and Bråten Citation2018). Second, to assess participants’ source-content integration we used a source-content-mapping task, that is, a task that requires participants to map which information stemmed from what source (e.g. Delgado et al. Citation2020; Kammerer, Meier, and Stahl Citation2016; Stang Lund et al. Citation2019; Strømsø, Bråten, and Britt Citation2010).
Statements in participants’ argumentative essays that combined information from two documents were coded as intertextual connections. Both connections between document-specific information and connections between the global stances taken by the documents were coded as intertextual connections (i.e. connections of conflicting or complementary information; cf. Primor and Katzir Citation2018; see Table S2 of the Supplemental Material for examples). An intertextual connection could span several sentences (e.g. being connected through an adverb, such as ‘furthermore’, ‘also’, ‘however’, or ‘on the contrary’), or be contained in a single sentence. More than one intertextual connection could be contained in a single sentence (e.g. when information from three documents was connected within one sentence, that sentence contained two intertextual connections). In general, only correct statements and connections were considered. Interrater agreement was coded for each intertextual connection coded by both of two raters, or for each sentence that had not been coded as containing any intertextual connections by either rater, respectively. Disagreement was coded for each intertextual connection that had only been coded by one rater. Two raters (the first author and a trained research assistant) independently coded 20 (21.05%) essays for intertextual connections and reached an interrater agreement of 86.93%. Disagreements were discussed and resolved, before one rater (the first author) proceeded with the coding of the remaining 75 essays.
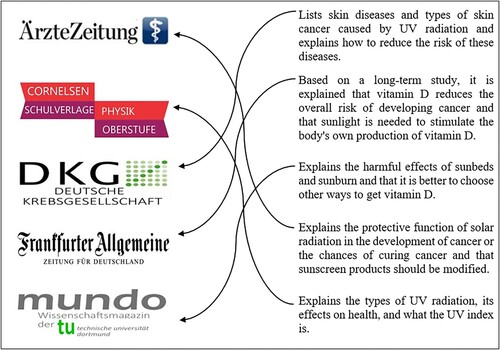
In the source-content mapping task (see ), participants were presented with the documents’ source logos in one column, and one-sentenced main statements, each distinctively describing the content of one document, in a second column. The source logos were presented in alphabetic order and the one-sentenced main statements were presented in the same scrambled order for each participant, in which none was initially placed in its correct position (see ). Participants were asked to move the statements next to the source logo of the document that provided the respective information. Participants received one point for each correctly mapped statement. However, because once four statements were correctly mapped, the fifth was automatically correct as well, we defined a maximum score of 4 for this task.
Figure 3. Items of the source-content-mapping task (translated from German). The initial order of source logos (left) and statements (right) was as shown here. Participants’ task was to drag the statements vertically such that their position matched that of the corresponding source logos. Arrows indicate the correct place assignments.
3.4.2. Task processing measures
We assessed the number of re-readings, the reading times for initial readings and for re-readings, as well as the fixation coverage of documents during re-readings as task processing measures. To differentiate between initial readings and re-readings, eye-tracking data was used in combination with logfiles. In the with-highlighting condition we also used logfiles to assess how many highlights were made during initial readings and re-readings as well as the respective time it took to perform the highlights (highlighting-time).
Eye-tracking data was recorded by means of the mobile eye-tracking system Tobii Pro Glasses 2 Live View Wireless 50, with a temporal resolution of 50 Hz, and the software Tobii Pro Glasses Controller. All eye-tracking measures were generated using the Tobii Pro Lab Software (V.1.145.28180).
3.4.2.1. Distinguishing between initial readings and re-readings
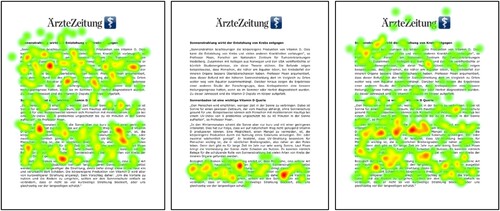
In Leroy et al. (Citation2021), each re-accessing of a previously opened document was defined as a revisit when the document was opened for at least 1 sec. This approach, however, did not guarantee that the document had been fully read during its first access. In contrast, in the present study we aimed to differentiate between participants’ initial readings of a document until they had fully read it, and their subsequent re-readings of that document. By using eye-tracking data, we were able to assess when participants had fully read a document (this could span several document accesses), and, accordingly, how many times they subsequently re-accessed a document to re-read it. For this purpose, in the eye-tracking videos of all 95 participants, first we manually tagged all document accesses using the Tobii Pro Lab software. Subsequently, we used Tobii Pro Lab’s automatic mapping functionality with the gaze filter ‘Tobii I-VT (Fixation)’, which uses a default threshold of 60 ms for fixations, and its visualisation tool to create heatmaps based on the number of fixations for each document access of each participant. For each participant and each document, we then used the heatmap created for the first document access to determine whether the document had been fully read (i.e. whether the resulting heatmap covered the entire text of the document), or whether further document accesses needed to be taken into account to make up the initial reading of the respective document (see ). In case the heatmap of the first document access revealed only partial reading of the document, we accumulated heatmaps of subsequent document accesses until the resulting heatmap revealed full coverage of the text. Overall, for 22 document accesses (from 17 participants) another document had been (re-)accessed before the respective document had been fully read. That is, for these 22 cases, initial document readings comprised more than just the first document access.
Figure 4. Heatmaps of a participant’s fixations on the document ‘Ärztezeitung’ during its first access (left; 107 sec duration), second access (middle; 28 sec duration), and re-readings (accumulated; right; 137 sec duration). Please note that the first and second accesses together account for the initial reading.
Based on this distinction between initial and re-readings of each document via eye-tracking data, we then used logfiles to define the time a participant spent to initially read and re-read the documents. Specifically, the total initial reading time (in sec) was calculated by summing up the durations of the respective initial full readings of the five documents. Accordingly, the total re-reading time (in sec) was calculated by summing up the durations of the respective re-accesses to the five documents after the initial full reading.
All accesses of a document after it had been fully read were defined as re-readings, given that they lasted for a particular minimum duration. Specifically, we examined five different thresholds for the duration of re-readings, namely 1, 2, 3, 4, and 5 sec. Please note that Leroy et al. (Citation2021) had instead used a fixed threshold of 1 sec. However, re-accesses that last for 2 or 3 sec, for example, are still very short and allow only little information processing, and thus might not necessarily imply intentional re-accessing. By defining thresholds between 1 sec and up to 5 sec, we thus aimed to explore how many fixations were directed towards the respective document (i.e. approximately how much processing occurred) during short re-accesses of up to 5 sec (for details see Section 3.4.2.3), and whether (and if so, how) the choice of the threshold for the duration of re-readings made any difference for the investigated effects. However, for the sake of conciseness, in the Results Section (i.e. Sections 4.2, 4.3, and 4.4), we will only report results of analyses using the 1 and 3 sec thresholds. Further analyses using the 2, 4, and 5 sec thresholds are provided in the Supplemental Material.
3.4.2.2. Determining the number of re-readings
In order to assess the number of re-readings for a given duration-threshold, similar to Leroy et al. (Citation2021), we used logfile data to determine the sequence of all document accesses for each participant and how long each document access lasted. For the 1 sec threshold, for example, we erased all document accesses that lasted less than 1 sec from this sequence. When the resulting sequence contained two accesses of the same document in direct succession, they were counted as one document access which lasted for the sum of both document accesses. Take, for example, the following document accessing sequence, with the bold print reflecting initial readings that were completed after the first document access and the underlined print reflecting initial readings spanning across two document accesses: ‘A (130 sec), B (111 sec), C (132 sec), D (107 sec), C (13 sec), A (0.7 sec), C (18 sec), D (28 sec), E (109 sec), D(137 sec)’. After erasing all document accesses that lasted for less than 1 sec (i.e. for applying a 1 sec threshold), this results in the sequence ‘A (130 sec), B (111 sec), C (132 sec), D (107 sec), C (13 + 18 sec), D (28 sec), E (109 sec), D(137 sec)’. This reveals one re-reading of document C (for 13 + 18 sec) and of document D (for 137 sec), and no re-readings of documents A, B, and E. The initial reading of document D spans across the first two accesses (see for example heatmaps generated for document D in the aforementioned exemplary accessing sequence from one participant’s real data).
3.4.2.3. Number of fixations on documents during short re-accesses
In addition to determining the number of re-readings, eye-tracking data was also used for more fine-grained fixation-based analyses. For this purpose, the data of 6 participants had to be excluded because of imprecise data quality. For the remaining 89 participants, we took the following approach using the Tobii Pro Lab Software to assess the number of fixations on documents during short re-accesses below 5 sec: First, we categorised re-accesses according to the following five categories of duration thresholds: below 1 sec; at least 1 but less than 2 sec; at least 2 but less than 3 sec; at least 3 but less than 4 sec; or at least 4 but less than 5 sec. Using Tobii Pro Lab’s automatic mapping functionality with the gaze filter ‘Tobii I-VT (Fixation)’, we then determined the number of fixations on the respective document for each of these short re-accesses. Finally, we calculated the average number of fixations per re-access separately for each of the five categories. Please note that only the data of participants who made at least one re-access with a duration within the respective time span was considered in these analyses.
3.4.2.4. Fixation coverage during re-readings
Goldberg and Kotval (Citation1999) argued that the spatial distribution of fixations on an interface, that is, the fixation coverage (or spatial density) indicates the extent of search and processing, with a fixation coverage of ‘a small area reflect[ing] direct and efficient search’ (640). Accordingly, we used the fixation coverage during re-readings as a measure of participants’ focused re-reading. Only the data of the 89 participants with valid eye tracking was used for these analyses. For each participant and re-accessed document, we created one heatmap comprising all fixations on the respective document during re-readings, by using a blank background instead of the document. We defined a radius of 35px for each fixation’s contribution to the heatmap, and used Tobii Pro Lab’s default scale value to define colouring (note that colour type played no role in our fixation coverage analyses). The resulting heatmap was non-white in all areas where a participant had fixated during re-readings. That is, 100% coverage would mean that the whole document (including white space) was covered with fixations. Using the R function as.raster, we created bitmaps of each fixation coverage heatmap and calculated the percentage of the respective document’s non-white area (Sharafi, Shaffer, and Sharif Citation2015). For example, the re-reading fixation coverage in the example shown in (right), notably with a white background instead of the document’s text, is 47.13%.
3.4.3. Control variables
To ascertain comparability across the two conditions, we assessed participants’ working memory capacity (15-item computer-based reading span task; cf. Kane et al. Citation2004), topic interest (1 item) and prior topic beliefs (2 items; one addressing positive and another addressing negative effects of UV radiation on health) on 7-point Likert scales, as well as prior topic knowledge (see below). The two items on prior topic beliefs were averaged after reverse-scoring the negative item (Cronbach’s alpha = .79). Thus, the higher the score, the more positive a participant’s topic beliefs were.
Prior topic knowledge was assessed with an essay task prior to reading the documents, in which participants were asked to write down in 5 min everything they knew about potential effects of UV radiation on human health – with no upper or lower word limit. Participants were awarded one point for each relevant and correctly reported general fact (e.g. UV radiation comes from the sun; sunbeds use UV radiation; there are 3 types of UV radiation) or specific argument concerning negative or positive health effects of UV radiation (e.g. UV radiation causes skin cancer; UV radiation promotes the production of vitamin D in the body). Two independent raters (the first author and a trained research assistant) scored a random selection of 20 (21.05%) prior knowledge essays using a pre-defined list of 35 facts and arguments related to the topic. Interrater agreement was assessed for point-wise scoring, that is, agreement was coded when both raters gave a point for a statement, and disagreement was coded when only one rater gave a point for a statement. Interrater agreement for the 20 essays was 87.06%. Disagreements were resolved through discussion, and subsequently one rater (the trained research assistant) scored the remaining 75 prior topic knowledge essays.
3.5. Procedure
Participants were tested in single sessions (of approximately 75 min) in the lab. First, they were asked to rate their topic beliefs, write the prior-knowledge essay, provide demographic information, and complete the working memory task, using a laptop. Subsequently, participants received a written explanation of the interaction possibilities on the touch display (i.e. how to open documents in the without-highlighting condition, and how to open and highlight documents in the with-highlighting condition). Each participant practiced interaction with the interface by using five blank documents in the respective highlighting-condition. Once they felt comfortable operating the interface, they received a written task instruction on the screen. Specifically, they were told that they would be provided with five documents from the Internet, which they should read carefully, in order to subsequently write an argumentative essay about potential health effects of UV radiation without having the documents available. They were also informed that they had a maximum of 15 min to read the documents and that within this time frame they could read the documents as often as they wanted. After reading, participants were asked to write the argumentative essay within 15 min on a laptop. They were told to include in their essay arguments and findings stated in the documents to justify their claims. After having completed their essay, they worked on the source-content-mapping task on the laptop.
4. Results
4.1. Comparability of conditions
Participants in the with-highlighting and without-highlighting conditions did not differ with respect to age, t(92.94) = 0.30, p = .767, prior knowledge as assessed from essaysFootnote3 written before reading, t(92.77) = -1.52, p = .131, working memory capacity, t(86.19) = -0.51, p = .612, topic interest, t(85.96) = -0.64, p = .525, or prior beliefs about potential health effects of UV radiation, t(87.53) = 0.65, p = .516 (see for means and standard deviations).
Table 1. Means (and standard deviations) for control variables as a function of text-highlighting.
Furthermore, the number of re-readings of documents did not differ between conditions (for any of the five re-reading thresholds, see for the 1 sec 3 sec thresholds and Table S3 of the Supplemental Material for the other thresholds). also provides the number of re-readings of each of the five documents separately. Descriptively, the neutral document and one negative document were re-read most often by participants, whereas the other negative document was re-read least often in both conditions. Furthermore, the essays composed after reading also did not significantly differ in length between conditions, t(93) = 1.06, p = .294 (with highlighting: M = 273.55 words, SD = 70.69; without highlighting: M = 258.10 words, SD = 72.04).
Table 2. Means (and standard deviations) of the number of re-readings with the respective duration-threshold as a function of text-highlighting, as well as inferential statistics.
4.2. Number of fixations on documents during short re-accesses
As a first step in our methodological examination of the re-reading threshold, we explored how much information, on average, participants processed during short re-accesses that lasted up to 5 sec. To this end, we calculated the average number of fixations per document re-access according to the five duration thresholds examined. Means (and standard deviations) of the average number of fixations on documents during short re-accesses are shown in for the with-highlighting and the without-highlighting conditions. The longer a re-access lasted, the more fixations participants made in the respective document. Furthermore, in both conditions, on average, during re-accesses that lasted less than 1 sec, participants made less than two fixations, and in re-accesses that lasted more than 2 but less than 3 sec, participants made less than five fixations. Hence, simply put, the application of the 1 sec threshold excluded re-accesses in which participants had an average of less than two fixations. Likewise, the 3 sec threshold excluded re-accesses in which participants had an average of less than five fixations.
Table 3. Means (and standard deviations) of the number of fixations on documents per re-access for short re-accesses that lasted up to 5 sec as a function of the re-access duration and text-highlighting. The number of participants who made at least one such short re-access as well as the total number of re-accesses across participants for each time span are also provided.
4.3. Interaction effects between the possibility to highlight text and the number of re-readings on integrated understanding measures (RQ1)
On average, participants in the with-highlighting and without-highlighting conditions included M = 4.09 (SD = 1.82) and M = 3.79 (SD = 1.65) intertextual connections in their essays. In order to test our hypothesis of an interaction effect between the possibility to highlight text and the number of re-readings on intertextual integration (H1) and also to explore how the choice of re-reading threshold might affect the expected moderation of the number of re-readings on the effect of text-highlighting, we conducted five moderated linear regression analyses, one for each of the five re-reading thresholds. For the sake of conciseness, in the following, we report the results of these analyses for the 1 and 3 sec re-reading thresholds (see ). Analyses using the 2, 4, and 5 sec thresholds are provided in Table S4 of the Supplemental Material. In each regression analysis we used highlighting (with vs. without) as a dichotomous predictor (coded as -1 and +1, respectively) and the respective number of re-readings (z-standardized) as a continuous predictor, as well as the interaction term between the two predictors, and number of intertextual connections as dependent variable. In all analyses, we used two-sided tests of significance.
Table 4. Inferential statistics for main effects of and interactions between text-highlighting and the number of re-readings (for the 1 and 3 sec re-reading thresholds) on the integrated understanding measures (number of intertextual connections and source-content mapping score).
For the 1 sec threshold, neither text-highlighting, nor the number of re-readings, nor the interaction between text-highlighting and the number of re-readings were significant predictors for the number of intertextual connections. In contrast, for the 3 sec threshold the interaction was significantFootnote4 (for inferential statistics, see ), thus, partly supporting H1.
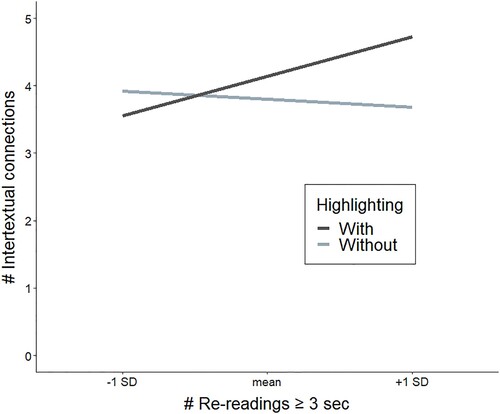
illustrates this interaction between text-highlighting and the number of re-readings for the 3 sec threshold. Simple comparison analysesFootnote5 according to the procedure outlined by Aiken and West (Citation1991) showed that in line with our expectations for participants with a high number of re-readings (1 SD above the mean; i.e. 14.24 re-readings) the number of intertextual connections was higher in the with-highlighting condition than in the without-highlighting condition, β = .52, t(91) = 2.09, p = .039, whereas for participants with a low number of re-readings (1 SD below the mean; i.e. 2.35 re-readings) no differences between conditions were found, β = –.18, t(91) = -0.73, p = .466. Likewise, for participants in the with-highlighting condition, the number of re-readings was significantly positively correlated to participants’ intertextual connections, β = .58, t(91) = 2.34, p = .021, but not for participants in the without-highlighting condition, β = –.12, t(91) = -0.49, p = .627.
Figure 5. Interaction between text-highlighting and the number of re-readings ≥ 3 sec (z-standardized) with regard to the number of intertextual connections.
With regard to the second integrated understanding measure, that is, participants’ score in the source-content mapping task, participants in the with-highlighting and without-highlighting conditions achieved an average score of M = 2.32 (SD = 1.24) and M = 2.40 (SD = 1.07), respectively. In order to test our hypothesis of an interaction effect between the possibility to highlight text and the number of re-readings on source-content integration (H2), we conducted the same moderated regression analyses as described above for the number of intertextual connections. However, for the source-content mapping score as the dependent variable, the interaction between text-highlighting and the number of re-readings was not significant; neither for the 1 sec threshold nor for the 3 sec threshold (see ) nor for the other thresholds (see Table S4 of the Supplemental Material). We therefore reran the regression analyses without the interaction term. Results showed that text-highlighting wasn’t a significant predictor in any of the five regression analyses. However, the number of re-readings was a significant positive predictor of participants’ source-content mapping score for the re-reading threshold of 1 sec, and a marginally positive predictor for the 3 sec thresholdFootnote6 (see ).
4.4. Effect of the possibility to highlight text on initial reading and re-reading behaviour (RQ2)
In the following, results are reported with regard to our hypotheses H3 and H4, which assumed that participants in the with-highlighting condition would have longer initial reading times across the five documents (H3) but shorter re-reading times (H4) than participants in the without-highlighting condition. All but two participants in the with-highlighting condition made use of the highlighting-tool. These 45 participants, on average, made M = 90.67 highlights (SD = 41.87) with a total length of all highlights of M = 21,126.28 px (SD = 10,373.05). Specifically, they made M = 86.48% (SD = 28.77) of their highlights during initial readings.
shows means (and standard deviations) of overall reading times, initial reading times, and re-reading times (for the 1 and 3 sec thresholds; for all thresholds see Table S6 of the Supplemental Material) for the with-highlighting and without-highlighting conditions as well as the respective inferential statistics. Two-sided Welch’s t-tests showed that participants in the with-highlighting condition spent significantly more time overall for reading – but only when this time included the time participants in the with-highlighting condition had taken for highlighting. When the time participants in the with-highlighting condition had taken for highlighting was subtracted from the overall time on task, there was no difference in overall reading time between conditions. Yet, more detailed analyses of the reading times revealed that – even when the time participants in the with-highlighting time was subtracted from their initial reading time – participants in the with-highlighting condition took significantly more time for initial readings than participants in the without-highlighting condition, confirming H3. In contrast, participants in the with-highlighting condition took less time for re-reading than those in the without-highlighting condition, thus also confirming H4.
Table 5. Means (and standard deviations) for overall reading times, initial reading times (both including and excluding the time taken for highlighting during initial readings), and re-reading times as a function of text-highlighting.
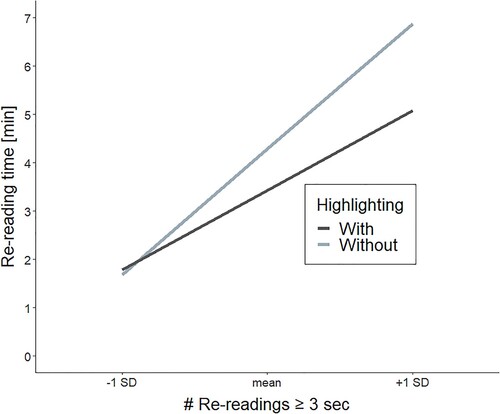
In order to examine the time-saving effect of text-highlights for re-reading (H5), we further explored whether the time difference between the with-highlighting and the without-highlighting condition was moderated by the number of re-readings. We conducted a moderated linear regression analysis using text-highlighting (with vs. without) as a dichotomous predictor (coded as -1 and +1, respectively) and the number of re-readings (≥ 1 sec and ≥ 3 sec, respectively; z-standardized) as a continuous predictor, as well as the interaction term between the two predictors, and the re-reading time as the dependent variable. Results revealed a significant interactionFootnote7 between predictors for both the 1 sec threshold, β = -.17, t(91) = -2.51, p = .014, 95% CI [-0.865; -0.106] (text-highlighting: β = -.46, t(91) = -2.37, p = .020; # re-readings: β = .73, t(91) = 10.84, p < .001), and the 3 sec threshold, β = -.17, t(91) = -2.60, p = .011, 95% CI [-0.892; -0.128] (text-highlighting: β = -.15, t(91) = -2.35, p = .021; # re-readings: β = .75, t(91) = 11.63, p < .001). illustrates this interaction for the 3 sec threshold. Simple comparison analysesFootnote8 revealed that for participants with a high number of re-readings (1 SD above the mean), the re-reading time was significantly shorter in the with-highlighting condition than in the without-highlighting condition, β = -.90, t(91) = -3.49, p < .001, but not for participants with only a few re-readings (1 SD below the mean), β = .05, t(91) = 0.26, p = .849. This indicates that particularly for participants with a higher number of re-readings, the provision of the highlighting-tool yielded a time-saving effect during re-readings.
Figure 6. Interaction between text-highlighting and the number of re-readings ≥ 3 sec (z-standardized) with regard to re-reading time (only re-accesses ≥ 3 sec taken into account).
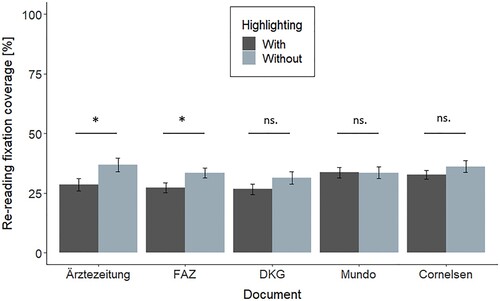
Finally, regarding the distribution of visual attention during re-readings, we assessed potential differences for each document individually. Two-sided Welch’s t-tests indicated that during re-reading, participants in the with-highlighting condition fixated on significantly smaller parts of the two positive documents (i.e. ‘Ärztezeitung’ and ‘FAZ – Frankfurter Allgemeine Zeitung’; see ) than participants in the without-highlighting condition (Ärztezeitung, n = 64: t(61.99) = -2.20, p = .031; FAZ, n = 68: t(64.80) = -2.14, p = .036). In contrast, the fixation coverage for the two negative documents and the neutral document did not differ between conditions (DKG, n = 57: t(55.00) = -1.35; p = .182; Mundo, n = 72: t(70.00) = 0.05, p = .959; Cornelsen, n = 68: t(62.61) = -1.10, p = .276).
Figure 7. Mean percentage of participants’ re-reading fixation coverage for each document as a function of text-highlighting. For these analyses, only the data of participants who re-accessed the respective document are considered.
5. Discussion
In the present study we sought to replicate and extend previous findings that especially for participants with a higher number of re-readings, the provision of a text-highlighting tool has a positive effect on readers’ integrated understanding of multiple, partly conflicting documents about a health-related issue (Leroy et al. Citation2021). Specifically, we aimed to extend that work by assessing not only readers’ intertextual integration, but also their source-content integration, and by investigating how initial and re-reading times as well as re-reading fixation coverage might differ when a text-highlighting tool is provided versus when it is not. Moreover, we aimed to expand Leroy et al.'s (Citation2021) work by some methodological examinations. First, they had defined initial readings simply as the first access, and re-readings as each re-accessing of a document (that lasted longer than 1 sec). In contrast, we used eye-tracking methodology to differentiate more precisely between initial full readings of a document (which could comprise several accesses) and re-readings of a document (i.e. re-accesses of a document after it had been fully read). Our eye-tracking analyses revealed that in 22 instances (of 17 participants; out of 95 participants * 5 documents, i.e. 475 instances) the initial reading of a document comprised more than just its first access. Hence, our analyses indicate that defining initial readings as the first access of a document can be a reasonably approximate definition to calculate the number of re-readings for reasons of simplicity. Second, in order to examine how the re-reading threshold (i.e. the minimum duration of a document access) chosen would affect the potential interaction effect between the number of re-readings and text-highlighting on readers’ integrated understanding, we analysed this interaction by using five different re-reading thresholds between 1 and 5 sec. As we will discuss in detail below, indeed statistical results differed to some extent between the 1 sec threshold and the other thresholds. Related to this issue of the re-reading threshold chosen, as a third methodological examination aiming to expand the findings by Leroy et al. (Citation2021) we investigated how many fixations were directed towards documents during short re-accesses of up to 5 sec. Our analyses revealed that in re-accesses that lasted longer than 1 but shorter than 2 sec, participants, on average, had fewer than four fixations on the document, indicating that re-processing of information was very limited during such short re-accesses. In re-accesses that lasted between 3 and 4 sec, participants, on average, had about eight fixations on the document, which is still quite few.
In the following section, we discuss our findings regarding the role of re-reading in readers’ integrated understanding when a text-highlighting tool was provided versus when it was not (RQ1). Related to these analyses, we critically discuss our findings regarding the choice of re-reading thresholds, which, based on the present findings, should be made under careful consideration of the respective integrated understanding measure assessed. Finally, we discuss how the provision of the highlighting-tool affected readers’ initial reading and re-reading behaviour (RQ2).
5.1. The moderating role of re-reading in the effect of the text-highlighting tool on intertextual integration and the role of re-reading in source-content integration (RQ1)
In line with our first hypothesis (H1), the provision of the text-highlighting tool increased the number of intertextual connections only for those readers with a high number of re-readings of previously read documents, but not for those with a low number of re-readings. Further, only for readers who were provided with the text-highlighting tool, the number of intertextual connections in essays was positively related to the number of re-readings, but not for those who were not. That is, the more readers who were provided with the text-highlighting tool engaged in re-reading previously read documents, the more intertextual connections they included in their essays. These findings replicate the results by Leroy et al. (Citation2021). However, it should be noted that these results were only significant for the 3 sec threshold (as well as for the 4 and 5 sec thresholds, and marginally significant for the 2 sec threshold), but not for the 1 sec threshold.
For our second integrated understanding measure, that is, readers’ performance in the source-content mapping task, our hypothesis (H2) of an interactive effect was not confirmed. Regardless of whether the text-highlighting tool was provided, a positive relation with the number of re-readings was shown. That is, the more participants engaged in re-reading previously read documents, the higher they scored in the source-content mapping task. Here it should be noted that these results were significant for the 1 sec threshold (and for the 2 sec threshold), but only marginally significant for the 3 sec threshold (as well as for the 4 and 5 sec thresholds). The positive relationship between engagement in re-reading and source-content integration is in line with the finding by Delgado et al. (Citation2020) who have reported a positive relation between the number of times participants had opened pop-up windows that provided hints about conflicting information in other documents and participants’ source-content integration. However, since these pop-up windows explicitly provided participants with the conflicting information, the present study is the first reporting a positive relation between the number of re-readings and readers’ source-content integration when no hints about conflicting information across documents are provided.
Several conclusions can be drawn from our findings. First, the interaction between text-highlighting and the number of re-readings regarding the number of intertextual connections in essays suggests that there is no general beneficial effect of providing a text-highlighting tool. Further, similar as in the study by Leroy et al. (Citation2021) participants made more than 85% of their highlights during initial readings – hence, most highlights were already in the documents at the time of re-reading. Thus, our finding that the provision of the text-highlighting tool only benefitted intertextual integration of readers with a high number of re-readings supports the assumption that highlighted text facilitates the comparison and corroboration of information during re-reading. That is, the pop-out effect of highlighted text may yield more effective re-processing of contents (cf. Yeari, Oudega, and Van den Broek Citation2017) compared to when text cannot be highlighted. This, in turn, may support intertextual integration, especially during re-reading. Second, the positive relation between participants’ score in the source-content mapping task and the number of re-readings that we found in both conditions, suggests that source-content integration benefits from re-reading, regardless of whether a text-highlighting tool is provided or not. Since the reading material included two documents taking a positive and a negative overall stance, respectively, the increased reprocessing of information across documents through re-reading might have supported readers in differentiating among the documents, as well as in differentiating among specific arguments.
Taken together, when readers were provided with the text-highlighting tool, both measures of integrated understanding were positively related to the number of re-readings. For readers who were not provided with the text-highlighting tool, only their score in the source-content mapping task was positively related to the number of re-readings. This suggests differential effects of reading actions and support tools for different aspects of readers’ integrated understanding. In conclusion, these findings support the assumption made by the RESOLV model (Britt, Rouet, and Durik Citation2018; Rouet, Britt, and Durik Citation2017), which posits that it depends on the reading environment (or the support tools provided by it) whether reading actions taken are more or less beneficial for readers’ integrated understanding of multiple documents. Finally, from a methodological perspective regarding the role of the chosen re-reading threshold, for intertextual integration, analyses yielded significant results only for re-reading thresholds of at least 3 sec, but not when also very short re-accesses of less than 3 sec were included. In contrast, with regard to source-content integration, analyses showed significant correlations with the number of re-readings especially when re-accesses that lasted less than 3 sec were also included. The generation of an elaborate mental representation of source-content links requires readers to connect the gist of the document (as well as unique information provided by that document) to its source. As the present study provided documents’ sources saliently at the top of the document in the form of large wordmark logos, this might also be possible during short re-accesses of up to 3 sec. In contrast, comparing, contrasting, or connecting a piece of information to information provided by another document in order to generate intertextual connections requires more in-depth processing or re-processing of the text, which is unlikely to be possible during very short re-accesses. In conclusion, re-accesses that last less than 3 sec might be more suitable for the generation of source-content links than for the generation of intertextual connections. Nonetheless, it should be mentioned that the overall results pattern both for the number of intertextual connections and for source-content mapping performance were similar for all five re-reading thresholds investigated.
5.2. Differences in (re-)reading behaviour with versus without text-highlighting (RQ2)
As in previous work (e.g. Ben-Yehudah and Eshet-Alkalai Citation2018; Leroy et al. Citation2021; Li, Tseng, and Chen Citation2016), participants of the present study who were provided with the text-highlighting tool took longer overall for the reading task than those without the text-highlighting tool. However, when the time participants in the with-highlighting condition took for highlighting was subtracted from the overall time on task, there was no difference between conditions. Hence, the longer reading time for participants who are able to highlight text might be due to the act of highlighting itself. Yet, our more fine-grained differentiation into initial readings and re-readings revealed that, in line with our third and fourth hypotheses, regardless of whether the time taken for highlighting was subtracted or not, participants in the with-highlighting condition had significantly longer initial reading times (H3), but shorter re-reading times (H4) than participants in the without-highlighting condition. These findings are particularly interesting because participants in the with-highlighting condition made most of their highlights during initial readings. Hence, the longer initial reading times may have originated from the decision process of which information to highlight. Regarding the difference in re-reading times, additional exploratory analyses revealed that the difference was especially pronounced for participants with a high number of re-readings. That is, particularly readers who were provided with the text-highlighting tool and made many re-readings had shorter re-reading times than readers who were not provided with the text-highlighting tool and made many re-readings. Because overall the number of re-readings did not differ between the with-highlighting and without-highlighting conditions, this latter finding supports the notion of a time-saving re-processing of information during re-reading of previously highlighted text compared to text without highlighting (Yeari, Oudega, and Van den Broek Citation2017). This is particularly intriguing, since the provision of the text-highlighting tool was found to benefit intertextual integration only of participants with a high number of re-readings. Hence, for readers with a high number of re-readings, those who had the possibility to highlight text showed better intertextual integration and also took less time for re-reading documents than those who did not have the possibility to highlight text. This indicates that participants who were not provided with the text-highlighting tool may have had to take more time to re-locate information during re-readings (cf. Yeari, Oudega, and Van den Broek Citation2017), which, however, did not benefit their intertextual integration.
The assumption that previously made highlights serve readers to focus their visual attention during re-readings was also at least partly supported by our exploratory analyses regarding fixation coverage (Goldberg and Kotval Citation1999; Sharafi, Shaffer, and Sharif Citation2015) during re-readings (that lasted at least 5 sec). Results showed significantly smaller fixation coverage in the with-highlighting than in the without-highlighting condition, however, only for two out of the five documents. Yet, it should be noted that our sample for the analyses regarding the fixation coverage during re-readings was quite small, because not all participants had re-read each document. Therefore, statistical power might have been too low to detect differences in the other documents.
5.3. Limitations and future work
This study does not come without limitations. First, we examined a rather homogenous sample of university students, which can be considered advanced readers. Yet, the fact that our findings showed a significant role of re-reading (when text-highlighting was possible) even in a sample of presumably advanced readers, stresses the importance of reading actions even more. In this regard, future research should investigate whether trainings in re-reading might benefit readers who usually engage in such reading actions less.
Second, in the present study, participants read the documents on a touch display. This methodological approach was taken because we wanted to replicate and extend previous findings of a study in which documents had also been read on a touch display (Leroy et al. Citation2021), and because previous research has found indications that the effect of text-highlighting on readers’ resulting text comprehension might be affected by the reading medium and, thus, the highlighting methodology (i.e. highlighting with the finger or highlighter-pen might be more effective than highlighting with a computer-mouse; e.g. Ben-Yehudah and Eshet-Alkalai Citation2014; Goodwin et al. Citation2020). Hence, even though numerous applications exist that provide highlighting-tools particularly for touch devices, such as e-readers and tablets, future research should also investigate whether our findings regarding the moderating role of readers’ engagement in re-reading in the effect of text-highlighting on intertextual integration can be replicated when documents are read on a computer screen and text is highlighted with a mouse.
Third, we assessed the number of re-readings as an indicator of the degree to which participants had compared and corroborated information across documents (cf. Anmarkrud, Bråten, and Strømsø Citation2014; Goldman et al. Citation2012; List and Alexander Citation2017). Yet, the fact that the extent of engaging in re-reading was also related to source-content integration suggests that re-readings may (also) be initiated for other reasons than for comparing and corroborating information across documents. Future research could use think-aloud methodology (e.g. Anmarkrud, Bråten, and Strømsø Citation2014; Bråten et al. Citation2014; Goldman et al. Citation2012; Wineburg Citation1991) to investigate the reasons behind individuals’ re-reading strategies when using a text-highlighting tool or not.
Fourth, to measure participants’ source-content integration, we used a mapping task in which one key statement of each of the five documents had to be matched to the respective source logo (i.e. the document’s source). While we want to point out that we observed no ceiling effects in this task, we acknowledge that by using additional distractor statements not covered in any of the documents (cf. e.g. Delgado et al. Citation2020), would have resulted in a more complex source-content mapping task.
Fifth, the effect sizes of the (moderating) role of reading interactions in readers’ intertextual integration and source-content integration were rather small, especially in comparison with the strong effect size of the interaction between text-highlighting and the number of re-readings on the number of intertextual connections reported in Leroy et al. (Citation2021). Yet, both, the present findings and those reported by Leroy et al. (Citation2021; and others investigating the effect of text-highlighting on readers’ integrated understanding of multiple documents, e.g. Li, Tseng, and Chen Citation2016) suggest that there is no general beneficial effect of text-highlighting – rather, it only comes to bear in combination with reading interactions. Thus, on the one hand, additional research is required to further investigate the importance of reading interactions (and how they reflect strategical processing) in forming an integrated understanding of multiple documents. On the other hand, the present findings suggest that readers’ integrated understanding of multiple documents might be fostered by interventions that teach readers how to interact with documents.
Finally, the mobile eye-tracking system used in the present study operated at a temporal resolution of 50 Hz (i.e. a sample is registered once every 20 ms), which is on the lower end of apparatuses available. Especially in order to assess more fine-grained reading measures from eye-tracking such as regressions or saccade amplitudes or duration (cf. Liversedge and Findlay Citation2000; Rayner Citation2009), higher resolutions would yield more reliable results. Yet, we would like to point out that other recent research from the field of multiple document comprehension (Delgado and Salmerón Citation2022; Latini, Bråten, and Salmerón Citation2020) with similar research questions used a comparable mobile eye-tracking system. Furthermore, fixations are far less susceptible to distortion due to a rather low temporal resolution than are saccade-related measures (Andersson, Nyström, and Holmqvist Citation2010).
5.4. Conclusion
The present study replicated the findings by Leroy et al. (Citation2021) of a moderating role of the number of re-readings on the effect of text-highlighting on readers’ intertextual integration when reading multiple, partly conflicting documents about a health-related issue on a touch display. We extended these findings in several ways. First, additional analyses revealed that particularly amongst participants with a high number of re-readings, those who were provided with the text-highlighting tool had shorter re-reading times than those who read the documents without a text-highlighting tool. Hence, for participants with a high number of re-readings, the provision of a text-highlighting tool resulted in both time-saving re-processing and better integrated understanding. Second, an examination of a second measure of readers’ integrated understanding, their source-content integration, revealed that participants’ score in the source-content mapping task was positively related to their engagement in re-reading, regardless of whether the text-highlighting tool was provided or not.
Together, these findings suggest that both the characteristics of the reading environment and readers’ engagement in reading actions play a role in readers’ integrated understanding of multiple documents (cf. Britt, Rouet, and Durik Citation2018; Rouet, Britt, and Durik Citation2017). This stresses the importance of assessing reading actions – such as readers’ engagement in re-reading – when investigating the potential effects of characteristics of the reading environment on readers’ integrated understanding. Furthermore, our findings suggest that the relation between the characteristics of the reading environment and readers’ engagement in reading actions may differ depending on the concrete aspect of integrated understanding assessed. Related to this latter issue, also the optimal threshold to define re-readings might depend on the concrete measure of readers’ integrated understanding, and, thus, should be chosen deliberately.
Supplemental Material
Download MS Word (46.4 KB)Disclosure statement
No potential conflict of interest was reported by the author(s).
Additional information
Funding
Notes
1 Please note that in the study by Kobayashi (Citation2009) participants received one of two reading instructions, namely, to form an opinion or to find relations between texts. However, Kobayashi (Citation2009) only found differences in the relation-finding group. These are the results that are reported here.
2 Based on the regression coefficients provided by Leroy et al. (Citation2021) for the interaction between text-highlighting and the number of revisits on the number of intertextual connections in essays, we conducted a power analysis using R-package interactionPoweR (Baranger Citation2022). More specifically, we based our power analysis on five simulated data sets generated via the function generate_interaction by using the reported regression coefficients by Leroy et al. (Citation2021). From these data sets we then assessed the correlation coefficients in question using the function test_interaction, and used these for the actual power simulation via the function power_interaction (with 1000 iterations each, and an alpha-level of 0.05) for N = 30 up to N = 100 in steps of 10. These analyses revealed an average power of at least .80 for 50 participants (.59 for N = 30, .74 for N = 40, .82 for N = 50, .89 for N = 60, .92 for N = 70, .94 for N = 80, .97 for N = 90, .98 for N = 100). Please note, however, that due to the exploratory nature of the analyses regarding our second measure of readers’ integrated understanding, we decided for a larger sample size than suggested by the power analysis.
3 On average, participants took M = 3.19 min (SD = 1.46 min.) to write their prior topic knowledge essays that comprised an average of M = 64.66 words (SD = 32.24 words).
4 This interaction was marginally significant for the 2 sec threshold, and significant for the 4 and 5 sec thresholds (see Table S4 of the Supplemental Material for all analyses).
5 Note that these analyses are reported for the 3 sec threshold here. Yet, this pattern of results was also the same for the 2, 4, and 5 sec thresholds (see Table S5 of the Supplemental Material for all analyses).
6 For the 2, 4, and 5 sec thresholds the effect was also marginally significant (see Table S4 of the Supplemental Material).
7 This interaction was also significant for the 1, 2, and 4 sec thresholds, and marginally significant for the 5 sec threshold (see Table S7 of the Supplemental Material).
8 Note that these analyses are reported for the 3 sec threshold here. Yet, this pattern of results was also the same for the 1, 2, 4, and 5 sec thresholds (see Table S7 of the Supplemental Material for all analyses).
References
- Afflerbach, P., and B.-Y. Cho. 2009. “Determining and Describing Reading Strategies: Internet and Traditional Forms of Reading.” In Metacognition, Strategy Use, and Instruction, edited by H. S. Waters and W. Schneider, 201–225. New York: Guilford Press.
- Aiken, L. S., and S. G. West. 1991. Multiple Regression: Testing and Interpreting Interactions. London: Sage.
- Andersson, R., M. Nyström, and K. Holmqvist. 2010. “Sampling Frequency and Eye-tracking Measures: How Speed Affects Durations, Latencies, and more and Eye-tracking Measures: How Speed Affects Durations, Latencies, and More.” Journal of Eye Movement Research 3 (3): 1–12. doi:10.16910/jemr.3.3.6.
- Anmarkrud, Ø, I. Bråten, and H. I. Strømsø. 2014. “Multiple-documents Literacy: Strategic Processing, Source Awareness, and Argumentation When Reading Multiple Conflicting Documents.” Learning and Individual Differences 30: 64–76. doi:10.1016/j.lindif.2013.01.007.
- Baranger, D. 2022. InteractionPoweR: Power analysis for interactions via simulation. R package version 0.1.0.5, https://dbaranger.github.io/InteractionPoweR.
- Barzilai, S., A. R. Zohar, and S. Mor-Hagani. 2018. “Promoting Integration of Multiple Texts: A Review of Instructional Approaches and Practices.” Educational Psychology Review 30 (3): 973–999. doi:10.1007/s10648-018-9436-8.
- Ben-Yehudah, G., and Y. Eshet-Alkalai. 2014. “The Influence of Text Annotation Tools on Print and Digital Reading Comprehension.” Proceedings of the 9th chais conference for innovation in learning technologies, November 2014, 28–35.
- Ben-Yehudah, G., and Y. Eshet-Alkalai. 2018. “The Contribution of Text-Highlighting to Comprehension: A Comparison of Print and Digital Reading.” Journal of Educational Multimedia and Hypermedia 27 (2): 153–178.
- Björnsson, C. 1968. Läsbarhet [Readability]. Stockholm: Liber.
- Bråten, I., Ø Anmarkrud, C. Brandmo, and H. I. Strømsø. 2014. “Developing and Testing a Model of Direct and Indirect Relationships Between Individual Differences, Processing, and Multiple-Text Comprehension.” Learning and Instruction 30: 9–24. doi:10.1016/j.learninstruc.2013.11.002.
- Bråten, I., L. E. Ferguson, H. I. Strømsø, and Ø Anmarkrud. 2014. “Students Working with Multiple Conflicting Documents on a Scientific Issue: Relations Between Epistemic Cognition While Reading and Sourcing and Argumentation in Essays.” British Journal of Educational Psychology 84 (1): 58–85. doi:10.1111/bjep.12005.
- Britt, M. A., C. A. Perfetti, R. Sandak, and J.-F. Rouet. 1999. “Content Integration and Source Separation in Learning from Multiple Texts.” In Narrative Comprehension, Causality, and Coherence, edited by S. R. Goldman, A. C. Graesser, and P. Van den Broek, 209–232. London: Routledge.
- Britt, M. A., and J.-F. Rouet. 2012. “Learning with Multiple Documents.” In Enhancing the Quality of Learning: Dispositions, Instructions, and Learning Processes, edited by J. R. Kirby, and M. J. Lawson, 276–314. Cambridge: Cambridge University Press. doi:10.1017/cbo9781139048224.017.
- Britt, M. A., J.-F. Rouet, and A. Durik. 2018. “Representations and Processes in Multiple Source use.” In Handbook of Multiple Source Use, edited by J. L. G. Braasch, I. Br̊aten, and M. T. McCrudden, 17–33. New York: Routledge. doi:10.4324/9781315627496.
- Britt, M. A., P. Wiemer-Hastings, Aaron. A. Larson, and C. A. Perfetti. 2004. “Using Intelligent Feedback to Improve Sourcing and Integration in Students’ Essays.” International Journal of Artificial Intelligence in Education 14 (3): 359–374.
- Chi, E., M. Gumbrecht, and L. Hong. 2007. “Visual Foraging of Highlighted Text: An Eye-Tracking Study.” In Human-Computer Interaction, Part III, HCII 2007, edited by J. A. Jacko, 589–598. Berlin: Springer. doi:10.1007/978-3-540-73110-8_64.
- Delgado, P., and L. Salmerón. 2022. “Cognitive Effort in Text Processing and Reading Comprehension in Print and on Tablet: An eye-Tracking Study.” Discourse Processes 59 (4): 237–274. doi:10.1080/0163853X.2022.2030157.
- Delgado, P., E. Stang Lund, L. Salmerón, and I. Bråten. 2020. “To Click or not to Click: Investigating Conflict Detection and Sourcing in a Multiple Document Hypertext Environment.” Reading and Writing 33: 2049–2072. doi:10.1007/s11145-020-10030-8.
- Du, H., and A. List. 2020. “Researching and Writing Based on Multiple Texts.” Learning and Instruction 66: 101297. doi:10.1016/j.learninstruc.2019.101297.
- Dunlosky, J., K. A. Rawson, E. J. Marsh, M. J. Nathan, and D. T. Willingham. 2013. “Improving Students’ Learning With Effective Learning Techniques.” Psychological Science in the Public Interest 14 (1): 4–58. doi:10.1177/1529100612453266.
- Ferguson, L. E., and I. Bråten. 2013. “Student Profiles of Knowledge and Epistemic Beliefs: Changes and Relations to Multiple-Text Comprehension.” Learning and Instruction 25: 49–61. doi:10.1016/j.learninstruc.2012.11.003.
- Fowler, R. L., and A. S. Barker. 1974. “Effectiveness of Highlighting for Retention of Text Material.” Journal of Applied Psychology 59 (3): 358–364. doi:10.1037/h0036750.
- Freund, L., R. Kopak, and H. O’Brien. 2016. “The Effects of Textual Environment on Reading Comprehension: Implications for Searching as Learning.” Journal of Information Science 42 (1): 79–93. doi:10.1177/0165551515614472.
- Goldberg, J. H., and X. P. Kotval. 1999. “Computer Interface Evaluation Using eye Movements: Methods and Constructs.” International Journal of Industrial Ergonomics 24 (6): 631–645. doi:10.1016/S0169-8141(98)00068-7.
- Goldman, S. R., J. L. G. Braasch, J. Wiley, A. C. Graesser, and K. Brodowinska. 2012. “Comprehending and Learning from Internet Sources: Processing Patterns of Better and Poorer Learners.” Reading Research Quarterly 47 (4): 356–381. doi:10.1002/RRQ.027.
- Goodwin, A. P., S. J. Cho, D. Reynolds, K. Brady, and J. Salas. 2020. “Digital Versus Paper Reading Processes and Links to Comprehension for Middle School Students.” American Educational Research Journal 57 (4): 1837–1867. doi:10.3102/0002831219890300.
- Haber, J., M. A. Nacenta, and S. Carpendale. 2014. “Paper vs. Tablets: The Effect of Document Media in co-Located Collaborative Work.” In Proceedings of the 2014 International Working Conference on Advanced Visual Interfaces, edited by F. Garzotto, A. de A. Paolini, G. Jacucci, A. Malizia, M. Matera, and R. Lanzilotti, 89–96. Como, Italy: ACM. doi:10.1145/2598153.2598170.
- Johnson, L. L. 1988. “Effects of Underlining Textbook Sentences on Passage and Sentence Retention.” Reading Research and Instruction 28 (1): 18–32. doi:10.1080/19388078809557955.
- Just, M. A., and P. A. Carpenter. 1980. “A Theory of Reading: From Eye Fixations to Comprehension.” Psychological Review 87 (4): 329–354. doi:10.1037/0033-295X.87.4.329.
- Kammerer, Y., N. Meier, and E. Stahl. 2016. “Fostering Secondary-School Students’ Intertext Model Formation When Reading a Set of Websites: The Effectiveness of Source Prompts.” Computers & Education 102: 52–64. doi:10.1016/j.compedu.2016.07.001.
- Kane, M. J., D. Z. Hambrick, S. W. Tuholski, O. Wilhelm, T. W. Payne, and R. W. Engle. 2004. “The Generality of Working Memory Capacity: A Latent-Variable Approach to Verbal and Visuospatial Memory Span and Reasoning.” Journal of Experimental Psychology: General 133 (2): 189–217. doi:10.1037/0096-3445.133.2.189.
- Kiili, C., and D. J. Leu. 2019. “Exploring the Collaborative Synthesis of Information During Online Reading.” Computers in Human Behavior 95: 146–157. doi:10.1016/j.chb.2019.01.033.
- Kobayashi, K. 2007. “The Influence of Critical Reading Orientation on External Strategy Ese During Expository Text Reading.” Educational Psychology 27 (3): 363–375. doi:10.1080/01443410601104171.
- Kobayashi, K. 2009. “Comprehension of Relations among Controversial Texts: Effects of External Strategy Use.” Instructional Science 37 (4): 311–324. doi:10.1007/s11251-007-9041-6.
- Latini, N., I. Bråten, and L. Salmerón. 2020. “Does Reading Medium Affect Processing and Integration of Textual and Pictorial Information? A Multimedia Eye-tracking Study.” Contemporary Educational Psychology 62: 1–13. doi:10.1016/j.cedpsych.2020.101870.
- Leroy, C., P. Gerjets, U. Oestermeier, and Y. Kammerer. 2021. “Simultaneous Presentation of Multiple Documents and Text-Highlighting: Online Integrative Processes and Offline Integrated Understanding.” Scientific Studies of Reading 25 (2): 179–192. doi:10.1080/10888438.2020.1784903.
- Li, L. Y., S. T. Tseng, and G. D. Chen. 2016. “Effect of Hypertext Highlighting on Browsing, Reading, and Navigational Performance.” Computers in Human Behavior 54: 318–325. doi:10.1016/j.chb.2015.08.012.
- List, A., and P. A. Alexander. 2017. “Text Navigation in Multiple Source use.” Computers in Human Behavior 75: 364–375. doi:10.1016/j.chb.2017.05.024.
- List, A., and P. A. Alexander. 2018. “Corroborating Students’ Self-Reports of Source Evaluation.” Behaviour & Information Technology 37 (3): 198–216. doi:10.1080/0144929X.2018.1430849.
- List, A., and P. A. Alexander. 2020. “Strategy Use in Learning from Multiple Texts: An Investigation of the Integrative Framework of Learning from Multiple Texts.” Frontiers in Education 5: Article 578062. doi:10.3389/feduc.2020.578062.
- List, A., and H. Du. 2021. “Reasoning Beyond History: Examining Students’ Strategy Use When Completing a Multiple Text Task Addressing a Controversial Topic in Education.” Reading and Writing 34 (4): 1003–1048. doi:10.1007/s11145-020-10095-5.
- List, A., H. Du, Y. Wang, and H. Y. Lee. 2019. “Toward a Typology of Integration: Examining the Documents Model Framework.” Contemporary Educational Psychology 58: 228–242. doi:10.1016/j.cedpsych.2019.03.003.
- Liversedge, S. P., and J. M. Findlay. 2000. “Saccadic Eye Movements and Cognition.” Trends in Cognitive Sciences 4 (1): 6–14. doi:10.1016/S1364-6613(99)01418-7.
- Lombard, J., F. Amadieu, I. Bråten, and C. Van de Leemput. 2018. “Reading Multiple Documents on Tablet: Effects of Applications and Strategic Guidance on Performance and Acceptance.” In Learning and Collaboration Technologies. Design, Development and Technological Innovation. Vol. 10924, edited by P. Zaphiris and A. Ioannou, 157–169. Las Vegas, NV: Springer. doi:10.1007/978-3-319-91743-6_12.
- Mahlow, N., C. Hahnel, U. Kroehne, C. Artelt, F. Goldhammer, and C. Schoor. 2020. "More Than (Single) Text Comprehension? – On University Students’ Understanding of Multiple Documents.” Frontiers in Psychology 11: Article 562450. doi:10.3389/fpsyg.2020.562450.
- Margolin, S. J., C. Driscoll, M. J. Toland, and J. L. Kegler. 2013. “E-readers, Computer Screens, or Paper: Does Reading Comprehension Change Across Media Platforms?” Applied Cognitive Psychology 27 (4): 512–519. doi:10.1002/acp.2930.
- Miyatsu, T., K. Nguyen, and M. A. McDaniel. 2018. “Five Popular Study Strategies: Their Pitfalls and Optimal Implementations.” Perspectives on Psychological Science 13 (3): 390–407. doi:10.1177/1745691617710510.
- Olive, T., J. F. Rouet, E. François, and V. Zampa. 2008. “Summarizing Digital Documents: Effects of Alternate or Simultaneous Window Display.” Applied Cognitive Psychology 22 (4): 541–558. doi:10.1002/acp.1380.
- Perfetti, C. A., J.-F. Rouet, and M. A. Britt. 1999. “Toward a Theory of Documents Representation.” In The Construction of Mental Representations During Reading, edited by H. Von Oostendorp and S. R. Goldman, 88–108. Mahwah, NY: Lawrence Erlbaum Associates.
- Peterson, S. E. 1991. “The Cognitive Functions of Underlining as a Study Technique.” Reading Research and Instruction 31 (2): 49–56. doi:10.1080/19388079209558078.
- Ponce, H. R., and R. E. Mayer. 2014. “An Eye Movement Analysis of Highlighting and Graphic Organizer Study Aids for Learning from Expository Text.” Computers in Human Behavior 41: 21–32. doi:10.1016/j.chb.2014.09.010.
- Primor, L., and T. Katzir. 2018. “Measuring Multiple Text Integration: A Review.” Frontiers in Psychology 9: 1–16. doi:10.3389/fpsyg.2018.02294.
- Rayner, K. 1998. “Eye Movements in Reading and Information Processing: 20 Years of Research.” Psychological Bulletin 124 (3): 372. doi:10.1037/0033-2909.124.3.372.
- Rayner, K. 2009. “The 35th Sir Frederick Bartlett Lecture: Eye Movements and Attention in Reading, Scene Perception, and Visual Search.” Quarterly Journal of Experimental Psychology 62 (8): 1457–1506. doi:10.1080/17470210902816461.
- Rouet, J.-F., M. A. Britt, and A. M. Durik. 2017. “RESOLV: Readers’ Representation of Reading Contexts and Tasks.” Educational Psychologist 52 (3): 200–215. doi:10.1080/00461520.2017.1329015.
- Salmerón, L., T. Baccino, J. J. Cañas, R. I. Madrid, I. Fajardo, J. J. Canas, R. I. Madrid, and I. Fajardo. 2009. “Do Graphical Overviews Facilitate or Hinder Comprehension in Hypertext?” Computers & Education 53 (4): 1308–1319. doi:10.1016/j.compedu.2009.06.013.
- Salmerón, L., L. Gil, and I. Bråten. 2018. “Effects of Reading Real Versus Print-out Versions of Multiple Documents on Students’ Sourcing and Integrated Understanding.” Contemporary Educational Psychology 52: 25–35. doi:10.1016/j.cedpsych.2017.12.002.
- Salmerón, L., L. Gil, I. Bråten, and H. Strømsø. 2010. “Comprehension Effects of Signalling Relationships Between Documents in Search Engines.” Computers in Human Behavior 26 (3): 419–426. doi:10.1016/j.chb.2009.11.013.
- Salmerón, L., and A. C. Llorens. 2019. “Instruction of Digital Reading Strategies Based on Eye-Movements Modeling Examples.” Journal of Educational Computing Research 57 (2): 343–359. doi:10.1177/0735633117751605.
- Scheiter, K., and T. Van Gog. 2009. “Using Eye Tracking in Applied Research to Study and Stimulate the Processing of Information from Multi-Representational Sources.” Applied Cognitive Psychology 23 (9): 1209–1214. doi:10.1002/acp.1524.
- Sharafi, Z., T. Shaffer, and B. Sharif. 2015. “Eye-tracking Metrics in Software Engineering.” In Asia-Pacific Software Engineering Conference (APSEC), 96–103. New Delhi, India: IEEE. doi:10.1109/APSEC.2015.53.
- Stang Lund, E., I. Bråten, C. Brandmo, E. W. Brante, and H. I. Strømsø. 2019. “Direct and Indirect Effects of Textual and Individual Factors on Source-Content Integration When Reading About a Socio-Scientific Issue.” Reading and Writing 32 (2): 335–356. doi:10.1007/s11145-018-9868-z.
- Stang Lund, E., I. Bråten, E. W. Brante, and H. I. Strømsø. 2017. “Memory for Textual Conflicts Predicts Sourcing When Adolescents Read Multiple Expository Texts.” Reading Psychology 38 (4): 417–437. doi:10.1080/02702711.2016.1278417.
- Strobelt, H., D. Oelke, B. C. Kwon, T. Schreck, and H. Pfister. 2016. “Guidelines for Effective Usage of Text Highlighting Techniques.” IEEE Transactions on Visualization and Computer Graphics 22 (1): 489–498. doi:10.1109/TVCG.2015.2467759.
- Strømsø, H. I., I. Bråten, Ø Anmarkrud, and L. E. Ferguson. 2016. “Beliefs About Justification for Knowing When Ethnic Majority and Ethnic Minority Students Read Multiple Conflicting Documents.” Educational Psychology 36 (4): 638–657. doi:10.1080/01443410.2014.920080.
- Strømsø, H. I., I. Bråten, and M. A. Britt. 2010. “Reading Multiple Texts About Climate Change: The Relationship Between Memory for Sources and Text Comprehension.” Learning and Instruction 20 (3): 192–204. doi:10.1016/j.learninstruc.2009.02.001.
- Winchell, A., A. Lan, and M. Mozer. 2020. “Highlights as an Early Predictor of Student Comprehension and Interests.” Cognitive Science 44 (11): Article 12901. doi:10.1111/cogs.12901.
- Wineburg, S. S. 1991. “Historical Problem Solving: A Study of the Cognitive Processes Used in the Evaluation of Documentary and Pictorial Evidence.” Journal of Educational Psychology 83 (1): 73–87. doi:10.1037/0022-0663.83.1.73.
- Yeari, M., M. Oudega, and P. Van den Broek. 2017. “The Effect of Highlighting on Processing and Memory of Central and Peripheral Text Information: Evidence from Eye Movements.” Journal of Research in Reading 40 (4): 365–383. doi:10.1111/1467-9817.12072.
- Yue, C. L., B. C. Storm, N. Kornell, and E. L. Bjork. 2014. “Highlighting and its Relation to Distributed Study and Students’ Metacognitive Beliefs.” Educational Psychology Review 27 (1): 69–78. doi:10.1007/s10648-014-9277-z.