
ABSTRACT
Many of our transactions and interactions are now exclusively online; however, whilst we live in a world which is becoming ubiquitously digital, digital exclusion remains a complex societal issue. This study aimed to identify the scale and characteristics of ‘digitally excluded’ individuals in one borough in North East England and investigate factors influencing experiences of digital exclusion. A two-phase, sequential explanatory mixed-methods design was used. Phase One utilised a survey which was sent to every household in the borough (N = >98,000). The surveys (N = 9181) were analysed using exploratory univariate analysis, followed by a two-staged regression model. Of those responses, 1130 individuals (12.3%) were identified as digitally excluded. Older adults with disability, no or low-level education, and residing in specific (micro) geographical areas, were at higher risk of digital exclusion. Smaller household sizes and lower income also contributed to digitally exclusion. To further enhance inclusivity, three focus groups were conducted with groups who were identified as being at higher risk of digital exclusion (N = 10). Discussions highlighted the complexities of digital exclusion and digital use across communities and within individual circumstances. Digital exclusion is multi-factored and complex. It requires regional institutions and local communities to collaborate in an integrated governance framework to improve digital inclusion.
1. Introduction
There is an expectation that technology is used ubiquitously across most of the globe. For many, COVID-related lockdowns demonstrated the necessity of having remote digital access, and digital skills to remain connected. However, the way in which individuals utilise digital tools is complex, and multi-tiered, through individual and socio-economic factors such as, cost, skills, choice, and availability (Khalid and Pedersen Citation2016). Despite the need for this rapid online shift during the COVID-19 pandemic, not everyone was able to keep pace with these changes. Digital exclusion gaps remained extensive through this time, and continue for many to the present day (Abey Citation2022) with basic digital skills set to become the largest skills gap in the UK by 2030 (House of Lords Citation2023).
Whilst there are no longer ‘stay-at-home orders’ which were experienced during the COVID-19 pandemic, the digital shift is ever-present and many services, and ways of working, remain ‘digital by default’. This fast-paced digital, and social, change requires constant adjustment from both digital users and non-users (Leppiman et al. Citation2021). However, the digital agenda, which is progressing in local, national, and global organisations, such as government, healthcare services, educational, and financial services, is at odds with the experience of those who are digitally excluded. This has potential wider detrimental impacts on a person’s social and economic capital, as well as impeding civic participation and creating a greater sense of societal disconnect (Ragnedda and Muschert Citation2017).
Digital exclusion is a complex, multi-tiered issue with multiple definitions. ‘Digital exclusion’ has been defined in many ways in the literature (Age UK Citation2021; Eynon and Helsper Citation2011; Vassilakopoulou and Hustad Citation2023). For example, in disability studies, understanding digital exclusion has been guided by established theories of the social model of disability and the adoption of the biopsychosocial model of disability to address systemic barriers and promote inclusive design practices in developing and deploying digital technologies (Hughes Citation2007; Tsatsou Citation2021). This approach aims to empower individuals with disabilities to fully participate in digital society and reduce inequalities in access, skill, and use of technology. Similarly, multiple conceptual frameworks for digital exclusion exist, including those that highlight the importance of access to digital tools, digital skills, and the impact of confidence. More recent literature posits digital exclusion across three levels, digital access, digital skills and usage, and finally the tangible outcomes of using technology that can result in offline benefits (Van Deursen and Helsper Citation2015). The definition of digital exclusion that we used within this current study builds on existing models, theories, and definitions of digital exclusion (Bunyan and Collins Citation2013; Longley and Singleton Citation2009; Van Deursen and Helsper Citation2015; Van Dijk and Hacker Citation2003). The term ‘digital exclusion’ used in this current study refers to the lack of digital access, digital use, digital confidence, or digital skills. This conceptual framework of digital exclusion was purposively comprehensive to ensure that the most digitally excluded individuals were identified and otherwise would have been classed as ‘hard exclusion’ within other policy reports (Abey Citation2022).
In order to access digital technology, an individual must rely on micro, such as location and cost, and meso/macro factors associated with infrastructure and accessibility of digital facilities (Service Citation2014). Whilst broadband connectivity and speed are primarily considered issues in rural areas, inadequate broadband connectivity in urban and sub-urban communities still remains to be an issue (Leckie, Munro, and Pragnell Citation2021). In fact, 1.7 million households in the United Kingdom have no mobile or broadband internet at home (House of Lords Citation2023). Furthermore, physical, psychological, and social barriers of digital use also impact digital inclusion, such as challenges with dexterity and eyesight (Wilson et al. Citation2020; Wilson-Menzfeld et al. Citation2024), confidence and self-efficacy (Age UK Citation2018; Wilson et al. Citation2020; Wilson et al. Citation2023), fear, trust, and security concerns (Age UK Citation2018; Wilson et al. Citation2020; Wilson-Menzfeld et al. Citation2024), and lack of social capital (Friemel Citation2016; Tsai et al. Citation2015; Van Deursen and Helsper Citation2015; Wilson et al. Citation2020). The landscape of digital equipment is ever-changing. These issues highlight the various inequalities and characteristics that heighten the risk of being digitally excluded including, low economic status (Age UK Citation2015; Choi and Dinitto Citation2013; Cresci and Jarosz Citation2010; Gracia and Herrero Citation2009; Hargittai and Dobransky Citation2017; Healthwatch Citation2021; Matthews, Nazroo, and Marshall Citation2019), lower educational attainment (Bergström Citation2017; Cresci and Jarosz Citation2010; Hargittai and Dobransky Citation2017; Neves, Amaro, and Fonseca Citation2013; Yu Citation2016), older age (Bergström Citation2017; Centre for Ageing better Citation2021; Choi and Dinitto Citation2013; Friemel Citation2016; Gilleard and Higgs Citation2008; Gordon and Hornbrook Citation2018; Hargittai and Dobransky Citation2017; Healthwatch Citation2021; Matthews, Nazroo, and Marshall Citation2019; Yoon Citation2018; Yu Citation2016), health status and disability (Age UK Citation2015; Choi and Dinitto Citation2013; Cresci and Jarosz Citation2010; Healthwatch Citation2021; Matthews, Nazroo, and Marshall Citation2019; Yu Citation2016), and English being a second language (Healthwatch Citation2021; Malpass et al. Citation2022; Stone, Rae-Evans, and Maye Citation2020). These inequalities exacerbate digital inequalities but are two-fold in that digital inequalities further exacerbate existing health and social inequalities, further impacting experiences of social exclusion (Helsper Citation2012). Therefore, the digital divide is considered as a critical social policy issue (Helsper Citation2012; Leppiman et al. Citation2021; Martin et al. Citation2016).
Understanding people's attitudes towards digital facilities is also crucial for studying the digital divide. Digital attitudes include factors such as peoples’ willingness to use digital resources and their overall attitudes towards the benefits and risks of technology (Van Deursen and Helsper Citation2015; Wilson et al. Citation2023). These attitudes contribute to shaping patterns of digital inclusion and exclusion within societies (Choi and Dinitto Citation2013). By examining digital attitudes, researchers can better understand why there are disparities in digital access and skills across different populations. Additionally, studying digital attitudes helps policymakers and educators design more targeted interventions and initiatives to reduce the digital divide and promote equitable access to technology and its benefits.
Despite this now widespread recognition of ubiquitous digital living, and the day-to-day impact that digital exclusion can have for individuals across society, existing research in this area has predominantly focused on smaller specific population groups, for example, mental health service users (Greer et al. Citation2019), migrants (Bastick and Mallet-Garcia Citation2022), or older people (Gallistl et al. Citation2021). There is a dearth of research that has investigated digital exclusion on a population level. Furthermore, studies have tended to use quantitative measures with small sample sizes (Bol, Helberger, and Weert Citation2018; Yu, Lin, and Liao Citation2017), purely qualitative methods (Darcy, Yerbury, and Maxwell Citation2019; Luo and Chea Citation2018), or secondary data sources (Lindblom and Räsänen Citation2017; Pick, Sarkar, and Parrish Citation2021) instead of developing specific instruments to focus on the complex nature of digital exclusion. Often, research has also tended to exclusively use online data collection tools; this is problematic because it excludes individuals who are digitally excluded. Identifying effective measures and methods to capture various forms of digital exclusion represents a knowledge gap that this study aims to bridge by establishing primary data collection using mixed-methods incorporating a participatory co-design approach to ensure the investigation content is relevant and engaging. The strength of a mixed method design resides in integrating both quantitative and qualitative data, which enriches the research process (Lawani Citation2021) and enhances the depth of understanding of the multifaceted construct of digital exclusion (Malpass et al. Citation2022). The participatory co-design approach can also contribute to the study's strength through its ability to generate contextually rich insights, develop inclusive solutions and foster collaboration among stakeholders to address the complex issues of digital exclusion throughout the research process. This collaborative approach also empowers participants to contribute their knowledge, expertise, and perspectives, ensuring that research objectives, methods, and outcomes are co-created and reflect the needs and priorities of those affected.
There has also been little research carried out within some of the most digitally excluded populations in the UK. Within England, the North East area has the greatest numbers of those who are digitally excluded particularly in terms of access, internet use, cost, and lack of digital skills (Yates Citation2020). A secondary analysis of Ofcom data (2018–2019) illustrates that over half of respondents (53%) within the North East of England are non-internet users or are ‘very limited users’, representing the largest digital divide between ‘extensive Internet users’ and ‘non-users’ across the UK (Yates Citation2020). Therefore, it is critical to understand this complex issue in more depth, building an evidence base which can support complex solutions to be delivered for those experiencing digital exclusion across the North East of England and nationally. Investigation in the North East area can shed light on digital inclusion patterns, barriers, and digital literacy levels with broader implications beyond regional boundaries. Understanding these dynamics can contribute to global knowledge about digital divide and its impact on society. In addition, studying the North East's experiences can offer comparative perspectives for other regions across the UK or countries dealing with similar issues. For example, understanding the specific challenges faced in the North East, such as access to digital tools, digital skills, or economic disparities, can provide valuable context for broader policy discussions and practical initiatives aimed at reducing digital disparities and promoting equitable access to digital technologies worldwide. This study aimed to explore and gain a more in-depth understanding of digital exclusion across one borough within the North East of England using a co-designed, mixed-methods approach. Specially through:
Identifying the scale and key characteristics of digitally excluded groups
Understanding key factors contributing to digital exclusion
Investigating digital attitudes as a determining factor in digital exclusion
Mapping solutions to improving digital inclusion
2. Materials and methods
2.1. Research design
A sequential explanatory mixed-methods design based on critical realism (Lawani Citation2021) was developed with two phases: (1) a large cross-sectional survey of household residents across one borough within the North East of England; and (2) focus groups to further explore experiences with digitally excluded cohorts. The survey results were used to identify the key characteristics of target participants for the qualitative phase of this study. The qualitative findings supplement and contextualise the quantitative results in a sequential mixed-methods design (Ivankova, Creswell, and Stick Citation2006). Applying this mixed-methods research strategy enabled us to achieve an in-depth understanding of lived experiences of digital exclusion. Furthermore, the survey was developed using participatory co-design principles through the inclusion of several key stakeholders across the health and social care sector, local authority, charitable organisations, and a patient and public group. These stakeholders were fundamental in designing the study, designing and pilot testing the survey tool, recruitment for both phases and dissemination. The co-design approach was instrumental in enhancing the research process by making it more collaborative, relevant, ethical, and impactful. This approach also enabled the study to acknowledge the expertise of diverse stakeholders and recognise the value of collective knowledge and experience in producing meaningful research outcomes.
This study was approved by [40123] and Integrated Research Application System (IRAS) for health and social care/community care research (Project ID Number: 304555). Participants were informed that participation in this study was voluntary, confidential, and anonymous, and they could decline to participate at any stage in the study.
2.2. Sampling and recruitment
2.2.1. Phase one – survey recruitment
Inclusion criteria included age (18 + years) and resident location (living in the borough). A survey package was mailed to each household (>90,000) (census approach) between January and March 2022. The package included: invitation letter, participant information sheet, resident’s survey, a pre-paid envelope for survey return directly to the research team. An informed consent statement was provided on the first page of the survey which required acknowledgement before proceeding. To increase inclusion, distribution was to all residence types, i.e. houses (rented/owned), care homes, sheltered homes, Independent Supported Living services, hostels, etc. Participants could complete the survey on paper, via telephone, or online.
To ensure the inclusion of underserved and digitally excluded groups, the research team supported local organisations (i.e. Healthwatch, Community Healthcare Forum, the local authority, Age UK, VODA, North Tyneside Citizens Advice Bureau) to champion and share information about the survey launch to increase its reach. Social media was also used in this capacity prior to the survey launch.
2.2.2. Phase two – focus group recruitment
Focus groups allowed the challenges of digital exclusion identified in Phase One to be explored in more depth. Target participants for the focus groups were selected based on the survey findings revealing individual characteristics of populations at high risk of digital exclusion (i.e. based on disability, age, education level, and economic status) or were suggested by local expert organisations (i.e. women who experienced domestic abuse). A purposive sampling strategy was used to recruit three focus group cohorts who typically experience digital exclusion: (1) individuals from the deaf and hard of hearing community, (2) young adults living in shelter homes, and (3) women who have experienced domestic violence. Inclusion criteria were the same as it was for Phase One, with the addition of falling into one of the three groupings identified above. The focus groups were planned and supported by local volunteers and voluntary organisations who supported recruitment via flyer distribution across the study area. Potential participants were approached by the research team individually and were adequately informed about the research aim and the focus group process.
2.3. Data collection methods
2.3.1. Phase one – survey design, implementation, and data coding
The survey design drew on existing digital exclusion theory (Van Deursen and Helsper Citation2015; Van Dijk and Hacker Citation2003), which suggests access, skills, and motivation to use digital technology as key measures of digital exclusion. The survey was co-developed with key stakeholders, who drafted, revised, and added further questions/sections for inclusion and removal. The survey also included a section to capture attitudes towards digital tools, based on input from the stakeholders and literature (Choi and Dinitto Citation2013; Van Deursen and Helsper Citation2015).
The survey included three main sections: an individual demographic section, a household demographic section, and a section related to the use of digital tools. The last section contained Likert-style scale questions about access to digital tools (including tablets, laptops, desktop computers, smartphones, smart speakers, mobile data, and broadbands); use of digital tools and apps (e.g. items measuring the frequency of use of email, social media apps, online shopping, online banking); self-assessment of digital skills (e.g. self-assessing ability to process information online) and confidence in using digital tools (e.g. items measuring confidence in understanding/using terms related to digital tools/internet/apps). The survey also posed dichotomous and multiple-choice questions regarding digital attitudes, such as attending digital skills training classes in the last 5 years, having privacy/security concerns when online, and believing the COVID pandemic’s impact on using digital tools. The survey concluded with an open-ended question asking respondents to share their thoughts/suggestions to support the access to/ongoing use of digital tools (a copy of the survey is available upon request).
A draft version of the survey was sent for expert review to nine people within the co-design group who engaged in the survey’s design and pilot testing to ensure the validity of the measurements. Comments and suggestions were collected covering the content, clarity, style, and formatting. These included, for example, suggestions on measuring access to digital tools/internet via offering options to respondents to specify their ways of access, including their own access, access through someone else living in their household or outside of their household (e.g. friends, family), access through local services (e.g. local library) or no access at all, which were not separated within existing measures introduced by digital exclusion theory (Van Deursen and Helsper Citation2015; Van Dijk and Hacker Citation2003). Amendments and revisions were made accordingly, and the validity of the survey was confirmed by independent experts from North Tyneside’s digital inclusion steering group. The final survey was piloted with 35 local participants aged 20 to 85 years (M = 54, SD = 19). After data collection, Cronbach's alpha was calculated by grouping five-point Likert questions covering related topics such as digital confidence, digital skills, and digital willingness. The reliability value according to Cronbach's alpha coefficient was 0.844, ranging from 0.772 to 0.871 across various variables, indicating a good level of reliability. The Cronbach's alpha value of 0.887 for digital use, consisting of 13 items, also indicated a good internal consistency of subscale measurements.
2.3.2. Phase two – focus group data collection
The interview guide for the focus groups was co-developed through a participatory approach between the research team and key stakeholders, including the health and social care sector, local authorities, and charitable organisations. The interview guide was developed to elicit information regarding the participants’ experiences of accessing/using digital tools and their attitudes towards digital facilities. Focus group schedules were semi-structured, based on findings from the survey (Phase One). The schedule was adapted to suit each participant group and included a collection of non-identifiable demographic information. Two trained and experienced researchers [GE, HDL] planned and facilitated focus groups and were guided by the interview guide. A qualified BSL interpreter was also used to facilitate communication during the focus groups with deaf participants. Focus groups lasted between one to two hours and were conducted in accessible community settings. All participants provided written informed consent, and a £10 voucher was given to each individual to thank them for their participation. All three focus groups were audio recorded, transcribed verbatim, and transcriptions anonymised by removing any names, placenames or identifying text.
2.4. Data analysis
2.4.1. Phase one – survey data analysis
On completion of Phase One data collection, all paper-based survey responses were inputted into an electronic database in Microsoft Excel. Data gathered from both paper-based and web-based surveys were consolidated and combined into a single master database. Data cleaning involved checking the accuracy of data entry, the inclusion criteria for minimum age and location (i.e. residents within the borough), missing values, and outliers. The master database was exported into the IBM SPSS Statistics version 28 for analysis. Initially, descriptive and univariate statistical analyses were performed to understand the sample and identify significant variables (using t and chi-square tests). Then, a two-stage model was developed to explore the key factors influencing digital exclusion.
2.4.2. Phase two – focus group analysis
Focus group transcripts were analysed using inductive, latent Thematic Analysis (Braun and Clarke Citation2006; Braun and Clarke Citation2019). Thematic Analysis, unlike many other qualitative data analysis methods, is a theoretically flexible tool which may be used in alignment with a range of philosophical positions such as critical realism which views social reality as complex and multi layered (Braun, Clarke, and Hayfield Citation2022). Two members of the team [KB, GWM] analysed the focus groups. Thematic analysis followed six steps suggested by Braun and Clarke (Citation2006); familiarity with the dataset, generating initial codes, developing themes, reviewing and adapting themes, and finally producing the final product. In the first step, all transcripts were read carefully to obtain a better contextual understanding of each focus group discussion. In the next step, descriptive codes were developed (e.g. comments on experiences of accessing/using digital tools). Designated analytical themes were developed to classify the barriers and facilitators to technology adoption for each focus group. The findings were discussed, challenged, added to and agreed by the wider research team (AS, GE, KB, WC, LYM). This procedure was repeated for several iterations, resulting in multiple enhancements of the primary themes and subthemes to provide an explanatory understanding of digital exclusion in the region. NVivo11, QSR International, software was used to store and manage qualitative data.
3. Results of residents’ survey
3.1. Sample population
After removing duplicates and data cleaning, 9181 completed surveys were analysed (7513 paper-based, 1668 web-based, and 12 telephone). To our best knowledge, this is the first survey study of this sample size that focuses explicitly on digital exclusion. It is hypothesised that such a large sample size was gained (9.3%) through dissemination strategies which covered the entire household population across the borough, and through offering different modes of participation. presents sample characteristics.
Table 1. Demographic profile of the total sample and digitally excluded respondents.
Most respondents reported being female (60%), married (61%), white residents (97%), and aged between 60-79 years old (54%). The average age was 63 (SD = 15.05), with a median age of 66 years (range 18–101 years). The majority of respondents indicated certain educational qualifications, while a minority of less than 11% disclosed having no qualifications. Although most respondents were homeowners (%62), the annual household income (54%) for the majority was £40 K or below. These results were generally consistent with the demographic characteristics of the study area population – enhancing the generalisability of results. On average, the respondents of this study are relatively old, possess some levels of education, and predominantly belong to the white ethnic group who own their homes outright, representing demographic characteristics for the whole study-area population.
3.2. Digital exclusion construct
The dependent variable to be explained in the regression modelling of this study is digital exclusion (as defined above). This was identified using several questions from the survey to construct the ‘digital exclusion’ variable, as follows. Access to digital devices was captured by asking respondents if they had access to tablet, laptop, desktop computer, smartphone, and smart speaker. A lack of digital access was determined when a respondent had selected ‘no access’ to all digital tools. Using digital tools was captured by asking residents how often they had used Email, Social media sites, Online shopping, Online banking, Online GP appointments, entertainment (e.g. BBC iPlayer), Video calling (e.g. FaceTime, Skype, Zoom, Teams) and Microsoft 365. Respondents lacking digital use were identified if they had selected ‘never use’ or ‘choose not to use’ or ‘may use digital tools annually’ responses. Similarly, a respondent lacking confidence in using digital devices was counted if the respondent had selected ‘no confidence at all’ in using all digital tools. Finally, a lack of digital skills was identified if a respondent had selected ‘very poor’ in responding to assessing their digital skills. Therefore, respondents were clustered as ‘digitally excluded’ when they reported one or more of these four indicators within the survey.
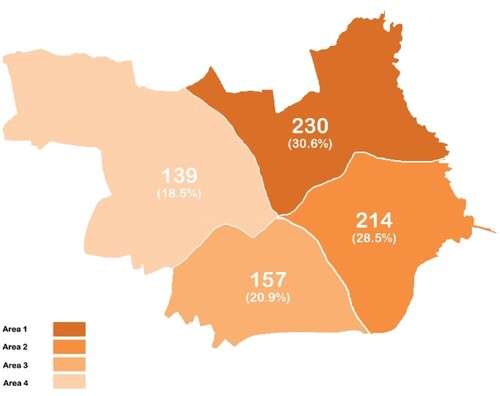
The maps below illustrate the geographic distribution of respondents (by each of the postcode areas) with ‘no access’ to digital tools (n = 290 in total, see ), respondents with ‘no or very limited use’ of digital technologies (n = 448 in total, ), respondents with ‘no confidence’ in using digital tools (n = 868 in total, ), and respondents with ‘very poor’ digital skills across four primary care areas of the borough (n = 752 in total, ).
Figure 1. Frequency distribution of respondents who self-reported ‘no digital access’.
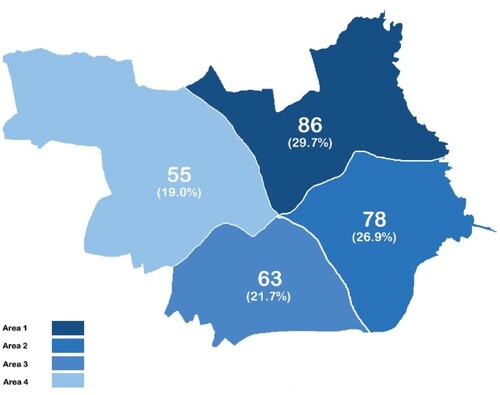
Figure 2. Frequency distribution of respondents who self-reported ‘no digital use’.
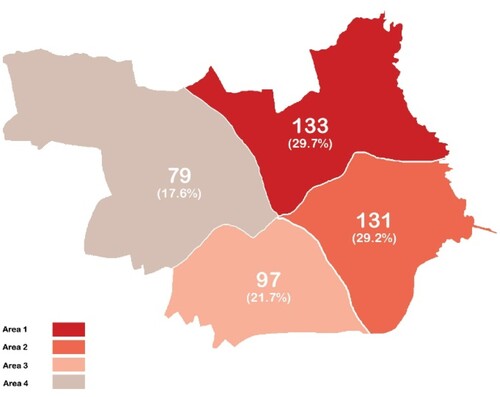
Figure 3. Frequency distribution of respondents who self-reported ‘no confidence in using digital tools’.
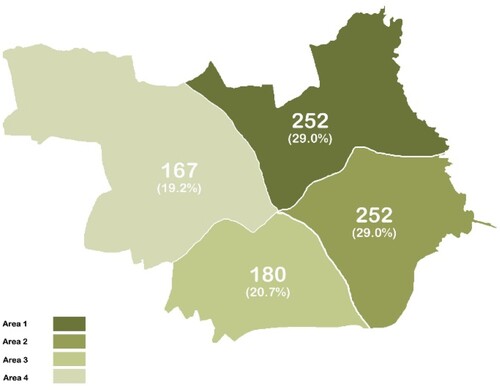
Figure 4. Frequency distribution of respondents who self-reported ‘very poor digital skills’.
The digitally excluded cohort illustrated in shows that the following individuals are more likely to be digitally excluded: Those who are older than 60; Retired; With lower income; No educational qualifications/lower levels of qualifications; Living in a smaller household; Living with a disability or living in a household with someone else with a disability or long-term health condition. This suggests the inclusion of these independent variables in the regression analysis (as described in the next section).
3.3. Multistage modelling
Two logistic regression models were developed to gain insight into the determinants that explain digital exclusion among the residents of a North East of England borough. In the first model, we examined socio-demographic variables as potential predictors of being digitally excluded, while for the second model, we added variables related to digital attitude to the regression equation. presents the results of both models, which include the estimated coefficient (β), standard error (S.E.), statistical significance (p-value) and odds ratio (Exp(β)) for each explanatory variable. Each coefficient indicates the change in the odds of the given outcome, which in this study is a digital exclusion instead of digital inclusion for a one standard deviation increase in the socio-demographic and digital attitude characteristics.
Table 2. Logistic regression models developed to understand the key determinants of being digitally excluded in the borough.
Findings from both regression models were sufficiently robust to estimate digital exclusion. The enhancement of the model's predictability was achieved through the inclusion of explanatory variables on digital attitudes. The first model yielded a Nagelkerke R-square value of 0.308, indicating that socio-demographic factors account for over 30% of the variability in digital exclusion, with the remaining portion explicable by other factors. After adding digital attitude variables, such as concerns regarding privacy and online security or willingness to use digital devices, the Nagelkerke R-square value increased to 56.8% (or 0.568), i.e. both socio-demographic and digital attitude variables contribute to understanding digital exclusion within the borough. The Hosmer and Lemeshow statistics, which showed insignificant p-values for both models, indicate the adequacy and effectiveness of both models in predicting the likelihood of experiencing digital exclusion within our sample. Furthermore, model 1 and model 2 achieved an overall percentage of correctly classified cases of 92.7% and 94.4%, respectively. This indicates that when the chosen predictor variables are considered a collective set, they serve as reliable indicators for comprehending digital exclusion within the borough.
3.3.1. Model 1: used socio-demographic characteristics to predict digital exclusion
The first model used logistic regression analysis to examine whether the socio-demographic characteristics influence the likelihood of being digitally excluded. The results demonstrate that several independent determinants significantly contribute to digital exclusion, including gender, age, educational attainment, employment status, the presence of residents aged 18–59 with a self-reported disability in the household, and residing in Area 4 and Area 3.
According to the results, there is a digital gender disparity between males and females. Male residents exhibit a higher likelihood of being digitally included compared to female residents, i.e. females face a greater risk of being digitally excluded. Age also emerges as a significant determinant in predicting digital exclusion as older residents are more likely to experience digital exclusion than younger residents. Additionally, educational level is a significant predictor of the probability of experiencing digital exclusion. Individuals without a university degree or equivalent, such as those with no or minimal education, vocational education, or other qualifications, are more likely to experience digital exclusion.
Statistical evidence suggests that household income level is another noteworthy determinant of digital exclusion among residents in the borough. It is observed that individuals earning less than £40 K annually have a higher probability of experiencing digital exclusion. Individuals reporting lower income levels (below £40 K annually) are less likely to possess digital inclusion compared to those earning more than £80 K (considered as the reference category).
Another significant contributor to the digital exclusion model is the employment status of individuals. Individuals who are employed whether on a part-time or full-time basis, are more than twice as likely to be digitally included compared to those who are ‘unable to work’. Being employed reduces the likelihood of experiencing digital exclusion. Furthermore, individuals who are unable to work due to a disability or living with someone with long-term health conditions are also more likely to be digitally excluded. Specifically, households that reported having a disability are more likely to experience digital exclusion. However, as indicated by household size, residing in a larger household significantly decreases the likelihood of digital inclusion compared to smaller households.
It becomes evident that residents residing in Area 1 and Area 3 are at a higher risk of digital exclusion than those in Area 4. Choosing Area 4 as the reference category was due to its self-reported lowest proportion of digital exclusion and lack of digital access, use, skills, and confidence than all other areas. Tenure status also explains the probability of being digitally excluded. The results reveal that individuals who rent are more likely to experience digital exclusion compared to homeowners, regardless of whether they have a mortgage or not. However, it is worth noting that this association lacks statistical significance when considering other forms of dwelling.
3.3.2. Model 2: added digital attitude variables to predictors of the digital exclusion model
The integration of digital attribute variables resulted in a slight decrease in the number of participants, from 6863 in Model 1 to 6315 in Model 2. shows that three reported digital attitudes were statistically significant in predicting digital exclusion while controlling for gender, household size, disability, employment status level, and tenure status. These socio-demographic variables were found to be statistically non-significant, indicating no significant difference in these variables between digitally included and excluded cohorts in the second model. However, other socio-demographic determinants, such as education and age, remained highly consistent as additional variables were entered into the model. This suggests that the digitally excluded individuals were more likely to be older residents with limited or no education, while we accounted for this discrepancy by including these variables in the logistic model. The odd ratio for individuals who reported ‘no qualifications’ and ‘GCSEs or equivalent’, further supports the previous findings in the first model, indicating residents with lower educational attainment are at higher risk of digital exclusion.
Furthermore, the variables on primary care location and income level remained statistically significant at a 10 per cent level in the second model. Model 2 also reveals that individuals with lower incomes residing in Area 1 and Area 3 exhibit a decreased likelihood of digital inclusion compared to those living in Area 4, which aligns with the results of the first model.
Individuals with ‘privacy/security concerns when using digital tools online’ are less likely to be digitally excluded, i.e. those who reported concerns about privacy and security when using the internet are more likely to be digitally included rather than excluded. Moreover, respondents who express their ‘willingness to incorporate digital tools into their daily lives’ are more likely to be digitally included rather than excluded. A significant association exists between the willingness to adopt digital tools and an increased probability of being digitally included instead of excluded.
Ultimately, individuals who believed that ‘the COVID pandemic pushed them to use digital tools more often’ are less likely to be digitally excluded. The proportion of digitally included respondents is approximately twice as high as the likelihood of being excluded among those who acknowledged the pandemic's influence on their digital tool usage. The results show that ‘attending digital skills classes in the last five years’ was statistically insignificant in predicting this study's outcome of interest.
4. Results of focus groups
Three focus groups were conducted (see the characteristics of the focus groups in ). Two themes, each with subthemes, were generated: Technology adoption and Barriers to technology use.
Table 3. Characteristics of the focus groups.
4.1. Technology adoption
Individuals within the focus groups discussed the characteristics around their own technology adoption which was impacted by both contextual and personal factors, such as age and cost. The timing in which individuals adopted technology, as well as their motivations for doing so, impacted the way in which they used technology.
4.1.1. Early vs. late adoption
There were clear generational differences impacting digital inclusion across focus groups. These differences could often be explained by characteristics of technology adoption – particularly the timing of technology initiation. P001 (female) was a ‘late adopter’ to new technology in her personal life, for example, she had opted for a simple mobile phone rather than a smart phone. It is important for those who consider themselves to be ‘late adopters’ to recognise the benefits of a new digital device (in this case a smart phone) or that upgrade would have for them. In buying a new device, or upgrading an existing one, there is both financial investment and time commitment in doing so.
I’m a late adopter to smart phones. It’s quite a simple one. […] Most people have got them. And a friend of mine had one and she said, oh, I’ve got this one and it’s for stupid old people […]. And they said this was a good one for people with hearing loss. (P001, deaf community)
P002, a younger participant within the deaf community group, was confident and familiar with smart phones. He had started to use smart technology in his ‘early teens’. Similar experiences were discussed within the youth group, with individuals having grown up with technology since they were as young as five.
I think it’s because since we’ve grown up with it our whole lives, we’ve just got used to it (P007, youth group)
I’ve helped people before, with, like, installing things and stuff like that. […] They were asking for a movie app for their phone, so they could, like, any movie in the world. And I helped them download ShowBox. […] it was one of my friends (P007, youth group)
4.1.2. Understanding motivations for technology adoption
Individuals discussed the adoption of smart technology in their everyday lives for various reasons, including communication, banking, shopping, gaming, and general browsing. However, the motivations for using smart technology were unique to each individual. For example, P002, a younger male within the deaf community group, used digital tools to facilitate connections and communication, indicating the importance of accessibility and inclusivity in technology adoption.
If I go out, like, myself – I need to communicate with hearing people. I can sign, I can text … Text that down. And then they’ve got, like, speech to text on the phone. So, it’s like … Yeah, I never really knew about that until last year (P002, deaf community)
A lot of my ladies would use smartphones, especially for those who get universal credit. So they can check their accounts (P005, women’s group)
[I regularly use] My banking app. Because it’s the only way to know if I’ve got money in the bank or not […] I check it every day, just in case someone puts something in (P007, youth group)
I think it was having access to digital technology that actually managed to get me out of the relationship. Because I went onto Mumsnet. Which is … It’s anonymous. […] I didn’t even realise I was in an abusive relationship […] And I kind of got support from people. And they put me in touch with other organisations (P006, women’s group)
He was going, like, on my universal credit account. But all my recovery passwords were his email address. And they really worried me. […] But still now I think, like, am I being … ? Sort of, am I still being safe? (P003, women’s group)
4.2. Barriers to technology use
There were two prominent barriers which reduced and hindered individuals’ use of technology: problematic functionality and/or accessibility and cost.
4.2.1. Problematic functionality and/or accessibility
Many individuals primarily used smart technology to communicate with others, as discussed in the theme above. This was often through text, social media, and video calling. However, there was often a lack of functionality which impeded users, particularly those in the deaf community. For example, P001 (female, age 66) felt that she needed to make calls on a landline, as opposed to her mobile phone, due to better ‘sound quality’. Furthermore, various devices and apps aim to support hearing communication for hearing loss and impairment, such as speech-text apps. However, these apps are not free from their own issues, particularly issues around poor translation, or the need for data connectivity. This highlights the importance of infrastructure and the cost of accessing mobile data for deaf and hard-of-hearing users to use these applications.
Most of the time it’s good, you know, if I’m talking about live, live transcript, yeah. Live transcript. It’s good, but it’s not perfect. Speech will come up on the screen, sometimes you get different words. Something you haven’t said […] There’s another problem that I have with that, I need to connect to Wi-Fi. Like, instead of data. Or Wi-Fi or data. So, there’s a limit on data. So, you can’t use it every time (P002, deaf community)
I just turn the volume up to maximum (P001, deaf community)
I have an app where I work, yeah … I’m the only one deaf where I work […] They use that for speech, so we can communicate together. Sometimes it’s not good – if there’s, like, a big group and there’s lots of people having a conversation. It’s better if it’s one-to-one. Like, there’s too much noise if lots of people are talking (P002, deaf community)
4.2.2. Cost
The cost of smart technology and broadband were prohibitive for individuals and for some participants within the youth group, this impacted their ability to go online, for example, when broken or pre-dating smart technology.
I used to have an old mobile. There was no, like, obviously, Snapchat and stuff like that. And, obviously, it does the exact same thing – you just don’t get social media and stuff like that (P009, youth group)
I’ve got a tablet, but it’s broken at the moment (P007, youth group)
I think a lot of my clients wouldn’t have the money for laptops. For those extra devices. They would be absolutely dependent on their phone (P005, women’s group)
I’ve got a laptop at home, which I bought in the lockdown, or just before that, for … So that the kids could do work. Because I had nothing for them to use. And no help was given getting the … I’ve got three kids, and they were all meant to be on … You know, like Google classroom things, all at the same time […] And then I started getting complaints from school (P006, women’s group)
Some of our high-risk ladies have managed to get funding to get cameras and Alexa […] so they can get the … You know, the front doorbell things, so they can see people. Especially, like, high-risk ladies. And cameras on the back that go to their phone, so if they heard stuff at the back they can see […] it’s such a postcode lottery […] There’s no system of who needs them (P005, women’s group)
It's just annoying that every time a contract comes to an end, there … You have to negotiate … You have to have a … Not a fight. Not quite a fight, but an argument (P001, deaf community)
I ran out of data through the day yesterday. And it means that I can use that app after that point […] So, then I changed to texting notes after that. So, yeah … Or, you know, asking someone to write it down (P002, deaf community)
5. Discussion
5.1. Original contribution to knowledge
The aim of this study was to explore and gain a more in-depth understanding of digital exclusion across one area within the North East of England. To our knowledge, this study has obtained the largest sample in digital exclusion research to date and adds new internationally relevant insights to the existing evidence base. Taking a mixed-methods study design, we were able to identify the scale and key characteristics of digitally excluded groups, understand key factors that contribute to digital exclusion, and map solutions to improve the digital inclusion of most digitally excluded groups. This original method, which included multiple methods for survey completion, increased the reach of participation and increased the inclusion of those most digitally excluded within the population (n = 1130).
The results of the logistic regression modelling indicate that multiple factors contribute to predicting digital exclusion, particularly increased age, lower income, lower (or no) education levels, living with a disability or living in a household with someone else with a disability, and residing in a smaller household. These findings support previous international evidence of digital exclusion predictors (Czaja and Urbaniec Citation2019; Seifert, Hofer, and Rössel Citation2018; Loges and Jung Citation2001). The findings show social exclusion and digital exclusion can exacerbate one another. Rogers (Citation1995) and others suggested that, through digital transformation, usually ‘new ideas make the rich richer and the poor poorer, widening the socio-economic gap between the earlier and later adopters’ (Rogers Citation1995; Warren Citation2007). Evidence calls for a reduction in costs affiliated with digital technology and internet use, such as the cost of broadband, of which other evidence highlights the need for mandatory social tariffs across providers, free internet-enabled devices for those in need, and free access to digital skills training (Abey Citation2022). Furthermore, the Department for Digital, Culture, Media, and Sport (Citation2022) has delivered plans for a UK Digital Strategy by highlighting the need to improve digital access and skills for all. They do not, however, highlight the critical links between social inclusion across the UK and digital inclusion. This current study demonstrates the complex link between digital and social exclusion and the importance of reducing the digital divide to support social equity, supporting international evidence in this area (Czaja and Urbaniec Citation2019; Leppiman et al. Citation2021; Seifert, Hofer, and Rössel Citation2018). For example, social exclusion can be a major obstacle to digital inclusion by creating barriers related to economic disadvantage, limited educational opportunities, cultural and linguistic challenges, psychosocial factors, and systemic inequalities (Gilbert and Masucci Citation2020; Knowles and Hanson Citation2018; Martin et al. Citation2016).
Ageing is a key predictor of digital exclusion. Within this study, digital exclusion was noteworthy for those over 60 years old, with more than 94% of those identified as being digitally excluded reported being aged 60 or older. However, living with younger generations in the household (aged between 18 and 59) can significantly reduce the probability of being digitally excluded. These results indicate that the digital divide between the older population and the younger population is vast. The older generation, who did not grow up with technology, may not have easily adopted these innovations as much as the younger generation. These findings are consistent with other studies which also illustrate the relationship between digital exclusion and getting older (Friemel Citation2016; Loges and Jung Citation2001; McDonough Citation2016) through inequalities and disadvantages experienced throughout their life course (Wilson-Menzfeld and Brittain Citation2022). Studies have also shown the link between COVID-19 and the exclusion from digital technologies and public services experienced by older adults (Mubarak and Suomi Citation2022; Seifert Citation2020). This contributed to increased social exclusion through directive orders. This has a strong indication for key stakeholders including policymakers and the public about how to support older residents in mitigating or minimising digital exclusion which can lead to social exclusion. Tackling digital exclusion is crucial to sustain digital societies and to increase societal equality throughout the lifecourse (Leppiman et al. Citation2021; Vassilakopoulou and Hustad Citation2023).
Interestingly, whilst socio-demographic predictors were significantly related to digital exclusion, the socio-economic profile of areas was shown to contradict assumptions of digital exclusion across geographic populations. Through the approximate geographical location of participants, this study measured the impact of spatial variations on digital exclusion. As both models confirm, when controlling for socio-demographic variables, geographical variations contribute to predicting digital exclusion. However, living in the higher socio-economic areas of the borough did not necessarily indicate higher levels of digital inclusion. For example, area four is associated with a higher deprivation status (lower IMD decile) compared to area one; however, this study shows that those living in area one (higher IMD decile) were more likely to lack digital access, digital skills, digital confidence, and digital use, and therefore were more likely to be digitally excluded, than those living in area four. These findings support recent evidence from Belgium, which highlights the need to avoid stereotypical targeting, and instead target all citizens (Anrijs et al. Citation2023).
Whilst academics, local authorities, and UK governmental policies have considered digital exclusion through large geographical parameters such as urban vs rural communities (Age UK Citation2021), and North East vs South East England (Khalid and Pedersen Citation2016; Yates Citation2020), this study evidences the role of micro-geographic differences as a determining factor of digital exclusion in one borough (Blank, Graham, and Calvino Citation2018; Gilbert and Masucci Citation2020). Regional policy initiatives could and should focus on these micro-geographical differences when spending money and introducing interventions to bridge the existing digital divide within the borough. It is critical to understand these differences so as not to waste financial investment on incorrect solutions for the wrong populations. These findings may also have resonance beyond the UK as research has also evidenced key determinants of digital exclusion within rural localities across the world, through issues of both supply and demand, but this research has also acknowledged ‘digital disadvantages’ which occur on a similar level in urban areas through inequality (Park Citation2017). This current study shows that this is indeed the case and digital exclusion needs understanding not only on a ‘rural vs urban’ level but on a micro-geographical level.
The focus group findings are consistent with findings from phase one, identifying differences in digital use between different genders, generations, and social groups. There were also many differences within focus groups based on individual circumstances. For example, there were differences in digital use between early and late adopters throughout all focus groups. The ‘early adopters’ were primarily those within younger generations and had higher levels of digital skill, functioning as ‘digital natives’ and even ‘experts’ (Helsper and Eynon Citation2013; Prensky Citation2001).
Digital tools had benefits across all focus groups, including for use of accessible communication, daily services, and security. However, there were also downfalls, such as functionality of accessible applications, and security risks. The cost was another barrier to digital use. This demonstrates the importance of individual choice. Van Deursen and Helsper (Citation2015) consider the tangible offline benefits of digital use, including economic, social, political, institutional, and educational benefits (Van Deursen and Helsper Citation2015). Whilst many cannot access digital technology, others choose not to do so as they do not consider digital tools to be beneficial for them (Healthwatch Citation2021; Knowles and Hanson Citation2018) or see the harmful impact that technology can bring, as the findings from the focus groups demonstrate. This enhances the importance of choice provided by organisations through equitable access to services that are now ‘digital by default’ (Age UK Citation2015; Schejter, Ben Harush, and Tirosh Citation2015; Service Citation2014). The detrimental impact of many services only being available online is receiving increasing criticism and there is national support to support the need for non-digital access options to be offered alongside online (Age UK Citation2021; Centre for Ageing better Citation2021). Evidence emphasises the need to consider digitally excluded individuals and those who are non-digital users by choice differently and to understand these groups of people separately, and see how the concepts of exclusion and choice relate, in order to support digital and social connectivity (Eynon and Helsper Citation2011).
We acknowledge that people often engage in some practices related to using digital tools, which are not always verbalised. For instance, individuals may engage in digital multitasking (e.g. simultaneously checking emails, browsing social media, and listening to music) without explicitly discussing this attitude in their narratives. This practice has become common among younger generations in various contexts, from work to leisure, impacting attention spans and productivity [77, 78]. The co-design methodology allowed us to include and explore these non-verbalised aspects of digital use by involving stakeholders in activities such as survey design, focus group schedules, and interpreting results.
5.2. Implications for policy, practice, and research
This study illustrates the role of socio-demographic and micro-geographical factors in predicting digital exclusion and the bi-directional link between social exclusion and digital exclusion. Digital exclusion is therefore a complex issue that requires complex solutions, and it is necessary to consider this complexity within digital-related policy and practice initiatives. To support this, it is recommended that digitally excluded and socially excluded groups support these decisions and policy-making processes.
This study identified the diversity and complexity of the digital exclusion issues. It is essential that agencies operate within an integrated governance framework across multiple institutions, across multiple sectors, and at all levels, to deal with such a complex issue.
Having the choice to access information and services in accessible ways is imperative to not further exclude communities who cannot, or choose not to, access and use digital technology. It is necessary for organisations across sectors to review their own policies and practices (such as ensuring that information and services are not available online only). This has the potential to reduce the risk and scale of digital exclusion across services. This study is a comprehensive examination of digital exclusion at the borough level. Utilising a diverse set of data collection methods increased inclusivity and accessibility of participation so that even those who are digitally excluded could participate. This in turn increased the reliability and validity of the results. It is recommended that studies in this arena consider the methods used to collect data around digital exclusion, ensuring that the most marginalised communities, and therefore those who may be at most risk of digital exclusion, could participate and have their voices heard. However, a limitation of this study is that the sample was solely recruited from the North East of England, which may raise concerns about the generalisability of the findings to other regions or countries with potentially different socio-demographic and psycho-cultural configurations.
Clustering survey respondents based on four indicators of digital exclusion is a practical way to identify and discuss disparities across digital access, skills, usage, and confidence among different population groups. This method helps to identify the most digitally excluded individuals and informs policies and interventions to bridge the digital divide. By understanding the specific challenges faced by these groups, targeted strategies can be developed to improve digital inclusion.
Finally, this study excluded those aged below 18 years. Levels and experiences of digital exclusion for those under 18 years old are not well understood, particularly from the perspective of children and young people themselves. Further research efforts should focus on this area.
6. Conclusion
This study aimed to explore and gain a more in-depth understanding of digital exclusion within a major metropolitan borough in the North East of England.
This is the largest study to date which has collected and analysed primary data focussed on digital exclusion at a borough level. Therefore, while this study was carried out in one area of the UK, it has raised and identified issues of importance which undoubtedly have relevance for many national and international contexts. The findings of this study support the importance of data-driven insights into practice and decision-making processes, identification of common challenges, comparative analysis, evidence-based policymaking, and the facilitation of global initiatives aimed at achieving digital equity and inclusion. By leveraging empirical research, stakeholders can collaborate effectively to address digital disparities and promote universal access to digital resources and opportunities.
Descriptive statistics and logistic regression models were estimated to identify and understand the determinants of digital exclusion using recent data from a survey of 9181 respondents. Findings support international literature which illustrates statistically significant associations between socio-demographic variables and digital exclusion, particularly: increasing age, lower income, lower (or no) education levels, living with a disability, or living in a household with someone else living with a disability, and living in a smaller household. Along with other evidence in this area, this study affirms the deep and wide socio-economic divide within society and the continuation of barriers to digital inclusion.
Micro-geographical analyses were critical to understanding digital exclusion across the borough. This is an area of analysis which has not yet been considered in this arena yet demonstrated the geographical nuances within experiences of digital exclusion which counter the explanatory socio-economic variables. Namely, the most affluent area of the borough was considered as most digitally excluded (as a whole) compared to less affluent areas of the borough which were less digitally excluded. Micro-geographical data can support statutory organisations and decision-makers to target the right interventions to the right areas without making assumptions of digital access and digital use using deprivation data only.
The reciprocal relationship between digital and social exclusion was evident in this study. We propose that digital inclusion therefore needs to be considered as a core social policy issue, linked to social exclusion. Within focus group findings, the notion of choice was critical. With public services going ‘digital by default’, individual autonomy is lessened, and this raises further concerns of social exclusion.
It is evident through the findings of this novel study that digital use, digital exclusion, and digital choice are complex and therefore complex solutions are necessary.
Disclosure statement
No potential conflict of interest was reported by the author(s).
Additional information
Funding
References
- Abey, J. 2022. Bridging the Divide: Tackling Digital Inequality in a Post-Pandemic World. London: Fabien Society.
- Age UK. 2015. Later Life in a Digital World. London: Age UK.
- Age UK. 2018. Digital Inclusion Evidence Review. Edited by Age UK. London: Age UK.
- Age UK. 2021. Digital Inclusion and Older People – How Have Things Changed in a Covid-19 World? Edited by Age UK. London: Age UK.
- Anrijs, S., et al. 2023. “Excluded from Essential Internet Services: Examining Associations Between Digital Exclusion, Socio-Economic Resources and Internet Resources.” Technology in Society 73: 102211. https://doi.org/10.1016/j.techsoc.2023.102211
- Bastick, Z., and M. Mallet-Garcia. 2022. “Double Lockdown: The Effects of Digital Exclusion on Undocumented Immigrants During the COVID-19 Pandemic.” New Media & society 24 (2): 365–383. https://doi.org/10.1177/14614448211063185
- Bergström, A. 2017. “Digital Equality and the Uptake of Digital Applications among Seniors of Different age.” Nordicom Review 38 (s1): 79–91. https://doi.org/10.1515/nor-2017-0398
- Blank, G., M. Graham, and C. Calvino. 2018. “Local Geographies of Digital Inequality.” Social Science Computer Review 36 (1): 82–102. https://doi.org/10.1177/0894439317693332
- Bol, N., N. Helberger, and J. C. Weert. 2018. “Differences in Mobile Health app use: A Source of new Digital Inequalities?” The Information Society 34 (3): 183–193. https://doi.org/10.1080/01972243.2018.1438550
- Braun, V., and V. Clarke. 2006. “Using Thematic Analysis in Psychology.” Qualitative Research in Psychology 3 (2): 77–101. https://doi.org/10.1191/1478088706qp063oa
- Braun, V., and V. Clarke. 2019. “Reflecting on Reflexive Thematic Analysis.” Qualitative Research in Sport, Exercise and Health 11 (4): 589–597. https://doi.org/10.1080/2159676X.2019.1628806
- Braun, V., V. Clarke, and N. Hayfield. 2022. “‘A Starting Point for Your Journey, not a Map’: Nikki Hayfield in Conversation with Virginia Braun and Victoria Clarke About Thematic Analysis.” Qualitative Research in Psychology 19 (2): 424–445. https://doi.org/10.1080/14780887.2019.1670765
- Bunyan, S., and A. Collins. 2013. “Digital Exclusion Despite Digital Accessibility: Empirical Evidence from an English City.” Tijdschrift voor economische en sociale geografie 104 (5): 588–603. https://doi.org/10.1111/tesg.12047
- Centre for Ageing better. 2021. COVID-19 and the Digital Divide. Edited by C.f.A. Better. London: Centre for Ageing Better.
- Choi, N. G., and D. M. Dinitto. 2013. “The Digital Divide Among Low-Income Homebound Older Adults: Internet Use Patterns, EHealth Literacy, and Attitudes Toward Computer/Internet Use.” Journal of Medical Internet Research 15 (5): e93–e93. https://doi.org/10.2196/jmir.2645
- Cresci, M. K., and P. A. Jarosz. 2010. “Bridging the Digital Divide for Urban Seniors: Community Partnership.” Geriatric Nursing 31 (6): 455–463. https://doi.org/10.1016/j.gerinurse.2010.10.006
- Czaja, I., and M. Urbaniec. 2019. “Digital Exclusion in the Labour Market in European Countries: Causes and Consequences.” European Journal of Sustainable Development 8 (5): 324–324. https://doi.org/10.14207/ejsd.2019.v8n5p324
- Darcy, S., H. Yerbury, and H. Maxwell. 2019. “Disability Citizenship and Digital Capital: The Case of Engagement with a Social Enterprise Telco.” Information, Communication & Society 22 (4): 538–553. https://doi.org/10.1080/1369118X.2018.1548632
- Department for Digital, Culture, Media, and Sport. 2022. UK Digital Strategy. https://www.gov.uk/government/publications/uks-digital-strategy/uk-digital-strategy.
- Eynon, R., and E. Helsper. 2011. “Adults Learning Online: Digital Choice and/or Digital Exclusion?” New media & society 13 (4): 534–551. https://doi.org/10.1177/1461444810374789
- Friemel, T. N. 2016. “The Digital Divide has Grown Old: Determinants of a Digital Divide among Seniors.” New Media and Society 18 (2): 313–331. https://doi.org/10.1177/1461444814538648
- Gallistl, V., et al. 2021. “Doing Digital Exclusion – Technology Practices of Older Internet Non-Users.” Journal of Aging Studies 59: 100973. https://doi.org/10.1016/j.jaging.2021.100973
- Gilbert, M. R., and M. Masucci. 2020. “Defining the Geographic and Policy Dynamics of the Digital Divide.” In Handbook of the Changing World Language Map, edited by S. Brunn and R. Kehrein, 3653–3671. Cham: Springer. https://doi.org/10.1007/978-3-030-02438-3_39.
- Gilleard, C., and P. Higgs. 2008. “Internet use and the Digital Divide in the English Longitudinal Study of Ageing.” European Journal of Ageing 5 (3): 233. https://doi.org/10.1007/s10433-008-0083-7
- Gordon, N. P., and M. C. Hornbrook. 2018. “Older Adults’ Readiness to Engage with EHealth Patient Education and Self-Care Resources: A Cross-Sectional Survey.” BMC Health Services Research 18 (1): 220–220. https://doi.org/10.1186/s12913-018-2986-0
- Gracia, E., and J. Herrero. 2009. “Internet use and Self-Rated Health among Older People: A National Survey.” Journal of Medical Internet Research 11 (4): e49. https://doi.org/10.2196/jmir.1311
- Greer, B., et al. 2019. “Digital Exclusion Among Mental Health Service Users: Qualitative Investigation.” Journal of Medical Internet Research 21 (1): e11696. https://doi.org/10.2196/11696
- Hargittai, E., and K. Dobransky. 2017. “Old Dogs, new Clicks: Digital Inequality in Skills and Uses among Older Adults.” Canadian Journal of Communication 42 (2): 195–212. https://doi.org/10.22230/cjc.2017v42n2a3176
- Healthwatch. 2021. Locked out: Digitally Excluded People’s Experiences of Remote GP Appointments. Edited by Healthwatch. Newcastle-upon-Tyne: Healthwatch England.
- Helsper, E. J. 2012. “A Corresponding Fields Model for the Links Between Social and Digital Exclusion.” Communication Theory 22 (4): 403–426. https://doi.org/10.1111/j.1468-2885.2012.01416.x
- Helsper, E. J., and R. Eynon. 2013. “Distinct Skill Pathways to Digital Engagement.” European Journal of Communication 28 (6): 696–713. https://doi.org/10.1177/0267323113499113
- House of Lords. 2023. Digital Exclusion. Edited by Communications and Digital Committee. London: Authority of the House of Lords.
- Hughes, B. 2007. “Being Disabled: Towards a Critical Social Ontology for Disability Studies.” Disability & Society 22 (7): 673–684.
- Ivankova, N. V., J. W. Creswell, and S. L. Stick. 2006. “Using Mixed-Methods Sequential Explanatory Design: From Theory to Practice.” Field Methods 18 (1): 3–20. https://doi.org/10.1177/1525822X05282260
- Khalid, M. S., and M. J. L. Pedersen. 2016. “Digital Exclusion in Higher Education Contexts: A Systematic Literature Review.” Procedia-Social and Behavioral Sciences 228: 614–621. https://doi.org/10.1016/j.sbspro.2016.07.094
- Knowles, B., and V. L. Hanson. 2018. “The Wisdom of Older Technology (Non) Users.” Communications of the ACM 61 (3): 72–77. https://doi.org/10.1145/3179995
- Lawani, A. 2021. “Critical Realism: What You Should Know and How to Apply It.” Qualitative research journal 21 (3): 320–333. https://doi.org/10.1108/QRJ-08-2020-0101
- Leckie, C., R. Munro, and M. Pragnell. 2021. Rural Recognition, Recovery, Resilience and Revitalisation Strengthening Economies and Addressing Deprivation in Rural and Coastal Communities. Edited by P. Advisory. Essex, UK: Pragmatix Advisory.
- Leppiman, A., I. Riivits-Arkonsuo, A. Pohjola, et al. 2021. Old-Age Digital Exclusion as a Policy Challenge in Estonia and Finland, in Social Exclusion in Later Life: Interdisciplinary and Policy Perspectives, edited by K. Walsh, 409–419. Cham: Springer International Publishing.
- Lindblom, T., and P. Räsänen. 2017. “Between Class and Status? Examining the Digital Divide in Finland, the United Kingdom, and Greece.” The Information Society 33 (3): 147–158. https://doi.org/10.1080/01972243.2017.1294124
- Loges, W. E., and J.-Y. Jung. 2001. “Exploring the Digital Divide: Internet Connectedness and Age.” Communication Research 28 (4): 536–562. https://doi.org/10.1177/009365001028004007
- Longley, P. A., and A. D. Singleton. 2009. “Linking Social Deprivation and Digital Exclusion in England.” Urban Studies 46 (7): 1275–1298. https://doi.org/10.1177/0042098009104566
- Luo, M. M., and S. Chea. 2018. “Internet Village Motoman Project in Rural Cambodia: Bridging the Digital Divide.” Information Technology & People 31 (1): 2–20. https://doi.org/10.1108/ITP-07-2016-0157
- Malpass, A., et al. 2022. “Overcoming Digital Exclusion During the COVID-19 Pandemic: Impact of Mobile Technology for Survivors of Modern Slavery and Human Trafficking – A Mixed Method Study of Survivors and Support Service Provider Views.” Journal of Human Trafficking, 1–20. https://doi.org/10.1080/23322705.2022.2050991
- Martin, C., et al. 2016. The Role of Digital Exclusion in Social Exclusion. London: Ipsos MORI Scotland.
- Matthews, K., J. Nazroo, and A. Marshall. 2019. “Digital Inclusion in Later Life: Cohort Changes in Internet use Over a ten-Year Period in England.” Ageing & Society 39 (9): 1914–1932. https://doi.org/10.1017/S0144686X18000326
- McDonough, C. C. 2016. “The Effect of Ageism on the Digital Divide among Older Adults.” Journal of Gerontology and Geriatric Medicine 2 (008): 1–7.
- Mubarak, F., and R. Suomi. 2022. “Elderly Forgotten? Digital Exclusion in the Information age and the Rising Grey Digital Divide. INQUIRY: The Journal of Health Care Organization.” Provision, and Financing 59: 00469580221096272.
- Neves, B. B., F. Amaro, and J. R. Fonseca. 2013. “Coming of (Old) Age in the Digital age: Ict Usage and non-Usage among Older Adults. Sociological Research Online 18 (2): 1–14. https://doi.org/10.5153/sro.2998
- Park, S. 2017. “Digital Inequalities in Rural Australia: A Double Jeopardy of Remoteness and Social Exclusion.” Journal of Rural Studies 54: 399–407. https://doi.org/10.1016/j.jrurstud.2015.12.018
- Pick, J., A. Sarkar, and E. Parrish. 2021. “The Latin American and Caribbean Digital Divide: A Geospatial and Multivariate Analysis.” Information Technology for Development 27 (2): 235–262. https://doi.org/10.1080/02681102.2020.1805398
- Prensky, M. 2001. “Digital Natives, Digital Immigrants Part 2: Do They Really Think Differently?” On the Horizon.
- Ragnedda, M., and G. W. Muschert. 2017. Theorizing Digital Divides. Lanham: Routledge.
- Rogers, E. M. 1995. The Diffusion of Innovations. 4th ed. New York: Free Press.
- Schejter, A., O. R. Ben Harush, and N. Tirosh. 2015. “Re-theorizing the “Digital Divide”: Identifying Dimensions of Social Exclusion in Contemporary Media Technologies.” In FACE Conference: European Media Policy 2015: New Contexts, New Approaches. Unpublished.
- Seifert, A. 2020. “The Digital Exclusion of Older Adults During the COVID-19 Pandemic.” Journal of Gerontological Social Work 63 (6-7): 674–676. https://doi.org/10.1080/01634372.2020.1764687
- Seifert, A., M. Hofer, and J. Rössel. 2018. “Older Adults’ Perceived Sense of Social Exclusion from the Digital World.” Educational Gerontology 44 (12): 775–785. https://doi.org/10.1080/03601277.2019.1574415
- Service, G. D. 2014. Government Digital Inclusion Strategy. Edited by G.D. Service. London: Cabinet Office.
- Stone, E., R. Rae-Evans, and K. Maye. 2020. Supporting Digital Inclusion of Adults with Low English Language Skills. Edited by G.T.F.a.C. UK. Sheffield, UK: Good Things Foundation.
- Tsai, H. Y. S., et al. 2015. “Getting Grandma Online: Are Tablets the Answer for Increasing Digital Inclusion for Older Adults in the U.S.?” Educational Gerontology 41 (10): 695–709. https://doi.org/10.1080/03601277.2015.1048165
- Tsatsou, P. 2021. “Is Digital Inclusion Fighting Disability Stigma? Opportunities, Barriers, and Recommendations.” Disability & Society 36 (5): 702–729.
- van Deursen, A., and E. J. Helsper. 2015. “The Third-Level Digital Divide: Who Benefits Most from Being Online?” In Communication and Information Technologies Annual, 29–52. Emerald Group Publishing Limited.
- Van Dijk, J., and K. Hacker. 2003. “The Digital Divide as a Complex and Dynamic Phenomenon.” The information society 19 (4): 315–326. https://doi.org/10.1080/01972240309487
- Vassilakopoulou, P., and E. Hustad. 2023. “Bridging Digital Divides: a Literature Review and Research Agenda for Information Systems Research.” Information Systems Frontiers : A Journal of Research and Innovation 25 (3): 955–969. https://doi.org/10.1007/s10796-020-10096-3.
- Warren, M. 2007. “The Digital Vicious Cycle: Links Between Social Disadvantage and Digital Exclusion in Rural Areas.” Telecommunications Policy 31 (6-7): 374–388. https://doi.org/10.1016/j.telpol.2007.04.001
- Wilson-Menzfeld, G., and K. Brittain. 2022. “Digital Exclusion in Later Life: A Narrative Review.” In Vulnerable People and Digital Inclusion, edited by P. Tsatsou, 169–188. London: Palgrave MacMillan.
- Wilson-Menzfeld, G., J. Gates, J. Johnson, M. Moreland, and H. Raw. 2021. Exploring and Evaluating the War Widows InTouch (WW.it) Programme. Newcastle-upon-Tyne: Northumbria University.
- Wilson, G., et al. 2020. Understanding the Experiences of Older Adults Using Technology to Stay Connected: A Facilitator or Creator of New Vulnerabilities? Newcastle, UK: Northumbria University.
- Wilson, G., et al. 2023. “Understanding Older Adults’ Use of Social Technology and the Factors Influencing Use.” Ageing and Society 43 (1): 222–245. doi:10.1017/S0144686X21000490.
- Yates, S. J., et al. 2020. “Who are the Limited Users of Digital Systems and Media? An Examination of UK Evidence.” First Monday 25 (7): 1–38.
- Yoon, H., et al. 2018. “Older Adults’ Internet Use for Health Information: Digital Divide by Race/Ethnicity and Socioeconomic Status.” Journal of Applied Gerontology 39 (1): 105–110.
- Yu, R. P., et al. 2016. “Mapping the two Levels of Digital Divide: Internet Access and Social Network Site Adoption among Older Adults in the USA.” Information, Communication & Society 19 (10): 1445–1464. https://doi.org/10.1080/1369118X.2015.1109695
- Yu, T.-K., M.-L. Lin, and Y.-K. Liao. 2017. “Understanding Factors Influencing Information Communication Technology Adoption Behavior: The Moderators of Information Literacy and Digital Skills.” Computers in Human Behavior 71: 196–208. https://doi.org/10.1016/j.chb.2017.02.005
