
 ?Mathematical formulae have been encoded as MathML and are displayed in this HTML version using MathJax in order to improve their display. Uncheck the box to turn MathJax off. This feature requires Javascript. Click on a formula to zoom.
ABSTRACT
Recent crises like the COVID-19 pandemic provoked an increasing appearance of misleading information, emphasising the need for effective user-centered countermeasures as an important field in HCI research. This work investigates how content-specific user-centered indicators can contribute to an informed approach to misleading information. In a threefold study, we conducted an in-depth content analysis of 2382 German tweets on Twitter (now X) to identify topical (e.g. 5G), formal (e.g. links), and rhetorical (e.g. sarcasm) characteristics through manual coding, followed by a qualitative online survey to evaluate which indicators users already use autonomously to assess a tweet's credibility. Subsequently, in a think-aloud study participants qualitatively evaluated the identified indicators in terms of perceived comprehensibility and usefulness. While a number of indicators were found to be particularly comprehensible and useful (e.g. claim for absolute truth and rhetorical questions), our findings reveal limitations of indicator-based interventions, particularly for people with entrenched conspiracy theory views. We derive four implications for digitally supporting users in dealing with misleading information, especially during crises.
1. Introduction
In an era of complex global crises, including the Russian war of aggression against Ukraine and the COVID-19 pandemic, the world is struggling with an overabundance of accurate and false information, leading to what the World Health Organisation has coined an ‘infodemic’ (World Health Organization Citation2020). Social media channels such as Twitter (now X), TikTok, and Facebook have emerged as essential and compelling platforms for individuals to share information (Reuter and Kaufhold Citation2018). However, the dissemination of misleading information is increasingly facilitated by social media because of characteristics such as low costs and anonymity (Steinebach et al. Citation2020). Experts have studied misleading information during crises from various perspectives and disciplines. Our work is interested in misleading information that was deliberately created as well as unintentionally, following Geeng, Yee, and Roesner (Citation2020) and their understanding of misinformation to collect false information ‘agnostic to the intention of the original creator or poster’ for our sample. In line with previous scholarship (Geeng, Yee, and Roesner Citation2020; Giglietto et al. Citation2016), we define misleading information as an umbrella term encompassing both intentionally misleading information (i.e. ‘disinformation’ or ‘fake news’) and unintentionally misleading information (i.e. ‘misinformation’). In our understanding, misleading information comprises false information and misleading satire, whereas non-misleading information encompasses true information, opinions that are not absolute, or satire that is not misleading in the specific context.
Research in Human-Computer Interaction (HCI), psychology, and information systems has started to investigate how to tackle the pervasive issue of misleading information using technology. This multifaceted exploration encompasses the development of very technical, often machine-learning-based, automatic detection approaches (Shu et al. Citation2017; Wu and Liu Citation2018) alongside approaches with stronger user-centered HCI focus on post-detection decisions or aspects detached from detection (e.g. providing corrections).
Digital misinformation interventions are employed to assist users in processing misleading information online and are typically applied after automatic (and sometimes manual) pre-filtering problematic content. They build upon and expand educational and journalistic initiatives. The term ‘digital misinformation intervention’ has gained recognition within the research community (Bak-Coleman et al. Citation2022; Saltz, Barari, et al. Citation2021; Saltz, Leibowicz, and Wardle Citation2021), where user-centered misinformation interventions ‘go beyond a purely algorithmic back-end solution and exert a direct influence on the user in the form of information presentation or withholding’ (Hartwig, Doell, and Reuter Citation2023, 2). For instance, some approaches correct misinformation by displaying a link to a fact-checking website, debunking videos, or corrections within the comment section (Ardevol-Abreu, Delponti, and Rodriguez-Wanguemert Citation2020; Bhargava et al. Citation2023; Martel, Mosleh, and Rand Citation2021), and others provide binary labels to flag false content (Barua et al. Citation2019). Even after extensive research on interventions to combat misleading information and the contentious debates surrounding their effectiveness, the field has yet to come to a definitive solution. Therefore, it is vital to persist in examining users' particular requirements, abilities, and viewpoints in a user-focused manner.
Previous research suggests that transparency plays a critical role in establishing trust among users in digital interventions (Kirchner and Reuter Citation2020) and minimising the likelihood of reactance or other backfire effects (Müller and Denner Citation2019; Nyhan and Reifler Citation2010). In response to this need, some studies have started to develop and evaluate indicator-based interventions that present cues for users to evaluate information. These interventions have demonstrated promising outcomes and continue to be a topic of controversy and investigation. Indicator-based misinformation interventions are defined as digital countermeasures using identifiable misinformation indicators to assess if a piece of information is credible (Hartwig et al. Citation2024). Typically, these indicators (e.g. emotional wording, hashtags including conspiracy theories) are displayed to users for immediate feedback and educational purposes, facilitating the development of skills to assess the credibility of content autonomously (Hartwig et al. Citation2024). Often, indicator-based interventions involve highlighting indicators within the content using color-code (Martino et al. Citation2020).
The objective of our article is to contribute to the design of user-centered interventions based on indicators by determining which indicators are suitable in terms of perceived usefulness and comprehensibility. Addressing this research gap in HCI research, our paper offers a comprehensive exploration of qualitative and user-centered insights into an indicator-based approach. We apply this approach specifically to short-text content on Twitter, aiming to understand its applicability in real-world scenarios. As previous studies have suggested that misinformation during crises varies from everyday content, we apply our analyses and user studies to the particular long-term crisis of the COVID-19 pandemic. Additionally, we demonstrate how our approach can be applied to the Russian war of aggression against Ukraine as a distinct crisis. Our perspective on German content contributes to the predominantly U.S.-focused research on misinformation.
Our study consists of a threefold research design, comprising (1) a content analysis of Twitter data to get a sense of what misleading information in our crisis context looks like, (2) an online survey to investigate which indicators users have already been applying autonomously to assess tweets, and (3) a think-aloud study to evaluate the comprehensibility and perceived usefulness of previously identified indicators. The sequential studies offer a chance to triangulate data and obtain comprehensive findings.
We advance misinformation research by applying existing knowledge about indicator-based interventions to specific crises and preserving a user perspective of a diverse group of participants. Our core contributions (C) and findings (F) are first (C1) thoroughly assessing 2382 German tweets within a realistic crisis context. In doing so, we identified (F1) topical indicators including context-specific themes like ‘Restriction of Liberty’, formal indicators such as links and hashtags that occur in similar measure in credible tweets but are a valuable cue for misleading information when being nudged to take a closer look at what they refer to, and rhetorical indicators for misleading information like claim to ‘Absolute Truth’. We then (C2) conducted an online survey to investigate how users autonomously assess the credibility of tweets. Through this survey, we (F2) gained insights into several indicators that users apply autonomously (e.g.buzzwords like ‘mainstream media’ as topical indicator), and found that they are in particular not aware of rhetorical indicators of misleading information, revealing the benefit to display them in an assisting tool. Finally, we (C3) assessed the comprehensibility and usefulness of our previously identified indicators and discovered (F3) a positive perception of the overall indicator-based approach. Evaluating in particular how the topical, formal, and rhetorical indicators enhance the perception and evaluation of users when presented as a digital intervention, we gained (F4) positive feedback regarding comprehensibility and perceived usefulness for instance for topical indicators when kept rather general, emotional emojis, and capitalisation, but also criticism for others (e.g. ‘Punctuation’ being too excluding for non-native speakers). Additionally, we identified (F5) the opportunities, challenges, and limitations associated with the indicator-based approach for short-text content, such as indicators not being valid if within a quote and drawing attention to misleading content even more when highlighting specific parts.
2. Related work and research gap
Our work contributes to the design of user-centered digital interventions to counter misleading information on Twitter/X, which is widely used by people during crises to access as well as share information. We discuss related work regarding misleading information during crises and shed light on crisis informatics as a research area (see Section 2.1). We further present different ways to assist users of social media in dealing with misleading information from an HCI perspective, including digital interventions of various forms that strongly motivated the user-centered proceeding of our work (see Section 2.2). Subsequently, we illustrate research gaps and our research questions (see Section 2.3).
2.1. Misleading information in crises
As we investigate misleading information on social media during crises like the COVID-19 pandemic and the Russian war of aggression against Ukraine, it is crucial to shed light on previous works of crisis informatics which have focused on different user perspectives and their motivation to create misleading content in both long- and short-term crises. While we focus on the user perspective and resulting implications for the design of digital interventions, many existing studies investigate motivations for creating misleading information which are partly founded in antisemitism (e.g. believing in an international elite controlling government) (Hansson Citation2017; Starbird Citation2017) or an anti-globalist view (Molina, Sundar, and Lee Citation2021; Starbird Citation2017), or propagating actors and communities (Memon and Carley Citation2020). Other studies focus on specific conspiracy theories (e.g. 5G theory) (Ahmed et al. Citation2020) or contents of misleading narratives in English, Hindi, Bangla, or Telugu tweets during the COVID-19 pandemic (Akbar et al. Citation2021; Sharma et al. Citation2020). These contributions are especially valuable for our research goals as topics and, therefore, reflected motivations may allow us to derive comprehensible indicators for users with different backgrounds and varying degrees of vulnerability towards certain discourses and deception strategies. We conducted our study based on these findings, identifying similarities and complementing insights.
There are valid assumptions that misleading information during crises differs from misleading information in everyday life (Huang et al. Citation2015; Mendoza, Poblete, and Castillo Citation2010), for instance in regard to the speed at which it is transmitted (Zeng, Starbird, and Spiro Citation2016). In addition, the information needs during a public health crisis differ from those of other types of crises (Gui et al. Citation2017). Moreover, information, especially in the early stages of the crisis, is often incomplete and contradictory (Gui et al. Citation2017). This period is particularly characterised by great uncertainty (Burel et al. Citation2020). Considering worldwide spread of COVID-19-related misinformation, studies have frequently focused on English-speaking or US-centric debates (Schmid-Petri et al. Citation2023). For example, Evanega et al. (Citation2020) identified themes such as ‘New World Order’, ‘Wuhan Lab / Bioweapon’, ‘Bill Gates’, ‘5G’, ‘Antisemitic Conspiracies’, and ‘Plandemic’ to be prominent. While reflecting several of these themes in our study as well, regional differences can be identified as our German-language data set did not comprise tweets referring to ‘Democratic Party Hoax’ or ‘Dr. Anthony Fauci’ (Evanega et al. Citation2020). Another study, concerned with the perception of legitimacy of vaccine-related disinformation in the context of the COVID-19 pandemic, is also based on data from the U.S. (Di Domenico, Nunan, and Pitardi Citation2022). Connecting to works on the German COVID-19 social media debate (Schmid-Petri et al. Citation2023; Zeng and Chan Citation2021), it is indicated that overarching topics such as science denial or conspiracies can be seen as phenomena across the globe, with context-specific signifiers (e.g. politicians) diverging according to the national context.
Dedicated to the cooperative and collaborative use of information and communication technology in disruptive situations (Palen and Anderson Citation2016), crisis informatics has focused on the spread of false information in the course or aftermath of crises (Burnap et al. Citation2014; Goggins, Mascaro, and Mascaro Citation2012; Vieweg Citation2012). Further, Starbird, Arif, and Wilson (Citation2019) argue that information operations on social media, often led by political actors, are an important part of HCI research: such information operations ‘function to undermine the integrity of the information space and reduce human agency by overwhelming our capacity to make sense of information’. Indeed, finding adequate ways to assist users in dealing with misleading information (in crises) is a socio-technological challenge within the HCI research community. Characteristics of misleading information identified in the previously presented studies are a central part of developing effective countermeasures. In the following, we present how HCI works and related research designs have evaluated user-centered digital interventions.
2.2. Assisting users in dealing with misleading information
The dissemination of misleading information represents a worldwide issue with efforts from multiple perspectives to combat its impact. Potential solutions encompass professional fact-checking, media literacy campaigns, policy implementations, and digital interventions on social media. The strategies differ depending on various factors, including geographical location, culture, socioeconomic context, and political climate (Haque et al. Citation2020). Additionally, the type of assistance required can vary among individuals, for instance, based on their political ideology and age (Guess et al. Citation2020). The computer science research community, including HCI, addresses the challenge of misleading information by supporting media literacy efforts, policy implementations, and professional journalism by implementing technological solutions. These may comprise of automatic detection approaches (Shu et al. Citation2017), especially applying machine learning techniques, but also user-centered decisions and implementations on what to do with successfully (manually or automatically) detected misleading information. In particular, post-detection digital misinformation interventions (Bak-Coleman et al. Citation2022; Saltz, Barari, et al. Citation2021) have been investigated taking various forms (Hartwig, Doell, and Reuter Citation2023). This includes corrections, for instance underneath a social media post, in the comment section, or as a link to fact-checking websites (Bhargava et al. Citation2023), visibility reduction by reducing opacity or size (Ardevol-Abreu, Delponti, and Rodriguez-Wanguemert Citation2020), giving (binary) labels to mark content as right or wrong (Barua et al. Citation2019), or highlighting specific characteristics of misleading content as cues for users (Hartwig et al. Citation2024; Bhuiyan, Whitley, et al. Citation2021; Schmid et al. Citation2022).
While digital interventions vary widely; research suggests that users prefer those that come with a certain degree of transparency, allowing for informed decisions and the ability to comprehend why content is potentially misleading (Kirchner and Reuter Citation2020). Giving explanations or comprehensible cues can be significant to establish trust in the intervention (Hartwig et al. Citation2024; Kirchner and Reuter Citation2020) and counter feelings of reactance or related backfire effects (Nyhan and Reifler Citation2010) that are controversially discussed in research (Wood and Porter Citation2019). Indeed, a higher level of transparency can be used to enhance the media literacy and critical thinking competence of users to establish their own assessment strategies instead of forcing a total dependency on the intervention's feedback. In line with other researchers, we define media literacy as the ability to decode, evaluate, analyze, and produce media and internalise ‘critical autonomy’ (Aufderheide Citation1993). While the concept of media literacy has received some criticism for oversimplifying the complex information space (Hassoun et al. Citation2023), relying too much on rationality (Boyd Citation2017), and creating a false sense of confidence (Bulger and Davison Citation2018), research has demonstrated its beneficial effects to alter behaviour for the better (Spezzano Citation2021; Webb and Martin Citation2012) – an insight we draw on in our study.
In the context of different digital interventions to enhance media literacy (e.g. giving generic tips on how to detect misleading contents before users are even confronted with social media posts or news articles (Domgaard and Park Citation2021; Guess et al. Citation2020; Hameleers Citation2022)), indicator-based interventions have gained some attention in related HCI research (Hartwig et al. Citation2024; Martino et al. Citation2020). These indicator-based approaches may be applied in two ways:
| (1) | Integrated into a fully automatic tool that aims to detect misleading information (e.g. using machine learning) and, in addition, automatically detects previously defined user-centered indicators on successfully detected misleading content. This allows us to make the output comprehensible and useful for laypersons. | ||||
| (2) | Integrated in combination with manual professional fact-checking, where fact-checkers manually label user-centered indicators in addition to a binary decision or conduct the detection of previously defined user-centered indicators automatically (e.g. via natural language processing). | ||||
Several studies have started to investigate how characteristics of misleading or credible content can be derived and utilised either for statistic-based automatic detection approaches or as a more user-centered intervention. These characteristics or indicators can refer to diverse parts of a social media post, for instance, information about the author (Di Domenico, Nunan, and Pitardi Citation2022) (e.g. suspicious profile, name, followers, other posts), interaction with the posts (Hartwig et al. Citation2024) (e.g.likes, comments), or the content itself (Diaz Ruiz and Nilsson Citation2023) (e.g.rhetorical strategies, linking to questionable websites). For example, Shu et al. (Citation2017) have pointed out different topics, lexical, and syntactical features of fake news and Horne and Adali (Citation2017) evaluated how fake news articles differ from reliable content and found that fake news articles tend to be shorter, use less punctuation and more lexical redundancy, and titles can be considered a ‘strong differentiating factor between fake and real news’ (Horne and Adali Citation2017). Schoenmueller, Blanchard, and Johar (Citation2023) have investigated the relations of socio-demographic factors, social media activity, and personality traits of disinformation-sharing of users with textual and linguistic features based on their post-histories. They identified distinctive characteristics such as linguistic markers, high-arousal negative emotions (e.g. anger and anxiety), religion, and power-related vocabulary.
Recent attempts to capture specific rhetorical structures and tactics have been pursued by Diaz Ruiz and Nilsson (Citation2023) who have identified how identity-driven controversies and pre-existing culture wars are rhetorically exploited by the disseminators of disinformation. Their focus is on the particular example of flat Earth conspiracies, but more fundamentally, they unravel interconnections with broader narratives of faith and religion, societal agency, anti-elitism, and anti-intellectualism, leaving a much more diverse group of social media users susceptible to such tactics. Central to this is their perception that disinformation intertwines with general beliefs (Diaz Ruiz and Nilsson Citation2023). Di Domenico, Nunan, and Pitardi (Citation2022) additionally found through their study of social media users' behaviour in the context of vaccination misinformation in the U.S. that sharing behaviour depends on how legitimate users consider a piece of information to be. They explain how the perception of legitimacy can be described by five dimensions (cognitive, pragmatic, moral, expert, and algorithmic legitimacy), which must be addressed differently in an intervention. Furthermore, they identify specific ‘themes’ and cues through which the legitimisation can be realised (e.g. ‘Power Dynamics’, ‘Media-State Agenda-Setting’ and ‘Outsiders Thinking’ for cognitive legitimacy) and emphasise particularly how ‘expert cues’ (i.e. the representation of an author as an expert in the field) increase perceived legitimacy of misinformation. Our work builds on existing studies on misinformation indicators by systematically applying the derivation and user-centered evaluation of content-specific indicators (differentiating topical, formal, and rhetorical forms) referring to a specific crisis from an HCI perspective. We thereby were strongly inspired by related work (see ). We distinguish topical content, i.e. the meaning communicated by a post, from more formal indicators, such as punctuation, which is usually also considered as part of news content (Shu et al. Citation2017). Additionally, we search for rhetorical indicators as related structures have been proposed to complement detection based on lexicosemantic analyses (Rubin and Lukoianova Citation2015).
Table 1. The coding scheme is oriented by related scholarly contributions, as indicated by references, as well as tweets (*).
In addition to the deriviation of diverse indicators from text, images or videos, research has started to implement them within digital interventions, often using color-code to highlight indicators as cues for end users for immediate feedback and education (Bhuiyan, Horning, et al. Citation2021). Martino et al. (Citation2020) developed a system that analyses text and automatically highlights propaganda techniques such as exaggeration or oversimplification within the text in different colors. Similarly, Schmid et al. (Citation2022) present a web app that allows users to explore and comprehend patterns of potentially misleading and non-misleading tweets based on a social network analysis, revealing the potential to encourage the development of their own assessment skills. Evaluating derived indicators from the perspective of end users (e.g. regarding their comprehensibility) is necessary to develop user-centered and effective interventions. Some studies have started to investigate within this research direction (e.g. for video content (Hartwig et al. Citation2024), for voice messages (Hartwig, Sandler, and Reuter Citation2024), or for expert annotators instead of layperson (Zhang et al. Citation2018)).
Indeed, research on indicator-based interventions has revealed promising findings regarding trust (Bhuiyan, Whitley, et al. Citation2021; Kirchner and Reuter Citation2020), utility (Grandhi, Plotnick, and Hiltz Citation2021), and the development of autonomous assessment skills (Hartwig et al. Citation2024; Schmid et al. Citation2022), but also revealed challenges and limitations (e.g. not being transparent enough or having a biased design Grandhi, Plotnick, and Hiltz Citation2021). We build on those findings by complementing them with a crisis-related perspective and a specific focus on social media users as laypersons.
The majority of existing research on indicators has focused on social media content in everyday life instead of crises. However, specific conditions such as indicators or user requirements, may vary during a crisis (Plotnick et al. Citation2019). These conditions are essential for technology-based user assistance in both automatic detection and subsequent countermeasures. van der Meer and Jin (Citation2020) investigate the efficacy of correcting misleading information as a countermeasure against its spread specifically in crisis contexts. The authors posit that such measures may prove even more effective during crises, as the dissemination of misleading information concerns new information only, and therefore would not require individuals to alter their attitudes, identity, or ideology, but only their beliefs regarding the current crisis situation. It is uncertain whether this assumption is applicable to a crisis such as the COVID-19 pandemic, as a long-term and disruptive event. Furthermore, Plotnick et al. (Citation2019) conducted an online survey to assess general user behaviour and attitudes towards fake news. The analysis results indicate that users consider grammar and the sender's trustworthiness as key indicators of trustworthy content. Additionally, the majority of participants expressed a desire for a color-coded graphic to aid them in evaluating the trustworthiness of information on social media. Although the authors did not specifically concentrate on crises, they underscore the significance of evaluating the credibility of social media content during such situations. For example, they propose examining whether grammar can still effectively indicate untrustworthy content during a crisis when content creation time is limited. These findings drive our research and seeks to understand user perspectives on comprehensible and useful indicators as potential interventions during crises, which represent exceptional and extraordinary circumstances for misleading information.
2.3. Research gaps and research questions
Our work contributes to existing literature on HCI regarding misleading information during crises by shedding light on the user perspective, filling the following two gaps:
1st gap: Prior studies have investigated misleading information with respect to the COVID-19 pandemic, yet clearly focused on the U.S.. We offer a vantage point for research on transnational discourses of misleading information, revealing regional specifics or patterns of German tweets that are similar to U.S. conspiracist narratives (e.g. Akbar et al. Citation2021; Sharma et al. Citation2020) on COVID-19. We differentiate between topical, formal, and rhetorical indicators. This also allows us to reveal relationships between these three types of characteristics and accompany studies that have been interested in social media behaviour with regards to different topics.
2nd gap: Studies have already investigated features of misleading contents in terms of applicability for automatic detection (Zeng, Starbird, and Spiro Citation2016), the motivations for the creation of misleading information (Starbird Citation2012, Citation2017), and a user perspective on (digital) misinformation interventions (Aslett et al. Citation2022; Horne and Adali Citation2017; Martino et al. Citation2020; Pennycook, Epstein, et al. Citation2021). However, the user perspective regarding countermeasures is still to be addressed even more extensively (Gui et al. Citation2017; Kirchner and Reuter Citation2020) regarding indicator-based approaches to encourage media literacy. By identifying user-centered, i.e. comprehensible and useful content-specific indicators for misleading tweets, we contribute to existing research (Kahne and Bowyer Citation2017; Kirchner and Reuter Citation2020; Mihailidis and Viotty Citation2017; Potthast et al. Citation2017) that focuses on the subsequent countermeasures after (automatic or manual) detection. Recently, researchers have stressed the importance of designing user-centered measures that counter reactance (Müller and Denner Citation2019; Nyhan and Reifler Citation2010) and follow the needs and preferences of end users for comprehensible and transparent information (Kirchner and Reuter Citation2020). Building on other approaches for user assistance (Bhuiyan et al. Citation2018; Fuhr et al. Citation2018; Hartwig and Reuter Citation2019), we follow up on those findings and complement them with a focus on specific crises. As the time at the beginning of a crisis is particularly relevant for the investigation of misleading information due to high uncertainty (Burel et al. Citation2020), we focus on this period in our study when thoroughly analysing tweets. Instead of working towards an explanation of AI models, we are specifically interested in comprehensible content-specific indicators, independently from the preceding detection method.
We are convinced that approaches governing users' online activities need to offer the necessary ground for reflection or learning and that research on assistance for users in dealing with misleading information online during a crisis may help to achieve this. Thus, our overarching goal is to answer the following research questions:
| RQ1: | What are topical, formal, and rhetorical characteristics of misleading tweets in crises, with the COVID-19 pandemic serving as an example? | ||||
| RQ2: | Which indicators are used autonomously to assess the credibility of tweets? | ||||
| RQ3: | What comprehensible and useful content-specific indicators can be derived with regard to the design of digital artifacts assisting users on social media in dealing with misleading tweets during crises? | ||||
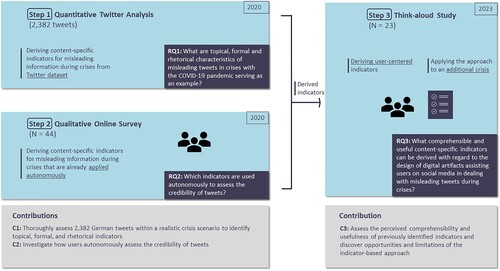
We present our contribution within a threefold study design. First, we perform a content analysis of Twitter data to get a sense of what misleading information in the context of crises such as the COVID-19 pandemic looks like and to identify content-specific characteristics. Second, we conduct an online survey to qualitatively assess which indicators users already apply autonomously to estimate the credibility of tweets. Third, our think-aloud study gains qualitative insights into how comprehensible and useful people from different backgrounds perceive the previously identified indicators to be, extending our approach to the Russian war of aggression against Ukraine as an additional recent crisis event.
3. Methodology
In this paper, we employed a threefold study design to provide the foundation for future digital misinformation interventions after (manual or automatic) pre-filtering. Our primary goal was to derive user-centered indicators to help users evaluate the credibility of tweets, specifically regarding misinformation during crises like the COVID-19 pandemic or the Russian war of aggression against Ukraine. The study did not develop any intervention but aimed to identify and evaluate potential indicators for integration into subsequent interventions. The threefold methodology is motivated by related work (Saaty et al. Citation2022) that emphasises using social media data as a source of information to provide an extension to traditional methods such as the think-aloud method.
Step 1 of the study entailed a quantitative Twitter analysis. Here, we established a thorough knowledge base to ‘get a sense of what [misleading information] looks like in the context that [we] are interested in’ (Pennycook, Binnendyk, et al. Citation2021). Tweets concerning COVID-19 were gathered and examined by researchers, who distinguished between misleading and non-misleading content. A content analysis was carried out, identifying several characteristics of misleading tweets, which were sorted into topical, rhetorical, and formal characteristics. These characteristics could be potential indicators assisting users in assessing the credibility of tweets. However, to evaluate this, the subsequent user-centered steps are still necessary.
Moving on to Step 2, the researchers aimed to discover the characteristics that Twitter users utilise when assessing the credibility of tweets autonomously. They conducted a qualitative online survey, where participants rated the credibility of a set of tweets and were asked to provide explanations for the characteristics or indicators used for their credibility assessments. This phase provided researchers with insights into the indicators that individuals autonomously use when evaluating the credibility of tweets and might be particularly beneficial for users with lower media literacy (e.g.due to young age) to be displayed as cues.
In Step 3, the study integrated the findings from Steps 1 and 2. The identified characteristics of misleading tweets from Step 1, both on the topical, rhetorical, and formal levels, were combined with the indicators autonomously used by participants in Step 2. In this final phase, we examined in a think-aloud study how users perceived the usefulness and comprehensibility of these indicators when presented alongside actual tweets regarding multiple current crises. This encompasses indicators that can be considered rather definitive for credibility assessment and others that are more subtle but still provide a fuller picture of creators' intentions or beliefs, and overall encourage critical reflection. In the following, we present Twitter as our case selection and a detailed description of the methodologies in Steps 1 to 3 (for a graphical representation of our threefold study design see ).
Figure 1. Graphical representation of our threefold study design comprising of (1) a quantitative Twitter analysis, (2) a qualitative online survey, and (3) a think-aloud study.
3.1. Case selection
Twitter (now X) as an important social media platform (Economic and Social Research Council Citation2020) allows fast information dissemination across national borders. Assuming the network constitutes a sphere of public discourse, comprising users with different levels of educational and political backgrounds, we decided to select Twitter during crises as our research case. We addressed this case in three different case analyses that build on each other (see Section 3 and ). We conducted an analysis of tweets regarding the COVID-19 crisis in 2020. Focusing on German tweets may reveal important insights as both conspiracy theories and vivid debates by civil society have a long history. It further allows for the derivation of indicators in the German language. To gain additional insights into the transferability to other recent crises, we extended our stimuli to the Russian war of aggression against Ukraine in Step 3. While the COVID-19 pandemic as a health-related crisis primarily revolves around public health and safety, tweets regarding the Russian war against Ukraine are fundamentally of a more security-related nature. Despite their differences, both crises share commonalities in their political relevance, the occurrence of common conspiracy theories, the exploitation of the insecure situation by manipulative groups, and their high potential to influence public opinion. As many other social media platforms, Twitter has consistently adapted its handling of misleading information during the pandemic, reaching from removal or labeling of harmful contents to generic warnings that the information conflicts with public health experts' guidance (Coleman Citation2020). While less specific warnings may be time-efficient, users could have problems understanding their reasoning (Haasch Citation2021). Recently, Twitter has started the pilot project ‘Birdwatch’ in the USA as a community-based approach (Coleman Citation2020). However, at the time of this study, this approach was not yet accessible in Germany. While this work was conducted when the platform was still named Twitter, recent changes have demonstrated an increasing interaction with disinformation sources after accounts controlled by a state are no longer marked as such. This shows a wider relevance of the platform now named X for misleading content in general (Sadeghi, Brewster, and Wang Citation2023).
3.2. Step 1: Quantitative twitter study updated -- deriving content-specific indicators for misleading tweets during crises
Step 1 aims to contribute to the knowledge base on characteristics of misleading tweets during the COVID-19 pandemic as a specific crisis. Thus, we derived characteristics on different levels as potential indicators to assist users in assessing tweets' credibility.
3.2.1. Data collection
To create our sample, we used a Twitter API, scraping a wide range of COVID-19-related tweets using the query ‘Coronavirus OR Corona OR Covid OR Coronakrise OR coronadeutschland OR Corona19 OR covid19 OR covid-19 OR #COVID-19’. We initially collected a total of about 360,000 tweets. The first data collection phase on Twitter took part during a very early stage of the pandemic (27 February 2020 to 6 March 2020) while the second data collection phase on Twitter took part from 14 April 2020 to 22 April 2020. Public life in Germany was still quite ordinary during the first observation period, and a strong focus of reporting was on foreign countries such as China and Italy. Only after the first observation period were contagions detected in all German states, and Chancellor Merkel announced the first Germany-wide lockdown. During the second observation period, more and more COVID-19 cases were recorded in Germany. Germany was still in the first lockdown, and public life had reached a standstill. However, a slow return to public life had already been introduced. The debate about compulsory vaccination was present in the public discourse.
3.2.2. Data processing
To extract a meaningful number of tweets for subsequent examination for indicators, we used Python to process the tweets as follows. (1) We excluded all non-German tweets and eliminated duplicated content like retweets. (2) We generated a random sample to include all potential kinds of misleading information, independent of topic and motivation. (3) We ensured that a sufficient number of misleading tweets was included during a group of researchers' initial review of the tweets. (4) A thorough introduction and a background in political science qualified the researchers to label the tweets with the corresponding codes. A detailed description of the individual steps can be found in the appendix (see Section A.1). To gain a balanced proportion, we randomly excluded some non-misleading tweets from the analysis as they were overrepresented after the final coding. Hence, our final sample for analysis consisted of 2382 tweets in total, including 50% misleading information such as false information or misleading satire, and 50% tweets that were marked as not misleading. This entails tweets that were labeled as true information, opinions that are not absolute, or satire that is not misleading in the COVID-19 context, both for the sample of the early stage and the second stage of the crisis.
3.2.3. Analysis
After extracting a reasonable amount of tweets, we conducted a manual content analysis to thoroughly derive characteristics of misleading in comparison to non-misleading tweets. The content analysis (Flick Citation2014) consisted of a manual coding process using RQDA. We chose to perform the analysis manually instead of computationally, to not overlook any previously unexpected characteristics and allow for diving deep into the data. A training phase initiated the coding process to obtain a common understanding of the codes. Code categories, codes, and sub-codes were developed both deductively and inductively, taking into consideration both theory and the empirical material (see Coding Scheme in ). It was an iterative process, enabled by a research group of three. Three researchers with expertise in political science and misleading information, as well as HCI, labeled the tweets according to a pre-established coding scheme by one researcher. Each tweet was at least tagged as misleading or non-misleading. As we are interested in identifying potential indicators for misleading tweets, many non-misleading tweets were not assigned to any of the codes reflecting topics.
We were looking for immediately visible and potentially comprehensible indicators for misleading tweets and thereby differentiated between topical, formal, and rhetorical characteristics of tweets as potential indicators, inspired by related work (see Coding Scheme in and, for examples, see , App.). With topical indicators, we aim to capture topics that are recurring in misleading posts. Thus, we want to gain insight into what message posts communicate and differentiate lexical or syntactical indicators, such as punctuation, from a post's meaning. We also identify related formal indicators, which may also represent system functions, such as external links or hashtags (Shu et al. Citation2017). Codes capturing these formal and more general content indicators were inspired by the literature on the detection of misleading information (Castillo, Mendoza, and Poblete Citation2011) and related contemporary ideological narratives (Hansson Citation2017; Starbird Citation2017). In contrast to topical and rhetorical characteristics and the majority of formal characteristics, the mere existence of hashtags or links is not an indicator of misleading information. Instead, users can conclude a closer look at the hashtags or links contained, e.g. whether they lead to conspiracy theory websites. Specific topical indicators (e.g. ‘Laboratory Wuhan’) were based on the exploration of tweets as were the majority of codes capturing rhetorical indicators of tweets. Thus, regarding the latter, we did not dive into rhetorical structure theory (Rubin and Lukoianova Citation2015) or intend to expose the existence of more abstract underlying rhetorical tactics (e.g. the construction of echo chambers (Diaz Ruiz and Nilsson Citation2023)). Instead, our focus lies on more basic stylistic means, (e.g. ‘Exaggeration’, ‘Sarcasm’), which could be identified in the empirical data. We thereby implicitly agree with the assumption that the dissemination of disinformation can operate through underlying rhetorical tactics, but instead focus on identifying the specific stylistic and rhetorical devices employed in the process.
Coders were free to add codes to the existing coding scheme whenever necessary. In that case, the information on the new code was shared with the other coders. In all other cases, after the training phase, the three coders worked independently to achieve a sufficient level of objectivity. Subsequent analyses were based on majority decisions, determining the codings. Intercoder-reliability was tested and reached a value of .
3.3. Step 2: Qualitative online survey updated -- autonomous assessment strategies of tweets during crises
Step 2 extends the discovery of characteristics of misleading tweets during the quantitative Twitter analysis of Step 1 using a user-centered approach. This phase enables us to gain insights into the indicators that individuals already autonomously utilise to evaluate tweet credibility. We created twelve tweets (see ; App.) inspired by real-world examples. Tweet contents such as text and referenced images, links or videos were maintained. However, the original real-world profile names and pictures were changed to include potentially interesting characteristics (e.g. tweets by an unknown fictional doctor) and avoid biases towards well-known personalities or the exposure of real-world Twitter users.
3.3.1. Participants
We asked 49 participants of different socio-demographic backgrounds whether they thought statements to be true or false as well as, openly, how they came to their respective conclusions. This was conducted in an online survey format (SoSci Survey), with adult participants getting an expense allowance of €25 each. For the analysis, we excluded participants who withdrew prematurely from the study, resulting in N=44 valid data sets. The sample size is in accordance with common user studies in HCI research (Caine Citation2016). Participants were acquired mainly through a university website and Facebook groups. Of the participants, 38% were male; 62% were female. The age was collected in clusters with most participants being between 20 and 29 years old (38%) or older than 54 years (33%). Regarding the highest formal education, five participants had completed vocational training (‘Lehre’), two had a (general) certificate of secondary education, four had a vocational diploma, nine had A levels, and 17 had a university diploma. Seven participants made no entry for education. Our goal was to receive a diverse qualitative input, effects of socio-demographic differences were not evaluated. The questionnaire was part of a longer study spanning over seven days, with the fourth day focusing on the issue of online misleading information regarding the COVID-19 pandemic. Our study design did not explicitly introduce the context of misleading information beforehand to minimise a framing effect. The survey answers were collected in open text format.
3.3.2. Analysis
We used RQDA for a qualitative content analysis of the open-text questions. Consensus coding (Wilson, Zhou, and Starbird Citation2018) with discussion to resolve disagreements was conducted by two researchers trained in social sciences, referring to a coding scheme similar to the one of the first quantitative study (for an excerpt of survey answers and their according codes see , App.).
3.4. Step 3: Think-aloud study updated -- perceived comprehensibility and usefulness of content-specific indicators
Building on the derived potential indicators during the content analysis in Step 1 and the additional insights on autonomously applied indicators during the online survey in Step 2, we investigated if and how the derived indicators are perceived as comprehensible and useful when assessing tweets. Thus, in Step 3, we get a thorough user perspective on identified indicators as central characteristics to be applicable within a user-centered digital misinformation intervention. Comprehensibility and usefulness are central concepts when gaining first insights into the perceived effectiveness of an intervention in contrast to evaluating the objective and quantitatively measurable effectiveness, for instance, in large-scale field studies or experiments. Comprehensibility refers to the extent to which our proposed indicators are easily understandable in general and in regard to a specific tweet to assess its credibility. On the other hand, perceived usefulness refers to the extent to which our proposed indicators are helpful in achieving the intended goal of enabling users to assess the credibility of a tweet.
3.4.1. Stimuli
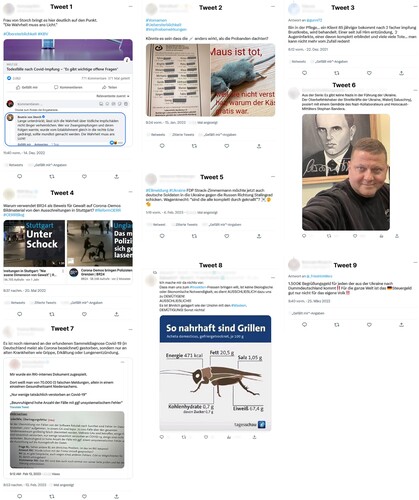
We included a total of nine tweets as stimuli in our think-aloud study. This includes one tweet with completely correct information (tweet 4) and one tweet, that although having the potential to cause harm, has been professionally checked and consists of correct information as well (i.e. the picture and names mentioned are correct, however the picture is cropped). All remaining seven tweets were officially identified as misleading. For all nine tweets, we have resorted to official fact-checking websites that have performed professional fact-checking on the content mentioned. To allow for comparison with Step 1 and 2, we focused on recent tweets concerning COVID-19 and added three tweets concerning the Russian-Ukranian war as another current crisis. Inspired by the guidelines by Pennycook, Binnendyk, et al. (Citation2021) for selecting misleading and non-misleading tweets we visited official fact-checking websites to first identify suitable topics that are not completely likely to be familiar to participants. We further made sure to select content that had not already been outdated when conducting the study. After identifying recent and relevant topics on the fact-checking website, we searched Twitter for current tweets referring to COVID-19 from both a favourable and critical perspective on official COVID-19 measures, as well as tweets referring to the war from both a pro-Russian and pro-Ukrainian perspective. To avoid biases towards well-known personalities and to focus solely on the tweet content which is our special interest in this study, we blurred profile pictures and profile names of the authors as well as statistics (i.e. number of likes, shares, and retweets). However, when a tweet content included a name or profile picture, we kept the original display as we consider this part of the content itself. Information on the posting date was kept visible as well (see all tweets in ).
Figure 2. Tweets that were used as stimuli during the think-aloud study. Tweet 4 contains accurate information that has been officially fact checked by Correctiv (https://correctiv.org/faktencheck/2022/06/03/br-tauschte-irrefuehrendes-vorschaubild-in-video-beitrag-ueber-corona-demos-aus/). While tweet 6 has the potential to cause harm, official fact-checking found that the picture and mentioned names are correct (https://correctiv.org/faktencheck/2023/01/04/ja-auf-diesem-foto-steht-ein-ukrainischer-general-vor-einem-stepan-bandera-gemaelde/). All other tweets contain misleading information that was officially disproved.
3.4.2. Procedure
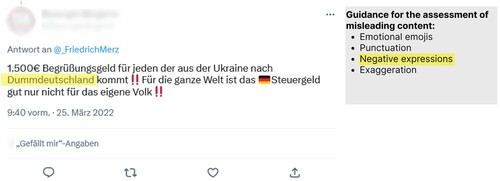
The study was conducted online using Zoom, where sessions were recorded separately. See Section A.2 in the Appendix for a detailed description of the study procedure including all items. At first, we assessed demographic information and political attitudes in a questionnaire. We then presented nine real-world tweets. Participants were instructed to keep thinking aloud while performing the following tasks and were told that there was no wrong or right, we were only interested in their individual assessment (Fonteyn, Kuipers, and Grobe Citation1993). We asked the 23 participants about their familiarity with the tweet, its perceived importance, and its perceived credibility. For the two tweets containing reliable information, we asked the participants to imagine that a reliable fact checker (human, organisation or algorithm) found the tweet‘s content to be correct. In contrast, for all seven tweets containing misleading information, we asked the participants to imagine that the reliable fact checker found the tweet to be misleading and therefore, in addition, an algorithm looked for indicators as guidance on evaluating misleading tweets. We then presented a list of indicators next to the given tweet and asked to elaborate on the perceived comprehensibility and usefulness of each indicator. For this, we highlighted the indicators and referred parts of the tweet with color (see ). Afterwards, participants were asked again to rate the tweet's credibility before the researcher informed participants about the actual truthfulness of the tweet. After all nine tweets were addressed, we asked the participants to summarise their overall impression of the comprehensibility and usefulness of the approach of highlighting indicators for misleading tweets and if it made a difference if decisions on tweets’ credibility were performed by an algorithm or by a fact-checking human/organisation. We did (not) explicitly introduce the topic of misleading information to avoid biases at the beginning of the study. However, the context of the study became clear very early on.
Figure 3. Example of the stimulus for tweet 9 and the indicator ‘negative expressions’. The textbox on the right was translated from German to English.
3.4.3. Participants
A total of 23 participants took part in our think-aloud study, ranging from 20 to 66 years (Median = 32) and covering a diverse set of educational levels (six participants with basic education, ten participants with medium level of education and seven with high level of education). The sample size is in accordance with common user studies in HCI research (Caine Citation2016). We explicitly decided against recruiting solely college students as these are already overrepresented in misinformation studies due to their easy accessibility, and they do not represent the average user. Of the participants, 14 were male, eight were female, and one was of diverse gender. All participants, except for two, stated German to be their native language. To gain information on the social media usage and expertise of our participants, we asked how often they use social media. The majority stated using social media daily (N = 20) or several times a week (N = 3). More specifically, six stated using Twitter daily, eleven several times a week or weekly, three once or two times a month and six never use Twitter. As our stimuli address misleading and reliable information on the topics of COVID-19 and the Russian war against Ukraine, we further evaluated central general attitudes towards these topics and the general political orientation of our participants. Of the participants, 20 fully or partially agree with COVID-19 measures being useful overall, while three tend to disagree. All participants fully or partially agree with the statement that the coronavirus exists. All participants, despite one, fully agree with Russia waging a war of aggression against Ukraine. The single participant stated to fully disagree. We asked our participants to place themselves on a scale from 1 (extreme left) to 11 (extreme right) regarding politics. Six participants placed themselves on the far left between 1 and 2, nine rather left between 3 and 4, eight in the middle between 5 and 7, and none further right than this. Participants were acquired through the panel provider Prolific and got an expense allowance of €12 for an average duration of 60 minutes.
3.4.4. Analysis
For data analysis, we automatically transcribed speech to text using whisperFootnote1 and manually checked for better quality. We then performed a content analysis with two researchers regarding the dimensions of perceived comprehensibility and usefulness of each indicator as well as more general findings regarding the perceived comprehensibility and usefulness of the whole indicator-based approach. Thus, Step 3 results in a thorough overview with which previously derived indicators are perceived as useful and comprehensible and can be considered suitable to be integrated into a future indicator-based misinformation intervention.
4. Results
In the following, we present the results of our threefold study. We start by reporting the identified characteristics of misleading information disseminated on Twitter in the course of the COVID-19 pandemic (RQ1) which we assessed in the quantitative content analysis of tweets as Step 1. Subsequently, we present our findings on which indicators are already being used autonomously by users to assess tweet credibility (Step 2: qualitative online survey) to answer RQ2. Finally, we report how users perceive the comprehensibility and usefulness of identified indicators (Step 3: think-aloud study) to answer RQ3.
4.1. Deriving content-specific indicators for misleading tweets during crises
In Step 1, we systematically derived characteristics of misleading tweets in comparison to non-misleading tweets on the topical, formal, and rhetorical levels to create a knowledge base on what misleading information during a specific crisis looks like. Our sample consisted of misleading tweets (N = 1191), which contain claims of holding true information while they are inaccurate. Some of these tweets may have been formulated for satirical reasons, yet they may mislead perceiving users in case they do not clearly reflect satire while referring to virus-related issues. For example, some tweets indicated the healing potential of alcohol: ‘In Russia, nobody has come down with COVID-19. So, don't prep yourself with any cans of sausages, of fish, any ready-to-serve meals or water. Buy a lot of vodka!’ (#0046) Because people have believed similar statements with regard to the origin, effect, and options of healing of COVID-19, we categorised such tweets as misleading. The second group of tweets (N = 1077) consists of accurate information, own and thus non-falsifiable experiences or feelings as well as satirical tweets which do not suggest misleading users. Satirical posts (N = 114) like ‘To be fair, there is nothing more frightening than German bureaucracy. I am not sure whether the #coronavirus wants to deal with it. Viruses also have standards’. (#0779) are assumed to be not misleading as they, again, personalise the COVID-19 virus and put it in an unrelated semantic field (i.e. bureaucracy) to criticise politics.
In the following, we present topical, formal as well as rhetorical indicators of both misleading and non-misleading tweets related to the COVID-19 crisis in Germany (see for an overview of all indicators).
4.1.1. Topical indicators for misleading tweets
Regarding the first group of topical indicators, the content analysis revealed that codes of the category of ‘Traditional Conspiracies’ like ‘Free Mason’, ‘Nazism’, ‘Prepper AntiGlobalism’, ‘Sovereignty Germany’ appeared very rarely while codes referring to new, more context-specific themes (e.g. ‘Restriction of Liberty’ or ‘Gates’) were much more prevalent (see ). At the same time, misleading tweets were still characterised by some traditional conspiracist topics like the ‘Exclusive Elite’. For example, one user made clear that
[i]t is about something else, but you will soon learn about it; it is not about the coronavirus. Soon, the hospitals will be overcrowded with children, who will be freed from the underground, where they have been living in underground bunkers for years. Who of you knows about adrenochrome, just google it. (#1331)
Attesting confidence about having complete, yet exclusive, knowledge of the world is a conventional feature of conspiracy theories, which, in this instance, was put into a contemporary context, referring to adrenochrome (a metabolite which plays an important role for the QAnon conspiracy theory). Related statements may also carry antisemitic content: ‘There are some people who have strong doubts about the official version of China regarding the coronavirus (…). There are theories and assumptions that, for example, Soros has something to do with the virus, which would perhaps be very interesting’. (#0271). Further, new trending themes like ‘Gates’ or comparing COVID-19 to conventional influenza regarding its effects (cf. ‘Homeopathy Influenza’) may follow more established science denialist, anti-vaccination narratives:
This is a very big #put-on of the German people! Whether ‘refugees’, whether #corona, whether the new app and the compulsory vaccination with a chip, everything is a plan by criminals like the #WHO #BillGates #RKI #Merkel #Spahn #Rothschild #Rockefeller and their organisations! (#1219)
4.1.2. Formal indicators of misleading tweets
Regarding formal indicators, we observed a relatively balanced distribution across types of tweets (see ). Links were used in 1183 tweets, of which 519 were misleading. Although links may make a tweet seem more credible, this may not always be the case. Thus, taking a closer look at the referenced link can lead to a suitable indicator for misleading content (e.g. a link to a conspiracy website). The same applies to hashtags, which on their own are not an indicator of misleading information. Again, however, a nudge to look more closely can lead to a helpful indicator (e.g. hashtag naming a conspiracy theory). Interested in cross-media use and the types of media shared by embedded URLs in tweets, it was revealed that links in misleading tweets were most frequently referring to YouTube videos and images (see , App.). While we did not perform statistical analysis on that particular topic, our findings reveal some first impressions. For instance, 2.56% of non-misleading tweets contained an embedded link to a YouTube video; for misleading tweets, that was the case in 21.58% – such a large difference cannot be seen in any other type of embedded links. Well-known online news sites (Focus, N-TV) were shared to a similar extent across non-misleading and misleading tweets. This may be due to the rather superficial, short-term nature of fast online journalism. Additionally, smaller, less professionally held blogs were used as references. While we derived the share of links that related to URLs containing the word ‘blog’, we did not list the various, relatively unestablished homepages that may account for the greatest share of links in misleading tweets. At the same time, ‘traditional’ conspiracist or misleading websites (Russia Today, Sputnik, Anonymous, pi-news) were not used as much as expected in misleading, but never in non-misleading tweets. Formal indicators common for crisis situations, like capitalisation of words or incorrect spelling, were comparatively more present in misleading tweets. Yet, and potentially as the COVID-19 pandemic is no short-term event fueling overwhelmingly highly emotional tweets, misleading tweets were rarely characterised by such formal elements. Looking at misleading tweets, the use of links was comparatively most frequent, suggesting users' interest in legitimisation or increased spread of content being important. All formal indicators indicating incorrect language use were more indicative of misleading content than non-misleading, with the use of unusual quotations being solely present in misleading tweets. Thereby, users questioned the existence of the ‘virus’ (#1795) or related ‘deaths’ (#0024).
4.1.3. Rhetorical indicators for misleading tweets
The third group of indicators comprised rhetorical devices that are applied commonly in the context of the creation of misleading information (see ). With respect to negative, absolute language that may intensify conversational interactions, we made out two recurring themes of swear words. First, terms relating to fascism, dictatorship, or the Weimar Republic were used to target the current political system and incumbents (#1398, #1720). Thus, one user notes that ‘[t]he Merkel Regime is finally dropping its masks and turning out as an axis-mirrored fascist dictatorship of “Mini-fascists” End the masquerade [sic]! #corona #FRG2020’. (#1668)
Second, stigmatising political measures and (scientific) public discourse on the COVID-19 pandemic was performed by pathologization. For example, ‘hysteria of speculators’ (#1383) was defined as the reason for the outbreak of COVID-19 while support for political measures was achieved because of irrational fears or (creation of) panic (#1749). In sum, 7.81% of misleading tweets contained the words ‘panic’, ‘hyster*’, ‘insane’, or ‘delusional’. Such discursive undertakings were also reflected by the constructions of neologisms like ‘Merkill’ (#1170), ‘schizophrenic framing-channel’ (#0028), or ‘Coronavirus-Hysteria’ (#0108). While ‘Sarcasm’, ‘Irony’, and ‘Rhetorical Questions’ were also, partly predominantly, used in non-misleading tweets, all other rhetorical indicators could most frequently be studied by looking at misleading tweets.
4.2. Autonomous assessment strategies of tweets during crises
To shed more light on the user perspective, the aim of our online survey (OS) in Step 2 was to investigate which content-specific indicators people have already been using autonomously for assessment of tweets, assuming that these are indicators from which they might benefit when highlighted in an assisting tool. We see this step as a complement of the identified characteristics from our quantitative Twitter analysis which allows us to potentially add additional indicators, conform others, or identify particular relevance. While some indicators were autonomously identified by the participants, others, such as specific rhetorical indicators, were not. Adding those indicators to a user-centered assisting tool might have the potential to help users expand their knowledge and encourage media literacy through offering an explanation of ‘tendentious’ (OS02:17) content. In the following, we address topical indicators, formal indicators, and rhetorical indicators successively.
Regarding topical indicators, we can observe that ‘Science Denialism’ indeed played a significant role in our participants identifying tweets as misleading. The absence of scientific references when stating alleged scientific information was emphasised (see ). The participants were often ‘skeptic in general’ (OS02:01) when vaccination statements were combined with COVID-19 topics, especially when scientific references were missing. As instances of ‘Strong Denial of Vaccination’ were also exclusively prevalent in misleading tweets of our second period of observation, it is indicated that users may identify misleading information of a potentially more deliberate nature more easily. In our large sample of tweets for the quantitative study, many were tagged as containing explicit media criticism, referring to the ‘mainstream media’. To our participants, this buzzword constituted a well-known indicator of problematic content (OS13:02). However, some participants assessed tweets by critical journalism as misleading information as well, solely based on the occurrence of the word ‘media’ (OS02:01; OS02:03; OS13:04). Hence, further investigations on how to help differentiate between media ‘criticism’ in misleading information and media criticism that is a form of critical journalism may be a valid effort.
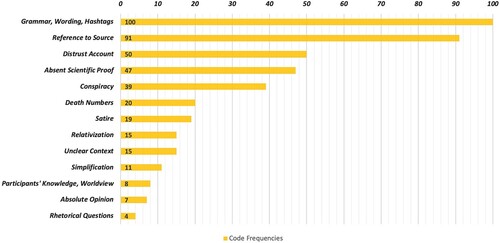
Figure 4. Overview of code frequencies in study 2. For participants, tendentious phrasing was mostly an indicator of misleading information, followed by an absence of references supporting the respective statements or critical opinions regarding sources. Only one participant was convinced by a tweet because the reference suggested proof of accurate information. More specific stylistic or rhetorical indicators were less often relied upon when assessing tweets.
While we observed a strikingly large co-occurrence of different conspiracy theories in the same tweets (e.g. ‘Gates’ and ‘Science Denialism’), participants in our survey did not explicitly reflect on specific conspiracy theories or their combined appearance. Instead, they rather mentioned the dominance of conspiracy theories in general (OS02:05; OS02:06; OS02:07). This suggests that some users may find a more general indication of the ‘Conspiracy Theory’ category satisfactory while highlighting more well-known conspiracist vocabulary or strong statements may also increase comprehensibility. At the same time, evaluation of the answers to the online survey also indicates that it is not necessary to overload users with information on relationships between conspiracist topics and narratives.
When looking at the formal indicators, our quantitative results revealed that, although a relevant system feature, ‘Links’ were not a distinguishing characteristic of misleading content. Participants also considered links in their assessment and found links to traditional news to be a comprehensible indicator of non-misleading content (OS03:07). During our survey, it became clear that the content was decisive. Participants referred to ‘#DeepState’ or ‘#Simulation Game’ (OS02:08; OS13:09) as an indicator. Thus, respondents stressed their problematic content while also emphasising that hashtags may be relatively easily identifiable as relevant formal indicators. Some survey participants considered a lack of punctuation or excessive punctuation (e.g. ‘…’) indicative of misleading information (OS02:10; OS02:11; OS02:12; OS02:13). This is consistent with results of the Twitter analysis, which show the prevalence of incorrect spelling or grammar in misleading tweets, and backed by prior research (Plotnick et al. Citation2019).
Regarding rhetorical indicators, while they appear to be significant indicators for misleading information, respondents did not make many statements. Individuals named provoking language and contentious terms as indicators or declared that they ‘assess this statement as extremely exaggerated’ (OS03:14). However, they did not evaluate tweets as misleading based on the occurrence of absolute phrases (i.e.‘Absolute Truth’) or ‘Relativization’. Considering the online survey, it appears difficult to transparently evaluate tweets as misleading, referring to these rhetorical indicators. ‘Exaggeration’, ‘Absolute Truth’, ‘Relativization’, and ‘Negative Phrases’ (including swear words) were valid indicators for misleading tweets in our quantitative analysis. Hence, interested in comprehensible user assistance, future HCI research may benefit from looking deeper into how these rhetorical indicators can be used as indicators for end users, providing a learning effect regarding the identification of misleading information.
Summarizing the findings of our online survey, the strong indication of sources as indicators implies that users may not want to invest too much time into assessing content and rather prefer to quickly evaluate based on obvious indicators. At the same time, regarding each tweet, roughly one-fifth of participants evaluated the tweet incorrectly (see , App.). These participants, in particular, might benefit from our user-centered approach of giving comprehensible content-specific indicators to encourage media literacy instead of labeling tweets as misleading without explanation. We use the insights gained here on indicators already applied autonomously and not yet used consciously as input for our final Step 3.
4.3. Perceived comprehensibility and usefulness of content-specific indicators
Building on our findings in the two previous steps, we made sure to include tweets containing the following formal indicators: ‘Emoticons’, ‘Capitalization’, ‘Punctuation Marks’, and ‘Incorrect Spelling Grammar’. We decided to include ‘Hashtags’ and ‘Links’ as formal indicators as well, as they were specifically mentioned as helpful in Step 2. For rhetorical indicators, we included ‘Negative Phrases’, ‘Rhetorical Question’, ‘Exaggeration’, ‘Relativization’, and ‘Absolute Truth’. We decided to exclude ‘Irony’, ‘Satire’, ‘Sarcasm’, and ‘Phraseme’ as they did not appear significantly more often in misleading tweets and were not mentioned by participants in Step 2. ‘Metaphor Neologism’ was excluded as it appeared only 14 times in sum within our comprehensive sample in Step 1 and could not be identified for any additional tweets for Step 3. The assessment of rhetorical indicators in Step 3 is of special interest, as they were barely used by participants in Step 2 while being highly relevant. For topical indicators, Step 1 revealed an overabundance of all indicators in misleading tweets. We exemplarily included ‘Restriction of Liberty’ and ‘Science Denialism’ as topical indicators. See our final selection of stimuli in and an example of a stimulus with guidance in .
4.3.1. Comprehensibility and usefulness of topical indicators
The comprehensibility of the included topical indicators ‘Restriction of Liberty’ and ‘Science Denialism’ was overall very high. For instance, in tweet 1, 20 participants were fully able to explain correctly what ‘Restriction of Liberty’ meant in that particular tweet and in general, indicating a high level of comprehensibility. Regarding the perceived usefulness of the indicators to assess a tweet's credibility, the results were also very positive, but with a few drawbacks. For example in tweet 8, 16 participants (fully) agreed with ‘Restriction of Liberty’ being useful, while three participants completely or partly disagreed. Reasons for participants disagreeing with the usefulness of ‘Restriction of Liberty’ was having an inappropriate naming, not being specific enough, or referring to an unsuitable part of the tweet: ‘Exactly, and in this case I would even say that if this is recognised as a restriction of freedom, then someone would have to look at the algorithm again’ (P15). For ‘Science Denialism’, some participants referred to this indicator as being the most useful for assessing tweets, while other participants did not agree and stated that it was not useful at all, mostly because they rated the referred part of the tweet as not suitable.
Building on our findings of Step 2, we kept topical indicators very general instead of naming specific conspiracy theories. With a few exceptions, this approach was rated as positive by our participants. As we included a study part where participants were asked to explain in detail how they assessed the tweets' credibility before showing our indicators, we found that many participants autonomously referred to their prior knowledge on a specific topic as central, not yet naming ‘Science Denialism’ or the ‘Restriction of Liberty’ specifically as own criteria. However, when having seen the topical indicators in a previous tweet, participants referred to them autonomously in subsequent tweets, often embedded as part of their prior knowledge on the topic. While we did not aim to quantitatively evaluate efficacy (e.g. to reduce the sharing of misleading information), this indicates a tendency towards a potential learning effect for this short-time situation. Indeed, this tendency for applying indicators to novel content is repeated for other indicators as well.
4.3.2. Comprehensibility and usefulness of formal indicators
The overall comprehensibility and perceived usefulness of formal indicators was rather positive with a few exceptions and limitations. All but one participant rated the comprehensibility of ‘Emotional Emojis’ very high and were easily able to explain what this indicator refers to for both tweets it occurred in. Similarly, the usefulness was overall rated very positively with few exceptions, emphasising the unprofessional character of using highly emotion evoking emojis within a tweet. It is noticeable that participants find this indicator particularly helpful when there are a lot of emojis in the tweet and do not only pay attention to whether the emoji is particularly emotional (e.g. red siren or screaming emoji).
For ‘Capitalization’, all participants were fully able to explain what this indicator stands for, emphasising a high level of comprehensibility. The vast majority further fully agreed or tended to agree that it is useful to assess the credibility of a tweet.
Exactly, I think that's a good hint. […] Because capitalisation on the Internet is easy to put with shouting in real life. And who must shout, however, in the discussion, has simply no arguments. And so that's simply an exclusion criterion for me when someone writes like that. (P12)
When evaluating the indicator ‘Punctuation’ we found that the majority of participants again were able to understand what it means and why excessive punctuation (e.g. ‘!!!’) might indicate misleading information. However, some criticised that this may include wrong punctuation as well (e.g. missing commas in a sentence) and emphasised that this can easily be found in non-misleading tweets as well, as not everyone is capable of writing correctly. Again, ‘Incorrect spelling’ was easily comprehensible as an indicator, as all participants were fully able to explain what it means and what it refers to. However, there were mixed results regarding its usefulness, as seven participants for tweet 5 and five participants for tweet 3 fully or partly disagreed with it being a useful indicator to assess a tweet's credibility. Some highlighted the relevance of non-native speakers when considering spelling and punctuation or:
I wouldn't want to reconcile the content with the spelling. So the credibility doesn't get better because somebody has better spelling. So that would be a fallacy for me. So I can also believe a person who has a worse spelling. (P4)
While the previous indicators were overall very comprehensible without further explanation, ‘Hashtags’ and ‘Links’ were often not immediately self-explanatory. Many participants were unsure if it highlighted all ‘Links’ and ‘Hashtags’ within a tweet regardless of their content or quality or if it highlighted only suspicious ‘Links’ and ‘Hashtags’. As links to credible sources can be a highly relevant indicator of reliable content, it is crucial to more clearly nudge users to take a closer look at the link's quality and not make the mere appearance of links look suspicious. The same applies to hashtags. Still, the overall concept was rated rather positively and participants were able to understand and explain its meaning as an indicator easily after having seen an example in a previous tweet.
4.3.3. Comprehensibility and usefulness of rhetorical indicators
We were particularly interested in rhetorical indicators, as these were identified as highly relevant from existing literature and confirmed by us in Step 1, but were not consciously attended to at all by participants in Step 2. When taking a closer look at ‘Negative Phrases’, our findings reveal a high comprehensibility. For instance, all participants were fully able to explain what this indicator means in tweets 8 and 9, and only two participants slightly struggled to explain it within the other tweets. The usefulness of ‘Negative Phrases’ as an indicator to assess a tweet's credibility was perceived as high as well for 10 to 19 participants. Participants further noted, however, that this depends on the context of the actual tweet, leaving two to six participants rather critical.
Yeah, that is one of the biggest problems here. That that was a strong, strong indicator. […] Again, it's very emotional. It's designed to get people to react without thinking because of the instant negative associations and the negative impression that it gives, and yeah, it strongly suggests that this is designed to play on people's prejudices rather than make a serious and considered contribution to any genuine debate. (P17)
Interestingly, participants paid close attention to whether indicators such as ‘Negative Phrases’ occurred within a quote in a tweet. They clearly emphasised that these indicators were not valid to assess a tweet's credibility, as long as this was the case.
Similarly, this is the case for ‘Rhetorical Questions’ as well. Again, while the overall comprehensibility was very high (all participants but one were able to explain the meaning and purpose of the indicator correctly), five participants explicitly claimed low usefulness because the ‘Rhetorical Questions’ were part of a quote. Despite that fact, a majority still rated the usefulness of the indicator high or very high.
And as that comes up more, I see more and more what exactly the algorithm is referring to […]. That sense of, oh, yeah, it's obviously this. […] Because there's no serious question, there's no serious answer, and people are left to speculate and come up with more and more and more opinions of their own that have very little basis in fact. So yes, that is indeed a sensible thing to look for as an indicator. (P17)
For ‘Exaggeration’ as a potential indicator, our findings reveal similarly high comprehensibility with all participants, without exception, being able to correctly explain what it means in the specific tweets. Again, the perceived usefulness was high, as all but three participants agreed or fully agreed that exaggeration represents a useful indicator to assess a tweet's credibility. The same positive feedback applies to ‘Relativization’ and ‘Absolute Truth’: ‘So I would rank it more important than, for example, punctuation or capitalisation. So the claim to absolute truth is always a bigger red flag for me’ (P13).
4.3.4. Inter-individual differences
To assess differences in age, we created a sub-group of participants under 30 years old (N = 10) and at least 50 years old (N = 2). While this number of participants does not allow statistical conclusions, it revealed some tendencies of differences regarding the comprehensibility and usefulness of certain indicators that would we worth taking a closer look at in future studies. For example, while all younger participants considered ‘Hashtags’ at least rather comprehensible from the beginning, both older participants did not consider it comprehensible from the beginning.
To assess differences in education, we created a sub-group of participants with low (N = 5) and high education (N = 10). For example, slight differences in the comprehensibility of the indicator ‘Restriction of Liberty’ were visible in tweet 1: while this indicator was absolutely comprehensible for all higher educated participants (10 out of 10), it was only rather comprehensible for two out of five lower educated participants. Interestingly, there were no clear differences in the overall assessment of the comprehensibility of the approach. Both education groups considered the approach to be similarly understandable (at least fairly understandable: nine out of ten in the higher education group, six out of six in the lower education group). The usefulness was also seen as rather useful by eight out of ten in the high education group and six out of six in the low education group.
To assess differences in political orientation (measured on an eleven-point left-right scale), we created a sub-group of participants with a self-reported strong left political orientation (1 or 2, N = 6) and a center political orientation (5, 6, 7, N = 5). Overall, there was little difference in views on the comprehensibility and usefulness of the different indicators. Regarding ‘Science Denialism’, three out of five participants found the indicator itself useful but did not consider the example in tweet 2 to be appropriate for this category. No one in the centrist group held this view. Thus, the left-leaning group seemed to have a stricter understanding of what they would consider science denialism. Regarding the ‘Incorrect Spelling Grammar’ in tweet 5, four out of five left-leaning participants did not consider it a useful indicator, while only three out of eight in the middle group did not consider it a useful indicator. The overall ratings of comprehensibility and usefulness did not differ between the two groups.
Apart from demographic characteristics and the resulting differences and similarities in the assessment of comprehensibility and usefulness, we further evaluated differences among participants with diverse attitudes towards COVID-19 and the Russian war against Ukraine, revealing findings on particularly skeptical participants (e.g. because of partly conspiracy-theoretical views). Therefore, we compared those (N = 3 and N = 1) participants who did not agree with COVID-19 measures being useful or Russia waging a war of aggression against Ukraine (among which was one participant who disagreed with both statements) with the majority that fully or partly agreed (N = 20 and N = 22). It is not surprising that the participant with general skepticism towards both topics often assessed misleading tweets as rather credible as those address content that fits their own worldview.
And it is also true that there are Nazis in Ukraine. Only they are covered up by the news. […] That's why I find that somewhere, that it's just being covered up for the German news, but only states that Russia, Russia, Russia is evil. But it is never shown what Ukraine is actually doing. (P19)
Further, the participant, in general, assesses the majority of individual indicators as not useful and states that they do not help assess the tweet's credibility at all. Instead, the participant states to use their own knowledge on the topic and does not want to receive any additional input from the intervention. Surprisingly, when asked about the general comprehensibility and usefulness of the approach, the participant assesses it as rather comprehensible and useful. Upon further inquiry, it becomes clear that the participant would have liked more explanation of the approach. While these participants' answers revealed rather entrenched views, some of which are influenced by conspiracy theories, resulting in a tendency to reject the proposed intervention, the other participants with skepticism towards COVID-19 measures did not reveal similar tendencies. In summary, our findings qualitatively show strong limitations of even a relatively less patronising intervention when aiming to address people with opposite views in relation to official fact-checking results.
4.3.5. Comprehensibility and usefulness of the overall indicator-based approach
In addition to the individual indicator types, we were interested in how participants rated the overall approach of displaying indicators next to tweets that have previously been identified as misleading. The overall comprehensibility of the approach was rated as (very) high by 18 participants and rather low by one participant, leaving the rest for undecided ratings. Similarly, the overall perceived usefulness was rated as (very) high by 19 participants and rather low by one participant. A number of interesting criticisms and suggestions for improvement of the approach emerged, for instance, regarding more detailed display of information, improvements of the actual naming of indicators, habituation effects, and resulting neglect of other indicators in the tweet. One participant explicitly pointed out the risk that highlighting problematic parts of tweets will draw attention to them all the more and that this content could be remembered accordingly. Exemplary quotes of these key aspects can be found in the following:
So in principle, I think it makes sense, but I think it's sometimes too abbreviated to know what it means. […] (P1)
The only thing that could be criticised is if certain pre-selections are made, that could perhaps influence the user, because […] then some people can only focus on what is displayed and then they might ignore the rest. (P9)
There should be, I think, if then a little bit of work on the terms, what might be meant by that. What I just said, ‘claim to absolute truth’, is a bit vague, I would say. My problem is always with science that everything is extremely, I say, vaguely expressed. No normal user can understand what is actually meant. (P18)
I think that this will be very clear for most people. I could imagine that it might help to maybe display a little question mark as a popup, […] a kind of button that explains exactly what it is about […] (P20)
And for me, for example, colored highlighting does not go far enough. Or even runs the risk of reproducing it. But then it also emphasises that. (P15)
While the quantitative effectiveness (e.g. to reduce sharing of misleading information) has been investigated by other research (Bak-Coleman et al. Citation2022), our findings reveal some further mostly qualitative outlooks on expected effects of the indicator-based approach. Specifically, we assessed how credibility ratings changed after participants were confronted with the indicators. Indeed, for all nine tweets, there were changes in credibility rating for the better. For instance, four participants changed their rating for tweet 5 from (rather) credible to not credible after being confronted with the indicators. The most common effect, however, was reinforcing the pre-exposure presumption that a tweet is likely misleading and thus reducing uncertainty.
To sum up our key findings (see also ) regarding the comprehensibility and perceived usefulness of our topical, formal, and rhetorical indicators, our findings reveal an overall surprisingly high comprehensibility of potential indicators for misleading tweets and mixed but rather positive perceived usefulness to assess a tweet's credibility. However, to further improve the comprehensibility and usefulness of the approach, working on the actual terms of indicators was suggested by some participants, for instance, by using more specific terms than ‘Restriction of Liberty’ (e.g. P12). Further, especially incorrect spelling and punctuation received some criticism as it is a common way of writing more informally on Twitter and, for instance, non-native speakers may be more prone to making spelling and punctuation mistakes while still creating reliable content. Most of that criticism was relativised when participants reflected on the previous step of pre-filtering misleading information manually or automatically and indicators being only applied to tweets that have already been detected as probably misleading based on other characteristics than our indicators. Overall, participants learned to apply and autonomously name indicators after a while when being confronted with novel tweets. While this is a positive tendency towards a potential learning effect, this was true for true contents as well, where participants looked for indicators and expected the tweet to be false when a reliable tweet contained, for example, a rhetorical question (see tweet 4) -- an implication to be thoroughly addressed in subsequent studies on this approach. When comparing the results on topical, formal, and rhetorical indicators, there is a tendency for topical and rhetorical indicators to be assessed as slightly more useful. Our qualitative findings reveal that especially ‘Spelling’, ‘Punctuation’, and ‘Hashtags’ were evaluated less useful in comparison to all other indicators.
Table 2. Key findings regarding the comprehensibility and perceived usefulness of content-based indicators (Step 3).
Some participants pointed out our concrete steps to further improve the indicator-based approach. For example, some proposed mouse-over effects or pop-ups provide more information and sources for the indicators to increase their usefulness. While this study contributes to the general foundation of indicator-based and user-centered interventions to combat misleading information, other studies in human-computer interaction focus on user interface design and how to display relevant information without information overload for end users. Follow-up studies may consider our participant's suggestions for the user interface design to assess the approach under more realistic conditions (e.g. a click-dummy), complementing existing studies (e.g.Bhuiyan, Whitley, et al. Citation2021; Martino et al. Citation2020) and evaluating the efficacy of indicator-based interventions as a central condition.
5. Discussion
In this study, we evaluated the comprehensibility and usefulness of indicators to guide users in dealing with misleading information in crises. Investigating German tweets related to COVID-19, we identified misleading as well as non-misleading content. We conducted a content analysis, which entailed a manual coding process, aiming at grasping the diversity of misleading tweets. Based on our sample, we could examine frequencies and co-occurrences among different types of characteristics. Further, we weighted our findings of topical, formal, and rhetorical indicators against the results of an online survey from a user perspective. Building on those findings, we finally assessed the perceived comprehensibility and usefulness of the identified indicators within a qualitative think-aloud study with participants from diverse backgrounds, extending the crisis context of tweets to the Russian war against Ukraine. This allowed for the derivation of user-centric indicators as an important step to facilitate the design of technology interventions as countermeasures against misleading information after (automatic or manual) detection that preserves user agency.
5.1. RQ1: What are topical, formal, and rhetorical characteristics of misleading tweets in crises, with the COVID-19 pandemic serving as an example?
Our study reveals a variety of topics of science denialism and classic conspiracy theories (Hansson Citation2017), partly adapted to the new context of the COVID-19 pandemic, to be found in misleading tweets. Further, a combination of formal and rhetorical indicators such as ‘Capitalization’, ‘Exaggeration’, ‘Negative Phrases’ is proposed as the best-fitting model for misleading tweets in a balanced sample and adapts to prior work. We also found that misleading tweets in the COVID-19 context tend to contain co-occurrences of multiple conspiracy theories in a single tweet. Allowing for a transnational discourse, our findings reveal several similarities to studies from a U.S. perspective (e.g. Horne and Adali Citation2017) with a potential to generalise indicators to the global pandemic or other crises, while other characteristics are specific to the COVID-19 context in Germany (see , esp. ‘Sovereignty Germany’).
5.2. RQ2: Which indicators are used autonomously to assess the credibility of tweets?
We also follow existing research (e.g. Martino et al. Citation2020; Schmid et al. Citation2022) in our interest of encouraging media literacy by giving comprehensible indicators in contrast to many current countermeasures that tend to label or delete content without offering a clear explanation. Thus, we contribute to subsequent countermeasures against misleading information after successful detection. In our survey, we investigated which content-specific indicators are already being used autonomously. It might thus be beneficial to also display these indicators to the user in addition. Autonomous assessment strategies have been partly investigated in other research, for example regarding adolescents assessing TikTok videos (Hartwig et al. Citation2024) or adults assessing different types of content including text, images, and videos (Sherman, Stokes, and Redmiles Citation2021), revealing capabilities to identify complex but well-known indicators (e.g. lighting in AI-manipulated videos or the source of information) while neglecting others (e.g. emotional sounds). We observed a similar diverging applicability of indicators in our study. Participants focused on simple and easily visible indicators, such as the presence or absence of references, in their assessment of presented tweets. Less explicit indicators, such as rhetorical indicators, were not considered specifically. More sophisticated information, for instance, regarding rhetorical indicators, was not considered thoroughly. Hence, for our final think-aloud study, we specifically included rhetorical indicators to examine whether and how they can be rendered more tangible to end users.
5.3. RQ3: What comprehensible and useful content-specific indicators can be derived with regard to the design of digital artifacts assisting users on social media in dealing with misleading tweets during crises?
We evaluated the comprehensibility and perceived usefulness of topical, formal, and rhetorical indicators within the contexts of COVID-19 and the Russian war against Ukraine. In our context, those factors are thought to be crucial in increasing trust (Bhuiyan, Whitley, et al. Citation2021). Our findings suggest focusing on easily visible indicators (e.g. ‘Capitalization’) and expanding future research on how to make more complex indicators (Rubin and Lukoianova Citation2015) accessible to end users. Interestingly, when confronted with rather complex indicators (e.g. ‘Absolute Truth’ or ‘Rhetorical Question’), the majority of participants from different educational backgrounds were able to comprehend its meaning and positively evaluated the usefulness of our proposed indicators to assess tweets' credibility. When comparing the assessments of indicators, our qualitative findings reveal that especially spelling, punctuation, and hashtags were evaluated as less useful. Our participants emphasised the limitation of spelling and punctuation as indicators, as these also commonly occur with non-native speakers and people with dyslexia (see Section 4.3.2). This complements suggestions by Plotnick et al. (Citation2019) to look into how indicators such as grammar can still be used to assess credibility during crises when time for content creation is limited. Some participants emphasised that to make the media literacy approach accessible to a wider group of users, it may be necessary to make indicators as guidance more comprehensible in general. This may imply personalising digital misinformation interventions to pick up on different levels of media literacy. The specific indicators identified in Study 1 in the COVID-19 context could be readily applied to the additional crisis context of the Russian war of aggression against Ukraine. These more generic indicators instead of very specific ones (see Level 1 vs. Level 3) were motivated by study 2, in which the preference for more generic indicators slightly stood out, revealing the potential to apply our findings to other (crises) contexts.
While an indicator-based approach, in contrast to giving credibility labels without any explanations, may already counter reactance, it still comes with several limitations regarding rationality and potential biases (Boyd Citation2017; Grandhi, Plotnick, and Hiltz Citation2021). Consistent with the understanding of Diaz Ruiz and Nilsson (Citation2023) that general belief systems and susceptibility to disinformation are intertwined, our qualitative results emphasise that users who have already formed a firm opinion on a particular topic and are, for example, in a bubble that tends to be based on conspiracy theories and can only be reached to a limited extent even with this less patronising intervention. Nevertheless, while those participants were generally very critical of single indicators, they nevertheless assessed the overall comprehensibility and usefulness of the approach rather positively. This positive assessment is consistent with other studies encompassing indicators and their potential to enhance media literacy (Hartwig et al. Citation2024; Bhuiyan, Whitley, et al. Citation2021; Kirchner and Reuter Citation2020). There is a tendency that such an approach, when giving more explanations, is perceived positively, but with the attitude: ‘Not for me, rather for others’. This is in line with findings of other indicator-based research on misleading information and reflects some extent of overconfidence in end users that has already been investigated (Hartwig et al. Citation2024; Bulger and Davison Citation2018; Nygren and Guath Citation2019).
With this work, we contribute to the design of successful countermeasures against misleading information on social media, considering a user's perspective after detection. Our study further proposes the following implications based on the analysis:
5.4. Implications for user-oriented assistance in dealing with misleading information
In light of our findings, we derived four implications that give orientation in the design process of user-oriented platform-mediated measures against misleading information in the context of public crises. The implications were derived by synthesising the findings from Steps 1, 2, and 3, triangulating insights from our quantitative Twitter analysis, online survey on autonomous assessment strategies, and the user-centered evaluation of indicators' perceived comprehensibility and usefulness.
(1) Consider comprehensive indicator-based interventions to address the need for transparency.The perspectives from our German context in Steps 2 and 3 suggest that users benefit from a comprehensive indicator-based misinformation intervention during crises, revealing an overall very positive assessment of the indicator-based approach. Out of 23 participants, 19 rated its usefulness (very) high, specifically naming its transparency as a reason. In addition, we observed first insights into changes in credibility ratings for the better (e.g. four changes from (rather) credible to not credible for tweet 5). Indeed, research (Kirchner and Reuter Citation2020) revealed that users prefer transparent countermeasures over binary labeling or deleting without explanations. Providing users with comprehensible indicators implying why a specific content was identified as potentially misleading, is considered a promising approach to avoid the counterproductive socio-psychological effect of reactance and backfire effects (Hartwig and Reuter Citation2019; Nyhan and Reifler Citation2010). Indicator-based interventions should be designed to comprise a variety of levels. In this study, we demonstrated how content-specific indicators on a topical, formal, and rhetorical level can be derived and evaluated in terms of user-centered applicability, leaving opportunities for future work on additional levels (e.g. creator profile, interactions) as related work has already been partly addressed. Our findings expand existing research on indicators that focus on the U.S. context (Zhang et al. Citation2018) and address the need for a stronger user perspective (Gui et al. Citation2017; Kirchner and Reuter Citation2020). While other approaches, such as Di Domenico, Nunan, and Pitardi (Citation2022) have attempted to identify the rationale behind why people are susceptible to believe disinformation and related legitimisation strategies, we claim that our approach is also capable of addressing those dimensions indirectly through a set of appropriate indicators. For instance, cognitive legitimacy could be addressed through topical indicators that reveal narratives of conspiratorial world views. However, we emphasise that the indicators identified here may not fully represent all of these dimensions.
(2) Keep indicators rather general and simple by default.Our findings suggest that users rather identify common buzzwords and umbrella terms as indicators than consider more complex or specified characteristics (e.g. OS13:02; OS02:05; OS02:06). To avoid information overload and foster productive processes of sense-making (Huang et al. Citation2015; Starbird, Arif, and Wilson Citation2019), it is crucial for user-centered approaches to balance between the benefits of highlighting only general indicators (e.g. ‘conspiracy theory’) for simplicity versus enhancing transparency and trust by highlighting more detailed indicators (e.g. ‘Free Mason’). While offering rather simple indicators is desirable, whitebox-based assisting tools may benefit from an optional feature of giving detailed indicators for personalisation, which is also in line with prior findings (Hartwig and Reuter Citation2019). Nevertheless, we believe that it is still worthwhile to develop new strategies to encourage users to reflect on more complex implications such as underlying legitimisation strategies (Di Domenico, Nunan, and Pitardi Citation2022) and rhetorical tactics (Diaz Ruiz and Nilsson Citation2023) to promote media literacy. This is supported by our findings, which show that easily identifiable features such as links or references to sources may, as already indicated by Di Domenico, Nunan, and Pitardi (Citation2022), influence user perception of disseminated information.
(3) Focus on visible indicators.When investigating characteristics of misleading tweets regarding suitable indicators to assist users, visibility is a central factor for comprehensibility. Sophisticated approaches for feature detection, for instance, using network analyses (Shu et al. Citation2017), often come with a good detection accuracy; yet, respective indicators may often not be suitable as they are not understandable for the end user at first glance, when looking at a tweet. Our findings imply that users may not want to invest too much time when assessing content and prefer to quickly evaluate based on obvious indicators such as topics (‘#DeepState’; e.g. OS02:08) and formal indicators (lack of/excessive punctuation; e.g. OS02:10). Thus, we consider it a valid approach to highlight comprehensible indicators to the end user which are immediately visible when looking at a misleading tweet and do not require additional investigations like looking at a user's Twitter bio or understanding their network.
(4) Allow for personalisation in indicator-based interventions. Our research emphasises how demographic factors, such as age and education, and individual attitudes, including COVID-19 skepticism, impact user responses to indicators. To accommodate these diverse user profiles, future user-oriented assistance should be adaptable and flexible. Especially when considering the findings on general comprehensibility and perceived usefulness of our approach in Step 3, participants emphasised a diverse need and requirement for additional information and explanation. We specifically aimed to include a diverse group of participants from different sociodemographic backgrounds to reveal differences regarding comprehensibility and perceived usefulness (see Section 4.3.4). While some prefer very simple and general indicators, others criticised vague expressions (P18) and preferred more detailed explanations and more specific expressions. In addition, the comprehensibility and perceived usefulness of the indicators partly varied to some extent between demographic groups according to age, education, and political orientation (e.g. two out of five lower educated participants did not fully comprehend ‘Restriction of Liberty’ while all ten higher educated participants fully comprehended it). Personalization of indicator-based interventions that allow for different levels of assistance may address that challenge. Indeed, personalisation and tailored interventions have already been proven to be promising with regard to susceptibility according to personality types (Schoenmueller, Blanchard, and Johar Citation2023) and in other contexts such as cybersecurity (e.g. Egelman and Peer Citation2015) to encourage compliance. Especially considering that the context of misleading information has a great potential for reactance and rejection due to opposing (political) attitudes, media literacy education measures with little perceived paternalism are desirable and could contribute to effectiveness. While our findings suggest the benefits of personalisation, it comes with additional efforts. In particular, while some user differences or preferences can be covered by a simple configuration (e.g. the binary selection of a detailed or basic version of intervention regarding indicators), others, such as (educational) background or political orientation, cannot easily be covered while considering privacy needs. Thus, its feasibility and potential are still to be investigated in future research.
5.5. Limitations and future work
Our work provides valid insights into the field of HCI and particularly into misleading information on Twitter during a long-term global crisis. However, our study comes with some limitations.
First, we did not include account characteristics such as registration date, number of followers, retweets, or users' age. These are potential indicators for misleading information as well, which becomes clear when looking at Twitter bios containing QAnon references. Yet, we explicitly decided to focus on the content of tweets as one very central and immediately visible component. Concentrating on immediately visible components that do not require visiting an author's profile facilitates the capability to reflect on tweets' accuracy while in a common user scenario on Twitter (e.g. solely scrolling through the timeline after following a hashtag during a crisis). This may, of course, be complemented by nonetheless relevant account information and tweet reactions. Their applicability as easily comprehensible user-centered indicators is still to be evaluated in future studies.
Second, identified indicators for misleading information cannot be generalised easily. While our study shows that indicative features may be apparent to varying extents, overall low frequencies regarding non-misleading content suggest indicators to be plausible. Topical indicators (e.g. ‘Media Criticism’) may be applicable to other situations, and indicators specific to the COVID-19 pandemic (e.g. Wuhan Virus) may be reformulated more abstractly (e.g. as source, responsible actor). Indeed, in our think-aloud study in Step 3, we included several tweets on the Russian war against Ukraine and found that the applied indicators were assessed as useful in that context as well. Still, the sample size of our studies does not allow for a definitive generalisation to other crises and contexts, suggesting further (long-term) studies with multiple cases and bigger sample sizes as a valuable next step. It is important to notice that both contexts tend to have a polarising effect on opinions and often come with entrenched opinions. This, of course, may have had an effect on our user study results. Comparing our sample to interactions in non-disruptive situations allows us to gain detailed insights into the indicators' respective prevalence. Due to the clear focus on German-language tweets, we want to provide an analysis that would allow cross-country comparisons as previous research on misleading information during the COVID-19 pandemic demonstrates a clear focus on the U.S. Connecting to international comparisons of social media discourses, it would prove useful to study thematic ‘spillovers’ that occur in virtual spaces across linguistic or geographical borders. Recognizing that the COVID-19 pandemic was a global crisis, it is noteworthy that not only specific narratives of misleading information may differ between countries, but also the measures that proved effective in addressing this issue.
Third, we decided to balance our sample between misleading and non-misleading tweets to include enough misleading information for valid assumptions. However, the balanced sample comes with limitations. Hence, it is crucial to stress that the findings were based on a balanced sample and may significantly differ in a real-world relation between misleading and non-misleading tweets.
Fourth, user-centered misinformation interventions, including our indicator-based approach, typically rely on preceding manual or automatic detection of misleading information that successfully pre-filters whether a given piece of information is potentially misleading. This is a highly complex task and has been a central research area for years (Shu et al. Citation2017; Wu and Liu Citation2018), especially within the field of machine learning. Displaying indicators on all tweets per default would result in a non-acceptable number of false positives and is not the aim of this approach. For future work, studies might fully implement and evaluate the combined approach of automatic or manual detection of misleading information and subsequently extracting and displaying indicators within content that has been successfully identified as misleading.
Fifth, while we gained rich qualitative insights regarding the perceived usefulness and comprehensibility of the derived indicators, our work does not constitute a large-scale representative experiment to make conclusions about statistically significant effects. Future studies might apply our findings on user-centered indicators to an online experiment or survey with a larger sample size to allow for comparisons between a control group and experimental groups confronted with the intervention. Related studies typically investigate quantitatively how an intervention affects sharing behaviour of misleading information compared to other interventions or a baseline group without interventions. Based on our study, complementing related research that demonstrates controversial findings on whether transparent information and explanations significantly impact efficacy (Gesser-Edelsburg et al. Citation2018; Martel, Mosleh, and Rand Citation2021), prospective statistical research may build on our insights. The interpretation and comparability of intervention efficacy strongly depend on the research design, and finding a consensus in measurement has been highlighted as central to the development of successful interventions. Future studies might consider existing frameworks for efficacy measurement that have been proposed (Guay et al. Citation2023). Future work might build from our insights by evaluating our derived design implications on a larger scale. For instance, it would be valuable to pick up on a personalised indicator-based approach that considers different requirements and preferences derived in our work (e.g. regarding rather general indicators versus indicators broken down in detail), testing changes in misinformation sharing behaviour under different conditions against each other. Personalization is typically based on a suitable way of user segmentation, sometimes realised using psychometric tests like the General Decison-making Style (Scott and Bruce Citation1995) or personality types (Schoenmueller, Blanchard, and Johar Citation2023) and should rely on a thorough consideration of privacy needs and weighing additional efforts.
6. Conclusion
In this work, we evaluated promising indicators to assist users in dealing with misleading information in crises. Our primary contributions (C) and findings (F) involve an initial (C1) thorough assessment of 2382 German tweets on Twitter (now X) within a realistic crisis setting to extend the knowledge base of our specific context. This examination allowed us to (F1) identify indicators for misleading information that pertained to both topical (e.g. context-specific themes like ‘Restriction of Liberty’), formal (e.g. links and hashtags that occur in similar measure in credible tweets but are a valuable cue for misleading information when users being nudged to take a closer look at their content), and rhetorical levels (e.g. claims to ‘Absolute Truth’). We then (C2) conducted an online survey to explore how users autonomously evaluate a tweet's credibility. Our findings shed light on (F2) a range of indicators that users use independently (e.g. buzzwords like ‘mainstream media’ as a topical indicator), as well as characteristics that they are unaware of (particularly rhetorical indicators of misleading information), revealing the benefit to display them in an assisting tool. Consistently focusing on user-centered design, we (C3) evaluated the perceived comprehensibility and usefulness of our previously identified indicators. We found (F3) that the indicator-based approach is perceived as useful overall within the context of COVID-19 and the Russian war against Ukraine. When presented with tweets, the topical, formal, and rhetorical indicators improve users' perception and evaluation. We gained (F4) positive feedback regarding comprehensibility and perceived usefulness (e.g. for topical indicators when kept rather general, emotional emojis, and capitalisation), but also criticism for others (e.g. ‘Punctuation’ being too excluding for non-native speakers). (F5) Besides opportunities, we also identified challenges and limitations of the indicator-based approach for short-text content. This applies especially to users with general skepticism towards official services or even entrenched conspiracy theory views but also concerns indicators not being valid if within a quote or drawing attention to misleading content, even more so when highlighting specific parts.
Disclosure statement
No potential conflict of interest was reported by the author(s).
Correction Statement
This article was originally published with errors, which have now been corrected in the online version. Please see Correction (https://doi.org/10.1080/0144929X.2024.2379165).
Additional information
Funding
Notes
References
- Ahmed, Wasim, Josep Vidal-Alaball, Joseph Downing, and Francesc López Seguí. 2020. “COVID-19 and the 5G Conspiracy Theory: Social Network Analysis of Twitter Data.” Journal of Medical Internet Research 22 (5): e19458. https://doi.org/10.2196/19458.
- Akbar, Syeda Zainab, Anmol Panda, Divyanshu Kukreti, Azhagu Meena, and Joyojeet Pal. 2021. “Misinformation As a Window Into Prejudice: COVID-19 and the Information Environment in India.” Proceedings of the ACM on Human-Computer Interaction 4 (CSCW3): 1–28. https://doi.org/10.1145/3432948.
- Ardevol-Abreu, A., P. Delponti, and C. Rodriguez-Wanguemert. 2020. “Intentional Or Inadvertent Fake News Sharing? Fact-Checking Warnings and Users' Interaction with Social Media Content.” Profesional de la Informacion 29 (5): 1–13. https://doi.org/10.3145/epi.2020.sep.07.
- Aslett, Kevin, Andrew M. Guess, Richard Bonneau, Jonathan Nagler, and Joshua A. Tucker. 2022. “News Credibility Labels Have Limited Average Effects on News Diet Quality and Fail to Reduce Misperceptions.” Science Advances 8 (18): eabl3844. https://doi.org/10.1126/sciadv.abl3844.
- Aufderheide, Patricia. 1993. A Report of the National Leadership Conference on Media Literacy. Technical Report. Aspen Institute, Washington, DC, US.
- Bak-Coleman, Joseph B., Ian Kennedy, Morgan Wack, Andrew Beers, Joseph S. Schafer, Emma S. Spiro, Kate Starbird, and Jevin D. West. 2022. “Combining Interventions to Reduce the Spread of Viral Misinformation.” Nature Human Behaviour 6 (10): 1372–1380. https://doi.org/10.1038/s41562-022-01388-6.
- Barua, Ranojoy, Rajdeep Maity, Dipankar Minj, Tarang Barua, and Ashish Kumar Layek. 2019. “F-NAD: An Application for Fake News Article Detection Using Machine Learning Techniques.” In 2019 IEEE Bombay Section Signature Conference (IBSSC), 1–6. Mumbai, India: IEEE. https://doi.org/10.1109/IBSSC47189.2019.8973059.
- Bhargava, Puneet, Katie MacDonald, Christie Newton, Hause Lin, and Gordon Pennycook. 2023. “How Effective are TikTok Misinformation Debunking Videos?” Harvard Kennedy School Misinformation Review 4 (2): 1–17. https://doi.org/10.37016/mr-2020-114.
- Bhuiyan, Md Momen, Michael Horning, Sang Won Lee, and Tanushree Mitra. 2021. “NudgeCred: Supporting News Credibility Assessment on Social Media Through Nudges.” Proceedings of the ACM on Human-Computer Interaction 5 (CSCW2): 427:1–427:30. https://doi.org/10.1145/3479571.
- Bhuiyan, Md Momen, Hayden Whitley, Michael Horning, Sang Won Lee, and Tanushree Mitra. 2021. “Designing Transparency Cues in Online News Platforms to Promote Trust: Journalists' & Consumers' Perspectives.” Proceedings of the ACM on Human-Computer Interaction 5 (CSCW2): 395:1–395:31. https://doi.org/10.1145/3479539.
- Bhuiyan, Md Momen, Kexin Zhang, Kelsey Vick, Michael A. Horning, and Tanushree Mitra. 2018. “FeedReflect: A Tool for Nudging Users to Assess News Credibility on Twitter.” In Companion of the 2018 ACM Conference on Computer Supported Cooperative Work and Social Computing (CSCW '18), 205–208. New York, NY: Association for Computing Machinery. https://doi.org/10.1145/3272973.3274056.
- Boyd, Danah. 2017. “Did Media Literacy Backfire?” Journal of Applied Youth Studies 1 (4): 83–89.
- Bulger, Monica, and Patrick Davison. 2018. “The Promises, Challenges, and Futures of Media Literacy.” Journal of Media Literacy Education 10 (1): 1–21. https://doi.org/10.23860/JMLE-2018-10-1-1.
- Burel, Grégoire, Tracie Farrell, Martino Mensio, Prashant Khare, and Harith Alani. 2020. “Co-Spread of Misinformation and Fact-Checking Content During the Covid-19 Pandemic.” In Social Informatics, edited by Samin Aref, Kalina Bontcheva, Marco Braghieri, Frank Dignum, Fosca Giannotti, Francesco Grisolia, and Dino Pedreschi, Vol. 12467, 28–42. Cham: Springer International Publishing. https://doi.org/10.1007/978-3-030-60975-7_3.
- Burnap, Pete, Matthew L. Williams, Luke Sloan, Omer Rana, William Housley, Adam Edwards, Vincent Knight, Rob Procter, and Alex Voss. 2014. “Tweeting the Terror: Modelling the Social Media Reaction to the Woolwich Terrorist Attack.” Social Network Analysis and Mining 4 (1): 206. https://doi.org/10.1007/s13278-014-0206-4.
- Caine, Kelly. 2016. “Local Standards for Sample Size at CHI.” In Proceedings of the 2016 CHI Conference on Human Factors in Computing Systems, 981–992. San Jose, CA: ACM. https://doi.org/10.1145/2858036.2858498.
- Castanho Silva, Bruno, Federico Vegetti, and Levente Littvay. 2017. “The Elite is Up to Something: Exploring the Relation Between Populism and Belief in Conspiracy Theories.” Swiss Political Science Review 23 (4): 423–443. https://doi.org/10.1111/spsr.12270.
- Castillo, Carlos, Marcelo Mendoza, and Barbara Poblete. 2011. “Information Credibility on Twitter.” In Proceedings of the 20th International Conference on World Wide Web, 675–684. Hyderabad, India: ACM. https://doi.org/10.1145/1963405.1963500.
- Coleman, Keith. 2020. Introducing Birdwatch, a Community-Based Approach to Misinformation. Twitter Blog. https://blog.twitter.-com/en_us/topics/product/2021/introducing-birdwatch-acommunity-based-approach-to-misinformation
- Diaz Ruiz, Carlos, and Tomas Nilsson. 2023. “Disinformation and Echo Chambers: How Disinformation Circulates on Social Media Through Identity-Driven Controversies.” Journal of Public Policy & Marketing 42 (1): 18–35. https://doi.org/10.1177/07439156221103852.
- Di Domenico, Giandomenico, Daniel Nunan, and Valentina Pitardi. 2022. “Marketplaces of Misinformation: A Study of How Vaccine Misinformation Is Legitimized on Social Media.” Journal of Public Policy & Marketing 41 (4): 319–335. https://doi.org/10.1177/07439156221103860.
- Domgaard, S., and M. Park. 2021. “Combating Misinformation: The Effects of Infographics in Verifying False Vaccine News.” Health Education Journal 80 (8): 974–986. https://doi.org/10.1177/00178969211038750.
- Economic and Social Research Council. 2020. Choosing What Social Media You Use. https://www.ukri.org/councils/esrc/impact-toolkit-for-economic-and-social-sciences/how-to-use-social-media/choosing-what-social-media-you-use/.
- Egelman, Serge, and Eyal Peer. 2015. “The Myth of the Average User: Improving Privacy and Security Systems through Individualization.” In Proceedings of the 2015 New Security Paradigms Workshop, 16–28. Twente, The Netherlands: ACM.
- Evanega, Sarah, Mark Lynas, Jordan Adams, and Karinne Smolenyak. 2020. Coronavirus Misinformation: Quantifying Sources and Themes in the COVID-19 ‘Infodemic’. Cornell University, NY, USA. Cornell Alliance for Science. https://allianceforscience.org/wp-content/uploads/2020/09/Evanegaet-al-Coronavirus-misinformationFINAL.pdf
- Flick, Uwe. 2014. An Introduction to Qualitative Research. 5 ed. Los Angeles: Sage.
- Fonteyn, Marsha E., Benjamin Kuipers, and Susan J. Grobe. 1993. “A Description of Think Aloud Method and Protocol Analysis.” Qualitative Health Research 3 (4): 430–441. https://doi.org/10.1177/104973239300300403.
- Fuhr, Norbert, Anastasia Giachanou, Gregory Grefenstette, Iryna Gurevych, Andreas Hanselowski, Kalervo Jarvelin, Rosie Jones. 2018. “An Information Nutritional Label for Online Documents.” ACM SIGIR Forum 51 (3): 46–66. https://doi.org/10.1145/3190580.3190588.
- Geeng, Christine, Savanna Yee, and Franziska Roesner. 2020. “Fake News on Facebook and Twitter: Investigating How People (Don't) Investigate.” In Proceedings of the 2020 CHI Conference on Human Factors in Computing Systems, 1–14. Honolulu, HI: ACM. https://doi.org/10.1145/3313831.3376784.
- Gesser-Edelsburg, Anat, Alon Diamant, Rana Hijazi, and Gustavo S. Mesch. 2018. “Correcting Misinformation by Health Organizations During Measles Outbreaks: A Controlled Experiment.” PLoS One 13 (12): e0209505. https://doi.org/10.1371/journal.pone.0209505.
- Giglietto, Fabio, Laura Iannelli, Luca Rossi, and Augusto Valeriani. 2016. “Fakes, News and the Election: A New Taxonomy for the Study of Misleading Information Within the Hybrid Media System.” Current Sociology 10 (1): 40.
- Goggins, Sean, Christopher Mascaro, and Stephanie Mascaro. 2012. “Relief Work after the 2010 Haiti Earthquake: Leadership in an Online Resource Coordination Network.” In Proceedings of the ACM 2012 Conference on Computer Supported Cooperative Work, 57–66. Seattle, WA: ACM.
- Grandhi, Sukeshini, Linda Plotnick, and Starr Roxanne Hiltz. 2021. “By the Crowd and for the Crowd: Perceived Utility and Willingness to Contribute to Trustworthiness Indicators on Social Media.” Proceedings of the ACM on Human-Computer Interaction 5 (GROUP): 218:1–218:24. https://doi.org/10.1145/3463930.
- Guay, Brian, Adam J. Berinsky, Gordon Pennycook, and David Rand. 2023. “How to Think About Whether Misinformation Interventions Work.” Nature Human Behaviour 7 (8): 1231–1233. https://doi.org/10.1038/s41562-023-01667-w.
- Guess, A. M., M. Lerner, B. Lyons, J. M. Montgomery, B. Nyhan, J. Reifler, and N. Sircar. 2020. “A Digital Media Literacy Intervention Increases Discernment Between Mainstream and False News in the United States and India.” Proceedings of the Nationale Academy of Science of the United States of America 117 (27): 15536–15545. https://doi.org/10.1073/pnas.1920498117.
- Gui, Xinning, Yubo Kou, Kathleen H. Pine, and Yunan Chen. 2017. “Managing Uncertainty: Using Social Media for Risk Assessment during a Public Health Crisis.” In Proceedings of the 2017 CHI Conference on Human Factors in Computing Systems, 4520–4533. Denver, CO: ACM. https://doi.org/10.1145/3025453.3025891.
- Haasch, Palmer. 2021. The Latest Twitter Meme Imitates the ‘this Claim Is Disputed’ Label the Platform Has Used on Trump's Tweets. https://www.insider.com/twitter-trump-censorship-this-claim-is-disputed-meme-election-tweets-2020-11.
- Hagen, Loni, Mary Falling, Oleksandr Lisnichenko, AbdelRahim A. Elmadany, Pankti Mehta, Muhammad Abdul-Mageed, Justin Costakis, and Thomas E. Keller. 2019. “Emoji Use in Twitter White Nationalism Communication.” In Conference Companion Publication of the 2019 on Computer Supported Cooperative Work and Social Computing, 201–205. Austin, TX: ACM. https://doi.org/10.1145/3311957.3359495.
- Hameleers, Michael. 2022. “Separating Truth From Lies: Comparing the Effects of News Media Literacy Interventions and Fact-Checkers in Response to Political Misinformation in the US and Netherlands.” Information, Communication & Society 25 (1): 110–126. https://doi.org/10.1080/1369118X.2020.1764603.
- Hansson, Sven Ove. 2017. “Science Denial As a Form of Pseudoscience.” Studies in History and Philosophy of Science Part A 63:39–47. https://doi.org/10.1016/j.shpsa.2017.05.002.
- Haque, Md Mahfuzul, Mohammad Yousuf, Ahmed Shatil Alam, Pratyasha Saha, Syed Ishtiaque Ahmed, and Naeemul Hassan. 2020. “Combating Misinformation in Bangladesh: Roles and Responsibilities As Perceived by Journalists, Fact-checkers, and Users.” Proceedings of the ACM on Human-Computer Interaction 4 (CSCW2): 1–32. https://doi.org/10.1145/3415201.
- Hartwig, Katrin, Frederic Doell, and Christian Reuter. 2023. The Landscape of User-Centered Misinformation Interventions – A Systematic Literature Review. arxiv:2301.06517 [cs].
- Hartwig, Katrin, and Christian Reuter. 2019. “TrustyTweet: An Indicator-Based Browser-Plugin to Assist Users in Dealing with Fake News on Twitter.” In Proceedings of the International Conference on Wirtschaftsinformatik (WI), Vol. 14, 1844–1855. Siegen, Germany: AIS.
- Hartwig, Katrin, Ruslan Sandler, and Christian Reuter. 2024. “Navigating Misinformation in Voice Messages: Identification of User-Centered Features for Digital Interventions.” Risk, Hazards & Crisis in Public Policy 15 (2): 203–33. https://doi.org/10.1002/rhc3.12296.
- Hartwig, Katrin, Biselli Tom, Schneider Franziska, and Reuter Christian. 2024. “‘From Adolescents' Eyes: Assessing an Indicator-Based Intervention to Combat Misinformation on TikTok.” CHI Conference on Human Factors in Computing Systems. Hawaii, USA.
- Hassoun, Amelia, Ian Beacock, Sunny Consolvo, Beth Goldberg, Patrick Gage Kelley, and Daniel M. Russell. 2023. “Practicing Information Sensibility: How Gen Z Engages with Online Information.” In Proceedings of the 2023 CHI Conference on Human Factors in Computing Systems (CHI '23), 1–17. New York, NY: Association for Computing Machinery. https://doi.org/10.1145/3544548.3581328.
- Horne, Benjamin, and Sibel Adali. 2017. “This Just In: Fake News Packs a Lot in Title, Uses Simpler, Repetitive Content in Text Body, More Similar to Satire Than Real News.” In Proceedings of the International AAAI Conference on Web and Social Media, Vol. 11, 759–766. Buffalo, NY: AAAI. https://doi.org/10.1609/icwsm.v11i1.14976.
- Huang, Y. Linlin, Kate Starbird, Mania Orand, Stephanie A. Stanek, and Heather T. Pedersen. 2015. “Connected through Crisis: Emotional Proximity and the Spread of Misinformation Online.” In Proceedings of the 18th ACM Conference on Computer Supported Cooperative Work & Social Computing, 969–980. Vancouver, BC: ACM. https://doi.org/10.1145/2675133.2675202.
- Hubley, Doug. 2019. A Field Guide to Conspiracy-Theory Rhetoric. Blog Post. https://www.bates.edu/news/2019/09/26/stephanie-kelly-romano-guide-to-conspiracy-rhetoric/
- Kahne, Joseph, and Benjamin Bowyer. 2017. “Educating for Democracy in a Partisan Age: Confronting the Challenges of Motivated Reasoning and Misinformation.” American Educational Research Journal54 (1): 3–34. https://doi.org/10.3102/0002831216679817.
- Kirchner, Jan, and Christian Reuter. 2020. “Countering Fake News: A Comparison of Possible Solutions Regarding User Acceptance and Effectiveness.” Proceedings of the ACM on Human-Computer Interaction 4 (CSCW2): 1–27. https://doi.org/10.1145/3415211.
- Martel, C., M. Mosleh, and D. G. Rand. 2021. “You're Definitely Wrong, Maybe: Correction Style Has Minimal Effect on Corrections of Misinformation Online.” Media and Communication 9 (1): 120–133. https://doi.org/10.17645/mac.v9i1.3519.
- Martino, Giovanni Da San, Shaden Shaar, Yifan Zhang, Seunghak Yu, Alberto Barrón-Cedeño, and Preslav Nakov. 2020. “Prta: A System to Support the Analysis of Propaganda Techniques in the News.” In Proceedings of the 58th Annual Meeting of the Association for Computational Linguistics: System Demonstrations, 287–293. Association for Computational Linguistics, Online. arxiv:2005.05854.
- Memon, Shahan Ali, and Kathleen M. Carley. 2020. Characterizing COVID-19 Misinformation Communities Using a Novel Twitter Dataset. arxiv:2008.00791 [cs].
- Mendoza, Marcelo, Barbara Poblete, and Carlos Castillo. 2010. “Twitter under Crisis: Can We Trust What We RT?” In Proceedings of the First Workshop on Social Media Analytics, 71–79. Washington DC: ACM. https://doi.org/10.1145/1964858.1964869.
- Mihailidis, Paul, and Samantha Viotty. 2017. “Spreadable Spectacle in Digital Culture: Civic Expression, Fake News, and the Role of Media Literacies in ‘Post-Fact’ Society.” American Behavioral Scientist 61 (4): 441–454. https://doi.org/10.1177/0002764217701217.
- Molina, Maria D., S. Shyam Sundar, and Thai Le Dongwon Lee. 2021. “‘Fake News’ Is Not Simply False Information: A Concept Explication and Taxonomy of Online Content.” American Behavioral Scientist65 (2): 180–212. https://doi.org/10.1177/0002764219878224.
- Morris, Meredith Ringel, Scott Counts, Asta Roseway, Aaron Hoff, and Julia Schwarz. 2012. “Tweeting is Believing?: Understanding Microblog Credibility Perceptions.” In Proceedings of the ACM 2012 Conference on Computer Supported Cooperative Work, 441–450. Seattle, WA: ACM. https://doi.org/10.1145/2145204.2145274.
- Morstatter, Fred, Yunqiu Shao, Aram Galstyan, and Shanika Karunasekera. 2018. “From Alt-Right to Alt-Rechts: Twitter Analysis of the 2017 German Federal Election.” In Companion of the The Web Conference 2018 on The Web Conference 2018 -- WWW '18, 621–628. Lyon, France: ACM Press. https://doi.org/10.1145/3184558.3188733.
- Müller, Philipp, and Nora Denner. 2019. Was tun gegen Fake News? Eine Analyse anhand der Entstehungsbedingungen und Wirkweisen gezielter Falschmeldungen im Internet : Kurzgutachten im Auftrag der Friedrich-Naumann-Stiftung für die Freiheit. Technical Report, 1–32. Friedrich-Naumann-Stiftung für die Freiheit.
- Nygren, Thomas, and Mona Guath. 2019. “Swedish Teenagers' Difficulties and Abilities to Determine Digital News Credibility.” Nordicom Review 40 (1): 23–42. https://doi.org/10.2478/nor-2019-0002.
- Nyhan, Brendan, and Jason Reifler. 2010. “When Corrections Fail: The Persistence of Political Misperceptions.” Political Behavior 32 (2): 303–330. https://doi.org/10.1007/s11109-010-9112-2.
- Palen, Leysia, and Kenneth M. Anderson. 2016. “Crisis Informatics – New Data for Extraordinary Times.” Science 353 (6296): 224–225. https://doi.org/10.1126/science.aag2579.
- Pennycook, Gordon, Jabin Binnendyk, Christie Newton, and David G. Rand. 2021. “A Practical Guide to Doing Behavioral Research on Fake News and Misinformation.” Collabra: Psychology 7 (1): 25293. https://doi.org/10.1525/collabra.25293.
- Pennycook, Gordon, Ziv Epstein, Mohsen Mosleh, Antonio A. Arechar, Dean Eckles, and David G. Rand. 2021. “Shifting Attention to Accuracy Can Reduce Misinformation Online.” Nature 592 (7855): 590–595. https://doi.org/10.1038/s41586-021-03344-2.
- Plotnick, Linda, Sukeshini Grandhi, Starr Roxanne Hiltz, and Julie Dugdale. 2019. Real or Fake? User Behavior and Attitudes Related to Determining the Veracity of Social Media Posts. https://doi.org/10.48550/arXiv.1904.03989
- Potthast, Martin, Johannes Kiesel, Kevin Reinartz, Janek Bevendorff, and Benno Stein. 2017. A Stylometric Inquiry into Hyperpartisan and Fake News. arxiv:1702.05638 [cs].
- Reuter, Christian, and Marc-André Kaufhold. 2018. “Fifteen Years of Social Media in Emergencies: A Retrospective Review and Future Directions for Crisis Informatics.” Journal of Contingencies and Crisis Management 26 (1): 41–57. https://doi.org/10.1111/1468-5973.12196.
- Rubin, Victoria L., and Tatiana Lukoianova. 2015. “Truth and Deception At the Rhetorical Structure Level.” Journal of the Association for Information Science and Technology 66 (5): 905–917. https://doi.org/10.1002/asi.23216.
- Saaty, Morva, Jaitun V. Patel, Derek Haqq, Timothy L. Stelter, and D. Scott Mccrickard. 2022. Integrating Social Media into the Design Process. https://doi.org/10.48550/arXiv.2205.04315
- Sadeghi, McKenzie, Jack Brewster, and Macrina Wang. 2023. X's Unchecked Propaganda: Engagement Soared by 70% for Russian, Chinese and Iranian Disinformation Sources Following a Change by Elon Musk -- Misinformation Monitor: September 2023.
- Saltz, Emily, Soubhik Barari, Claire Leibowicz, and Claire Wardle. 2021. “Misinformation Interventions Are Common, Divisive, and Poorly Understood.” Harvard Kennedy School Misinformation Review 2 (5): 1–25. https://doi.org/10.37016/mr-2020-81.
- Saltz, Emily, Claire R. Leibowicz, and Claire Wardle. 2021. “Encounters with Visual Misinformation and Labels Across Platforms: An Interview and Diary Study to Inform Ecosystem Approaches to Misinformation Interventions.” In Extended Abstracts of the 2021 CHI Conference on Human Factors in Computing Systems, 1–6. Yokohama, Japan: ACM. https://doi.org/10.1145/3411763.3451807.
- Scardigno, Rosa, and Giuseppe Mininni. 2020. “The Rhetoric Side of Fake News: A New Weapon for Anti-Politics?” World Futures 76 (2): 81–101. https://doi.org/10.1080/02604027.2019.1703158.
- Schmid-Petri, Hannah, Moritz Bürger, Stephan Schlögl, Mara Schwind, Jelena Mitrović, and Ramona Kühn. 2023. “The Multilingual Twitter Discourse on Vaccination in Germany During the Covid-19 Pandemic.” Media and Communication 11 (1): 293–305. https://doi.org/10.17645/mac.v11i1.6058.
- Schmid, Stefka, Katrin Hartwig, Robert Cieslinski, and Christian Reuter. 2022. “Digital Resilience in Dealing with Misinformation on Social Media During COVID-19 A Web Application to Assist Users in Crises.” Information Systems Frontiers 2022:1–23. https://doi.org/10.1007/s10796-022-10347-5.
- Schoenmueller, Verena, Simon J. Blanchard, and Gita V. Johar. 2023. Empowering Fake-News Mitigation: Insights from Sharers' Social Media Post-Histories. arxiv:2203.10560 [cs].
- Scott, Susanne G., and Reginald A. Bruce. 1995. “Decision-Making Style: The Development and Assessment of a New Measure.” Educational and Psychological Measurement 55 (5): 818–831. https://doi.org/10.1177/0013164495055005017.
- Sharma, Karishma, Sungyong Seo, Chuizheng Meng, Sirisha Rambhatla, and Yan Liu. 2020. COVID-19 on Social Media: Analyzing Misinformation in Twitter Conversations. https://doi.org/10.48550/arXiv.2003.12309.
- Sherman, Imani N., Jack W. Stokes, and Elissa M. Redmiles. 2021. “Designing Media Provenance Indicators to Combat Fake Media.” In 24th International Symposium on Research in Attacks, Intrusions and Defenses, 324–339. San Sebastian, Spain: ACM. https://doi.org/10.1145/3471621.3471860.
- Shu, Kai, Amy Sliva, Suhang Wang, Jiliang Tang, and Huan Liu. 2017. “Fake News Detection on Social Media.” ACM SIGKDD Explorations Newsletter 19 (1): 22–36. https://doi.org/10.1145/3137597.3137600.
- Spezzano, Francesca. 2021. “Using Service-Learning in Graduate Curriculum to Address Teenagers' Vulnerability to Web Misinformation.” In Proceedings of the 26th ACM Conference on Innovation and Technology in Computer Science Education V. 2, 637–638. Virtual Event Germany: ACM. https://doi.org/10.1145/3456565.3460039.
- Starbird, Kate. 2012. “Crowd Computation: Organizing Information during Mass Disruption Events.” In Proceedings of the ACM 2012 Conference on Computer Supported Cooperative Work Companion, 339–342. Seattle, WA: ACM. https://doi.org/10.1145/2141512.2141615.
- Starbird, Kate. 2017. “Examining the Alternative Media Ecosystem Through the Production of Alternative Narratives of Mass Shooting Events on Twitter.” Proceedings of the International AAAI Conference on Web and Social Media 11 (1): 230–239. https://doi.org/10.1609/icwsm.v11i1.14878.
- Starbird, Kate, Ahmer Arif, and Tom Wilson. 2019. “Disinformation As Collaborative Work: Surfacing the Participatory Nature of Strategic Information Operations.” Proceedings of the ACM on Human-Computer Interaction 3 (CSCW): 1–26. https://doi.org/10.1145/3359229.
- Steinebach, Martin, Katarina Bader, Lars Rinsdorf, Nicole Krämer, and Alexander Roßnagel, editors. 2020. Desinformation aufdecken und bekämpfen: Interdisziplinäre Ansätze gegen Desinformationskampagnen und für Meinungspluralität. Baden-Baden, Germany: Nomos Verlagsgesellschaft mbH & Co. KG. https://doi.org/10.5771/9783748904816.
- Stoegner, Karin. 2016. “‘We Are the New Jews!’ And ‘The Jewish Lobby’ – Antisemitism and the Construction of a National Identity by the Austrian Freedom Party.” Nations and Nationalism 22 (3): 484–504. https://doi.org/10.1111/nana.12165.
- van der Meer, Toni G. L. A., and Yan Jin. 2020. “Seeking Formula for Misinformation Treatment in Public Health Crises: The Effects of Corrective Information Type and Source.” Health Communication35 (5): 560–575. https://doi.org/10.1080/10410236.2019.1573295.
- van Prooijen, Jan-Willem, and Karen M. Douglas. 2018. “Belief in Conspiracy Theories: Basic Principles of An Emerging Research Domain.” European Journal of Social Psychology 48 (7): 897–908. https://doi.org/10.1002/ejsp.2530.
- Vieweg, Sarah. 2012. “Twitter Communications in Mass Emergency: Contributions to Situational Awareness.” In Proceedings of the ACM 2012 Conference on Computer Supported Cooperative Work Companion, 227–230. Seattle, WA: ACM.
- Wanas, Nayer, Motaz El-Saban, Heba Ashour, and Waleed Ammar. 2008. “Automatic Scoring of Online Discussion Posts.” In Proceedings of the 2nd ACM Workshop on Information Credibility on the Web, 19–26. Napa Valley, CA: ACM. https://doi.org/10.1145/1458527.1458534.
- Webb, Theresa, and Kathryn Martin. 2012. “Evaluation of a Us School-Based Media Literacy Violence Prevention Curriculum on Changes in Knowledge and Critical Thinking Among Adolescents.” Journal of Children and Media 6 (4): 430–449. https://doi.org/10.1080/17482798.2012.724591.
- Wilson, Tom, Kaitlyn Zhou, and Kate Starbird. 2018. “Assembling Strategic Narratives: Information Operations As Collaborative Work Within An Online Community.” Proceedings of the ACM on Human-Computer Interaction 2 (CSCW): 1–26. https://doi.org/10.1145/3274452.
- Wood, Thomas, and Ethan Porter. 2019. “The Elusive Backfire Effect: Mass Attitudes' Steadfast Factual Adherence.” Political Behavior 41 (1): 135–163. https://doi.org/10.1007/s11109-018-9443-y.
- World Health Organization. 2020. Novel Coronavirus(2019-nCoV) Situation Report -- 13. https://www.who.int/docs/default-source/coronaviruse/situation-reports/20200202-sitrep-13-ncov-v3.pdf.
- Wu, Liang, and Huan Liu. 2018. “Tracing Fake-News Footprints: Characterizing Social Media Messages by How They Propagate.” In Proceedings of the Eleventh ACM International Conference on Web Search and Data Mining, 637–645. Marina Del Rey, CA: ACM. https://doi.org/10.1145/3159652.3159677.
- Zeng, Jing, and Chung-hong Chan. 2021. “A Cross-National Diagnosis of Infodemics: Comparing the Topical and Temporal Features of Misinformation Around COVID-19 in China, India, the US, Germany and France.” Online Information Review 45 (4): 709–728. https://doi.org/10.1108/OIR-09-2020-0417.
- Zeng, Li, Kate Starbird, and Emma S. Spiro. 2016. “Rumors at the Speed of Light? Modeling the Rate of Rumor Transmission During Crisis.” In 2016 49th Hawaii International Conference on System Sciences (HICSS), 1969–1978. Hawaii, USA: IEEE Press. https://doi.org/10.1109/HICSS.2016.248.
- Zhang, Amy X., Martin Robbins, Ed Bice, Sandro Hawke, David Karger, An Xiao Mina, Aditya Ranganathan, et al. 2018. “A Structured Response to Misinformation: Defining and Annotating Credibility Indicators in News Articles.” In Companion of the The Web Conference 2018 on The Web Conference 2018 -- WWW '18, 603–612. Lyon, France: ACM Press. https://doi.org/10.1145/3184558.3188731.
Appendix
A.1. Detailed data processing in step 1
We excluded all non-German tweets and eliminated duplicated contents (i.e. retweets).
– Results in 55,600 tweets for the first collection period
– Results in 75,892 tweets for the second period
We generated a random sample as we aimed to include all potential kinds of misleading information, independent of topic and motivation.
Prior to obtaining the final artificially balanced sample, we made sure that a sufficient number of misleading tweets was included. Since the proportion is not naturally balanced, many non-misleading tweets were excluded at this early stage to prevent labeling an unnecessarily large amount. Final decisions on whether a tweet was misleading were made later in the final coding. As the decision to split tweets in a first step is critical for the quality of our final sample, the three researchers involved were introduced to plausible methods for identifying misleading information, including fact-checking pages when necessary. We obtained a sample of 3500 tweets for final coding to produce an approximately balanced proportion.
The thorough introduction, as well as the background in political science, qualified the researchers to label the tweets with the corresponding codes. Despite clearly defined codes, there is, of course, still some room for interpretation, whereby the subjective opinion of the coders could have an influence. To overcome this, the decision for final codes was based on a majority vote after the independent labeling.
Again we checked for the proportion of misleading versus non-misleading information for our analysis.
To gain a balanced proportion, we randomly excluded some non-misleading tweets from the analysis as they were overrepresented after final coding. Hence, our final sample for analysis consisted of 2382 tweets in total, including 50% misleading information such as false information or misleading satire, and 50% tweets that were marked as not misleading. This entails tweets that were labeled as true information, opinions that are not absolute, or satire that is not misleading in the COVID-19 context, both for the sample of the early stage and the second stage of the crisis.
A.2. Think-aloud study: study procedure in step 3
Introduction, informed consent, and online questionnaire for demographic information and attitudes (approximately five minutes):
– [Clarification sheet and declaration on data protection]
– Please specify your age in years. [free-text format]
– Please specify your gender. [female, male, diverse, no answer]
– Please specify your highest level of education attained. [No school-leaving qualification (yet), Secondary school diploma, ‘Realschulabschluss’, (Technical) Baccalaureate, Vocational training, Master craftsman/technician/business economist in accordance with craft regulations, University degree, Doctorate]
– Please indicate your native language. [free-text format]
– Please indicate how often you use social media such as Twitter, Facebook, Instagram, TikTok, etc. [never, less than once a month, 1-2 times a month, weekly, several times a week, daily]
– Please indicate how often you use Twitter. [never, less than once a month, 1-2 times a month, weekly, several times a week, daily]
– Please indicate how strongly you agree with the following statement: ‘I consider the COVID-19 measures to be useful overall’. [do not agree at all, rather disagree, tend to agree, strongly agree]
– Please indicate how strongly you agree with the following statement: ‘The coronavirus (SARS-CoV-2) exists’. [do not agree at all, rather disagree, tend to agree, strongly agree]
– Please indicate how strongly you agree with the following statement: ‘Russia is waging a war of aggression against Ukraine’. [do not agree at all, rather disagree, tend to agree, strongly agree]
– In politics, people sometimes talk about ‘left’ and ‘right’. Where would you place yourself on a scale of 1 to 11, if 1 stands for extreme left and 11 for extreme right? [scale from 1 to 11]
(Repeated for all nine tweets in random order): Presenting the real-world tweet. Instruction to keep thinking aloud.
– Do you know this tweet or a similar tweet on this topic?
– Do you believe the content is important?
– Please rate the credibility of this tweet.
– How exactly do you come to that conclusion?
– If the tweet contained misleading information:
* Participants were given the following statement by the researcher:
Imagine a reliable fact checker (human, organisation or algorithm) has determined that the information is likely to be misleading of false. Also, an algorithm has automatically found the following cues. These are meant to help you understand that the content is not true. We will now go through them one by one. (Indicators and referred parts of the tweet are highlighted with color one by one)
* How do you comprehend the cue?
* How useful is the cue to assess the credibility of the tweet?
* (After all indicators were addressed:) Again, please rate the credibility of the tweet.
– If the tweet contained only true information:
* Participants were given the following statement by the researcher: Imagine a reliable fact checker (human, organisation or algorithm) has determined that the information is likely to be true.
– The researcher gives a final clarification about the truthfulness of the tweet.
After following the procedure for all nine tweets:
– Please summarise your overall impression of the comprehensibility of the approach to highlight indicators for misleading tweets.
– Please summarise your overall impression of the usefulness of the approach to highlight indicators for misleading tweets.
– Does it make a difference if decisions in tweets' credibility were performed by an algorithm or by a fact-checking human/organisation?
Audio and screen recording is stopped.
Figure A1. Overview of the frequency of topical indicators with regard to both misleading (yellow) as well as non-misleading (green) tweets.
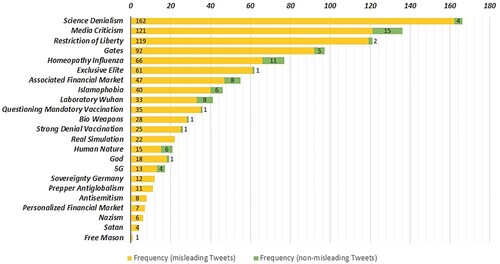
Figure A2. Overview of the frequency of formal indicators according to their categorisation as misleading (yellow) or non-misleading (green).
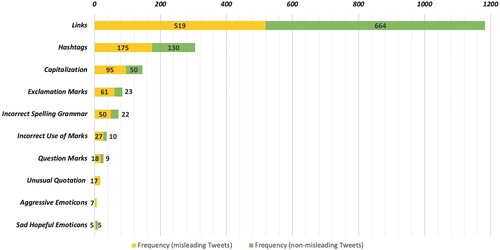
Figure A3. Overview of the frequency of rhetorical characteristics including swear words and strong statements (Negative Phrases) as well as different style-defining means.
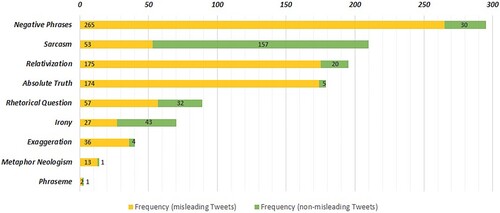
Figure A4. Tweets that we used for our qualitative online survey (Step 2). The contents belong to original tweets on Twitter and were translated from German. Profile pictures and names were replaced.
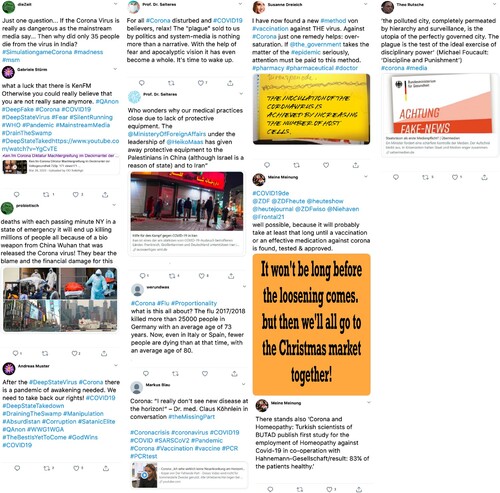
Figure A5. Participants in Step 2 (N = 44) were asked whether they found statements in the form of tweets credible. All tweets but the last one (tweet 12) are categorised as misleading and were edited before showing them to participants. Most times, credibility was perceived as low; yet, some participants saw tweets as opinions (vs. facts) that one may not assess to be true or false while others did not understand the intended meanings, both resulting in NA.
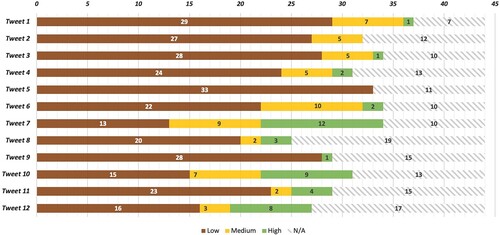
Table A1. Exemplifying misleading tweets to which we referred indirectly in our analysis of Step 1. Not all codes are listed but aim to make our approach more transparent.
Table A2. Overview of links shared within non-misleading tweets (N = 663) and misleading tweets (N = 519). Different types of media were shared, ranging from very a popular video platform (YouTube), traditional media (tagesschau, ZDF), liberal (ZEIT, Spiegel) as well as more conservative (FAZ, Welt) online newspapers.
Table A3. Exemplifying answers of the online survey (Step 2) to which we referred indirectly in our analysis; non-exhaustive overview.