
ABSTRACT
An avatar is one’s figure of representation within the virtual world. The user-avatar bond is suggested to carry information about who/how the person is in their real life. Discrepancies between an individual’s self and avatar perceptions have been associated with disordered gaming and reduced well-being, requiring assessment. Although several instruments purport to measure UAB, there is no targeted user-avatar discrepancy scale. To address this gap, the user-avatar views of 477 gamers aged between 11–21 years old (meanage = 16.39; SD = 1.6) were assessed across 15 dimensions, each defined by a pair of bipolar adjectives (e.g. strong-weak) rated on a seven-point scale. The optimum combination of scale items was concluded via a three-step validation procedure including (i) exploratory factor analysis, (ii) confirmatory factor analysis, and (iii) item response theory analysis. Findings supported a unifactorial user-avatar discrepancy measure composed of eight items, with social-desirability issues involving strength, physical abilities, and emotionality underpinning participants’ responses.
1. Introduction
Avatars serve as the virtual embodiment of a player or the ‘alter-ego’ of the users within the online context. The flexible customisation of avatars accommodates identity expression in the online space and allows users to experiment with the way they introduce themselves in these contexts (Green, Delfabbro, and King Citation2021; Schrader Citation2019; Stavropoulos et al. Citation2019). The relationship between one’s offline and online self, often referred to as the user-avatar bond (UAB), not only carries information about who the user is in offline spaces but has also been found to alter one’s offline behaviour (typically referred to as the ‘Proteus effect’; Green, Delfabbro, and King Citation2021; Rahill and Sebrechts Citation2021; Ratan et al. Citation2020; Schrader Citation2019; Stavropoulos, Ratan, and Lee Citation2022).
The term UAB denotes the psychological attachment that a user forms with their avatar, encompassing dimensions such as identification, where users see themselves in their avatars; immersion, where users prioritise the avatar's virtual needs over their own; and idealization, where the avatar represents an ideal self (Blinka Citation2008; Stavropoulos et al. Citation2020). This bond involves a psychological transmission from the gamer to the avatar, which may resemble or differ from the gamer’s identity, allowing for the projection of unconscious psychological material (Blinka Citation2008).
While the extensive customisation of avatars enables users to explore a wide range of identities within virtual environments, it also gives rise to pronounced discrepancies between a user's real-world self and their virtual persona (Szolin et al. Citation2022). These discrepancies are often shaped by the avatar's ability to project idealised traits that may not align with the user's actual self-perception (Sibilla and Mancini Citation2018). Rooted in psychodynamic theory, the emotional bond between users and their avatars – ranging from identification to compensation – implicitly assumes that these relationships can deeply influence self-concept and behaviour (Blinka Citation2008). However, rather than focusing solely on the nature of this bond, there is a critical need to precisely measure the extent of these discrepancies. This approach acknowledges the established emotional bonds and pushes further to quantify the differential aspects that traditional measures might overlook, thus underscoring the need for a refined assessment tool tailored to capture the nuanced differences between users and their avatars.
1.1. Evaluating current user-Avatar research approaches
Despite extensive research into the UAB, existing tools often fall short of capturing the full spectrum of these complex relationships. Current measures vary widely in their approaches and tend to overlook the nuanced discrepancies between users and their avatars. The measures outlined in present diverse measures for evaluating UAB, capturing its multifaceted nature, underlying theories, and the impact these relationships have on gaming behaviours linked to avatar connection and engagement.
Table 1. Available measures accessing the connection between the user and their avatar.
Given the broad range of empirical and theoretical perspectives on how players attach to or identify with their avatars, it is natural to find a variety of assessment tools, each supported by substantial empirical evidence. For instance, research has characterised UAB through the lens of deep emotional connections (Mancini, Imperato, and Sibilla Citation2019), the integration of a player's identity with their avatar (Green, Delfabbro, and King Citation2020), and the experience of self-presence through the avatar (Burleigh et al. Citation2018). A particularly revealing literature review by Sibilla and Mancini (Citation2018) distinguished four unique user-avatar relationships, noting that across all classifications, avatars often represent an idealised or enhanced version of the player's self. This observation points to the use of avatars as a means for individuals to address unmet needs or to make up for perceived shortcomings in their offline lives. Such findings underscore the psychological complexities underpinning the player-avatar relationship, suggesting that avatars serve not just as digital stand-ins but as vehicles for psychological exploration and compensation.
However, despite the rich conceptual framework surrounding UAB, one area remains notably underexplored, measuring the discrepancy between the user and their avatar. The examination of the gap between the user and their avatar has been a recurring theme in the literature (Sibilla and Mancini Citation2018). This notion revolves around the disparities between individuals’ perceptions of themselves offline and the personas they adopt through their avatars. Indeed, numerous authors have delved into the user-avatar discrepancy, drawing from Higgins's (Citation1987) self-discrepancy theory (SDT). The SDT delineates three domains of the self that coexist with the avatar: the actual self (i.e. the user's perception of themselves in the real world), the ideal self (i.e. who they aspire to be), and the ought self (i.e. how the user feels they should be). Through this theory, SDT argues that users feel distress or discomfort if there is a significant gap or discrepancy between their actual and ideal self, and will be motivated to reach a state where these two versions of the self are aligned (Szolin et al. Citation2022).
When applied to the digital context, it has been proposed that users with low self-esteem or other similar psychosocial dysfunction (e.g. depression, poor social skills, etc.) may attempt to create an avatar that aligns with their ideal self to compensate for perceived deficits presented outside of the game (Lemenager et al. Citation2020; Sibilla and Mancini Citation2018; Szolin et al. Citation2022). In the context of video games, the creation of an avatar as an idealised version of oneself is a widespread practice across diverse gamer populations, not confined to those with psychological vulnerabilities like depression or low self-esteem (Sibilla and Mancini Citation2018). However, significant risks emerge when deep identification and attachment to an avatar occur, which studies have shown to correlate positively with depression and negatively with social skills and self-esteem (You, Kim, and Lee Citation2017). For instance, the degree to which an individual portrays their avatar in a more favourable light compared to their self-perception can signal problematic media use and deteriorating mental health, as users may be avoiding real-life challenges via their avatar life (Mancini and Sibilla Citation2017; Morcos et al. Citation2021; Stavropoulos et al. Citation2020; Szolin et al. Citation2022). Consequently, it has been suggested that individuals who craft an idealised self-inspired avatar to compensate for a negative real-life self may leverage video games as a means to diminish the discrepancy between these two selves (Lemenager et al. Citation2020).
The explanation of such self-avatar view discrepancy risks is twofold: (a) one chooses for their avatar to have socially desirable characteristics or those which reflect their ideal self, thereby compensating or negating the undesirable qualities attributed to their real-life selves (Stavropoulos et al. Citation2020) and; (b) avatars provide a sense of freedom as one can behave in ways that one would not allow themselves in reality due to the absence of real-life constraints (i.e. repression or socio-constructionist approach; Green, Delfabbro, and King Citation2021; Morcos et al. Citation2021; Sibilla and Mancini Citation2018). Interestingly, aligning one's avatar closely with their actual self has been associated with high self-esteem (Sibilla and Mancini Citation2018), robust online social interactions (Gabbiadini et al. Citation2014), and a positive gaming experience in terms of presence and flow (Jin Citation2012). Conversely, having an avatar that is markedly idealised has been linked to problematic gaming (Leménager et al. Citation2013; Van Looy, Courtois, and De Vocht Citation2013). This suggests that creating an avatar that significantly deviates from one's real self to mirror one's aspirations represents an attempt to achieve, within the virtual setting, what is lacking offline. Although such an avatar can initially provide immediate gratification, over time it may exacerbate issues related to well-being through excessive engagement or neglect of real-life responsibilities (Green, Delfabbro, and King Citation2021; Liew et al. Citation2018; Morcos et al. Citation2021). Indeed, research has shown that physical activity, moral behaviours, and empathy can correlate with the extent of user-avatar discrepancy experienced (Stavropoulos, Ratan, and Lee Citation2022).
The current methods employed to assess such differences often rely heavily on SDT or exploring personality traits (Green, Delfabbro, and King Citation2020; Sibilla and Mancini Citation2018; Szolin et al. Citation2022). These approaches commonly utilise questionnaires measured through continuous, self-reported ratings of statements relating to the self, which include adjectives and self-descriptions (Green, Delfabbro, and King Citation2020). Typically, self-discrepancy scores are derived from comparing evaluations of the actual-self (e.g. ‘I am attractive’), ideal-self (e.g. ‘I want to be attractive’), and avatar-self (e.g. ‘my avatar is attractive’). Notably, studies often omit reporting cut-off scores or norms for self-discrepancies or self-concept evaluations (e.g. Kwon, Chung, and Lee Citation2011; Li, Liau, and Khoo Citation2011; Mancini, Imperato, and Sibilla Citation2019; Zhong and Yao Citation2013). While these established methods have yielded significant findings that contribute to our understanding of the impact of the discrepancy between the user and the avatar, there remains ample opportunity for further refinement and improvement in measurement techniques.
First, there is not yet a standardised measure explicitly focusing on user-avatar discrepancies. Assessing the rate and understanding the themes (i.e. main topics) of an individual’s user-avatar discrepancy could be valuable for addressing problematic media use and guiding mental health treatment when required (e.g. prioritising and targeting identified areas of discrepancy to help the person better adjust to their real lives). Beyond serving as a proxy indicator for psychological well-being, such knowledge could offer, otherwise hard to gain, insights into the specific domains where an individual may be encountering difficulties that push them to escape online (e.g. social desirability concerns; Stavropoulos et al. Citation2019; Citation2020; Stavropoulos, Ratan, and Lee Citation2022). Indeed, studies suggest that compensatory behaviours, associated with the user-avatar discrepancy and often driving excessive gaming usage, can extend to areas such as appearances, socialisation, group acceptance, and personality traits (Clark et al. Citation2019; Stavropoulos et al. Citation2019). Understanding what one aims to counterbalance/experience can later be used to inform more effective clinical case formulations and treatment planning for screen addiction cases (i.e. by specifically targeting/prioritising these areas).
Secondly, by creating such a measure, particularly through utilising semantic differentials, it can address the challenges associated with the absence of cut-off scores. A semantic differential scale intends to assess how strongly a person holds an attitude by rating bipolar adjectives or phrases (e.g. easy to difficult). Assessing user-avatar discrepancy via semantic analysis may offer a more comprehensive understanding of individuals’ perceptions of themselves and their avatars within the digital environment. By examining the key phrases identified within the literature to assess how they describe their avatars compared to themselves, researchers can discern subtle shifts in self-perception and identify areas of discrepancy. Therefore, semantic differentials may provide insights into the psychological processes underlying avatar creation and identification, capturing nuances that may not be evident through traditional self-report measures alone (e.g. Likert scales).
Furthermore, establishing clear benchmarks through the development of a standardised measure enables researchers to objectively determine whether an individual's level of user-avatar discrepancy falls within a normal or problematic range. Given that the literature has described both positive and negative consequences from one’s discrepancy between themselves and one's avatar, identifying clear cut-off scores through advanced analyses, such as Item Response Theory, would be beneficial. Additionally, this would facilitate consistent interpretation of results across different settings and practitioners, enhancing the reliability and validity of assessments. With defined criteria for identifying individuals at risk or in need of intervention, early detection of potential issues becomes possible, allowing for timely support and treatment. Moreover, a standardised measure based on semantic differences facilitates the comparison of findings across studies and populations. Researchers can draw meaningful conclusions and generalise results more effectively, contributing to a deeper understanding of the impacts of user-avatar discrepancy on gaming behaviour and mental well-being.
Lastly, leveraging the user-avatar related behavioural effects could inform the development of cost-effective, gamified e-health applications, also known as serious games (Stavropoulos, Ratan, and Lee Citation2022). In particular, the tendency to identify, embody, and idealise one’s avatar has been suggested to enhance the effectiveness of health and cyber-education gamified applications and support physical and mental health (Peña, Li, and Ratan Citation2020; Pimentel and Kalyanaraman Citation2020; Stavropoulos, Ratan, and Lee Citation2022). For instance, users have been demonstrated to engage in more frequent exercise or develop more favourable attitudes towards physical activity, when they use avatars that portray a healthy weight in exercise games, as opposed to avatars that depict overweight or unhealthy appearances (e.g. Peña and Kim Citation2014; Peña, Khan, and Alexopoulos Citation2016; Rheu et al. Citation2022). Pimentel and Kalyanaraman (Citation2020) also showed how avatar related effects can reduce distress. They instructed individuals to create an avatar representing their internal experience of anxiety resulting in a three-dimensional figure. They assumed that creating a self-congruent avatar would lead to an increased sense of control and subsequent positive outcomes depending on how users would treat it. Indeed, those who chose to destroy their avatar reported a significant reduction in anxiety. Such effects are assumed to derive from the fact that a proportion of users tend to consciously or unconsciously generate avatars representing, at least to an extent, healthy or unhealthy versions/projections of themselves (Clark et al. Citation2019; Kim and Sundar Citation2012). Thus, a measure providing a better understanding of user-avatar differences related to distinct well-being issues (e.g. low self-esteem due to unsatisfying appearance) could be used to tailor serious games employing avatar customisation to better address their recipients’ needs.
In summary, this study represents a significant advancement in the field of user-avatar research by introducing a standardised measure explicitly focusing on user-avatar discrepancies. The User-Avatar Discrepancy Scale (UADS) includes detailed item formulations that capture subtle differences in user-avatar perceptions using a unique approach of semantic differences. This method offers valuable insights into the psychological processes underlying avatar creation and identification that may not be evident through traditional self-report measures alone.
Furthermore, the methodology employed in this study lays a solid foundation for future research. Utilising advanced statistical analyses, such as item response theory, the study establishes cut-off scores, which allow for a more precise and nuanced understanding of user-avatar discrepancies. This approach enables the UADS to be adapted for longitudinal studies or different demographic groups, paving the way for more comprehensive and inclusive research. Thus, the present study bridges a gap between theoretical understanding and practical application, ensuring that the complexities of user-avatar relationships are thoroughly explored and understood.
1.2. The present study
Despite the advancements and the numerous instruments developed to measure the UAB (e.g. Player-Avatar Identification Scale [PAIS]; Li, Liau, and Khoo Citation2013; Self-Presence Questionnaire [SPQ]; Ratan and Hasler Citation2009; Player Identification Scale [PIS]; Van Looy et al. Citation2012), there is not yet a standardised measure explicitly focusing on user-avatar discrepancies.
To address this, the present study will concurrently examine a large sample of Czech gamers regarding their user-avatar views and will employ a sequence of advanced exploratory, confirmatory, measurement invariance in relation to gender, and item-response statistical procedures to determine the optimum number and content of items to inform a brief, valid, and easy to use UADS.
2. Method
2.1. Participants
Archival Czech Republic data of 477 gamers were employedFootnote1 (age ranging from 11 to 21 years old; meanage = 16.39; SD = 1.6; weekday(s)-average-daily-gaming-time = 3.84 h; SD = 2.30; weekend-average-daily-gaming-time = 7.5 h; SD = 3.88; 41% battle arenas gamers; 38.2% role-playing gamers; 8.2% first-person shooter gamers; 438/91.8% males; see for detailed socio-demographics).
Table 2. Socio-Demographics of the sample.
The maximum sampling error (N = 477; 95% confidence interval, Z = 1.96) of 4.4% addresses recommended levels (+/ – 7.1%; Hill Citation1998). Considering power, it also satisfies (a) factor analyses’ recommendations of 10 participants per item (i.e. 15items X 10 = 150 < 477; Myers, Ahn, and Jin Citation2011) and (b) G-Power analysis calculated Nmin = 199 for linear multiple regression R2 deviation from 0, modelling of 15 predictors, an effect size of .15 and error probability (α) = .05 (Faul et al. Citation2007).
2.2. Material
2.2.1. User-Avatar discrepancy scale (UADS)
The scale was created based on the notion that an emotional (psychodynamic) bond between a gamer and their avatar can be made. Such a bond can vary from identification to compensation (see Blinka Citation2008; Li, Liau, and Khoo Citation2013). Instead of directly asking about the bond, this scale measures the discrepancy between the adjectives the participants see themselves versus their avatars. A pool of 15, polar-paired, seven-point Likert (e.g. strong = 1 – weak = 7), descriptive items, informed by differential semantics (Osgood, Suci, and Tannenbaum Citation1957), where higher values indicate less commonly desirable characteristics, composed of two identical subscales assessed one’s view of their self (‘Using the pairs of adjectives, how do you see yourself?’) and avatar respectively (‘Using the pairs of adjectives, how do you see your gaming avatar?’ – this was preceded by a question ‘In your most frequenty played game, do you have an avatar?’ and only a response ‘yes’ led to the set of adjectives). The order of these pairs was random and without any judging intentions. Self-view item responses are subtracted from their corresponding avatar items, with higher positive values indicating a higher magnitude of self-positive view and higher negative values suggesting better views of their avatar than themselves.Footnote2
The development of the UADS involved a systematic process to ensure its reliability and validity. The creation of the measure can be summarised in the following steps:
2.3. Step 1: item generation
Firstly, several polar terms were formulated for the UADS, after the exploration of various semantic differentials, drawing inspiration from Osgood et al.'s (Citation1957) theory of nature and measurement of meaning. This approach has been successfully applied in diverse, relevant, recent studies involving gaming, avatars and adolescent behaviour (Stone Citation2021; Takashima et al. Citation2008; Virtič & Šorgo Citation2022). The effective use of semantic differentials in these contexts allowed for capturing and leveraging meaningful discrepancies, underscoring the suitability of this methodology for the UADS (Stone Citation2021; Takashima et al. Citation2008; Virtič & Šorgo Citation2022).
2.4. Step 2: item formatting
Secondly, to enhance comprehensiveness and alignment with the aim of measuring user-avatar discrepancy, avatar appropriate adjustments were made to Osgood's original set of adjectives with the help of a focus group of gamers (i.e. 7 gamers X 2 h ranking together the items to be prioritised). These were tailored for application to both the gamer and the avatar, ensuring that the items accurately captured a range of potential areas of interest.
2.5. Step 3: expert comments
Prior to data collection, the scale underwent cognitive testing involving volunteers representing diverse demographics. Furthermore, experts in the cyberpsychology research domain meticulously reviewed the questionnaire to ensure its appropriateness and adherence to established standards.
2.6. Step 4: data collection and refinement
Following the formulation of the UADS through the outlined steps, data collection commenced. Participants’ responses to the questionnaire were gathered to assess its performance and identify potential areas for refinement. This iterative process ensured that the UADS was not only theoretically grounded but also empirically sound. displays the original questionnaire, providing a comprehensive overview of the items before conducting the analysis.
Table 3. The User-Avatar Discrepancy Scale (UADS) with all items, prior to the analyses conducted.
2.6.1. Addiction-Engagement questionnaire (AEQ; Charlton and Danforth Citation2007, Citation2010)
The Addiction-Engagement Questionnaire (AEQ; Charlton and Danforth Citation2007, 2010) is a 24-item measure on a four-point Likert scale (e.g. 1 = ‘strongly agree’ and 4 = ‘strongly disagree’). This measure was selected due to its extensive use in the literature and has been well-validated among gamer populations (Blinka, Ťápal, and Škařupová Citation2021; Xu, Turel, and Yuan Citation2012). Originally designed to assess gaming addiction and high engagement in video games, the scale consists of 12 items each for addiction and engagement. Higher scores indicate higher levels of gaming addiction or engagement. The Addiction subscale captures core behavioural addiction criteria such as tolerance, salience, relapse, and withdrawal. On the other hand, the Engagement subscale measures peripheral addiction criteria like cognitive salience, euphoria, and tolerance. While the original items referred to the game ‘Asheron's Call’, in our study, participants were asked about the title they played most often in the three months prior to data collection. In the current study, both the addiction (α = .82; ω = .83) and engagement (α = .73; ω = .74) subscales indicated acceptable reliability.
The relationship between high immersion, excessive gaming engagement, and UAB is well documented in existing literature (e.g. Mancini, Imperato, and Sibilla Citation2019; Morcos et al. Citation2021; Stavropoulos et al. Citation2019; Citation2020; Szolin et al. Citation2022). In the context of videogames, crafting an avatar to be an idealised self-representation is not uncommon (Sibilla and Mancini Citation2018; Szolin et al. Citation2022). However, problems can arise when there are significant discrepancies between one’s online avatar and offline self (Sibilla and Mancini Citation2018). Such discrepancies have been associated with depressive symptoms, diminished well-being, and compromised mental health and self-clarity (Stavropoulos et al. Citation2019; Citation2020; Szolin et al. Citation2022; You, Kim, and Lee Citation2017). Thus, although users may create idealised avatars as a means to counterbalance perceived undesirable or negative aspects of their real selves (i.e. a medium to bridge the gap between their ideal and actual selves), this may eventually result to the opposite, over-engaging them online (i.e. disordered/problematic gaming; Stavropoulos et al. Citation2019; Citation2020; Szolin et al. Citation2022). Hence, it is assumed that both addiction and engagement dimensions of the AEQ could be operate as external validators of the UADS.
2.7. Procedure
In 2014, online data collection was carried out via the LimeSurvey platform, targeting experienced and dedicated gamers. A Lime survey link in the Czech language was distributed across various online platforms intended for the gaming community (e.g. gaming groups on various social networking sites like Facebook, online forums, guild/gaming group websites) and game-related magazines. The link firstly directed participants to the plain language research information statement addressing the study’s aims, approximate length of the survey, data collection methods, data usage access, and limitations, research team description, their contact information and institutional background, as well as one’s rights to participate anonymously and voluntarily, and to interrupt their participation at any point and without any penalties. Informed consent was then digitally provided for one to address the survey. The participation was solicited by online advertisement and parents of underage children could not be addressed directly; therefore, minors were requested to confirm that they would participate in the survey with parental approval. The study did not require the approval of the ethics committee. However, it was conducted in line with the university’s ethical guidelines (CTT Citation2015).
2.8. Statistical analyses
To fulfil the study’s aim, participants were randomly split into the calibration (N = 239) and the validation (N = 238) sub-samples. This was conducted using the random split function in SPSS version 20. It is important to note that this function does not necessarily split the whole sample into two equal halves. Additionally, this procedure has been validated in previous literature for similar analyses (Gomez et al. Citation2022). Firstly, a sequence of exploratory factor analyses (EFA) determined the optimum latent factor structure and items to be retained via the calibration sub-sample. Secondly, confirmatory factor analysis (CFA) confirmed/tested the EFA results via the validation sample. Last, the item response theory (IRT) analysis of the whole sample examined the psychometric properties of the optimum EFA/CFA model at both the scale and item level.
In particular, EFA(s) with minimum residual extraction and oblique rotation were conducted on the calibration sample (N = 239) via the Jamovi 2.0 software (Navarro and Foxcroft Citation2019). For model-evaluation, scree plot, model-fit indices, and Kaiser’s criteria (eigenvalue > 1 rule) were employed (Williams, Onsman, and Brown Citation2010). To compare alternatively converging EFA models, Gomez et al. (Citation2022a) stepwise selection process involving: (i) model fit (X2 closer to insignificant = better fit; root mean square error of approximation [RMSEA] ≤ .06 = good model fit, between .06 – .08 = adequate model fit, and > .10 = poor fit; Bayesian information criterion [BIC] lower = better fit; Tucker-Lewis Index [TLI] ≥ .95 = good fit; Hooper, Coughlan, and Mullen Citation2008; Hu and Bentler Citation1999; Schwarz Citation1978; Xia and Yang Citation2019); (ii) clarity (minimum three items per factor; factor loadings and cross-loadings > .32 = salient; item uniqueness > .06 = less factor relevant/item omitted; Tabachnick and Fidell Citation2007); and (iii) reliability (Cronbach’s alpha [α] and omega [ω] were examined if the item was deleted, such that items which impacted reliability were omitted and 0.6 < considered adequate α and ω; Nunnally and Bernstein Citation1994).
Successive CFA(s) were then conducted using the R Studio Lavaan and semTools packages on the validation sample (N = 238; Jorgensen et al. Citation2021; Rosseel Citation2012). All models assessed were replicated via the use of (i) diagonally weighted least squares (DWLS), (ii) maximum likelihood (ML), and (iii) weighted least squares (WLS) estimators. Model fit was assessed as per EFA(s). The optimum CFA model was determined taking concurrently into consideration model fit and latent factor reliabilities.
Furthermore, to examine measurement invariance across genders, a multi-group confirmatory factor analysis was conducted using the R Studio Lavaan software. This involved assessing configural (equality across groups), metric (equality across factor loadings), and scalar invariance (equality across item thresholds) across gender groups. While the methodology for testing measurement invariance is well-established (refer to Cheung and Lau Citation2012; Gomez et al. Citation2023; Tsaousis and Alghamdi Citation2022 for a detailed overview), specifics regarding the syntax and outputs can be found in the supplementary file (see Appendix C).
To evaluate the fit of nested models, the present study used approximate fit indices (CFI and RMSEA). The thresholds for rejecting invariance were set at ΔCFI greater than 0.01, and ΔRMSEA greater than −0.015 (Chen Citation2007). In instances where full measurement invariance isn't established, we will resort to a partial invariance model. This approach ensures meaningful and valid comparisons across groups (Robitzsch and Lüdtke Citation2023). To solidify the findings, the study employed bias-corrected bootstrapping confidence intervals. This method is supported by previous research for its effectiveness in correcting biases in bootstrapping sample distributions and providing more accurate confidence intervals compared to other methods like percentile approaches (Cheung and Lau Citation2012). It involves generating multiple bootstrap re-samples, calculating parameters (factor loadings and intercepts) for each gender group, and adjusting the bootstrap distribution of these parameters. This process allows for a more robust estimation of measurement invariance across genders in the study.
Additionally, IRT modelling was conducted on the total sample using the mirt, naniar, and Rcpp R Studio packages (Chalmers Citation2012; Eddelbuettel and François Citation2011; Tierney et al. Citation2021). The graded response model fit (M2 limited information goodness-of-fit, insignificant = good fit and smaller values better fit; RMSEA, SRMR, and CFI as per EFA/CFA), items’ fit (S-χ2 insignificant = good fit), discrimination (a; the capacity of discriminating/differentiating various levels of the latent trait), and difficulty (b; the amount of the latent trait, one is assumed to have, to provide a certain item response) parameters were examined. IRT findings/parameters were also visualised via the item characteristic curves (ICC; α; β) and the item information function (IIF; item reliability per different levels of the latent trait), the Test Information Function (TIF; Test reliability per different levels of the latent trait) and the Test Characteristic Curve (TCC; scale level). As IRT enables the matching of raw-scale and trait scores, cut-off points at 2 SDs above the latent mean can be conditionally proposed (Embretson and Reise Citation2013).
To assess discriminant validityFootnote3, the study will examine the relationships between the optimum discrepancy model and the AEQ factors (addiction and engagement) using correlation analysis in the Jamovi software. Positive correlations between the optimum discrepancy model and the AEQ factors will be taken as indicative of significant relationships. The interpretation of the effect sizes for these correlations will be based on Cohen's (Citation1992) guidelines: 0.1 indicates a small effect size, 0.3 represents a medium effect size, and 0.5 indicates a large effect size.
3. Results
3.1. EFA
3.1.1. Model fit
Alternative EFA(s) models (see ) of the 15 items supported a unifactorial solution, with the scree plot and factor-eigenvalues reinforcing it. As shown, models 1 and 2 indicated adequate fit in terms of their RMSEA values (Hu and Bentler Citation1999). In contrast, models 3 and 4 displayed a preferred good fit indicated by their RMSEA, BIC, and TLI values, and insignificant chi-square, thereby meeting our global fit criteria (Hu and Bentler Citation1999).
Table 4. Fit Indices, Factor Loadings, and Reliabilities of the EFA in the Calibration Sample.
3.1.2. Clarity
Considering model 1, items 4 (loud/silent), 11 (masculine/feminine) and 14 (bold/different) did not load saliently (> .32), whilst concurrently presented with high uniqueness (< .06). Reliability also increased when these items were removed, and thus they were not included in model 2. Considering model 2, items 3 (brave/cowardly), 5 (social/solitary), 12 (honest/dishonest), and 13 (just/unjust) demonstrated low salience, high uniqueness and increased reliability when removed, therefore were not included in model 3. Considering model 3, item 7 (observant/oblivious) demonstrated high uniqueness (.836), despite loading appropriately to its allocated factor (.405) and not impacting reliability. Finally, considering model 4 (i.e. model 3 minus item 7) item 10 (cheerful/gloomy) demonstrated concurrently low factor loading and high uniqueness.
3.1.3. Reliability
Omega (ω) values were .741, .76, .752, and .742 for models 1, 2, 3, and 4, respectively. Thus, they consistently exceeded the minimum .50 threshold (Reise, Bonifay, and Haviland Citation2013), deeming all models interpretable.
3.1.4. Optimum model selection
EFA Model 3 was favoured based on its (i) fit (RMSEA = .083; BIC = −57.5; TLI = .853); (ii) all items loading saliently on the designated factor; and (iii) factor reliability for this model was moderate (ω = .752).
3.2. CFA
CFA was then conducted on the validation sample for model 3 (see ) via the diagonally weighted least squares (DWLS) estimator, due to being appropriate for smaller samples and ordinal data and produced a more parsimonious solution (DWLS χ2 (df = 20) = 30.368, p = .064; RMSEA = .064 (90% CI = 0 – .081); CFI = .958; TLI = .941; and SRMR = .071; Mîndrilă Citation2010). The model was comparatively estimated via the maximum likelihood (ML) and the weighted least squares (WLS) estimators. CFA model 3 ω reliability was also acceptable (.73).
Table 5. The factor loadings and reliabilities of the one-factor EFA in the calibration sample.
3.3. Measurement invariance
As seen in , configural and metric invariance were achieved, indicating a similar factorial structure and factor loadings across men and women. However, given that scalar invariance was not achieved, a partial invariance model demonstrated invariance (with item 10 intercept freely estimated across gender groups). This indicates that women (0.126) score on average significantly lower than men (0.955) in item 10. Moreover, bootstrapping (i.e. 100 iterations) was used to address potential limitations surrounding the limited number of female participants included in this study (i.e. N = 39). In addition, all bootstrapped confidence intervals (95% CI) included the original standard estimated parameters (see Appendix C), indicating that a relatively small sample size sufficed to correctly estimate the desired parameters.
Table 6. Fit indices, factor loadings, and reliabilities of the one-factor CFA in the validation sample.
3.4. IRT
3.4.1. IRT fit
The S-χ2 per item-fit statistics were satisfactory fit p < .01), except item 7 (see ). The overall model M2 was also satisfactory (M2 [20] = 94.53, p = 1.19) and the RMSEA and SRMR values moved within the acceptable ranges (RMSEA = .09, 90% CI = .07 – .108; SRMR = .07).
Table 7. User Avatar Discrepancy questionnaire item fit data.
3.4.2. Item parameters
Considering discrimination (α), all items ranged in the moderate to high range (0 = non discriminative; .01 – .34 = very low; .35 – .64 = low; .65–1.34 = moderate; 1.35–1.69 = high; > 1.70 = very high; Baker Citation2001). The descending order of the item’s α is item 15 (helpless/dominant), item 8 (unimportant/important), item 2 (fast/slow), item 1 (strong/weak), item 9 (good looking/ugly), item 6 (active/passive), item 7 (observant/oblivious), and item 10 (gloomy/cheerful). Similarly, factor loadings ranged in the moderate range between .43 (items 7 and 10) and .61 (items 15; see ).
Table 8. User Avatar Discrepancy questionnaire item discrimination (α) and difficulty (β) parameters.
Considering difficulty (β), fluctuations occurred across the eight items’ thresholds (see and ). Indicatively, the ascending item sequence for β1 (Likert values of – 5 to – 4, where more negative values suggest better avatar views compared to one’s self) was items 10, 7, 1, 2, 8, 15, 9, and 6. While the ascending sequence in the β8 threshold (represents the range of Likert values from 3 to 4, where more positive values suggest better views of one’s self compared to their avatar) was items 9, 8, 6, 10, 1, 2, 7, and 15. Difficulty discrepancies appear more elevated for item 7 (observant/oblivious) and item 10 (cheerful/gloomy). Nonetheless, β values gradually increased for all items as the ‘difficulty’ of endorsing an item increased, indicating that all items performed accordingly.
Figure 1. The user-avatar discrepancy category characteristic curve. The figure is expressed in a nonlinear regression line relating to discrimination (α) and difficulty (β) parameters. Discrimination (α) describes how well an item can differentiate between participants according to their latent trait levels. Thus, items more strongly related to the latent variable present steeper slopes. β reflects the level of the latent trait, theta (θ), at which a participant has an equal probability (50:50) of endorsing an item. For example, ‘easier’ items have lower β values and are presented closer to the horizontal axis.
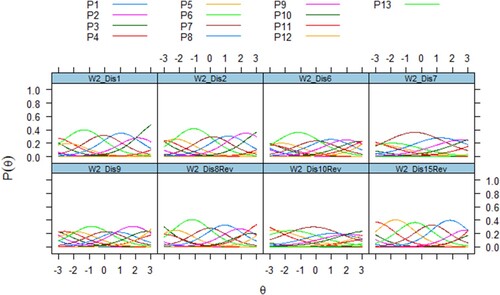
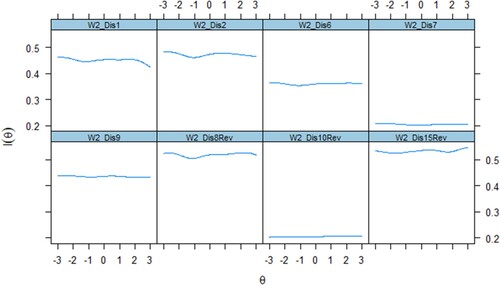
Figure 2. The user-avatar discrepancy item information curve. Information refers to the ability of an item to accurately estimate scores on the theta (θ). Item-level information demonstrates how well each item contributes to scoring estimation precision, with higher levels of information indicating more accurate score estimates.
3.4.3. Psychometric properties at the scale level
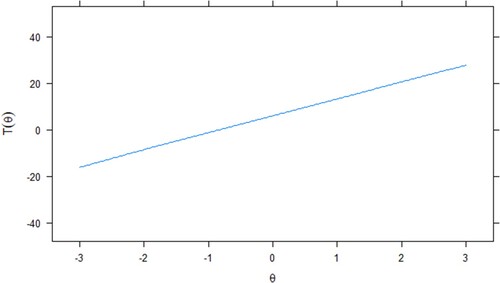
Considering the performance of the scale as a whole, the TCC demonstrates the latent trait (i.e. difficulty; b; the rate one views themselves more favourably compared to their avatar) increasing steeply, as the total score increases (see ). Additionally, a score of – 19 (2 SDs below the mean) may apply as a conditional cut-off point of high discrepancy in favour of one’s avatar.
Figure 3. The Test Characteristic Curve (TCC) provides a visual representation of expected discrepancy scores (blue line) as a function of the latent trait. The figure demonstrates that the latent trait (i.e. the discrepancy) increases steeply, as the total score reported increases and becomes positive.
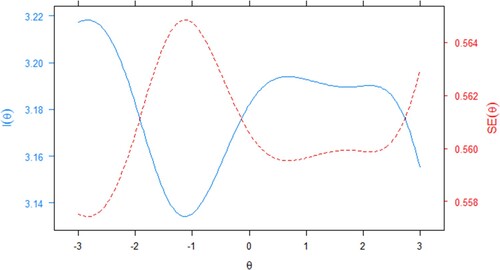
Considering the information provided by the scale, improved information (TIF) scores apply for those between the mean and approximately 2.5 SDs above the mean (see ). These findings suggest that the user-avatar discrepancy measure provides a sufficient and reliable psychometric measure for assessing individuals with low and high levels of discrepancy. Interestingly, the scale may provide less reliable information for those who see their avatar as averagely better than themselves, although those who view their avatar as significantly better or worse than themselves are assessed more reliably. Despite these, the overall scale reliability (ω) was .76 and acceptable.
Figure 4. The Test Information Function (TIF) curve demonstrates the relationship between the stand errors (SE; dotted line) and reliability indices. The blue line represents the level of scale information for varying levels of the latent trait and the red line is the level of error for similarly varying levels of the latent trait.
3.5. Discriminant validity
presents the correlations between the UADS items and the Addiction and Engagement factors of the AEQ scale. As demonstrated, the scale and all items positively correlated with each other. The magnitude of all corrections was of a small effect size. Specifically, items 1 (strong/weak), 6 (active/passive), and 7 (observant/oblivious) are positively correlated with both Addiction and Engagement. Item 2 (fast/slow) is positively and significantly correlated with Engagement. Furthermore, items 8 (important/unimportant), 9 (good looking/ugly), 10 (cheerful/gloomy), and 15 (helpless/dominant) are significantly and positively associated with Addiction. Lastly, the overall scale was significantly and positively correlated with both Engagement and Addiction, as assessed via the AEQ (Charlton and Danforth Citation2007).
Table 9. Correlation matrix of the UADS items with the AEQ Addiction and Engagement factors.
4. Discussion
The present study combined a sequence of EFA(s), CFA(s), measurement invariance, and IRT analyses to examine self/avatar views to inform the development of a user-avatar discrepancy scale. A series of 15 polar-paired adjectives describing one’s view of one’s self and avatar were concurrently assessed and evaluated so that the central discrepancy areas could be identified. Findings revealed a unifactorial latent structure of the theorised user-avatar discrepancy experienced, with social-desirability issues involving strength, physical abilities (e.g. physical capability and appearance), and emotionality underpinning participants’ responses. Measurement invariance analysis, indicated additionally that the scale’s factorial structure and item loadings do not significantly differ across the two biological genders. Nevertheless, responses on item 10 (Cheerful/Gloomy) appear not to be comparable (i.e. lack of scalar invariance), and thus may be unreliable for gender comparisons.
Specifically, items reflecting strength/weakness, fast/slow, active/passive, observant/oblivious, important/unimportant, attractive/ugly, cheerful/gloomy, and helpless/dominant aspects were shown to best capture the discrepancy between one’s view of themselves offline and their avatar online. These findings reinforce evidence suggesting those portraying their avatar favourably to themselves, are likely to compensate for real-life self-perceived deficits to experience gratification (Blinka Citation2008; Kardefelt-Winther Citation2014a; Stavropoulos, Ratan, and Lee Citation2022). Such interpretations align with identified digital media use motivations related to compensating for unmet real-life needs and avoiding real-life problems (Blasi et al. Citation2019; Elhai, Levine, and Hall Citation2019; Kardefelt-Winther Citation2014a; Citation2014b).
Nevertheless, our study's findings highlight significant discrepancies influenced by social desirability, inviting comparison with similar themes in existing literature (e.g. Loewen, Burris, and Nacke Citation2021). This body of research emphasises that the choices individuals make in avatar design – opting for realistic, idealised, or markedly different avatars – often reflect their aspirations to align with socially desirable traits. Such design choices extend beyond mere aesthetic preferences, indicating a deeper psychological drive for social acceptance and identity exploration. This intricate relationship between avatar design and the user's quest for social validation offers a compelling framework for developing virtual and gaming environments that not only cater to but also nurture users’ aspirational selves, thereby enhancing engagement and interaction within these spaces.
The findings concurrently expand the available literature by illustrating how user-avatar discrepancy areas differ in their capacity to reliably detect those who tend to experience the highest differences (see discrimination and item information function differences). In that line, issues related to power and importance appear to precede significance, compared to aspects related to cheerfulness and/or gloominess. Thus, it may be hypothesised, that low perceived power and importance in relation to others are the real-life deficits mostly informing the avatar’s perceived superiority, more so than mood differences between the two (e.g. a cheerful avatar compared to a gloomy person in real life). Interestingly, one’s appearance seems to be less informative of the user-avatar discrepancy compared to social features of power and importance, despite popular beliefs (Stavropoulos et al. Citation2020; Stavropoulos, Ratan, and Lee Citation2022).
These insights have significant implications for the development of novel mental health treatments that leverage the UAB (see Tisseron Citation2009). Avatars facilitate a mechanism through which individuals can explore and reconcile socially desirable traits with their actual selves, thus providing a unique approach to therapy. This method proves particularly valuable in contexts where individuals contend with social anxiety or self-esteem issues (Loewen et al., Citation2021). Avatars create a safe space for experimenting with self-presentation and receiving feedback in a controlled, supportive environment. This arrangement enables therapeutic interactions that directly engage with an individual's social self-concept, allowing for the address and amendment of self-beliefs concerning social positioning, rather than focusing primarily on altering perceptions related to physical appearance (Morcos et al. Citation2021).
Moreover, therapeutic interventions may need to place greater emphasis on how the individual’s social positioning is experienced. This could involve cognitive restructuring – amending one’s self-beliefs to enhance their perception of their social roles – and self-centered cognitive processing, which involves re-thinking about the way individuals view themselves (Morcos et al. Citation2021). These interventions suggest a shift in therapeutic focus from mere appearance to more profound aspects of identity as influenced by social interactions and perceptions.
The integration of avatars into mental health practices could enable therapists to harness these digital representations to foster significant psychological change, focusing on issues related to power and importance rather than exclusively on physical attributes. Such strategic use of avatars could transform therapeutic practices, especially in digital settings where individuals are increasingly seeking interventions.
Overall, the eight dimensions/items found to be mostly informing the user-avatar discrepancy reported in the current sample, relate more to the way an individual feels they are viewed by others (e.g. important, powerful, and attractive) rather than how they view/experience themselves (e.g. cheerful, brave, etc.), thus implying that acceptance by others (i.e. social desirability) could be the main drive of structuring an avatar in a way that differs to the person in real life. These results suggest general applicability across both biological genders, with a notable exception for item 10 (Cheerful/Gloomy), which presents challenges in gender-based comparisons. This distinction may be related to past literature suggesting that emotional expression can differ between genders (Sanchis-Sanchis et al. Citation2020), potentially influencing their connection with their avatar (Müller and Bonnaire Citation2021). This notion is supported by previous research indicating gender-specific variations in emotionality among gamers, particularly in aspects of emotion regulation (Müller and Bonnaire Citation2021). This insight could be useful for understanding and interpreting gender-based responses in future avatar-related studies.
4.1. Conclusion, limitations, implication, and future research
Conclusively, the present findings could be summarised in two main points; (a) user-avatar discrepancies reported appear to relate to one latent factor, likely underpinned by social desirability concerns (i.e. it is improving how one is viewed by others that drives self/avatar differences) and; (b) issues on power and importance appear to be more significant regarding the way self/avatar discrepancy is manifested compared to the person’s external appearance. Future research should consider the adoption of longitudinal study designs to trace the evolution of user-avatar relationships over time. Such studies would allow researchers to assess how changes in UAB impact users’ psychological well-being, including self-esteem and social anxiety. Understanding the temporal dynamics of these relationships could elucidate whether discrepancies between the real self and the avatar decrease or increase over time and the subsequent effects on individual behaviour and mental health.
Furthermore, as all items were positively correlated with both engagement and addiction, which is consistent with both the theory related to the UAB and past literature, these findings can be interpreted as providing reasonable support for the external validity of the UADS. From a practical aspect, a scale assessing user-avatar discrepancy issues has been validated and can likely be used in research, as well as for assessment and intervention purposes in novel mental health treatments and/or gamified e-health applications (i.e. serious games) entailing avatars (Stavropoulos, Ratan, and Lee Citation2022).
These findings need to be considered in light of the present study’s limitations. Firstly, the conclusions are based on a single study and further research is required in order to confirm these findings. While the steps outlined in the creation of the UADS were undertaken with care, it is crucial to acknowledge the inherent limitations of the present research. Various factors, such as the choice of sample, language nuances, and the extent of statistical analyses, could have influenced our findings. A different sample composition, linguistic variations (i.e. other than the Czech language), or employing additional advanced analytical techniques might have provided alternative insights (e.g. AI analysis). Notably, the formulation of polar terms, inspired by Osgood et al.'s (Citation1957) theory of nature and measurement of meaning, though conceptually meaningful, is based on a very specific methodology. Future studies may benefit from addressing this by incorporating alternative methods (i.e. qualitative interviews) analysed by more modern analysis techniques, such as latent topic analysis (i.e. an algorithm that can identify latent topics/areas best capturing the content of a text; Finch et al. Citation2018), to further enhance the measure's relevance and effectiveness.
Another notable limitation is that the UADS was not compared with other UAB measures, such as the SPQ (Ratan and Hasler Citation2009). Since these two measures explore UAB from different perspectives, a comparative analysis could yield additional insights into the discrepancy between the user and their avatar and the suitability of the UADS for gamers. Furthermore, this study did not explicitly define what constitutes an ‘avatar’, which could lead to variations in participant understanding and responses. A standardised definition could have provided a clearer framework for participants, ensuring uniformity in their responses. Future studies should explicitly define key terms such as ‘avatar’ to enhance the clarity and applicability of the research findings. Additionally, this study did not account for the possible effects of multiple avatars per user, which may differ significantly in their representation and use. This oversight may limit the understanding of the diverse ways in which users engage with and perceive their avatars, particularly in environments where multiple avatars are common. Acknowledging and exploring this aspect could provide a more nuanced view of user-avatar interactions and their psychological impacts.
Moreover, it is important to consider the generalisability of the study's findings, as the sample was specific to the Czech Republic. It is worth noting that adjustments were made to the questionnaire's terminology to ensure accurate translation to English, which may not fully capture the original Czech meaning. For instance, item 8 in English uses the term ‘important/unimportant’, whereas in Czech, it corresponds more closely to concepts related to self-esteem. Hence, to validate and verify these results, it would be valuable to replicate this study in other contexts or populations.
Additionally, the sample was predominantly male, unavoidably constraining the generalisability across genders. Lastly, findings are based on a community sample and thus may not be applicable to clinical populations. Future research should therefore address these limitations by incorporating clinical samples, ensuring gender balance, and including culturally diverse populations. In particular, the inclusion of a larger and more representative sample would not only serve to validate the present findings but also provide a foundation for further exploration and expansion of the conclusions. Moreover, exploring these dynamics across diverse demographic groups would enrich our understanding of how different individuals perceive and engage with their avatars. This could reveal significant variations in how user-avatar discrepancies manifest across various cultural, age, and gender spectrums, offering insights that could be pivotal for designing more effective digital interventions. Such research initiatives are deemed of pivotal importance given the rapid expansion of avatar-based applications in the impending metaverse era (Szolin et al. Citation2022).
Authors’ contribution
TB: contributed to the literature review, framework formulation, and the structure and sequence of theoretical arguments. Contact: [email protected]. LB: contributed to the data collection, framework formulation, and the structure and sequence of theoretical arguments. Contact: [email protected]. KD: contributed to the literature review, reviewed the final form of the manuscript, and final submission. Contact: [email protected]. RK: contributed to the literature review, reviewed the final form of the manuscript, and final submission. Contact: [email protected]. DZ: contributed to the analysis and final revisions of the final form of the manuscript. Email: [email protected]. VS: contributed to the framework formulation, the structure and sequence of theoretical arguments, the literature review, and reviewed the final form of the manuscript. Contact: [email protected].
Ethical standards – animal rights
All procedures performed in the study involving human participants were in accordance with the ethical standards of the institutional and/or national research committee and with the 1964 Helsinki declaration and its later amendments or comparable ethical standards. This article does not contain any studies with animals performed by any of the authors.
Informed consent
Informed consent was obtained from all individual participants included in the study.
Confirmation statement
The authors confirm that this paper has not been either previously published or submitted simultaneously for publication elsewhere.
Copyright
Authors assign copyright or license the publication rights in the present article.
Acknowledgments
The authors wish to thank all the individuals who participated in the study.
SupplementaryFileFinal.docx
Download MS Word (272.3 KB)Disclosure statement
No potential conflict of interest was reported by the author(s).
Data availability statement
All data and syntax have been made publicly available at Git Hub and can be accessed at https://vas08011980.github.io/UABDISSCALE/UserAvatarBondDiscrepancyQuestionnaireFile.html.
Additional information
Funding
Notes
1 Further information regarding the data cleaning procedure can be found in appendix A of the supplementary file.
2 The full list of the 15 polar-paired items is included in the supplementary file (Appendix b).
3 In addition to the validity analysis presented in this study, a comprehensive network analysis has been conducted to further examine the operational dynamics of the questionnaire items. This analysis, detailed in Appendix D, provides additional insights into the inter-item relationships and assesses whether the questionnaire functions under a formative model. Readers are encouraged to refer to Appendix D for a more in-depth understanding of the item interactions and the structural composition of the questionnaire.
References
- Baker, F. B. 2001. The Basics of Item Response Theory. College Park, MD: ERIC Clearinghouse on Assessment and Evaluation.
- Blasi, M. D., A. Giardina, C. Giordano, G. L. Coco, C. Tosto, J. Billieux, and A. Schimmenti. 2019. “Problematic Video Game use as an Emotional Coping Strategy: Evidence from a Sample of MMORPG Gamers.” Journal of Behavioral Addictions 8 (1): 25–34. https://doi.org/10.1556/2006.8.2019.02.
- Blinka, L. 2008. “The Relationship of Players to Their Avatars in MMORPGs: Differences Between Adolescents, Emerging Adults and Adults.” Cyberpsychology 2 (1), Article 5.
- Blinka, L., A. Ťápal, and K. Škařupová. 2021. “Evaluating the Psychometric Properties and Measurement Invariance of the Addiction-Engagement Questionnaire Using a Longitudinal Sample.” Journal of Psychopathology and Behavioral Assessment 43 (4): 757–765. https://doi.org/10.1007/s10862-021-09907-x.
- Browne, M. W. 1984. “Asymptotically Distribution-Free Methods for the Analysis of Covariance Structures.” British Journal of Mathematical and Statistical Psychology 37 (1): 62–83. https://doi.org/10.1111/j.2044-8317.1984.tb00789.x.
- Burleigh, T. L., V. Stavropoulos, L. W. Liew, B. L. Adams, and M. D. Griffiths. 2018. “Depression, Internet Gaming Disorder, and the Moderating Effect of the Gamer-Avatar Relationship: An Exploratory Longitudinal Study.” International Journal of Mental Health and Addiction 16:102–124. https://doi.org/10.1007/s11469-017-9806-3.
- Chalmers, R. P. 2012. “mirt: A Multidimensional Item Response Theory Package for the R Environment.” Journal of Statistical Software 48 (6): 1–29. https://doi.org/10.18637/jss.v048.i06.
- Charlton, J. P., and I. D. Danforth. 2007. “Distinguishing Addiction and High Engagement in the Context of Online Game Playing.” Computers in Human Behavior 23 (3): 1531–1548. https://doi.org/10.1016/j.chb.2005.07.002.
- Charlton, J. P., and I. D. Danforth. 2010. “Validating the Distinction Between Computer Addiction and Engagement: Online Game Playing and Personality.” Behaviour & Information Technology 29 (6): 601–613. https://doi.org/10.1080/01449290903401978.
- Chen, F. F. 2007. “Sensitivity of Goodness of fit Indexes to Lack of Measurement Invariance.” Structural Equation Modeling: A Multidisciplinary Journal 14 (3): 464–504. https://doi.org/10.1080/10705510701301834.
- Cheung, G. W., and R. S. Lau. 2012. “A Direct Comparison Approach for Testing Measurement Invariance.” Organizational Research Methods 15 (2): 167–198. https://doi.org/10.1177/1094428111421987.
- Clark, O., S. Grogan, J. Cole, and N. Ray. 2019. “How Might Avatar Appearance Influence Health-Related Outcomes? A Systematic Review and Narrative Meta-Review.” PsyArXiv, 1–46. https://doi.org/10.31234/osf.io/j3675.
- Cohen, J. 1992. “Statistical Power Analysis.” Current Directions in Psychological Science 1 (3): 98–101. https://doi.org/10.1111/1467-8721.ep10768783.
- CTT. 2015. Nakládání s Výzkumnými Daty na Masarykově Univerzitě [Use of Research Data at Masaryk University]. Brno: Centrum pro transfer technologií, Masarykova univerzita.
- Eddelbuettel, D., and R. François. 2011. “Rcpp: Seamless R and C++ Integration.” Journal of Statistical Software 40 (8): 1–18. https://doi.org/10.18637/jss.v040.i08.
- Elhai, J. D., J. C. Levine, and B. J. Hall. 2019. “The Relationship Between Anxiety Symptom Severity and Problematic Smartphone use: A Review of the Literature and Conceptual Frameworks.” Journal of Anxiety Disorders 62:45–52. https://doi.org/10.1016/j.janxdis.2018.11.005.
- Embretson, S. E., and S. P. Reise. 2013. Item Response Theory. New York: Psychology Press.
- Faul, F., E. Erdfelder, A. G. Lang, and A. Buchner. 2007. “G* Power 3: A Flexible Statistical Power Analysis Program for the Social, Behavioral, and Biomedical Sciences.” Behavior Research Methods 39 (2): 175–191. https://doi.org/10.3758/BF03193146.
- Finch, W. H., M. E. Hernández Finch, C. E. McIntosh, and C. Braun. 2018. “The use of Topic Modeling with Latent Dirichlet Analysis with Open-Ended Survey Items.” Translational Issues in Psychological Science 4 (4): 403–424. https://doi.org/10.1037/tps0000173.
- Gabbiadini, A., S. Mari, C. Volpato, and M. G. Monaci. 2014. “Identification Processes in Online Groups.” Journal of Media Psychology 26:141–152. https://doi.org/10.1027/1864-1105/a000119.
- Gomez, R., T. Brown, P. Gill, M. Prokofieva, and V. Stavropoulos. 2023. “Using Online Gambling Disorder Questionnaire (OGD-Q) with Adults: Factor Structure, Reliability, External Validity, and Measurement Invariance Across age and Gender.” International Journal of Mental Health and Addiction 21 (6): 3910–3926. https://doi.org/10.1007/s11469-022-00833-x.
- Gomez, R., T. Brown, S. Watson, and V. Stavropoulos. 2022. “Confirmatory Factor Analysis and Exploratory Structural Equation Modeling of the Factor Structure of the Questionnaire of Cognitive and Affective Empathy (QCAE).” PLoS One 17 (2): e0261914. https://doi.org/10.1371/journal.pone.0261914.
- Gomez, R., V. Stavropoulos, T. Brown, and M. D. Griffiths. 2022. “Factor Structure of ten Psychoactive Substance Addictions and Behavioural Addictions.” Psychiatry Research 313: 1–14. https://doi.org/10.1016/j.psychres.2022.114605.
- Green, R., P. H. Delfabbro, and D. L. King. 2020. “Avatar-and Self-Related Processes and Problematic Gaming: A Systematic Review.” Addictive Behaviors 108:106461. https://doi.org/10.1016/j.addbeh.2020.106461.
- Green, R., P. H. Delfabbro, and D. L. King. 2021. “Avatar Identification and Problematic Gaming: The Role of Self-Concept Clarity.” Addictive Behaviors 113:106694. https://doi.org/10.1016/j.addbeh.2020.106694.
- Harry, M. L., J. Acevedo, and T. M. Crea. 2019. “Assessing the Factor Structure of the Spanish Language Parent Strengths and Difficulties Questionnaire (SDQ) in Honduras.” PLoS One 14 (3): e0214394. https://doi.org/10.1371/journal.pone.0214394.
- Higgins, E. T. 1987. “Self-discrepancy: A Theory Relating Self and Affect.” Psychological Review 94 (3): 319–340. https://doi.org/10.1037/0033-295X.94.3.319.
- Hill, R. 1998. “What Sample Size is “Enough” in Internet Survey Research.” Interpersonal Computing and Technology: An Electronic Journal for the 21st Century 6 (3-4): 1–12.
- Hooper, D., J. Coughlan, and M. R. Mullen. 2008. “Structural Equation Modelling: Guidelines for Determining Model fit.” Electronic Journal of Business Research Methods 6 (1): 53–60.
- Hu, L. T., and P. M. Bentler. 1999. “Cutoff Criteria for fit Indexes in Covariance Structure Analysis: Conventional Criteria Versus new Alternatives.” Structural Equation Modeling: A Multidisciplinary Journal 6 (1): 1–55. https://doi.org/10.1080/10705519909540118.
- Jin, S. A. A. 2012. “Self-discrepancy and Regulatory fit in Avatar-Based Exergames.” Psychological Reports 111 (3): 697–710. https://doi.org/10.2466/06.07.21.PR0.111.6.697-710.
- Jöreskog, K. G. 1969. “A General Approach to Confirmatory Factor Analysis.” Psychometrika 34 (2): 183–202. https://doi.org/10.1007/BF02289343.
- Jorgensen, T. D., S. Pornprasertmanit, A. M. Schoemann, and Y. Rosseel. 2021. semTools: Useful tools for structural equation modeling. R package version 0.5-5. Accessed from https://CRAN.R-project.org/package = semTools.
- Kardefelt-Winther, D. 2014. “A Conceptual and Methodological Critique of Internet Addiction Research: Towards a Model of Compensatory Internet use.” Computers in Human Behavior 31:351–354. https://doi.org/10.1016/j.chb.2013.10.059.
- Kardefelt-Winther, D. 2014. “Problematizing Excessive Online Gaming and its Psychological Predictors.” Computers in Human Behavior 31:118–122. https://doi.org/10.1016/j.chb.2013.10.017.
- Kim, Y., and S. S. Sundar. 2012. “Visualizing Ideal Self vs. Actual Self Through Avatars: Impact on Preventive Health Outcomes.” Computers in Human Behavior 28 (4): 1356–1364. https://doi.org/10.1016/j.chb.2012.02.021.
- Kwon, J. H., C. S. Chung, and J. Lee. 2011. “The Effects of Escape from Self and Interpersonal Relationship on the Pathological use of Internet Games.” Community Mental Health Journal 47:113–121. https://doi.org/10.1007/s10597-009-9236-1.
- Leménager, T., A. Gwodz, A. Richter, I. Reinhard, N. Kämmerer, M. Sell, and K. Mann. 2013. “Self-concept Deficits in Massively Multiplayer Online Role-Playing Games Addiction.” European Addiction Research 19 (5): 227–234. https://doi.org/10.1159/000345458.
- Lemenager, T., M. Neissner, T. Sabo, K. Mann, and F. Kiefer. 2020. “Who am I” and “how Should I be”: A Systematic Review on Self-Concept and Avatar Identification in Gaming Disorder.” Current Addiction Reports 7:166–193. https://doi.org/10.1007/s40429-020-00307-x.
- Li, C. H. 2016. “Confirmatory Factor Analysis with Ordinal Data: Comparing Robust Maximum Likelihood and Diagonally Weighted Least Squares.” Behavior Research Methods 48 (3): 936–949. https://doi.org/10.3758/s13428-015-0619-7.
- Li, D., A. Liau, and A. Khoo. 2011. “Examining the Influence of Actual-Ideal Self Discrepancies, Depression, and Escapism, on Pathological Gaming among Massively Multiplayer Online Adolescent Gamers.” Cyberpsychology, Behavior, and Social Networking 14 (9): 535–539. https://doi.org/10.1089/cyber.2010.0463.
- Li, D. D., A. K. Liau, and A. Khoo. 2013. “Player–Avatar Identification in Video Gaming: Concept and Measurement.” Computers in Human Behavior 29 (1): 257–263. https://doi.org/10.1016/j.chb.2012.09.002.
- Liew, L. W., V. Stavropoulos, B. L. Adams, T. L. Burleigh, and M. D. Griffiths. 2018. “Internet Gaming Disorder: The Interplay Between Physical Activity and User–Avatar Relationship.” Behaviour & Information Technology 37 (6): 558–574. https://doi.org/10.1080/0144929X.2018.1464599.
- Loewen, M. G., C. T. Burris, and L. E. Nacke. 2021. “Me, Myself, and Not-I: Self-Discrepancy Type Predicts Avatar Creation Style.” Frontiers in Psychology 11: 1902. https://doi.org/10.3389/fpsyg.2020.01902.
- Mancini, T., C. Imperato, and F. Sibilla. 2019. “Does Avatar's Character and Emotional Bond Expose to Gaming Addiction? Two Studies on Virtual Self-Discrepancy, Avatar Identification and Gaming Addiction in Massively Multiplayer Online Role-Playing Game Players.” Computers in Human Behavior 92:297–305. https://doi.org/10.1016/j.chb.2018.11.007.
- Mancini, T., and F. Sibilla. 2017. “Offline Personality and Avatar Customisation. Discrepancy Profiles and Avatar Identification in a Sample of MMORPG Players.” Computers in Human Behavior 69:275–283. https://doi.org/10.1016/j.chb.2016.12.031.
- Mîndrilă, D. 2010. “Maximum Likelihood (ML) and Diagonally Weighted Least Squares (DWLS) Estimation Procedures: A Comparison of Estimation Bias with Ordinal and Multivariate non-Normal Data.” International Journal for Digital Society 1 (1): 60–66. https://doi.org/10.20533/ijds.2040.2570.2010.0010.
- Morcos, M., V. Stavropoulos, J. J. Rennie, M. Clark, and H. M. Pontes. 2021. “Internet Gaming Disorder: Compensating as a Draenei in World of Warcraft.” International Journal of Mental Health and Addiction 19 (3): 669–685. https://doi.org/10.1007/s11469-019-00098-x.
- Müller, T., and C. Bonnaire. 2021. “Intrapersonal and Interpersonal Emotion Regulation and Identity: A Preliminary Study of Avatar Identification and Gaming in Adolescents and Young Adults.” Psychiatry Research 295:113627. https://doi.org/10.1016/j.psychres.2020.113627.
- Myers, N. D., S. Ahn, and Y. Jin. 2011. “Sample Size and Power Estimates for a Confirmatory Factor Analytic Model in Exercise and Sport: A Monte Carlo Approach.” Research Quarterly for Exercise and Sport 82 (3): 412–423. https://doi.org/10.1080/02701367.2011.10599773.
- Navarro, D., and D. Foxcroft. 2019. Learning statistics with jamovi: A tutorial for psychology students and other beginners (Version 0.70).
- Nunnally, J. C., and I. H. Bernstein. 1994. Psychometric Theory. New York: McGraw-Hill.
- Osgood, C. E., G. J. Suci, and P. H. Tannenbaum. 1957. The Measurement of Meaning. Chicago: University of Illinois Press.
- Peña, J., S. Khan, and C. Alexopoulos. 2016. “I am What I see: How Avatar and Opponent Agent Body Size Affects Physical Activity among men Playing Exergames.” Journal of Computer-Mediated Communication 21 (3): 195–209. https://doi.org/10.1111/jcc4.12151.
- Peña, J., and E. Kim. 2014. “Increasing Exergame Physical Activity Through Self and Opponent Avatar Appearance.” Computers in Human Behavior 41:262–267. https://doi.org/10.1016/j.chb.2014.09.038.
- Peña, J., B. J. Li, and R. Ratan. 2020. “Digital Embodiment and Improving Health Outcomes: Healthy Avatars Make for Healthy People.” In Technology and Health, edited by N. Brew-Sam and A. Chib, 27–47. San Diego, CA: Academic Press. https://doi.org/10.1016/B978-0-12-816958-2.00002-2.
- Pimentel, D., and S. Kalyanaraman. 2020. “Customizing Your Demons: Anxiety Reduction via Anthropomorphizing and Destroying an “Anxiety Avatar”.” Frontiers in Psychology 11:566682. https://doi.org/10.3389/fpsyg.2020.566682.
- Rahill, K. M., and M. M. Sebrechts. 2021. “Effects of Avatar Player-Similarity and Player- Construction on Gaming Performance.” Computers in Human Behavior Reports 4:100131. https://doi.org/10.1016/j.chbr.2021.100131.
- Ratan, R., D. Beyea, B. J. Li, and L. Graciano. 2020. “Avatar Characteristics Induce Users’ Behavioral Conformity with Small-to-Medium Effect Sizes: A Meta-Analysis of the Proteus Effect.” Media Psychology 23 (5): 651–675. https://doi.org/10.1080/15213269.2019.1623698.
- Ratan, R. A., and M. Dawson. 2016. “When Mii is Me: A Psychophysiological Examination of Avatar Self-Relevance.” Communication Research 43 (8): 1065–1093. https://doi.org/10.1177/0093650215570652.
- Ratan, R., and B. Hasler. 2009. "Self-presence standardised: Introducing the Self-Presence Questionnaire (SPQ)." Proceedings of the 12th Annual International Workshop on Presence, 1–8. Accessed from http://astro.temple.edu/~tuc16417/papers/Ratan_Hasler.pdf.
- Reise, S. P., W. E. Bonifay, and M. G. Haviland. 2013. “Scoring and Modeling Psychological Measures in the Presence of Multidimensionality.” Journal of Personality Assessment 95 (2): 129–140. https://doi.org/10.1080/00223891.2012.725437.
- Rheu, M. M., R. Ratan, Y. J. Sah, L. Cherchiglia, and T. Day. 2022. “Jogging in Your Avatar’s Footsteps: The Effects of Avatar Customization and Control Intuitiveness.” Frontiers in Virtual Reality 3:873689. https://doi.org/10.3389/frvir.2022.873689.
- Robitzsch, A., and O. Lüdtke. 2023. “Why Full, Partial, or Approximate Measurement Invariance are not a Prerequisite for Meaningful and Valid Group Comparisons.” Structural Equation Modeling: A Multidisciplinary Journal 30 (6): 1–12. https://doi.org/10.1080/10705511.2023.2191292.
- Rosseel, Y. 2012. “lavaan: An R Package for Structural Equation Modeling.” Journal of Statistical Software 48 (2): 1–36. https://doi.org/10.18637/jss.v048.i02.
- Sanchis-Sanchis, A., M. D. Grau, A. R. Moliner, and C. P. Morales-Murillo. 2020. “Effects of age and Gender in Emotion Regulation of Children and Adolescents.” Frontiers in Psychology 11:946. https://doi.org/10.3389/fpsyg.2020.00946.
- Satorra, A. 1990. “Robustness Issues in Structural Equation Modeling: A Review of Recent Developments.” Quality and Quantity 24 (4): 367–386. https://doi.org/10.1007/BF00152011.
- Schrader, C. 2019. “Creating Avatars for Technology Usage: Context Matters.” Computers in Human Behavior 93:219–225. https://doi.org/10.1016/j.chb.2018.12.002.
- Schwarz, G. 1978. “Estimating the Dimension of a Model.” The Annals of Statistics 6 (2): 461–464. https://doi.org/10.1214/aos/1176344136.
- Sibilla, F., and T. Mancini. 2018. “I am (not) my Avatar: A Review of the User-Avatar Relationships in Massively Multiplayer Online Worlds.” Cyberpsychology: Journal of Psychosocial Research on Cyberspace 12 (3): Article 4. https://doi.org/10.5817/CP2018-3-4.
- Stavropoulos, V., R. Gomez, A. Mueller, M. Yucel, and M. Griffiths. 2020. “User-avatar Bond Profiles: How do They Associate with Disordered Gaming?” Addictive Behaviors 103:106245. https://doi.org/10.1016/j.addbeh.2019.106245.
- Stavropoulos, V., J. Pinches, M. Morcos, and H. Pontes. 2019. “My Avatar, my Self.” Inpsych 41(5). Accessed from https://www.psychology.org.au/for-members/publications/inpsych/2019/october/My-avatar,-my-self.
- Stavropoulos, V., R. Ratan, and K. M. Lee. 2022. “Editorial: User-Avatar Bond: Risk and Opportunities in Gaming and Beyond.” Frontiers in Psychology 13: 923146. https://doi.org/10.3389/FPSYG.2022.923146.
- Stone, J. A. 2021. “Uncovering the Meaning: Exploring Semantic Differences in US Perceptions of “Gamer” and Game Players.” Games and Culture 16 (7): 907–931. https://doi.org/10.1177/15554120211005234.
- Szolin, K., D. Kuss, F. Nuyens, and M. Griffiths. 2022. “Gaming Disorder: A Systematic Review Exploring the User-Avatar Relationship in Videogames.” Computers in Human Behavior 128:107124. https://doi.org/10.1016/j.chb.2021.107124.
- Tabachnick, B. G., and L. S. Fidell. 2007. Using Multivariate Statistics. 5th ed. Pearson/Allyn & Bacon.
- Takashima, K., Y. Omori, Y. Yoshimoto, Y. Itoh, Y. Kitamura, and F. Kishino. 2008. “Effects of Avatar's Blinking Animation on Person Impressions.” In Proceedings of the 2008 Conference on Graphics Interface, 169–176. Canadian Information Processing Society.
- Tierney, N., D. Cook, M. McBain, F. Colin, M. O'Hara-Wild, J. Hester, L. Smith, and A. Heiss. 2021. Naniar: data structures, summaries, and visualisations for missing data. R package version 0.6.1. Accessed from https://cloud.r-project.org/web/packages/naniar/index.html.
- Tisseron, S. 2009. “L’ado et ses Avatars [The Teen and his Avatars].” Revue Adolescence 27 (3): 591–600. https://doi.org/10.3917/ado.069.0591.
- Tsaousis, I., and M. H. Alghamdi. 2022. “Examining Academic Performance Across Gender Differently: Measurement Invariance and Latent Mean Differences Using Bias-Corrected Bootstrap Confidence Intervals.” Frontiers in Psychology 13:896638. https://doi.org/10.3389/fpsyg.2022.896638.
- Van Looy, J., C. Courtois, and M. De Vocht. 2013. “Self-discrepancy and MMORPGs: Testing the Moderating Effects of Avatar Identification and Pathological Gaming in World of Warcraft.” In Multiplayer, edited by S. Kröger and T. Quandt, 234–242. Routledge.
- Van Looy, J., C. Courtois, M. De Vocht, and L. De Marez. 2012. “Player Identification in Online Games: Validation of a Scale for Measuring Identification in MMOGs.” Media Psychology 15 (2): 197–221. https://doi.org/10.1080/15213269.2012.674917.
- Virtič, M. P., and A. Šorgo. 2022. “Lower Secondary School Experiences as Predictors of Career Aspirations Toward Engineering, and Production and Processing Occupations.” European Journal of Engineering Education 47 (5): 833–850. https://doi.org/10.1080/03043797.2022.2033169.
- Williams, B., A. Onsman, and T. Brown. 2010. “Exploratory Factor Analysis: A Five-Step Guide for Novices.” Australasian Journal of Paramedicine 8 (3): 1–13. https://doi.org/10.33151/ajp.8.3.93.
- Xia, Y., and Y. Yang. 2019. “RMSEA, CFI, and TLI in Structural Equation Modeling with Ordered Categorical Data: The Story They Tell Depends on the Estimation Methods.” Behavior Research Methods 51 (1): 409–428. https://doi.org/10.3758/s13428-018-1055-2.
- Xu, Z., O. Turel, and Y. Yuan. 2012. “Online Game Addiction among Adolescents: Motivation and Prevention Factors.” European Journal of Information Systems 21 (3): 321–340. https://doi.org/10.1057/ejis.2011.56.
- You, S., E. Kim, and D. Lee. 2017. “Virtually Real: Exploring Avatar Identification in Game Addiction among Massively Multiplayer Online Role-Playing Games (MMORPG) Players.” Games and Culture 12 (1): 56–71. https://doi.org/10.1177/1555412015581087.
- Zhong, Z. J., and M. Z. Yao. 2013. “Gaming Motivations, Avatar-Self Identification and Symptoms of Online Game Addiction.” Asian Journal of Communication 23 (5): 555–573. https://doi.org/10.1080/01292986.2012.748814.