Abstract
An analytical slip-flow model based on second-order boundary conditions was proposed for gaseous flow in rectangular microchannels. An experimental setup has been designed for the measurement of gaseous micro flow rates under controlled temperature and pressure conditions. Data relative to nitrogen and helium flows through rectangular microchannels, from 4.5 to 0.5 μm in depth and with aspect ratios from 1–9%, are presented and analyzed. A method is proposed to eliminate the main source of uncertainty, which is the imprecision when measuring the dimensions of the microchannel cross-section. It is shown that in rectangular microchannels, the proposed second-order model is valid for Knudsen numbers up to about 0.25, whereas the first-order model is no longer accurate for values higher than 0.05. The best fit is found for a tangential momentum accommodation coefficient σ = 0.93, both with helium and nitrogen.
Research in microfluidics has become particularly active for a few years, and the literature is now full of novelty dealing with particular applications or fundamental aspects [Citation1–4]. At present, with regard to flows through microchannels, the knowledge is more advanced for gaseous than for liquid flows. The main effects encountered in gaseous microflows, namely rarefaction and compressibility, are well identified. Nevertheless, for many applications (for example, in the medical or chemical fields), precise predictive models are required. Moreover, it is interesting to have analytical or semi-analytical models of the flows, especially for the optimization of microdevices requiring a system approach.
Gaseous steady flows in long microducts have been numerically [Citation5–11], analytically, and experimentally [Citation2, 12–25] studied by several authors. In microducts, the Knudsen number
For Knudsen numbers greater than about 10−3, the classic model based on the Navier-Stokes equation with no-slip boundary conditions (noted NS in the text) is no longer valid, and a velocity slip at the wall must be taken into account. The corresponding slightly rarefied flow is the so-called slip flow, for which the Navier-Stokes equation remain usable, provided they are associated with appropriate boundary conditions. Up to Kn≈ 0.1, the Maxwell-Smoluchowski first-order boundary conditions, which express a velocity and temperature jump at the wall, may be used. Based on a momentum and an energy balance near the wall, they show that the velocity and the temperature at the wall are proportional to their respective transverse gradients. If the Knudsen number increases, this first-order slip-flow model (noted S1 in the text) is no longer valid: the differences between the predictions of the model and the experimental data become significant.
The question we have tried to answer is, is it possible to extend the limit of the Navier-Stokes equation applicability (Kn < 0.1) using second-order boundary conditions? We can note that the unified form of boundary conditions proposed by [Citation26], though more general than the form of second-order boundary conditions, do not easily permit the development of analytical or semi-analytical models, since some parameters need a calibration based on experiments or on numerical simulations of the Boltzmann equation.
FLOW MODEL
For this reason, the proposed model (noted S2 in the text) is based on second-order boundary conditions. S2 has been written for gaseous flows in rectangular microchannels, and it completes a series of previous analytical second-order models proposed by other authors for circular microtubes [Citation27] or between parallel plates [Citation28]. It is based on the Deissler second-order boundary conditions [Citation29], which take the dimensionless form
It is important to note that other second-order boundary conditions are proposed in the literature, and that some of them [Citation33] lead to a predicted flow rate lower than the one given by a first order slip flow model. Therefore, precise experimental data were required to justify the present choice of Deissler in preference to other boundary conditions.
EXPERIMENTAL SETUP
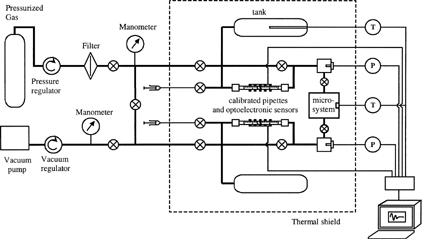
An experimental setup has been designed [Citation34] for the measurement of gaseous microflows under controlled temperature and pressure conditions in the range 10−7 to 10−13m3 s−1. Its main advantage, compared with the setups presented in the literature, is the simultaneous measurement of the flow rate both upstream and downstream from the microsystem (see ). The volume flow rate is measured by means of opto-electronical sensors that detect the passage of a liquid drop injected into two calibrated pipettes connected upstream and downstream from the microsystem.
FIG. 1 Experimental setup for the measurement of gaseous microflows.
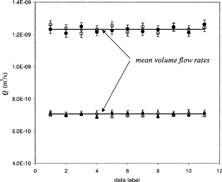
A series of individual measures of the volume flow rate can be obtained, which allows to determine the mean volume flow rates upstream and downstream from the microsystem, and, consequently, the mass flow rate through the microsystem. The comparison of the individual data given by each pipette as well as the comparison of the two mean mass flow rates deduced from the two mean volume flow rates must be consistent with the experimental uncertainties for the acquisition to be validated.
A typical example is shown in . The upper data (circles) correspond to the downstream pipette, and the lower ones (triangles) to the upstream pipette, through which the volume flow rate is lower since the pressure is higher. The white symbols are relative to the first of the two interfaces of the drop in the pipette, and the dark symbols are relative to the second. In total, 44 individual data are obtained for each test. Experimental uncertainties are reported by vertical strokes.
FIG. 2 Typical example of volume flow rate measurement.
MICROCHANNELS
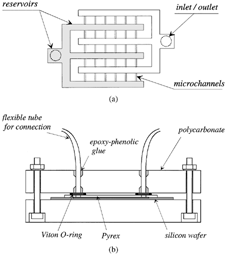
The microchannels have been etched by DRIE (Deep Reactive Ion Etching) in a silicon wafer and closed with Pyrex by anodic bounding. The cross-sections are rectangular, and several identical microchannels are arranged in parallel in order to obtain a sufficient flow rate to be measured with a good precision (see ).
FIG. 3 (a) Top view of the microchannels etched in a silicon wafer (b) and front view of the wafer with its outer connections.
The characteristics of the wafers are summarized in . The widths of the microchannels have been measured with an optical microscope, and their depths have been measured with a Tencor P1 profilometer. They range from 4.5 to 0.5 μm, with aspect ratios a from 1–9%. It has been shown that for an outlet Knudsen number Kn o = 0.1, a plane flow model overestimates the rate flow, typically by about 1% for a = 0.01 and about 6% for a = 0.1 [Citation34]. For this reason, it is necessary to use the rectangular flow model for comparison with our experimental data.
TABLE 1 Characteristics of the tested microchannels
The arrangement of the microchannels and the deep reservoirs on the wafer is shown in . The connection with the experimental setup is achieved by flexible tubes and o-rings using an assembly that does not require any gluing onto the Pyrex ().
For the comparison of the experimental measures of flow rate with the predictions from different models, the sources of error or uncertainty may be globally divided into three classes:
-
The uncertainties inherent to the fluid properties (e.g., density, viscosity, dissolved air) and to their dependence towards the experimental parameters (temperature, pressure). One can also note that some properties, such as the momentum accommodation coefficient σ, depend both on the fluid and the wall.
-
The uncertainties relative to the microchannel geometrical characteristics (e.g., dimensions of the section and roughness) and their dispersion.
-
The uncertainties due to the flow rate measurement (e.g., metrology, leakage, operating conditions).
Most of these uncertainties can be limited within an acceptable precision. That is generally not the case for the measurement of the cross-section dimensions. When these dimensions are of the order of one micrometer, the measures obtained by different means (profilometer, optical microscope, SEM) can differ notably: about 5% for the width and about 10% for the depth [Citation35]. These measures are in fact hardly exploitable, since the hydraulic diameter plays a part to the power of four in the calculation of the flow rate. The second parameter that can pose a problem is the accommodation coefficient, σ, the value of which is not usually well known.
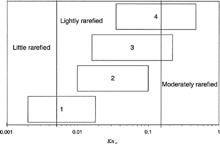
In order to avoid interpretation errors due to these two mains sources of uncertainty, the idea is to compare among themselves data measured on the same wafer. The four tested wafers can cover a large range of outlet Knudsen number (), changing the pressure levels or the nature of the gas. Consequently, different regimes can be met with a same wafer.
-
In the little rarefied regime, differences between the flow rates predicted by NS, S1, and S2 models are negligible, of the order of the experimental uncertainties. The value of σ does not play any significant role.
-
In the lightly rarefied regime, the difference between models S1 and S2 remains negligible, but the difference with the model NS is now significant.
-
In the moderately rarefied regime, the models NS, S1, and S2 predict significantly different flow rates.
FIG. 4 Range of outlet Knudsen numbers for the experimental data.
ANALYSIS OF EXPERIMENTAL DATA
In the following figures, experimental and theoretical mass flow rates are plotted in a function of the inlet over outlet pressure ratio Π. For wafer n°1, measurements are performed for low values of Kn o , that is, for high values of the outlet pressure P o . The depth 2h kept for the simulation is adjusted to 4.48 μm—exactly the measured value ()—for a good correlation between the experimental data and S1 or S2 models (). This value will be retained for all the experiments with wafer n°1. The two dashed lines show the influence of the depth uncertainty.
FIG. 5 Theoretical and experimental mass flow rates. Wafer n°1, 2h = 4.48 μm, T = 294.2 K. a) gas: N2, 0.002 ≤ Kn o ≤ 0.008, P o = 1.9 · 105 Pa; b) same conditions, comparison between plane and rectangular models; c) gas: N2, 0.005 ≤ Kn o ≤ 0.018, P o = 0.82 · 105 Pa.
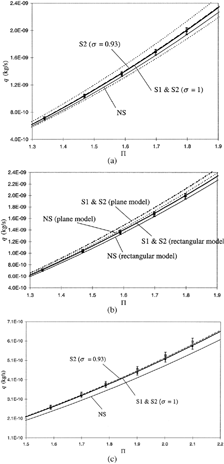
The Knudsen numbers are not high enough to have a significant difference with the no-slip (NS) model, but the influence of the lateral walls must be taken into account (). If we increase the rarefaction, decreasing the outlet pressure (), the difference between NS and S1 or S2 models becomes significant, and the experimental data are in good agreement with the slip flow models. The influence of σ is still negligible.
The same procedure is followed for the other wafers. For wafer n°2 (), the depth is adjusted to 1.88 μm—0.04 μm more than the measured value, which is compatible with the experimental precision. When the rarefaction is increased (), the influence of the value of σ becomes noticeable, and the best fit is obtained for σ = 0.93. The first tests were made with nitrogen, but the same value for σ gives also the best fit for tests with helium () for similar values of the Knudsen number obtained for a much lower outlet pressure. This value σ = 0.93 will be kept for comparison with the other data.
FIG. 6 Theoretical and experimental mass flow rates. Wafer n°2, 2h = 1.88 μm, T = 294.2 K. a) gas: N2, 0.01 ≤ Kn o ≤ 0.017, P o = 2 · 105 Pa; b) gas: N2, 0.027 ≤ Kn o ≤ 0.053, P o = 0.65 · 105 Pa; c) gas: He, 0.029 ≤ Kn o ≤ 0.053, P o = 1.9 · 105 Pa; d) gas: He, 0.05 ≤ Kn o ≤ 0.1, P o = 1.026 · 105 Pa.
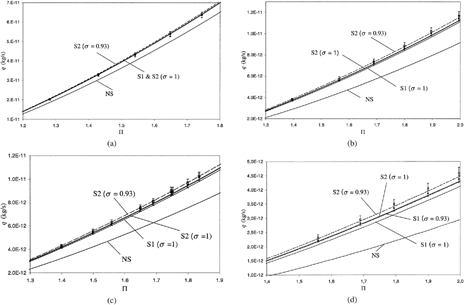
If rarefaction is more increased (), a difference appears between S1 and S2 models, and the experimental data follow the second-order slip flow model. Nevertheless, this difference is not very high. Rarefaction must be increased even more, and can be achieved with the wafers n°3 and n°4.
The previous remarks are confirmed with the wafer n°3. The value of the depth is adjusted to 1.16 μm, 0.01 μm more than the measured value () for low values of Kn o , for which both S1 and S2 models accurately predict the experimental flow rates.
FIG. 7 Theoretical and experimental mass flow rates. Wafer n°3, 2h = 1.16 μm, T = 294.2 K. a) gas: N2, 0.016 ≤ Kn o ≤ 0.03, P o = 1.9 · 105 Pa; b) gas: N2, 0.04 ≤ Kn o ≤ 0.09, P o = 0.65 · 105 Pa; c) gas: He, 0.05 ≤ Kn o ≤ 0.09, P o = 1.9 · 105 Pa; d) gas: He, 0.1 ≤ Kn o ≤ 0.22, P o = 0.75 · 105 Pa.
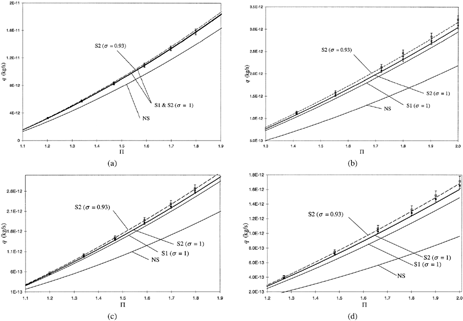
An increase of the rarefaction leads to a difference between these two models. The agreement is good between the experimental data and the S2 model—whatever the gas, nitrogen () or helium ()—with σ = 0.93. The rarefaction is increased even more, and the difference between S1 and S2 models becomes very significant (). The experiment confirms here the validity of the second-order slip flow model with Knudsen numbers higher than 0.2.
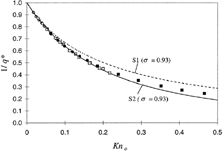
This trend is confirmed with the wafer n°4 up to Knudsen numbers around 0.25. For higher values (tested up to 0.47), the agreement is not so good. An attempt to summarize the results obtained with the wafers n°2, 3, and 4 for nitrogen and helium flows is shown in . The dimensionless flow rate q* = q/q NS, hardly sensitive to the aspect ratio a, is plotted in function of Kn o . Up to Kn o = 0.05, the first-order (S1) and the second-order (S2) slip flow models predict the same flow rate. For higher values of Kn o , the difference is significant, and the experimental data are in very good agreement with the S2 model up to Kn o = 0.25. Beyond that, although the experimental data are closer to S2 than to S1 predictions, the agreement is not so fine.
FIG. 8 Inverse reduced flow rate (1/q*) in rectangular microchannels. Comparison of experimental data with 1st and 2nd order slip flow models. Π = 1,8; T = 294,2 K. Wafer n°2 (white), n°3 (grey), n°4 (black). Gas: N2 (circle) and He (square).
CONCLUSIONS
-
A second-order model for slip flow in rectangular microchannels has been proposed. It takes into account the 3-D effects due to the rectangular geometry of the microchannels cross-section, which are not negligible for aspect ratio higher than 0.01.
-
A specific set-up has been built for the precise determination of gas microflows, with a double measurement (upstream and downstream) from the microchannel.
-
A technique has been proposed to avoid the analysis errors due to the main sources of uncertainties, namely, the imprecision in the microchannel depth value and the difficulty for the momentum accommodation coefficient determination.
-
Experimental data have shown that this second-order slip flow model (S2) is more precise than a first-order one (S1), which underestimates the flow rate when the Knudsen numbers are higher than 0.05. The S2 model is predictive with high precision up to Kn o = 0.25. It is an indirect confirmation that Deissler boundary conditions are more interesting than others proposed in the literature, which predict a flow rate lower than the one obtained with a S1 model.
-
A good agreement has been found for all the data with a momentum accommodation coefficient σ = 0.93 for both nitrogen and helium experiments.
-
Further experiments will attempt to confirm these first results and check the influence of several parameters, as the nature of the fluid and the wall (e.g., material, roughness, and surface treatment).
NOMENCLATURE
| a | = |
aspect ratio, h/b, dimensionless |
| b | = |
half width, m |
| h | = |
half depth, m |
| Kn | = |
Knudsen number, λ/2h, dimensionless |
| P | = |
pressure, Pa |
| q | = |
mass flow rate, kg s−1 |
| q* | = |
mass flow rate, q/q NS, dimensionless |
| T | = |
temperature, K |
| W | = |
longitudinal velocity, ms−1 |
Greek
| λ | = |
mean free path, m |
| Π | = |
pressure ratio, P i /P o , dimensionless |
| σ | = |
tangential momentum accommodation coefficient, dimensionless |
Subscript
| i | = |
inlet |
| o | = |
outlet |
| NS | = |
no-slip model |
| S1 | = |
1st order slip-flow model |
| S2 | = |
2nd order slip-flow model |
Acknowledgments
The authors thank Dr. H. Camon, M. Dilhan, and J. Tasselli from the LAAS-CNRS laboratory of Toulouse, without whom the different microchannels could not have been properly realized.
Related Research Data
REFERENCES
- Gad-el-Hak , M. 2002 . The MEMS Handbook , New York : CRC Press .
- Karniadakis , G. E. and Beskok , A. 2002 . Microflows: Fundamentals and Simulation , New York : Springer-Verlag .
- Tay , F. E. H. 2002 . Microfluidics and BioMEMS Applications , Boston : Kluwer Academic Publishers .
- Zohar , Y. 2003 . Heat Convection in Micro Ducts , Boston : Kluwer Academic Publishers .
- Beskok , A. , Karniadakis , G. E. and Trimmer , W. 1996 . Rarefaction and Compressibility Effects in Gas Microflows . J. Fluids Eng. , vol. 118 : pp. 448 – 456 .
- Beskok , A. and Karniadakis , G. E. 1994 . Simulation of Heat and Momentum Transfer in Complex Microgeometries . J. Thermophys. Heat Transf. , vol. 8 ( no. 4 ) : pp. 647 – 655 .
- Chen , C. S. , Lee , S. M. and Sheu , J. D. 1998 . Numerical Analysis of Gas Flow in Microchannels . Numer. Heat Transf., A , vol. 33 : pp. 749 – 762 .
- Kavehpour , H. P. , Faghri , M. and Asako , Y. 1997 . Effects of Compressibility and Rarefaction on Gaseous Flows in Microchannels . Numer. Heat Transf., A , vol. 32 : pp. 677 – 696 .
- Oh , C. K. , Oran , E. S. and Sinkovits , R. S. 1997 . Computations of High-Speed, High Knudsen Number Microchannel Flows . J. Thermophys. Heat Transf. , vol. 11 ( no. 4 ) : pp. 497 – 505 .
- Piekos , E. S. and Breuer , K. S. 1996 . Numerical Modeling of Micromechanical Devices Using the Direct Simulation Monte Carlo Method . J. Fluids Eng. , vol. 118 : pp. 464 – 469 .
- Sharipov , F. 1999 . Rarefied Gas Flow Through a Long Rectangular Channel . J. Vac. Sci. Technol. A , vol. 17 ( no. 5 ) : pp. 3062 – 3066 .
- Arkilic , E. B. , Breuer , K. S. and Schmidt , M. A. 1994 . “ Gaseous Flow in Microchannels ” . In Application of Microfabrication to Fluid Mechanics , pp. 57 – 66 . New York : ASME .
- Arkilic , E. B. 1994 . Gaseous Flow in Micron-Sized Channels , Cambridge, MA : Department of Aeronautics and Astronautics, Massachusetts Institute of Technology . Master thesis
- Arkilic , E. B. , Schmidt , M. A. and Breuer , K. S. 1997 . Gaseous Slip Flow in Long Microchannels . IEEE J. Microelectromech. Syst. , vol. 6 ( no. 2 ) : pp. 167 – 178 .
- Ameel , T. A. , Wang , X. , Barron , R. F. and Warrington , R. O. J. 1997 . Laminar Forced Convection in a Circular Tube with Constant Heat Flux and Slip Flow . Microscale Thermophys. Eng. , vol. 1 ( no. 4 ) : pp. 303 – 320 .
- Choi , S. B. , Barron , R. F. and Warrington , R. O. 1991 . “ Fluid Flow and Heat Transfer in Microtubes, vol. DSC-32 ” . In ASME Winter Annual Meeting , pp. 123 – 133 . New York : ASME .
- Harley , J. C. 1993 . Compressible Gas Flows in Microchannels and Microjets , Department of Mechanical Engineeering and Applied Mechanics, University of Pennsylvania . Ph.D. Thesis
- Harley , J. C. , Huang , Y. , Bau , H. H. and Zemel , J. N. 1995 . Gas Flow in Micro-Channels . J. Fluid Mech. , vol. 284 : pp. 257 – 274 .
- Liu , J. , Tai , Y.-C. and Ho , C.-M. 1995 . “ MEMS for Pressure Distribution Studies of Gaseous Flows in Microchannels ” . In 8th Ann. Int. Workshop MEMS. An Investigation of Micro Structures, Sensors, Actuators, Machines, and Systems , pp. 209 – 215 . Amsterdam : IEEE .
- Pfahler , J. , Harley , J. , Bau , H. and Zemel , J. N. 1991 . Gas and Liquid Flow in Small Channels , pp. 49 – 60 . New York : ASME .
- Pong , K.-C. , Ho , C.-M. , Liu , J. and Tai , Y.-C. 1994 . “ Non-Linear Pressure Distribution in Uniform Microchannels ” . In Application of Microfabrication to Fluid Mechanics , Edited by: Bandyopadhyay , P. R. , Breuer , K. S. and Blechinger , C. J. vol. FED-197 , 51 – 56 . New York : ASME . ASME Winter Annual Meeting, Chicago
- Shih , J. C. , Ho , C.-M. , Liu , J. and Tai , Y.-C. 1996 . Monatomic and Polyatomic Gas Flow Through Uniform Microchannels , pp. 197 – 203 . New York : ASME .
- Guo , Z. Y. and Wu , X. B. 1998 . Further Study on Compressibility Effects on the Gas Flow and Heat Transfer in a Microtube . Microscale Thermophys. Eng. , vol. 2 ( no. 2 ) : pp. 111 – 120 .
- Guo , Z. Y. and Wu , X. B. 1997 . Compressibility Effect on the Gas Flow and Heat Transfer in a Microtube . Int. J. Heat Mass Transfer , vol. 40 ( no. 13 ) : pp. 3251 – 3254 .
- Rostami , A. A. , Mujumdar , A. S. and Saniei , N. 2002 . Flow and Heat Transfer for Gas Flowing in Microchannels: A Review . Heat Mass Transf. , vol. 38 ( no. 4–5 ) : pp. 359 – 367 .
- Beskok , A. and Karniadakis , G. E. 1999 . A Model for Flows in Channels, Pipes, and Ducts at Micro and Nano Scales . Microscale Thermophys. Eng. , vol. 3 ( no. 1 ) : pp. 43 – 77 .
- Sreekanth , A. K. 1969 . “ Slip Flow Through Long Circular Tubes ” . In 6th International Symposium on Rarefied Gas Dynamics , Edited by: Trilling , L. and Wachman , H. Y. pp. 667 – 680 . New York : Academic Press .
- Mitsuya , Y. 1993 . Modified Reynolds Equation for Ultra-Thin Film Gas Lubrication Using 1,5-order Slip-Flow Model and Considering Surface Accommodation Coefficient . J. Tribol. , vol. 115 : pp. 289 – 294 .
- Deissler , R. G. 1964 . An Analysis of Second-Order Slip Flow and Temperature-Jump Boundary Conditions for Rarefied Gases . Int. J. Heat Mass Transfer , vol. 7 : pp. 681 – 694 .
- Aubert , C. and Colin , S. 2001 . High-Order Boundary Conditions for Gaseous Flows in Rectangular Microchannels . Microscale Thermophys. Eng. , vol. 5 ( no. 1 ) : pp. 41 – 54 .
- Ebert , W. A. and Sparrow , E. M. 1965 . Slip Flow in Rectangular and Annular Ducts . J. Basic Eng. , vol. 87 : pp. 1018 – 1024 .
- Morini , G. L. and Spiga , M. 1998 . Slip Flow in Rectangular Microtubes . Microscale Thermophys. Eng. , vol. 2 ( no. 4 ) : pp. 273 – 282 .
- Chapman , S. and Cowling , T. G. 1952 . The Mathematical Theory of Non-Uniform Gases , Cambridge : University Press .
- Lalonde , P. 2001 . Etude Expérimentale D'Écoulements Gazeux dans les Microsystèmes à Fluides , Toulouse : Institut National des Sciences Appliquées . Ph.D. Thesis
- Anduze , M. 2000 . Etude Expérimentale et Numérique de Microécoulements Liquides dans les Microsystèmes Fluidiques , Toulouse : Institut National des Sciences Appliquées . Ph.D. Thesis