
Abstract
This paper focuses on suitable solar–thermal collectors for use in a combined heat and power system targeted at the UK market, based on an organic Rankine cycle. Concentrating and non-concentrating collector products are compared by way of annual energy and exergy analyses using London climate data. It is found that non-concentrating collectors show a wide range of annual power outputs, up to a highest of 67 kWh m−2 yr−1 attained by the best collector (or an average power of 115 W for a 15-m2 rooftop array, representing 30% of the electrical demand in a typical UK household). The maximum exergy delivered from a parabolic trough collector is 70 kWh m−2 yr−1. The choice of mains (municipal) water or air as the cooling medium makes only a small difference to the annual power output. Importantly, the optimal flow rates for the evacuated tube collectors are far lower than those recommended by the manufacturers, indicating that their application to power generation represents a significant departure from their design and intended mode of operation. New and improved designs would be a key development in this area. The importance of using high-resolution, non-aggregated climate data for predicting total annual work output is also demonstrated.
INTRODUCTION
Considerable progress has been made recently in the development of organic Rankine cycle (ORC) systems for small-scale power generation from solar energy. This has led to the potential for using low-cost solar-thermal collectors for power generation in domestic applications. In an earlier work [Citation1], the authors presented a techno-economic model of a domestic solar combined heat and power system featuring an ORC system with a generalized positive displacement expander and R245fa as the working fluid. The annual performance of such a system in the UK climate was simulated and it was found that the system had the potential to generate power in the region of 80–90 W on average over the year for a rooftop solar collector array size of 15 m2 (equivalent to an average power density of 5.3–6.0 W per m2 of collector area and 21–24% of the electrical demand in a typical UK household). It was also noted that there was the potential to further improve the power produced through the use of a more suitable collector and variable control of system flow rates, as well as by optimizing the design of key ORC components.
In the aforementioned study, a concentrating parabolic collector trough (PTC) and a non-concentrating evacuated tube collector (ETC) were compared as the heat source for the system. The ETC was assumed to be of fixed orientation, while the PTC was assumed to track the sun perfectly. Although concentrating collectors can produce high temperatures in direct sunlight, non-concentrating collectors are able to use diffuse sunlight scattered by clouds, which forms a significant component of the irradiance received in the United Kingdom (approximately 60% annually [Citation2]). The difference in annual power production between the two collectors simulated was found to be small (of the order of 10%); thus, it was concluded that owing to its appreciably higher cost and operational complexity, the PTC did not offer a significant advantage over the ETC in the United Kingdom.
Operational solar-ORC systems in the literature have featured a range of solar collector designs, both concentrating and non-concentrating. Systems featuring flat-plate and evacuated-tube collectors have demonstrated overall efficiencies in the region of 3–5% [Citation3, Citation4], while others featuring concentrating parabolic trough collectors have demonstrated higher overall efficiencies in the region of 7–12% [Citation5, Citation6]. For the non-concentrating collector systems, the reported temperature of heat input to the cycle is in the range 50–100°C, whereas for the concentrating collector systems the heat input temperatures are in the range 100–300°C. All of these systems were modeled or tested in geographical locations with climates of moderate to high solar resource, specifically, Athens, Greece (latitude 38° N, insolation 1800–1900 kWh m−2 yr−1); Tianjin, China (latitude 39° N, insolation 1300–1400 kWh m−2 yr−1); Lesotho (latitude 29° S, insolation 2000–2100 kWh m−2 yr−1); and Arizona (latitude 33° N, insolation 2100–2200 kWh m−2 yr−1).Footnote* To the best of the authors’ knowledge, there has at present been no such experimental evaluation of a solar-ORC system in a location as far north as London, UK (latitude 52° N, insolation 1000–1100 kWh m−2 yr−1). Furthermore, the sizes of the solar collector arrays in the systems just mentioned (30–10,000 m2) are significantly larger than what could be accommodated on the roof of a domestic dwelling, which for a UK home is typically 15 m2 [Citation8].
An in-depth study is now required to consider a range of existing small-scale solar collector products and their potential suitability for such an application in the UK climate. The maximum power production from a solar-powered heat engine is a trade-off between the thermal efficiency of the heat engine, which increases at higher source temperatures, and the efficiency of the collector, which decreases as its temperature becomes significantly higher than its surroundings. Maximum work production can be evaluated by way of a second-law “exergy” analysis. A number of other studies have featured second-law analyses of solar–thermal systems in order to identify improvements in energy utilization. Xiaowu and Ben [Citation9], for example, examined solar collector design parameters, in particular the absorber plate dimensions, in order to maximize the exergy efficiency of a solar hot-water system. Jafarkazemi and Ahmadifard [Citation10] evaluated the first-law and second-law efficiencies of a flat-plate collector as a function of inlet temperature and mass flow rate, again highlighting potential considerations for improved design of the absorber plate.
Endoreversible and finite-time/finite-size thermodynamic analyses have been employed to assess the optimal design and operating conditions of solar-thermal driven heat engines [Citation11–Citation14]. A fundamental characteristic of these approaches concerns the assumption of a reversible Carnot engine operating between internal heat addition and heat rejection temperatures experienced by the working fluid as this undergoes the cycle that are different from the external hot and cold temperatures from/to which the heat is taken/rejected. Although they do make an attempt to consider this irreversibility due to heat transfer across the external and internal temperature differences, these analyses are otherwise ideal. Thus, the power output from a real engine will always deviate from (and if the internal temperature in the theoretical cycle is close to the operating conditions of the real engine, be lower than) endoreversible maximum power predictions, due to other forms of irreversibility (e.g., associated with heat losses, friction, etc.). Nonetheless, these relatively simple endoreversible analyses do allow important performance-related parameters such as the efficiency, power and specific power (ratio of power to mass flow rate in the cycle), power density (ratio of power to solar collector area), or power output per unit cost (assuming cost of plant proportional to total heat transfer area) to be maximized through optimization of system parameters such as fluid temperatures and heat exchanger surface areas.
The efficiency of an endoreversible cycle at maximum power output is that found by Curzon and Ahlborn [Citation15]. The endoreversible analysis in which the Curzon–Ahlborn efficiency is used to derive an expression for maximum power (as is the case in this paper) is based on an assumption of heat transfer into and out of the cycle by convection or conduction. Thus, when applied to a solar engine, this analysis is suitable when the heat source is the fluid stream leaving the collector, which imparts heat to the cycle via a heat exchanger downstream of the collector. However, if the heat source is taken as the surface of the sun itself, and heat transfer into the cycle is dominated by radiation, then, as noted by Sahin [Citation11], the maximum power for the endoreversible engine is in fact higher than that predicted by the Curzon–Ahlborn efficiency due to the fourth-order relation between temperature and heat transfer. In the present work the analysis is performed downstream of the collector.
Another important consideration for an exergy analysis is the environmental reference state or “dead state” temperature. Ozgener et al. [Citation16] showed for a geothermal district heating system with an average heat source temperature of ∼95°C that the system's theoretical exergy efficiency undergoes significant variation (of about 5%) as the dead state temperature is allowed to vary over a range representative of ambient air temperatures (0–25°C).
The control of the collector temperature for maximum power output can be achieved by adjusting the flow rate of fluid through the collector with a variable pump and control system. Commercially available non-concentrating collectors are typically designed to deliver low output temperatures (<100°C) for water heating applications. Novel designs incorporating ultrathin channels can improve collector efficiency for lower flow rates, thereby achieving higher outlet temperatures [Citation17]. Other design features such as glazed coatings and step-finned absorber plates have been investigated in order to improve the efficiency of non-concentrating collectors [Citation18, Citation19], while internal and external absorber-tube fins have been explored to enhance the efficiency of parabolic trough collectors [Citation20, Citation21].
The present work approaches the subject with the aim of determining the maximum potential for power generation from a heat engine receiving thermal energy from a range of existing solar collector designs. The potential success of a system for the domestic market is increased by the current availability of low-cost collectors in an already mature market. Therefore, the internal exergy destruction in the collector as a result of its design is not evaluated in detail, but rather the maximization of exergy in the fluid stream leaving the collector is considered in order to compare the suitability of existing available products.
MODELING METHODOLOGY
Solar Collector Efficiency
Solar collector performance, as specified in European Standard EN 12975 [Citation22], is reported in the form of a collector efficiency, usually specified in the form:
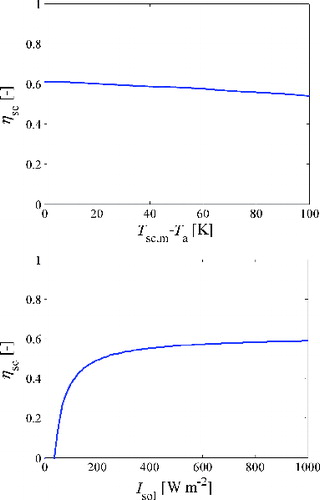
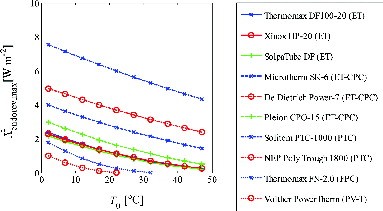
(1) where η0, c1, and c2, are coefficients determined empirically through testing, and T′m = (Tm − Ta)/Isol (the influences of the environmental parameters Ta and Isol on solar collector efficiency are shown in ). The enthalpy rise of the fluid stream (assumed to be water) passing through the collector is then:
(2)
The ETC collector performance coefficients used for the simulations in Reference 1 were for the Microtherm SK-6. This collector was chosen because of its high efficiency at high values of T′m, which is desirable in order to achieve the highest possible fluid temperatures; however, it has emerged through discussion with the former supplier, Microtherm Energietechnik GmbH, that the evacuated tubes used in this product have been discontinued by the manufacturer and as a result the collector is no longer commercially available.
In this study, a range of solar collectors with published efficiency curves are compared, including the Microtherm SK-6. Most of these collectors are commercially available on the European market (with the exception of the Microtherm collector as previously mentioned and the Solitem PTC1000 parabolic trough collector [Citation23], which is a prototype). The collector specifications are listed in . Six evacuated tube collectors are chosen for comparison (three of which feature compound parabolic concentrator [CPC] devices), as well as two small-scale PTC collectors and two flat plate (FPC) collectors (one of which is a hybrid PV-thermal (PVT) module). The ETC and PTC collectors chosen are, generally speaking, those whose efficiency curve displays a high efficiency (related to gross area) at high values of T′m, which is where previous work indicates that the collector would be operated for best performance.
Table 1 Solar–thermal collector properties
It is recognized that the curve coefficients may be misleading if the specific test conditions are not known. The European Standard only requires that collectors are tested within their recommended range of operation, and most collectors are designed for water-heating applications with relatively low temperature requirements (<100°C). Extrapolation of the efficiency curve outside the tested range may lead to errors in the calculated power output. Manufacturers’ specifications typically give ranges of recommended flow rates rather than temperatures, yet the stagnation temperature Tstag that is the maximum temperature reached by the collector for a zero-flow condition at peak irradiance can be considered the extreme upper limit of achievable temperature. In this study, only solar collectors with high values of Tstag (>250°C) are considered (with the exception of the FPC and PVT collectors).
Exergy Analysis
The collectors in are compared by evaluating the maximum exergy flow rate in the outlet fluid stream exiting the collector. The flow rate of exergy is calculated as the integral of the power produced by an infinite number of infinitesimal Carnot engines operating between the hot and cold fluid streams, where the hot stream is the fluid leaving the collector and the cold stream is the return to the collector. Each engine extracts an amount of heat from the hot stream until its temperature T1 is reduced to that of the surroundings/environment or “dead space,” T0. This analysis leads to the expression for the maximum power:
(3)
The enthalpy of the fluid stream used in this equation is that calculated in EquationEq. (2)
(2) for a known irradiance and ambient air temperature. For the maximum power scenario, it is assumed that the fluid is returned to the collector inlet at Tsc, in = T0.
The inherent assumption of full reversibility in the process of energy conversion to power downstream of the collector in EquationEq. (3)(3) carries an additional implicit assumption in the use of the Carnot cycle (and associated efficiency expression) across the entire temperature difference available between the external heat source (i.e., collector outlet fluid stream, T1) and external heat sink (i.e., collector return fluid stream, Tsc, in = T0). This is not possible in a practical system, since it requires that heat be transferred into and out of the cycle across a zero temperature difference. In an actual heat engine, during the heat addition and heat rejection processes the temperatures of the working fluid internal to the heat engine will be different (lower and higher, respectively) from the external temperatures of heat source and sink streams. The irreversibility introduced due to the heat transfer across these finite temperature differences will result in an exergy loss and a reduction in maximum work/power from the prediction of EquationEq. (3)
(3) . Therefore, in neglecting thermal irreversibilities, this expression results in an ideal maximum rather than a practical expectation of the power that can be generated by a solar-powered heat engine.
For the reasons already given, a fully reversible analysis is oversimplified and leads to results that are disconnected from practical experience of relevant systems (very significant overestimates of actual efficiency and power). In order to improve these estimates, one must include some information on the irreversibilities, due to heat transfer and otherwise. A complete analysis accounting of all loss mechanisms is the best way to understand and predict reliably the performance of the system being analyzed; however, this is a complex and time-consuming task, because one must first identify and then account accurately for all forms of irreversibility in the system. As mentioned previously in the introduction, an intermediate approach between these two extremes (fully reversible vs. accounting for all irreversibilities) is an endoreversible analysis, which is a simple way of obtaining a slightly improved prediction of realizable performance compared to a fully reversible analysis. In this approach the heat transfer into and that out of the cycle are modeled explicitly as functions of the temperatures of the heat source/sink and the cycle, while the cycle is still taken as internally (i.e., otherwise) reversible. The endoreversible approach then considers the compromise between the increased heat transfer allowed by higher temperature differences at the boundaries between the cycle and the heat source and sink, and the increased internal cycle efficiency when the same temperature differences are decreased. The main result from this analysis is obtained by identifying the (inner) cycle temperatures that maximize the work/power output from the cycle, given fixed external temperature. This leads to the so-called Curzon–Ahlborn efficiency relation , in place of the Carnot efficiency 1 − T0/T1 [Citation15].
A limitation that one must always consider when performing an endoreversible analysis arises from its focus only on the main thermal irreversibility (between the cycle and the external source/sink). This approach will be valid as long as the external irreversibilities related to heat transfer are actually the dominant mode of exergy loss in the heat engine under consideration. A possible way to interpret an endoreversible analysis is that of a “first-order” irreversibility analysis, which only focuses on the thermal irreversibility, assuming that this is dominant. Furthermore, an endoreversible analysis attempts to identify internal cycle conditions that maximize the work output from the heat engine. This may not correspond to the design of the actual engine and its practical implementation, but it is a reasonable thermodynamic starting point.
Returning to our system, if the Carnot efficiency is replaced by the Curzon–Ahlborn efficiency, we obtain a revised expression to EquationEq. (3)(3) :
(4) which describes the maximum efficiency of a “semi-ideal” endoreversible heat engine. For this endoreversible cycle it is assumed that the internal hot temperature T′1 and cold temperature T′0 of the cycle are lower and higher, respectively, than the external temperatures of the source (T1) and sink (T0), and the Curzon–Ahlborn efficiency is then that of a reversible Carnot cycle operating between T′1 and T′0. The result of evaluating the exergy flow rate from the collector for an endoreversible rather than a fully reversible heat engine is a lower but more realistic value of maximum power production, representing a practical maximum of what might be achieved for an optimally designed system. In the Results section of this paper, the calculated exergy outputs from both equations are compared.
Heat Rejection and Cold Sink Temperature
When maximizing the efficiency of the solar-driven heat engine it is thermodynamically desirable to reject heat at the lowest possible temperature. However, the choice of the cooling medium is limited by the available resources. In our earlier study [Citation1], mains (municipal) cold water was selected as the cooling medium as it tends to be available at a lower temperature than ambient air during summer when solar potential is highest. However, it was found that the volume of cooling water required (1.6 m3 kWh−1 for the lowest ORC condensation temperature) would lead to high running costs unless a locally free source of water was available. A further simplification in that study was that municipal water is available at a constant temperature throughout the year. In reality, municipal water temperature usually exhibits a seasonal fluctuation, the extent of which varies geographically. The average mains water temperature in the United Kingdom as reported by Murphy [Citation24] is 10°C with a seasonal variation of ± 2.6°C, although local municipal water temperatures can reach local extremes of 4°C in the winter and 25°C in the summer, according to the advisory body Water-UK [Citation25].
As part of the current analysis, air and water are compared as heat rejection media. The air temperature is assumed to vary with the local ambient condition, whereas that of water is modeled as a sinusoidal oscillation about a 10°C mean and with a 2.6°C amplitude. The peaks and troughs are set to coincide approximately with those of the local air temperature (peak in late July and trough in late January). A plot of monthly mean air and mains water temperatures is shown in .
Annual Assessment Using Solar Irradiance Data
This paper shows results from an assessment of the maximum power generation capability of each solar collector using London climate data over an annual period. Two approaches are taken with regard to the climate data used for the assessment. In the first approach, London climate data are taken from the PVGIS database [Citation2]. This is an online tool that generates a diurnal incident solar irradiance profile for a surface with a specified tilt angle and for a specified month of the year. The profile data is available at a resolution of 4 data points per hour (1 per 15 minute period), and each value represents an average measurement over a 10-year period (from 1981 to 1990) [Citation26]. The complete data set therefore comprises twelve diurnal profiles of irradiance (global, diffuse, and direct-normal) and air temperature: one for each month. This imposes a limitation in that the nature of sudden intermittent variations over time is obscured. Intermittent solar irradiance variations due to cloud cover are particularly important for modeling the performance of PTC collectors, which can only operate under direct irradiance. Using average irradiance data in the calculations results in a continuous power output for the collector that will differ from the actual time average due to the non-linearity of this system. Therefore, a parallel approach is adopted using London climate data from an alternative source: the International Weather for Energy Calculations (IWEC), published by ASHRAE [Citation7]. This data set is available at an hourly frequency for every day of the year. The data are extracted from 18 years of meteorological measurements (from 1982 to 1999), such that the annual data series is assembled from 12 typical meteorological months selected from the long-term time series [Citation27]. Thus, each data point is an instantaneous measurement and intermittent variations are preserved (albeit at a lower frequency of measurement than for the PVGIS data).
The tilt angle chosen for the annual assessment is 38°, which is the optimum plane for London as calculated by the PVGIS tool. The azimuth angle is due south. In the PVGIS and IWEC data sources are compared for global irradiance on an optimum plane for a day in April and a day in July. The IWEC data show an overcast and a clear day, respectively, for which total irradiance levels differ considerably from the PVGIS monthly averaged data. The July data in are verified with measurements from a solar irradiance meter (a Seaward Solar-Survey 200R, logging at a sample rate of 1 min−1) taken at Imperial College on a day in mid July, on a surface inclined at approximately 35–40°. The day in question featured prolonged sunshine in the morning with intermittent cloud in the afternoon. The irradiance levels during the clear-sky periods show good agreement with the IWEC data.
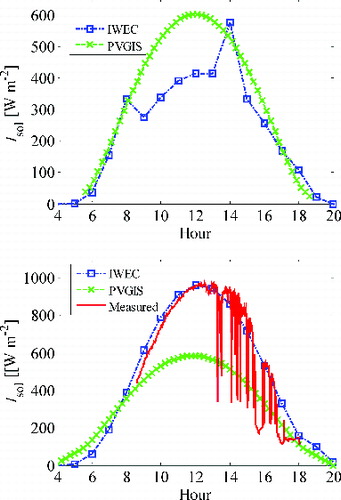
In , mean irradiance values for each month of the year are compared between the two climate data sets. Irradiance values shown are global-horizontal (direct + diffuse irradiance received on a horizontal plane) and direct-normal (direct irradiance received on a plane orientated perpendicular to the direction of the beam). These are abbreviated GHI and DNI, respectively. A third data set shown for comparison purposes is IWEC climate data for Almeria, southern Spain [Citation7], latitude 36.9° N. There is a noticeable difference in the shape of the irradiance curves for the two London data sets. This can be attributed partially to the use of multiple-year averaged data in the PVGIS data set and instantaneous (albeit selected to be representative) data for in the IWEC data set. The PVGIS data set shows an 8% higher annual mean GHI and a 29% higher annual mean DNI than the IWEC data set. It is also of note that the IWEC data set shows an apparent “dip” in DNI in the month of June. It can be easily observed that both the global and direct irradiance received in London is far lower than for Almeria, Spain. Almeria is shown to receive 77% more GHI and 174% more DNI annually than London. For both of the London data sets the GHI is significantly higher than the DNI over the annual period. However, for Almeria the DNI is higher than the GHI, which indicates a higher potential in this locality for concentrating collectors with tracking systems.
An advantage of the PVGIS database is that global irradiance data can be generated for inclined surfaces. On the other hand, for the IWEC data, irradiance data for tilted surfaces must generated manually by applying a tilt-angle correction to the direct-normal irradiance using knowledge of the solar incident angle,
(5) where θ is computed as a function of latitude, solar declination angle, solar hour angle, surface inclination angle, and surface azimuth angle (zero for due south). The method followed is that presented in Duffie and Beckman [Citation28]. For diffuse irradiance no correction is applied, which is an acceptable approach for small inclination angles where the ground-reflected component is minimal and the diffuse component is assumed to be uniformly distributed across the sky. When applying the corrections for the PTC collectors it is assumed that they are aligned due south along the axis of the absorber tube and are of fixed tilt in the longitudinal plane and variable tilt in transversal plane (tracking daily solar movement from east to west).
The solar incidence angle θ is also used to apply a correction for the incidence angle modifier (IAM). This is a factor that is used to modify the optical efficiency of the collector η0 for nonperpendicular incident beam angles, such that η0 in EquationEq. (1)(1) is replaced by η′0 = η0K(θ). The IAM is usually measured in transversal and longitudinal components for ET and PTC collectors. For these factors to be applied correctly to the optical efficiency, the transversal and longitudinal projections of the incident angle θ should be obtained. However, as noted by Duffie and Beckman [Citation28], this is a complex procedure, and θT and θL are not generally expressed as analytic functions. Hence, the following approximation is used:
(6)
For some collectors a diffuse IAM is also provided by the manufacturers, such that the overall IAM is:
(7)
Unless this information is provided, it is assumed that Kd = 1 for all incident angles.
RESULTS AND DISCUSSION
Reversible Versus Endoreversible Exergy Analysis
The calculated reversible and endoreversible exergy flow from each collector is compared in and for peak and annual-averageFootnote† irradiance conditions (assumed to be 100% direct useable irradiance for all collectors). It is noted that the exergy flow attains a maximum value per square meter of collector at a specific, optimal collector outlet stream temperature (and thus flow rate through the collector), which is different for each collector. Furthermore, as expected, the maximum exergy value is lower when the endoreversible cycle is considered, although the corresponding optimal outlet temperature does not change.
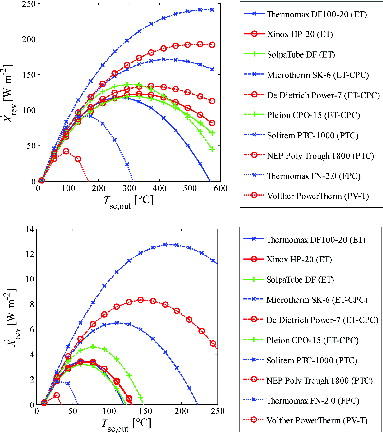
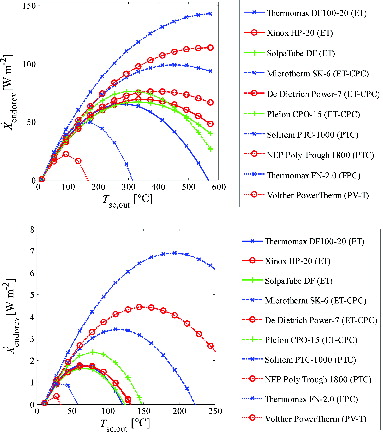
For the Thermomax DF-100 collector, the exergy flow is 118 W m−2 (reversible) and 66 W m−2 (endoreversible) under peak irradiance, and 3.5 W m−2 (reversible) and 1.8 W m−2 (endoreversible) under average irradiance. This is considerably lower than the Microtherm SK-6, for which the exergy flow is 171 W m−2 (reversible) and 99 W m−2 (endoreversible) at peak, and 6.5 W m−2 (reversible) and 3.4 W m−2 (endoreversible) on average. The highest exergy production is that from the Solitem PTC collector: 241 W m−2 (reversible) and 143 W m−2 (endoreversible) under peak irradiance, and 12.7 W m−2 (reversible) and 6.9 W m−2 (endoreversible) under average irradiance. Based on a 15-m2 area available for coverage by solar collector on average in UK households [Citation8], these figures show a potential for an average distributed and local power generation at the household level of up to 97.5 W (reversible) and 51 W (endoreversible) for the Microtherm SK-6 ETC, and 190.5 W (reversible) and 103.5 W (endoreversible) for the Solitem PTC. Based on a global horizontal solar irradiation received annually in London typically between 1000 and 1100 kWh m−2, equivalent to approximately 120 W m−2 on average, these values also correspond to solar to electricity conversion efficiencies of 5.4% (reversible) and 2.8% (endoreversible) for the Microtherm SK-6 ETC, and 10.6% (reversible) and 5.8% (endoreversible) for the Solitem PTC.
It is instructive to compare the temperatures and flow rates determined for maximum exergy with the recommended operational ranges specified by the manufacturers, while noting that the temperature values at which the exergy maxima occur in and represent optimum values predicted from an idealized thermodynamic analysis. Taking the Thermomax DF-100 as an example, the maximum exergy under peak irradiance ( (top)) corresponds to an optimum outlet temperature of 270°C. For a collector inlet temperature of 10°C, the mean temperature of the collector Tsc, m is then 140°C. This is higher than the typical operating temperature range for this type of collector, which according to the manufacturer's test report is < 90°C [Citation29]. For the annual average irradiance condition, the optimum outlet temperature for the Thermomax DF-100 collector is 65°C, which is well within the typical operating range for the solar collector. However, in the collector mass flow rate corresponding to the maximum exergy output under annual mean irradiance is 0.00017 kg s−1 per m2 of collector surface (0.0026 kg s−1 when scaled up to a 15-m2 array), which is between one and two orders of magnitude below the manufacturer's minimum recommended flow rate of 0.033 kg s−1. The implications of operating a collector outside of the manufacturer's recommended flow rate range are considered in further detail later in this paper.
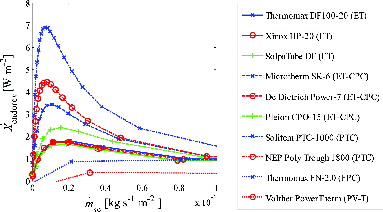
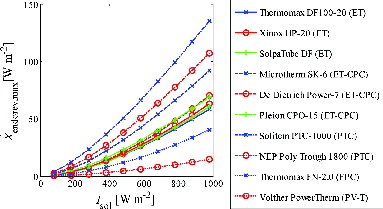
and show plots of solar collector exergy output against solar irradiance and cold sink temperature, respectively. It is important to note the non-linearity, that is, increasing gradient of exergy output with irradiance. This has important implications for the suitability of using time-averaged irradiance data to predict the maximum annual power output, because the exergy output will be disproportionately higher under peak irradiance conditions than under average irradiance conditions. This will lead to averaged results over the course of a year that are typically higher than the expected annual power corresponding to the average irradiance.
Annual Assessment
Results from the annual assessment are shown in for the reversible exergy analysis and for the endoreversible exergy analysis. The results are presented as the total annual exergy production from a collector array area of 15 m2, equivalent in size to a typical UK domestic roof [Citation8]. For both annual analyses the Solitem PTC and the Microtherm ETC collectors show a considerably higher annual exergy output than the other PTC and ETC collectors, with the Solitem collector performing slightly better than the Microtherm collector for the IWEC climate data assessment, and slightly worse for the PVGIS climate data assessment. For the annual assessment using IWEC weather data and with water as the cooling medium, the Solitem PTC has a maximum reversible exergy output of 1845 kWh yr−1 (211 W average) and a maximum endoreversible exergy output of 1061 kWh yr−1 (121 W average), while the Microtherm SK-6 non-concentrating evacuated tube collector has a maximum reversible exergy output of 1786 kWh yr−1 (204 W average) and a maximum endoreversible exergy output of 998 kWh yr−1 (114 W average).
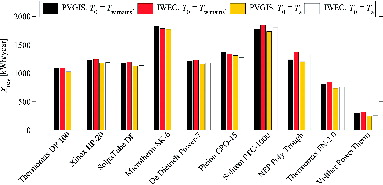
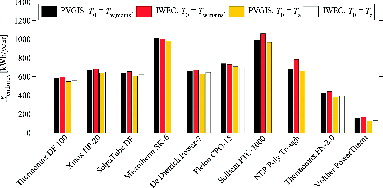
Based on a global horizontal solar irradiation received of approximately 120 W m−2 on average, these values also correspond to solar to electricity conversion efficiencies of 11.7% (reversible) and 6.7% (endoreversible) for the Solitem PTC, and 11.3% (reversible) and 6.3% (endoreversible) and for the Microtherm SK-6 ETC. The NEP PolyTrough PTC collector is found to have a far lower (69–75%) maximum annual exergy output than the Solitem PTC collector. The Thermomax DF-100 evacuated tube has the lowest maximum annual exergy output of all the ETC collectors (1095 kWh−1/year reversible, and 591 kWh−1/year endoreversible), while the FPC and PVT collectors have the lowest exergy output overall.
The monthly mean exergy flow rates from four of the collectors are compared in . It can be observed that the dip in direct beam irradiance in June in the IWEC data set (noted from (middle)) corresponds to a notable corresponding drop in exergy output for the parabolic trough collectors in June ( (top)). Thus, the Solitem PTC collector has a slightly higher maximum power output than the Microtherm ETC collector in the mid-seasons (April, May, August, September, October), but a lower maximum power in the midsummer months (June and July).
Despite the observation that the PVGIS London climate data have an 8% higher global-horizontal and a 29% higher direct-normal annual mean irradiance than the IWEC data, it is found that for most collectors the use of IWEC data results in a higher annual maximum work production (typically by 2–5% for the non-concentrating collectors and 7–15% for the concentrating collectors). This effect can be attributed to the non-linear increase of collector exergy output with solar irradiance that was noted from the results shown in .
The choice of air or municipal water as the heat rejection medium has a less significant influence on the annual exergy output. The mean annual air and mains water temperatures are very similar (10°C for water, and 10.75°C for air [Citation2, Citation23]); in the cold sink temperature is shown to have a smaller effect on exergy output over the range of annual variation than solar irradiance. With air as the heat rejection medium, coincidental occurrence of peak air temperatures with high solar irradiance is not found to cause a significant reduction in annual exergy output compared to water.
Maximum Power Comparison With a Southern European Climate
As a benchmarking exercise the exergy analysis was repeated using climate data for Almeria, Spain (see ). On considering the results from this exercise, it is noted that the annual maximum power (calculated through the endoreversible analysis and with heat rejection to water) increases by an average of 130% for the range of collectors considered in the study. This increase in exergy output with location is found to be largest for the concentrating collectors, with the maximum power (endoreversible) for the Solitem PTC collector array increasing from 1061 to 3071 kWh yr−1 (equivalent to an average power output increase from 121 to 351 W). The dramatic performance improvement for the PTC collectors is due to the increased availability of direct irradiance in the Almeria locality and is highly significant because, unlike for London, both PTC collectors are now found to have a higher maximum annual work potential than all of the non-concentrating collectors.
When comparing the two climates, the largest percentage increase in maximum work output occurs in June and July for the concentrating collectors but in March and October for the non-concentrating collectors. It is important to consider that the annual-optimum tilt angle for Almeria (33°) is only 5° shallower than that for London (38°), meaning that the noon incidence angle is nearer perpendicular in the mid-season months than in the summer months, as is also the case for London. However, due to the more significant increase in solar intensity for Almeria in June and July relative to the other months of the year, there is no dip in maximum power output in the midsummer months, as was shown for London.
Temporal Resolution and Data Aggregation
As noted in the previous section, the difference between the maximum annual work output calculated for the IWEC and PVGIS data sets is a compound result of (1) differences in geographical location, (2) year in which the measurements were taken, and (3) the way in which the climate data are aggregated with respect to time. In order to quantify the latter effect, the calculations are repeated for a single data source (the IWEC data set featuring hourly instantaneously measured values for each environmental parameter), averaged over annual, monthly and daily periods. The results are presented in , for an example concentrating and non-concentrating collector, and at three different time resolutions: (1) the full-resolution non-averaged annual data set of hourly irradiance, solar angle, and ambient temperature values; (2) the “monthly average day” (12 × 24 data points) and (3) the “annual average day” (1 × 24 data points), which are diurnal profiles constructed from monthly and annual averages of climate data, respectively, corresponding to each hour of the day (similar to the method by which the monthly average day PVGIS data is constructed); and (4) the monthly average (12 data points) and (5) the annual average (1 data point), for which climate data are averaged over the monthly and annual periods, respectively.
Table 2 Annual exergy output (reported as an annual average power) for varying time resolution and aggregation of climate data (IWEC data set)
It is shown in that the calculated value of the annual maximum work output (reported for all cases as an average power) is highest for the non-averaged full annual data set of hourly values and that the reduction in calculated power output due to the use of averaged climate data is non-trivial. The maximum power output calculated for the monthly average day profile (ETC collector, reversible analysis) is 9% lower, and for the average annual condition is 49% lower. For the PTC collector the reduction in power output as a result of using averaged data is even more significant, with a 26% reduction for the monthly average day profile and a 56% reduction for the annual average condition.
Further Improvements Through Tilt-Angle Adjustment
The optimum fixed tilt angle for the maximum annual solar yield is a compromise that results in the highest possible annual work output, but inevitably leads to a suboptimal work output for certain months compared to others. The 38° angle for London results in a near-perpendicular noontime incident angle in the months of May and August that is close to being optimal, but a suboptimal incident angle in the midsummer and midwinter months. The installation of an automated system for continuous solar tracking has associated requirements in terms of cost (which may be prohibitive for many households), space, operation, and maintenance. Consequently, automatic tracking systems are generally considered a less viable option for affordable small-scale non-concentrating setups with low power outputs [Citation32]. However, a common practice is to apply periodic manual adjustments at discrete time intervals (e.g., monthly) to the inclination angle of the collector array in order to enhance the power output. Recommended monthly optimum tilt angles can be generated for a given latitude by the PVGIS online tool [Citation2], and are listed in for a collector of fixed orientation due south. The angles are calculated so as to maximize global irradiance received; thus, there is a competing requirement to minimize the solar incidence angle for direct beam irradiance but also to maximize the hemispherical sky view factor for diffuse irradiance. It follows that these inclination angles are not optimal for the PTC collectors (tracking east to west) because (1) the changing azimuth angle will affect the angle of solar beam incidence and (2) the inability to use diffuse irradiance means that there is no competing requirement to maximize the hemispherical view factor.
Table 3 Monthly optimum solar collector inclination angles
Therefore, in this study, the optimum monthly inclination angles for the tracking collectors have been set by manual iteration in order to maximize the direct irradiance received for each month. By this methodology, the optimal values for the tracking collectors are found to be slightly different for the IWEC and PVGIS data sets. The optimal inclination angles for both data sets are listed in . The annual exergy calculation can thus be revised, incorporating the monthly adjusted tilt angles.
The implementation of the optimal monthly tilt angles results in a moderate increase in annual exergy output. On average, the increase is ∼5–10% across the range of collectors, relative to the fixed-tilt values. The more appreciable percentage improvement is found to occur for the concentrating collectors (9–10%) than for non-concentrating collectors (∼5%). The results are broadly similar for the two data sets. For the Solitem PTC collector (IWEC climate data, heat rejection to water) the annual endoreversible exergy output increases from 1061 kWh yr−1 (121 W, average) for the fixed tilt angle to 1142 kWh yr−1 (130 W, average) for the monthly optimal tilt angles. For the Microtherm ETC collector the endoreversible exergy output increases from 998 to 1051 kWh yr−1 (114 to 120 W, average).
Operational Temperature Limitations
The exergy analysis preformed and reported in this paper predicts the temperature and exergy content of the fluid stream exiting the collector using information about the collector's solar absorption efficiency over a range of operating temperatures. The information is provided by the manufacturer or specialized databases in the form of a performance curve, which is a fit of experimental data obtained under a range of operating conditions determined by the manufacturer as being representative of typical operation. It is quite possible therefore that using the efficiency curve to model the collector's performance outside of the intended operational range will result in extrapolation leading to error.
Using manufacturer's test data for the Thermomax DF-100 as a case study, it is possible to compare the performance region along the efficiency curve at which the collector was tested with the point for which the collector would be required to operate for maximum exergy output. This is shown in . Also shown in this plot is the identified collector stagnation temperature, determined under zero flow conditions, hence ηsc = 0 (note that the value of Tstag shown in is slightly different to the value listed for the Thermomax DF-100 in , which has been corrected by the manufacturer to correspond to a standard irradiance of 1000 W m−2). The mean collector temperatures during testing are in the range 25–84 °C. shows that there is a large gap in performance data between Tsc, m = 84°C and the stagnation temperature. For collector temperatures in this region, predicted efficiency values determined from the efficiency curve can be considered an extrapolation and subject to some uncertainty. This is the region in which the optimal value for maximum exergy output (133°C) is calculated for this particular irradiance and ambient temperature (874 W m−2 and 26°C, respectively, corresponding to the conditions for which the collectors were tested). By converting the collector temperature into a reduced-mean collector temperature difference T′m = (Tm − Ta)/Isol, it is possible to compare the range of T′m values at which the Thermomax collector was tested to the annual range of optimal T′m values determined in the annual assessment. It is found that, generally, the annual range of optimal T′m values lies outside of the tested range.
![Figure 13 Comparison of empirical data for the Thermomax DF-100 ETC collector (published in [Citation29]) with the collector's efficiency curve plotted over a range of mean collector temperatures and for solar irradiance and ambient conditions corresponding to the conditions at which the collector was tested, that is, Isol = 874 W m−2 and Ta = 26°C. Also shown are the maximum exergy point corresponding to these conditions (obtained from the endoreversible analysis with heat rejection to water) and the stagnation temperature Tstag.](/cms/asset/2f60a800-87e4-4ed4-bdde-c46747eefb19/uhte_a_995037_f0013_oc.jpg)
Furthermore, it is observed that the quadratic fit of the efficiency curve described by the manufacturer's coefficients does not pass through the stagnation point for a number of the collectors considered in the present study. For some collectors, this difference is small and is likely to be due to uncertainty in the environmental conditions under which stagnation temperature was measured (in EN 12975 these conditions are specified as a range: Isol = 1000 W m−2 ± 10%, and Tamb = 20–40°C). However, for three of the collectors (the Xinox HP-20, Microtherm SK-6, and De-Dietrich Power-7) the difference between the manufacturer's measured stagnation temperature and the zero-efficiency temperature read from the efficiency curve is significant (>100 K) and cannot be neglected. It may be assumed for these collectors that at higher temperatures approaching the stagnation temperature, the stated efficiency curve is not an accurate predictor of performance. Although the range of mean temperatures (Tsc, m) for these collectors is not found to exceed the stagnation temperature, it is still possible that these temperatures may be subject to some error.
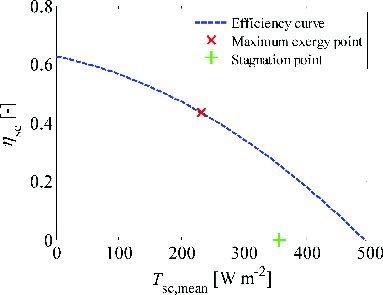
In the efficiency curve, the stagnation temperature, and the maximum collector temperature corresponding to peak conditions in the annual simulation are compared for the Microtherm SK-6 collector. If this collector is to be used for domestic water-heating applications then it can be expected that the curve is accurate at temperatures below 100°C, where the deviations between the manufacturer's directly measured efficiency-temperature performance closely overlaps the quadratic fit of the efficiency curve described by the reported coefficients. If the curve were also accurate at the high end of the operational temperatures, then it would be expected to cross the x-axis at the known stagnation point indicated in the figure, which it does not. From our idealized thermodynamic analysis, the collector temperature corresponding to maximum power output under peak irradiance conditions is shown in to be 230°C, which is approximately halfway between the typical domestic water-heating temperature range and the stagnation point. It should be noted that the deviations between the predicted collector performance and the directly measured data are expected to be smaller at the intermediate temperatures (close to temperature of maximum exergy/power) compared to the deviations at the (extreme) stagnation point.
Operational Flow-Rate Limitations
shows the range of operational flow rates recommended by the manufacturer for each collector. It is found for all collectors that the entire annual range of flow rates corresponding to maximum power output is below the manufacturer's recommended range of flow rates (with the exception of the Microtherm SK-6, which is within the recommend range for ∼8% of the year but for which the minimum recommended flow rate is considerably lower than the other collectors in the study; and the Solitem PTC collector, for which no recommended flow rates are available). The minimum flow rate is likely to correspond to a minimum fluid velocity in order to achieve effective, predictable heat transfer in the absorber pipe. The velocity of the fluid is dependent on the diameter of the absorber pipe, which varies with collector design. Two popular designs for the absorber pipes in direct-flow evacuated tube collectors are the U-tube and coaxial-tube designs, shown in .
Table 4 Range of flow rates prescribed by solar manufacturer (where available) and range of optimal flow rates obtained in the annual exergy simulation (endoreversible, with heat rejection to water and using IWEC London climate data)
![Figure 15 Section drawings showing absorber pipe arrangements in direct-flow evacuated tube solar collectors [35]. Top: Microtherm SK-6 featuring U-tube absorber pipe design. Labels denote (1) glazing, (2) evacuated volume, (3) absorber coating, (4) absorber element, (5) heat-conducting metal sheet, (6) inlet pipe, (7) return pipe, and (8) CPC reflector. Bottom: Solpatube DF coaxial tube arrangement. Labels denote (1) glazing, (2) evacuated volume, (3) absorber plate, and (4) coaxial tube.](/cms/asset/679fc528-495e-4f3a-a06e-022916c1b69e/uhte_a_995037_f0015_oc.jpg)
Across the range of non-concentrating collectors in this study, the minimum flow rate specified by the manufacturer tends to be in the range 0.01–0.035 kg s−1 (with the notable exception being the Microtherm SK-6, whose minimum flow rate is 0.003 kg s−1). This range of flow rates corresponds to a minimum absorber pipe diameter in the range 3–11 mm required in order to achieve Reynolds number conditions for turbulent flow (Re > 4000) at fluid (water) temperatures ∼25°C. Turbulent flow conditions are advantageous in terms of minimizing the thermal resistance due to forced convection on the inside of the collector tubes and, consequently, maximizing heat transfer into the fluid, albeit at a slight penalty of imposing a greater pressure drop and more pumping power in the solar fluid circuit.
The absorber pipe diameter is not generally given in the standard product specifications for the collectors considered in this study, but the higher end of this range of pipe diameters appears to correspond to those for evacuated-tube and flat-plate collectors found elsewhere in the literature—specifically being in the range 8–10 mm [Citation33, Citation34]. Of the two parabolic trough collectors in this study, the recommended flow rate range is known only for the NEP PolyTrough. The minimum flow rate is 0.25 kg s−1, which is significantly higher than for the evacuated tube models and corresponds to a maximum pipe diameter for turbulent flow of ∼80 mm (based on the connection dimensions provided in the manufacturers’ specifications the actual pipe diameter appears to be 25 mm).
Finally, it is possible to reevaluate the annual exergy output for all of the collectors in this study by fixing the mass flow rate at the minimum value recommended by the manufacturer, in order to obtain a more conservative estimate of maximum power production within the operation limitations of these collectors. It is found that for the collector requiring the smallest adjustment from the optimal range of values (the Microtherm SK-6 ETC and the Thermomax FN 2.0 FPC collector), the annual exergy output is only 2–5% lower than for the optimal flow rates. However, for the collector for which the required flow rate adjustment is largest (the NEP PolyTrough PTC collector), the annual exergy output is 97% lower than for the optimal flow rates.
SUMMARY AND CONCLUSIONS
A method was presented for calculating the maximum exergy output from a solar-thermal collector in order to assess the potential for power generation from a suitable heat engine operating downstream of the collector, based on both reversible and endoreversible thermodynamic analyses. The evaluation of the collector exergy output for an endoreversible engine using the Curzon–Ahlborn efficiency results in collector exergy output values that are 50–60% lower than those evaluated for a fully reversible Carnot engine. The calculation procedure was extended to an annual simulation using UK climate data to determine the total annual exergy deliverable from a range of existing small-scale solar collector modules (concentrating and non-concentrating) and to determine their optimum operating temperatures and flow rates for exergy maximization. The results show a large degree of variation across the range of solar thermal collectors. Based on the endoreversible analysis, the maximum annual work production from the range of non-concentrating evacuated tube collectors studied is found to be 548–1010 kWh yr−1 for a domestic-roof array size of 15 m2 (equivalent to 62–115 W, average, or an average power density of 4.2–7.7 W m−2). This is also equivalent to 15–28% of the average UK household demand for electricity. The concentrating parabolic trough collectors (featuring single-axis tracking systems) are shown to have the potential to deliver a higher maximum exergy flow under equal direct irradiance conditions than all of the non-concentrating collectors studied. However, over the range of annual conditions for the United Kingdom that feature prolonged periods of diffuse scattering by cloud cover, annual work potential is very close to that from the highest performing of the non-concentrating evacuated tube collectors.
An important finding is the extent of the error introduced by using averaged data for the annual work output calculations from the solar heat engine. Due to the non-linearity of power output with solar irradiance, the annual calculations require sufficiently high-resolution data in which short-duration peaks in solar irradiance are represented accurately. This is especially relevant for the United Kingdom, where direct sunlight is highly intermittent due to cloud cover. It is found that using monthly “average day” profile data instead of full-resolution hourly data for the whole year leads to a 9–26% lower annual work output.
The best performing non-concentrating evacuated tube collector (the Microtherm SK-6, no longer manufactured) has an annual maximum work output very similar to the best performing parabolic trough collector (found to be the Solitem PTC1000), and is found to be either slightly higher or lower depending on whether the heat rejection medium is air or water, respectively. Further improvements to the maximum annual work output are identified by applying a monthly discrete adjustment to the inclination angle of the solar collectors within the calculation procedure in order to optimize the amount of irradiation received each month. This leads to different requirements for the tracking and nontracking collectors and typically results in a ∼5% increase in the maximum annual work production.
The ranges of temperatures and flow rates required for maximum work production are found to be outside of the typical range of operation for most of the collectors where this information is available. This is to be expected, as the collectors are in most cases specified for hot-water production at temperatures lower than the optimum for power generation. Analysis of test reports for non-concentrating collectors shows that these products are typically tested for operational temperatures below 90°C. However, optimal mean temperatures for maximum power generation under peak irradiance conditions are found to be in the range 140–240°C for the non-concentrating evacuated tube collectors. Further analysis shows that the range of flow rates required to achieve these temperatures is well below the recommended operational range for these products (typically 1% to 50% of the minimum recommended value). These findings indicate that there is scope for the development of dedicated low-cost collectors for solar–thermal power applications at the domestic scale, which would be better suited to such an application and would outperform off-the-shelf products available on the market. Some insight was gained into requirements for the design, manufacture, and operation of such collectors, preferably by making minimal modifications. An experimental campaign is being planned to assess the effect of using low flow rates with currently available domestic-scale solar collectors.
NOMENCLATURE
| A | = | area, m2 |
| = | enthalpy flow rate, W | |
| I | = | solar irradiance, W m−2 |
| K | = | incident angle modifier |
| = | mass flow rate, kg s−1 | |
| = | entropy flow rate, W | |
| T | = | temperature, °C, K |
| = | exergy flow rate, W | |
| X | = | exergy, J |
Greek Symbols
| η | = | efficiency |
| θ | = | solar incidence angle |
Subscripts
| a | = | air |
| avg | = | average |
| b | = | direct-beam |
| d | = | diffuse |
| g | = | global |
| endorev | = | endoreversible |
| in | = | inlet |
| L | = | longitudinal |
| m | = | mean |
| mains | = | mains (municipal) water |
| out | = | outlet |
| rev | = | reversible |
| sol | = | solar |
| stag | = | stagnation |
| T | = | transveral |
| w | = | water |
Additional information
Notes on contributors

James Freeman
James Freeman is a Doctoral student in the Clean Energy Processes Group of Imperial College London. He received an M.Sc. in renewable energy technologies from the University of Reading in 2007. Following this, he spent 4 years with a London-based engineering consultancy specializing in building services design and sustainability. His main area of work during this period was the design of mechanical systems—particularly heating, ventilation, and passive climate control. He is currently investigating the development of small-scale solar-based ORC systems for combined heating and power.

Klaus Hellgardt
Klaus Hellgardt is a Professor of Chemical Engineering and the theme leader of the Reaction and Catalysis section of the Department of Chemical Engineering, Imperial College London. He obtained his Dipl.-Ing. (TH) from KIT (Germany) and his Ph.D. and DIC from Imperial College London. In 2003 he was awarded the title of EurIng by the European Federation of Engineering Institutions (FEANI). His current research interests focus on reaction engineering and catalytic technology with particular emphasis on green engineering concepts.

Christos N. Markides
Christos N. Markides is a Senior Lecturer in Clean Energy Processes and heads the Clean Energy Processes (CEP) research group at the Department of Chemical Engineering, Imperial College London. He was also one of the co-founders and acted as Technical Director of Thermofluidics Ltd., a spin-off company that was created in 2006 to develop and commercialize the NIFTE technology. He studied for his B.A., M.Eng., and Ph.D. degrees at the Department of Engineering of the University of Cambridge. He graduated with a first class B.A. degree (with honors) in Engineering in 2000. The following year he completed his Master's degree in the fields of fluid mechanics and thermodynamics, for which he obtained a distinction. He was awarded a Ph.D. in energy technologies in 2006. His current research interests include the thermodynamics of and heat transfer effects in innovative unsteady devices and machines, with applications in energy (heat and power) conversion, integration, and storage, in particular for the efficient utilization of low-grade (solar or waste) heat.
Notes
Annual average irradiance (global irradiance on a horizontal plane) as calculated for the PVGIS climate data set.
REFERENCES
- Freeman, J., Hellgardt, K., and Markides, C.N., An Assessment of Solar-Powered Organic Rankine Cycle Systems for Combined Heating and Power in UK Domestic Applications. Applied Energy, vol. 138, pp. 605–620, 2015.
- Joint Research Centre, Photovoltaic Geographical Information System–Interactive Maps. European Commission, http://re.jrc.ec.europa.eu/pvgis (accessed July 28, 2013).
- Manolakos, D., Kosmadakis, G., Kyritsis, S., and Papadakis, G., On Site Experimental Evaluation of a Low-Temperature Solar Organic Rankine Cycle System for RO Desalination, Solar Energy, vol. 83, pp. 646–656, 2009.
- Wang, X.D., Zhao L., Wang, J.L., Zhang, W.Z., Zhao, X.Z., and Wu, W., Performance Evaluation of a Low-Temperature Solar Rankine Cycle System Utilizing R245fa, Solar Energy, vol. 84, pp. 353–364, 2010.
- Quoilin, S., Orosz, M., Hemond, H., and Lemort, V., Performance and Design Optimization of a Low-Cost Solar Organic Rankine Cycle for Remote Power Generation, Solar Energy, vol. 85, pp. 955–966, 2011.
- Canada, S., Cohenm G, Cable, R., Brosseau, D., and Price, H., Parabolic Trough Organic Rankine Cycle Solar Power Plant, U.S. Department of Energy Solar Energy Technologies Program Review Meeting, Denver, CO, 2004.
- ASHRAE, International Weather for Energy Calculations (IWEC weather files) Users Manual and CD-ROM, 2001. Available: http://apps1.eere.energy.gov/buildings/energyplus/weatherdata_about.cfm
- Herrando, M., Markides, C. N., and Hellgardt, K., A UK-based Assessment of Hybrid PV and Solar-thermal Systems for Domestic Heating and Power: System Performance, Applied Energy, vol. 122, pp. 288–309, 2014.
- Xiaowu, W., and Ben, H., Exergy Analysis of Domestic-Scale Solar Water Heaters, Renewable and Sustainable Energy Reviews, vol. 9, no. 6, pp. 638–645, 2005.
- Jafarkazemi, F., and Ahmadifard, E., Energetic and Exergetic Evaluation of Flat Plate Solar Collectors, Renewable Energy, vol. 56, pp. 55–63, 2012.
- Sahin, A.Z., Optimum Operating Conditions of Solar Driven Heat Engines, Energy Conversion and Management, vol. 41, pp. 1335–1343, 2000.
- Barranco-Jiménez, M.A., Sámchez-Salas, N., and Rosales, M.A., Thermoeconomic Optimum Operation Conditions of a Solar-driven Heat Engine Model, Entropy, vol. 11, iss. 3, pp. 443–453, 2009.
- Ahmadi, M.A., Sayyaadi, H., Mohammadi, A.M., and Barranco-Jiménez, M.A., Thermo-Economic Multi-objective Optimization of Solar Dish–Stirling Engine by Implementing Evolutionary Algorithm, Energy Conversion and Management, vol. 73, pp. 370–380, 2013.
- Koyun, A., Performance Analysis of a Solar-Driven Heat Engine With External Irreversibilities Under Maximum Power and Power Density Condition, Energy Conversion and Management, vol. 45, pp. 1941–1947, 2004.
- Curzon, F.L., and Ahlborn, B., Efficiency of a Carnot Engine at Maximum Power Output, American Journal of Physics, vol. 43, pp. 22–24, 1975.
- Ozgener, L., Hepbasli, A., and Dincer, I., Parametric Study of the Effect of Reference State on Energy and Exergy Efficiencies of Geothermal District Heating Systems (GDHSs): An Application of the Salihli GDHS in Turkey, Heat Transfer Engineering, vol. 28, no. 4, pp. 357–364, 2007.
- Ho, C., Ho-Ming, Y., and Chen, T., Theoretical and Experimental Studies of the Ultra-Thin-Channel Solar Water Collector, Heat TransferEngineering, vol. 33, no. 15, pp. 1272–1280, 2012.
- Khouki, M., Mauyama, S., Komiya, A., and Behnia, M., Flat-Plate Solar Collector Performance With Coated and Uncoated Glass Cover, Heat Transfer Engineering, vol. 27, no. 1, pp. 46–53, 2006.
- Kundu, B., The Influence of Collector Fluid Inlet Temperature on the Performance of a Solar-Assisted Absorption System Using Step-Finned Flat-Plate Collector, Heat Transfer Engineering, vol. 28, no. 5, pp. 496–505, 2007.
- Reddy, K.S., Ravi Kumar, K., and Satyanarayana, G.V., Numerical Investigation of Energy-Efficient Receiver for Solar Parabolic Trough Concentrator, Heat Transfer Engineering, vol. 29, no. 11, pp. 961–972, 2008.
- Mwesigye, A., Bello-Ochende, T., and Meyer, J.P., Numerical Analysis of Thermal Performance of an Externally Longitudinally Finned Receiver for Parabolic Trough Solar Collector, Proceedings of the 9th International Conference on Heat Transfer, Fluid Mechanics and Thermodynamics, Malta, 2012.
- BS EN 12975-2:2006, Thermal Solar Systems and Components—Solar Collectors. Part 2: Test Methods, 2006. Available: bsol.bsigroup.com
- Weiss, W., and Rommel, M., Process Heat Collectors. State of the Art Within Task 33/IV, IEA Solar Heating and Cooling Programme, 2008. Available: http://archive.iea-shc.org/publications
- Murphy, G.B., Kummert, M., Anderson, B.R., and Counsell, J.A., Comparison of the UK Standard Assessment Procedure (SAP) and Detailed Simulation of Building-Integrated Renewable Energy Systems, 11th International IBPSA Conference, Glasgow, Scotland, 2009.
- Personal communication with Brian Harris of Water UK, via telephone, June 2013.
- Šúri, M., Huld, T.A., Dunlop, E.D., and Ossenbrink, H.A., Potential of Solar Electricity Generation in the European Union Member States and Candidate Countries, Solar Energy, vol. 81, no. 10, pp. 1295–1305, 2007.
- U.S. Department of Energy, Energy Efficiency and Renewable Energy, http://www.eere.energy.gov (accessed November 17, 2013).
- Duffie, J.A. and Beckman, W.A., Solar Energy Thermal Processes, John Wiley & Sons, Inc., 1974.
- Institut für Solarenergieforschung GmbH, Report of Performance Test According to EN 12975-2 for a Glazed Solar Collector. Test Centre for Solar Thermal Conponents and Systems, Emmerthal, Germany, 2006.
- OFGEM, Office of Gas and Electricity Markets, Typical Domestic Energy Consumption Figures Factsheet, 2011, www.ofgem.gov.uk (accessed May 21, 2013).
- Quoilin, S., Van den Broek, M., Declaye, S., Dewallef, P., and Lemort, V., Techno-Economic Survey of Organic Rankine Cycle (ORC) Systems, Renewable and Sustainable Energy Reviews vol. 22, pp. 168–186.
- Cichon, M., Solar Tracking Systems Gain Ground, 2013, www.renewablenergyworld.com (accessedNovember 27, 2013).
- Zondag, H.A., de Vries, D.W., van Helden, W.G. J., van Zolingen, R.J. C., and van Steenhoven, A.A., The Thermal and Electrical Yield of a PV-Thermal Collector, Solar Energy, vol. 72, no. 2, pp. 113–128, 2002.
- Arab, M., and Abbas, A., Model-Based Design and Analysis of Heat Pipe Working Fluid for Optimal Performance in a Concentric Evacuated Tube Solar Water Heater, Solar Energy, vol. 94, pp. 162–176, 2013.
- Institut für Solartechnik, SPF Online Collector Catalogue, www.solarenergy.ch (accessed January 24, 2015).