
 ?Mathematical formulae have been encoded as MathML and are displayed in this HTML version using MathJax in order to improve their display. Uncheck the box to turn MathJax off. This feature requires Javascript. Click on a formula to zoom.
Abstract
In this study, the thermal and hydraulic performances of six different printed circuit heat exchanger (PCHE) configurations with supercritical liquefied natural gas as the working fluid are studied by a numerical method. Firstly, the thermal and hydraulic performances of the PCHE with airfoil fins are investigated at different operating pressures, which indicate that the PCHE with airfoil fins has better thermal performance but worse hydraulic performance when it operates at higher pressure condition. Furthermore, the effects of different PCHE configurations on the thermal and hydraulic performances are analyzed in detail. The results show that delta vortex generators (VGs) arranged upstream the airfoils can provide better thermal performance than VGs arranged downstream the airfoils, and the thermal performance of the common-flow-up configuration is not always better than the common-flow-down configuration. Finally, the overall heat transfer performance of PCHEs is evaluated by the volume goodness criterion under the same mass flow rate. The results show that the straight channel PCHE with front common-flow-up delta VG and airfoil fins has the best volume goodness factor among the six PCHE configurations.
Introduction
Natural gas (NG) is well-known as one of the cleanest form of fossil fuels, and it is the fastest growing primary energy source owing to its advantages such as clean and efficient combustion, reliable and durable supply, energy and specific density, convenient and clean usage, and flexible implementations (vehicles, power generation plants, industrial and residential usage, etc.) [Citation1]. The liquefied natural gas (LNG) technology provides an economically feasible way of transporting NG over long distances and currently accounts for nearly 30% of the international trade of this resource [Citation2]. Floating liquefied natural gas is an alternative LNG supply method, and it is easy to produce, carry and import of the LNG as it is compared to the traditional LNG supply chain for the offshore reserves [Citation3], and liquefied natural gas - floating production storage and offloading (LNG-FPSO) is a promising energy-efficient method compared to onshore NG treatment facility when the gas source is located in a distant offshore ocean [Citation4]. A further development is the floating regasification units that transform LNG back to NG at the market location, and such units are called liquefied natural gas - floating storage and regasification units (LNG-FSRU). Process technology for LNG-FSRU can be presented as follows: LNG is transferred into cargo tank by dedicated LNG feed pump, then LNG is sent to high pressure booster pump which is used to make high pressure before entering LNG vaporizer, after that LNG will be vaporized and sent to end user [Citation5]. Four main kinds of LNG vaporizers are commercially available, that is, intermediate fluid vaporizer, open rack vaporizer, super open rack vaporizer, and submerged combustion vaporizer. However, the heat exchangers for LNG-FPSO and LNG-FSRU should be more compact than the ones in onshore liquefaction plant due to its limited platform area [Citation4]. Printed circuit heat exchanger (PCHE) is a newly developed heat exchanger with favorable characteristic of compactness, and its potential to further penetrate the market is rather substantial, especially if the heat exchanger size, weight and endurance are major concerns [Citation2]. Therefore, PCHE could be used for LNG-FRSU as a LNG vaporizer.
The first PCHE was originally developed in 1980 at the University of Sydney, while a major PCHE manufacturer and pioneer is the Heatric company (UK), which is highly specialized in the area since 1985 [Citation6]. PCHEs are manufactured by photochemical etching [Citation7] and diffusion bonding technologies, and are able to reliably operate under large temperature range (from −200 °C to 900 °C) and high pressure (60 MPa) conditions [Citation8]. During the past few years, researchers have spent considerable effort to study the thermal and hydraulic performance of PCHEs. The common flow channels of PCHEs are straight channels, wavy channels, zigzag channels, S-shaped channels and channels with airfoils. lists references about the thermal and hydraulic performance of PCHEs with different configurations [Citation9–23]. From the above review, it is concluded that compared with the straight channels, the heat transfer performance may be enhanced by non-straight channels, especially channels with airfoil fins. But most of references in used supercritical CO2 and helium as working fluids, and there are few studies applying PCHE in LNG regasification process, it is necessary to study the thermal and hydraulic performance of airfoil fin PCHEs with supercritical LNG as the working fluid in supercritical LNG heating process.
Table 1. List of references about different PCHE channels.
On the other hand, vortex generators (VGs) can be mounted on the channel wall to continuously disturb the viscous sublayer along the main flow direction and to produce longitudinal vortices (LVs) inducing strong swirling motion, therefore, it may greatly enhance heat transfer [Citation24]. Following Mehta et al. [Citation25], LVs generated by VGs can be denoted as common-flow-down configuration and common-flow-up configuration, respectively. Wu et al. [Citation26] numerically investigated the thermal and hydraulic performance of a heat exchanger with common-flow-up interrupted delta winglet VGs. The results showed that compared with a heat exchanger without VGs, the heat transfer capacity and overall performance increased by 35–60% and 19–64%, respectively. Naik and Tiwari [Citation27] numerically investigated effects of various geometrical parameters of common-flow-down rectangular winglet VGs on heat transfer enhancement in flow over a flat plate. The results indicated that increase in enhancement in heat transfer was observed with increase in length of VGs, and the overall heat transfer performance was the best at a particular attack angle of VGs. A comparative study of effects of elliptical pole parameters, the thickness, the length, the height, the attack angle, the transverse pitch and the longitudinal pitch of common-flow-up winglet VGs on the thermal and hydraulic performance in a rectangular channel was numerically investigated by Tang et al. [Citation28]. The results showed that the intensity of heat transfer could be greatly increased by the increase of length, height, attack angle and transverse pitch of VGs, accompanied with an increase of pressure drop. Tang et al. [Citation29, Citation30] compared the effect on the thermal and hydraulic performance of common-flow-down winglet VGs and common-flow-up winglet VGs. The results showed that the thermal performance and hydraulic performance of common-flow-up VGs was better than that of common-flow-down VGs. From the above review, it was found that these two configurations both greatly improved the heat transfer enhancement. Therefore, the combination of VGs and airfoils may bring greater heat transfer enhancement. In this study, six PCHE models are used to study the thermal and hydraulic performance in the supercritical LNG heat exchange process. The results may provide a practical guidance on heat transfer enhancement method for LNG vaporization devices.
Numerical method
Physical model
Methane is the major chemical component of LNG which varies between 87.0 and 99.8% [Citation31] for different LNG sources. The composition of LNG in China is shown in [Citation32]. The mean relative deviations of thermal-physical properties of LNG and methane, that is, specific heat cp, density ρ, thermal conductivity λ and dynamic viscosity μ, in the studied temperature range at 8 MPa are 9.0, 8.6, −4.8, and 5.7%, respectively, and it is acceptable for engineering computation and analysis. Therefore, LNG can be assumed as 100% methane [Citation33–35], and the thermal-physical properties of methane are used for LNG. As is well-known, gas exists as a single phase medium when the pressure and temperature are above the critical state, so the phase change phenomenon of methane no longer happens when its pressure and temperature is above 4.59 MPa and 190.56 K. The thermal properties of methane, that is, specific heat cp, density ρ, thermal conductivity λ and dynamic viscosity μ, are calculated by REFPROP at different pressures. In comparison with the traditional fluid flow and heat transfer behavior, the thermal-physical properties of supercritical methane change dramatically with temperature and pressure as shown in . The thermal-physical properties variations with temperature can be expressed by the user defined function (UDF) in Ansys Fluent 19.1, and the errors between data from REFPROP and the computed data by UDF are within ±2%.
Figure 1. Thermal-physical properties of methane at different pressures.
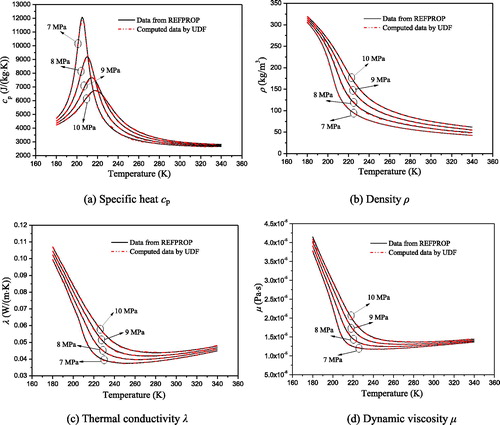
Table 2. Composition of LNG [Citation32].
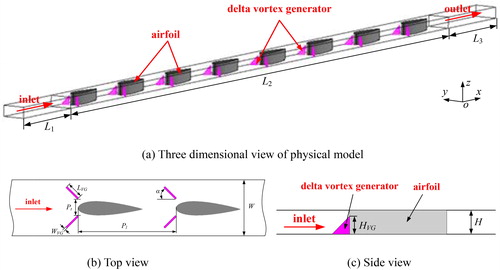
A three-dimensional heat exchanger unit is designed to implement the numerical calculations, as shown in . The methane-flow is described in a coordinate system, in which x, y, z are streamwise, spanwise, and normal coordinates, respectively. The channel height H is 1.0 mm, and the channel width W is 2.0 mm. In order to support a uniform velocity at the inlet and suppress the backflow at the outlet, the inlet and the outlet are both extended to 16 times of the channel height. Therefore, the channel lengths (L1, L2, L3) are 16.0 mm, 64.0 mm and 16.0 mm, respectively.
Figure 2. Schematic diagram of the physical model.
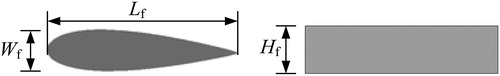
The NACA 23024 airfoil fin is used in the present study, as shown in . The geometrical parameters of the airfoil fin, that is, the maximum thickness Wf, the chord length Lf and the height Hf, are 0.96, 4.0, and 1.0 mm, respectively.
Figure 3. Schematic diagram of the airfoil.
Six different PCHEs are compared: Case A, straight channel PCHE; Case B, straight channel PCHE with airfoil fins; Case C, straight channel PCHE with front common-flow-up delta VG and airfoil fins; Case D, straight channel PCHE with front common-flow-down delta VG and airfoil fins; Case E, straight channel PCHE with rear common-flow-up delta VG and airfoil fins; Case F, straight channel PCHE with rear common-flow-down delta VG and airfoil fins. The list of different configurations is shown in , and the geometric parameters are listed in .
Table 3. List of different PCHE configurations.
Table 4. Geometric parameters of different PCHE configurations.
The governing equations for continuity, momentum and energy may be expressed in tensor notation as
(1)
(1)
In the above equation, the dependent variable, ϕ, stands for the velocity components, temperature, k and ε. The terms Γϕ and Sϕ represent the appropriate diffusion coefficients and the source terms, respectively. The particular expressions for ϕ, Γϕ and Sϕ [Citation36] are summarized in .
Table 5. Expressions for ϕ, Γϕ, and Sϕ.
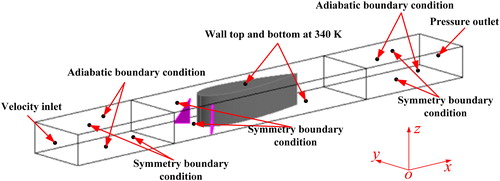
The supercritical methane-flow in the computational domain is regarded as three-dimensional, incompressible, turbulent and quasi-steady. The boundary conditions for computational model are shown in . The flow channels formed by the fins are symmetrical in the longitudinal direction, so the symmetry condition is used for the x-z plane in this study. The flow velocity uin is assumed to be uniform, the temperature tin is taken as 195 K, and pressure is specified at the outlet of the channels. On the solid surfaces, no-slip conditions are used, and a constant temperature of 340 K is applied at the top and bottom surfaces of the channels. The temperature distribution in the fins will be determined by solving the conjugated heat transfer problem between supercritical methane and the fins in the computational domain.
Figure 4. Boundary conditions for computational model.
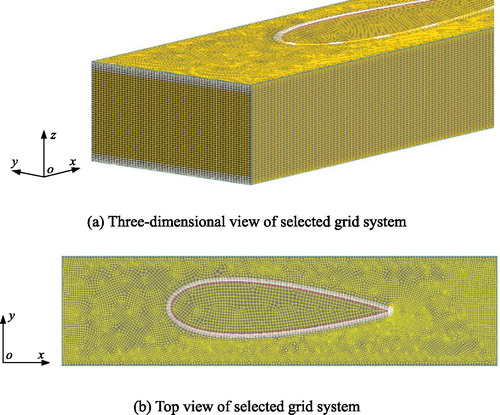
The foregoing governing equations and boundary conditions are solved by Ansys Fluent 19.1. A preprocessor Gambit 2.4 is used to mesh the computational domain for the solver. In order to control the mesh number and improve the grid quality, a hexahedral grid is used for meshing as shown in . Due to the stringent requirements for boundary grid density under supercritical flow and heat transfer, five boundary layers are used near the top and bottom walls and fin surfaces, with the thickness of the first layer being 0.01 mm.
Figure 5. Selected grid system.
All variables, including velocity components, pressure and temperature, are averaged to a control volume. The coupling between pressure and velocity is implemented by the semi-implicit method for pressure-linked equations algorithm. The quadratic upstream interpolation for convective kinematics method is used to discretize the convection terms. Palko and Anglart [Citation37] pointed out that the k-ε model failed to calculate the heat transfer to supercritical fluid in deteriorated region, but the shear stress transport (SST) k-ω turbulence model predicted the heat transfer coefficient in a very good agreement with the experimental results. Therefore, the SST k-ω turbulence model is adopted to simulate the fluid flow. The SST k-ω turbulence model [Citation38] is a hybrid model combining the Wilcox k-ω and the k-ε models. A blending function, F1, activates the Wilcox model near the wall and the k-ε model in the free stream. This ensures that the appropriate model is utilized throughout the flow field: The k-ω model is well-suited for simulating flow in the viscous sublayer, and the k-ε model is ideal for predicting flow behavior in regions away from the wall. The residuals are set to be less than 10−5 and 10−8 for continuity and energy equations, respectively, to ensure convergence of the computations.
In order to validate the solution independency of the grid number, four different grid systems for different cases are investigated, and the predicted average Nusselt numbers and f-factors are shown in . Compared with the result of the finest grid systems for different cases, the deviations of the average Nusselt number and f-factor of the second finest grid systems are less than 2.0%, therefore, the reference grid systems for Case A, Case B and Case C–F are about 554,600 cells, 833,600 cells and 1,132,000 cells, respectively.
Table 6. Variation of grid independence (uin=8.0 m/s).
Data reduction and code validation
The Reynolds number (Re) is defined as
(2)
(2)
where umax is the maximum velocity of methane evaluated at the minimum cross section, m is the mass flow rate, and Amin is the minimum cross section in the channels. ρ is the density of methane, and μ is the dynamic viscosity of methane, which are evaluated at the mean temperature of methane. Dh is the hydraulic diameter and is defined by
(3)
(3)
where P is the perimeter.
The local Nusselt number (NuL) is defined as
(4)
(4)
The mean Nusselt number () is defined as [Citation22]
(5)
(5)
in which, the local logarithmic mean temperature difference ΔTi is defined as [Citation39]
(6)
(6)
where hL is the local heat transfer coefficient, n is the total cross section number. Qi is the local heat transfer rate, ti is the temperature of methane in the i cross section, tw is the temperature of the top and bottom surfaces of the local passage, while Aw,i is the corresponding area. Af,i is the fin area, and Ao,i is the total heat transfer area of the local passage, Ao,i= Af,i+ Aw,i. ηf,i is the fin efficiency, and ηo,i is the surface efficiency. λi is the thermal conductivity of methane and cp,i is the specific heat of methane, which are evaluated at the mean temperature of methane in the local passage. The fin efficiency ηf,i and the surface efficiency ηo,i are described as
(7)
(7)
(8)
(8)
where Qideal is the ideal heat transfer rate at the condition of the whole fin temperature equal to tw.
The Colburn factor (j-factor) is defined as
(9)
(9)
The Darcy friction factor (f-factor) can reflect the pressure drop of the channel and is given as
(10)
(10)
where Δpf is the frictional pressure drop and L2 is the length of the channels. The frictional pressure drop Δpf can be obtained by
(11)
(11)
(12)
(12)
where Δp is the total pressure drop, and Δpa is the acceleration pressure drop. ρin, uin and ρout, uout are the density and velocity evaluated at the inlet and outlet of the channels, respectively.
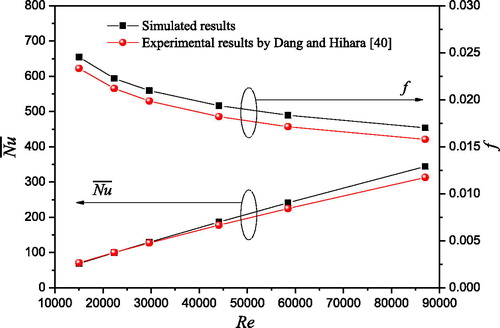
In order to validate the reliability of the present numerical method, a model set up from the experiments of Dang and Hihara [Citation40] is simulated and compared with the experimental correlations near the pseudo-critical temperature. The thermal and hydraulic correlations used for comparison are described as follows.
(13)
(13)
(14)
(14)
(15)
(15)
(16)
(16)
(17)
(17)
(18)
(18)
where subscript b represents the mean bulk temperature, and subscript f represents the film temperature. tf can be obtained by
(19)
(19)
In above correlations, the range of mass flux G is from 200 to 1200 kg/(m2·s), the range of inner diameter d of tube is from 1 to 6 mm, and Prandtl number Pr ranges from 1.3 to 12.0.
shows the comparisons between the simulated and experimental results. The simulated results of the SST k-ω turbulence model agree well with the experimental results. Compared with the experimental results, the maximum and mean relative deviations of the average Nusselt number are 13.5 and 6.7%, respectively, and the maximum and mean relative deviations of the f-factor are 7.8% and 6.2%, respectively. Such good agreements between the simulated and experimental results secure the reliability of the present numerical method.
Figure 6. and f-factor comparisons between simulated and experimental results.
Numerical results and discussions
Effect of pressure on the thermal-hydraulic performance
The working conditions are summarized in in this study. The pseudo-critical temperature of methane at 7, 8, 9, and 10 MPa is about 205.2, 210.1, 214.3, and 218.1 K, respectively. From , it can be seen that the temperature of methane along the flow direction in PCHE channels for different cases goes through the pseudo-critical temperature at different operating pressures.
Table 7. Working conditions for different cases.
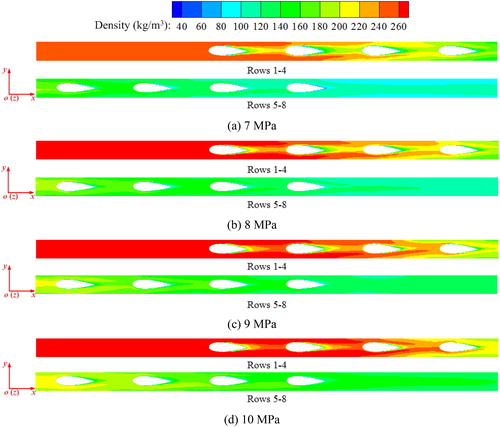
In a PCHE channel, the temperature of supercritical methane will gradually increase in the heating process and the physical properties will undergo dramatic changes. The comparisons of specific heat and density at the central cross section in the z-direction for Case B at different pressures are shown in and . From , it can be seen that the specific heat increases first and then decreases with the increase of temperature, and the specific heat decreases with the increase of pressure at the same location in the channel. The specific heat of supercritical methane is like a pulse function near the pseudo-critical point in , and large specific heat can significantly improve the heat transfer performance. As can be seen from , the density of supercritical methane increases with the increase of pressure, so the velocity at the same mass flux is higher at lower operating pressure, then the turbulence intensity of the main flow is larger inducing the heat transfer enhancement.
Figure 7. Comparisons of cp for Case B at different pressures.
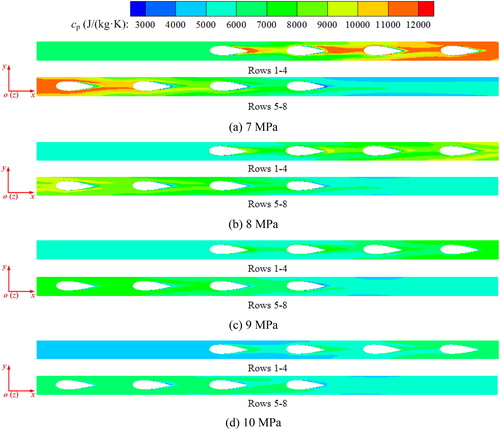
Figure 8. Comparisons of ρ for Case B at different pressures.
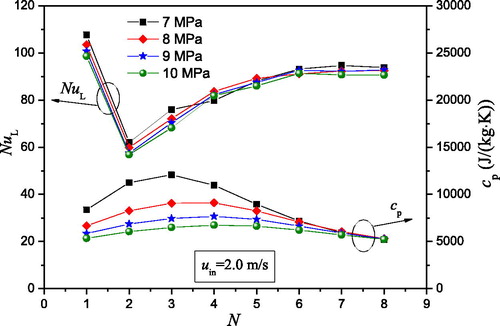
The local thermal and hydraulic performance of Case B at different operating pressures along the main flow direction is described in . As shown in , the local Nusselt number NuL in the first row is the highest due to the inlet effect, and then the local Nusselt number NuL decreases along the main flow direction and reduces to the minimum in the second row. After that, it increases and achieves approximately fully developed condition since the 6th row. The curves of specific heat at different operating pressures show a parabolic distribution along the main flow direction, and specific heat reaches its peak value at the pseudo-critical point. From , it can be seen that the local heat transfer performance is reduced as pressure increases, but it is worth to point out that the local heat transfer performance is enhanced near the pseudo-critical point at different operating pressures.
Figure 9. Local Nusselt number NuL and cp along the main flow direction at uin=2.0 m/s.
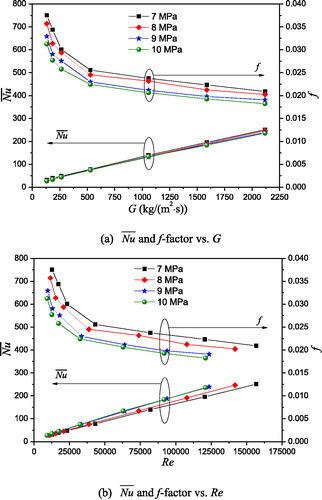
The average thermal and hydraulic performance of Case B is compared at different pressures as shown in , where the mass flux and Reynolds number in the channel is taken as the abscissa. In , it is found that the average Nusselt number increases with the increase of mass flux, and the heat transfer performance is reduced as pressure increases. This can be explained as follows. At the same mass flux, the methane density in the channel is smaller at lower pressure as can be seen in , so the methane velocity is higher at lower pressure, and the higher velocity can improve the heat transfer performance. On the other hand, the specific heat is larger at lower pressure in , and the larger specific heat can greatly improve the capability of supercritical methane for heat transfer enhancement. As a consequence of the above two main reasons, the heat transfer performance is increased as the pressure decreases. From , it can be seen that the Reynolds number is different at the same mass flow rate, and under the same mass flow rate, the Reynolds number at 7 MPa is the largest among these four different operating pressures. This is because that the terms m, Dh, and Amin are the same in EquationEq. (2)
(2)
(2) , but the value of μ at 7 MPa is the largest as can be seen from . also shows the variation of the f-factor with the change of mass flux at different operating pressures. With the increase of mass flux, the f-factor decreases. The reason is that the methane velocity is decreased with the increase of pressure, the friction performance is reduced as the operating pressure increases from 7.0 to 10.0 MPa.
Figure 10. and f-factor comparisons for Case B at different pressures.
Thermal-hydraulic performance comparison for different PCHE configurations
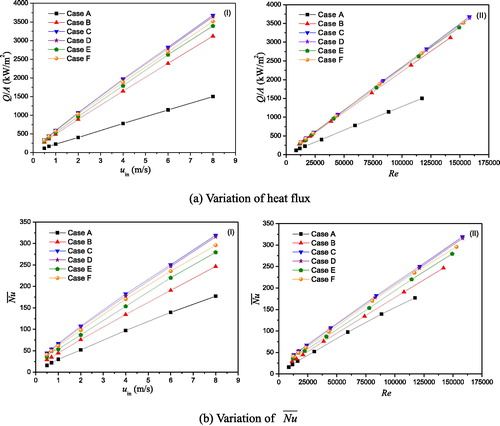
The inlet pressure for Cases A–F is set at 8 MPa, and the inlet velocities are set at 0.5, 0.7, 1.0, 2.0, 4.0, 6.0, and 8.0 m/s, respectively. The heat transfer characteristics of different PCHE configurations are compared in , where the inlet velocity and Reynolds number in channels is taken as the abscissa. As can be seen from , the heat transfer performance of different PCHEs increases with the increase of inlet velocity and Reynolds number. At the same inlet velocity, Case C provides the best effectiveness of the heat transfer enhancement, the next is Case D, then Case F, Case E, Case B in descending order, and the last one is Case A. The comparative results of all delta VG and airfoil configurations can indicate that delta VGs arranged upstream the airfoils can provide better heat transfer performance than delta VGs arranged downstream the airfoils, and the heat transfer performance of the common-flow-up configuration is not always better than that of the common-flow-down configuration. The Reynolds number is different at the same inlet velocity, and the value of Case C is the largest. The reason can be explained as follows. Case C provides the best heat transfer performance, and the mean temperature in the PCHE channel of Case C is the largest. From , it can be seen that the value of μ at larger mean temperature is smaller in the studied temperature range, so the Reynolds number of Case C is the largest according to EquationEq. (2)(2)
(2) .
Figure 11. Heat transfer performance comparisons for different PCHEs.
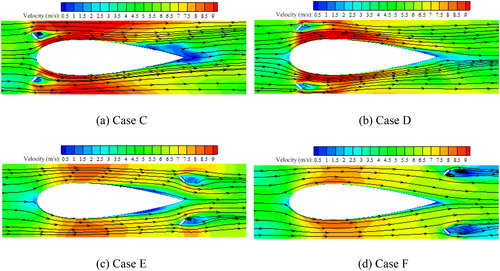
shows the streamlines at the central cross section in the z-direction of Case B at uin=2.0 m/s. From , it can be observed that the flow direction of supercritical methane upstream the airfoil is almost parallel to the x-direction, then the flow direction is changed and consistent with the direction of the airfoil surface. shows the streamlines in the 7th row of Cases C–F along the main flow direction at uin=2.0 m/s. As can be seen from , the flow direction of supercritical methane upstream the VG is changed, and LVs are generated downstream the VG when supercritical methane flows over the VG, and it can destroy the boundary layer effectively. It can be also seen that Cases C–F can provide higher velocity along the airfoil fin than Case B, especially Cases C and D. As is well known, the higher velocity can greatly improve the capability of supercritical methane for heat transfer enhancement. Therefore, VGs arranged upstream the airfoils, that is, Case C and Case D, can effectively enhance heat transfer. For Case E, VGs arrangement is almost consistent with the flow direction in , so the methane flow behind the VG cannot be effectively disturbed, and the heat transfer enhancement is worse than Case F. That is to say, the arrangement of VGs should be properly designed in order to further enhance heat transfer.
Figure 12. Streamlines at the central cross section in the z-direction of Case B at uin = 2.0 m/s.
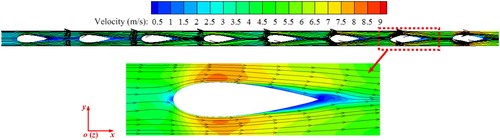
Figure 13. Streamlines in the 7th row of Cases C–F at uin = 2.0 m/s.
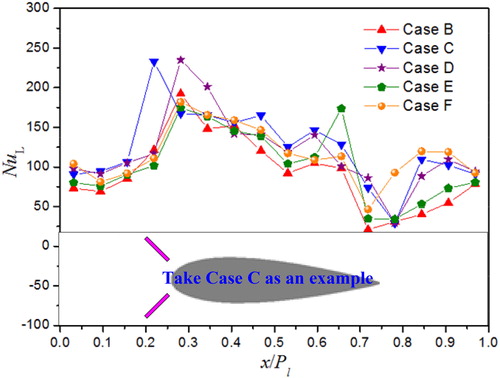
To avoid the effect of the entrance or the exit, the 7th airfoil fin is picked out and its local performance is analyzed. There are 16 equidistant cross-sectional planes from x = 48 mm plane to x = 56 mm plane. presents the local Nusselt number NuL at the cross-sectional planes along the flow direction for Cases B–F at uin=2.0 m/s. It can be seen that the local heat transfer performance of channels with airfoil and VG fins is always higher than that of the airfoil channel behind the trailing edge of VGs, and the main difference of the local Nusselt number NuL among Cases C–F can be attributed to the VG layout. As mentioned above, the intensity of LVs generated by delta VGs arranged upstream the airfoils is stronger than that of LVs generated by delta VGs arranged downstream the airfoils, therefore, the local Nusselt number NuL of Cases C and D is higher than that of Cases E and F.
Figure 14. Local Nusselt number NuL in the 7th row at uin=2.0 m/s.
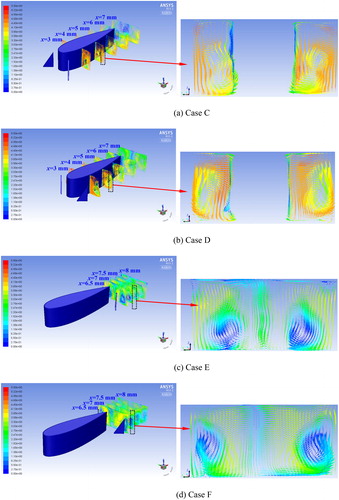
presents the velocity distributions at the different cross sections in the y-z plane of Cases C–F at uin=2.0 m/s. From , it can be observed that LVs are generated at the leading edges of Cases C–F when supercritical methane flows over the VGs. The structure of NACA 23024 airfoil is not symmetrical, so the left LVs and right LVs are also asymmetrical. LVs occur not only in the region where the VGs are mounted, but also survive in a long distance downstream. The interaction between adjacent vortices can be divided into two types, that is, counter-rotating and co-rotating. Counter-rotating vortices are identified by the direction of the secondary flow between the pairs which can be directed either toward or away from the wall. For common-flow-down configuration (Case D and Case F), the transverse distance between the leading edges of the VG pairs is less than the transverse distance between the trailing edges, while, for the common-flow-up configuration (Case C and Case E), the transverse distance between the leading edges is larger than that of the trailing edges. The counter-rotating pairs of vortices are generated by Case D and Case F. The left vortices rotate in a clockwise direction, while the right vortices rotate in a counterclockwise direction. These counter-rotating vortices create a down-wash flow toward the lower channel wall between the vortices and the up-wash flow away from the lower wall in the region outside of the vortices. The counter-rotating pairs of vortices are also generated by Case C and Case E but the left vortices rotate in a counterclockwise direction, while the right vortices rotate in a clockwise direction. These vortices are responsible for the up-wash flow between the vortices and the down-wash flow in the outer region of the vortices. These two vortices both induce strong swirling motion and destroy the boundary layer, therefore, they may greatly enhance heat transfer. When LVs, generated by delta VGs arranged upstream the airfoils, flow through the airfoils, the intensity of LVs is stronger than that of LVs generated by delta VGs arranged downstream the airfoils. The LVs generated by Case C and Case D have greater influence downstream, therefore, delta VGs arrangement upstream the airfoils is a good choice for heat transfer enhancement.
Figure 15. Velocity distributions at the different cross-sections at uin=2.0 m/s.
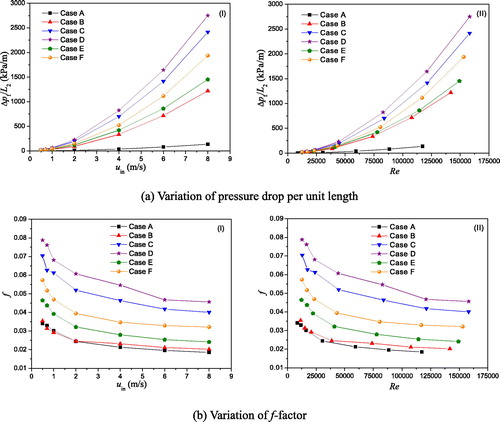
illustrates the variations of friction factor for all cases above. The f-factor decreases with the increase of inlet velocity. The comparative results indicate that the f-factors of Case C and Case E are smaller than those of Case D and Case F at the same inlet velocity, respectively. The results show that the pressure drop performance of the common-flow-up configuration is better than that of the common-flow-down configuration. The reason can be explained as follows. The flow resistance of supercritical methane from the inlet to outlet of the channel with VGs and airfoils is composed by the acceleration resistance of supercritical methane, the frictional resistance of the channel surfaces and the local resistance of the VGs and airfoils, and the local resistance of the VGs and airfoils plays a dominant part of the total pressure drop. The skin friction perturbation of the common-flow-down cases is much larger than that of the common-flow-up cases when the fluid flows through the VG pairs. This is so because that there is a stronger interaction effect on the wall. The spanwise component of the skin friction of the common-flow-down cases is much larger, and the spanwise skin friction of the common-flow-up cases will decrease even more as the vortices continue to lift each other away from the wall. As a consequence, the local pressure drop along common-flow-down VG pairs is larger, that is, the hydraulic performance of Case D and Case F is worse than that of Case C and Case E, respectively.
Figure 16. Friction factor performance comparisons for different PCHE configurations.
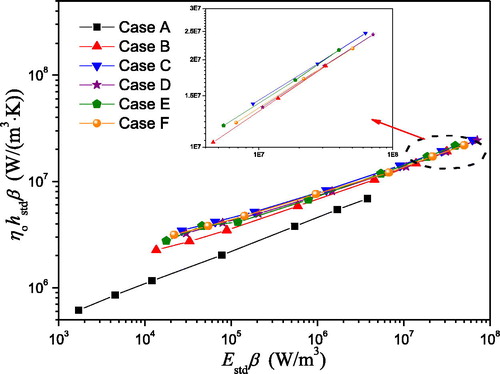
Overall heat transfer performance comparison
As mentioned above, Case C provides the best heat transfer performance, and Case A provides the smallest pressure drop. Attention is now turned to the overall heat transfer performance of different PCHE configurations at the same mass flow rate. In the present study, the volume goodness criterion is adopted.
The volume goodness criterion was suggested by Kays and London [Citation41]. The volume goodness factors are given as follows
(20)
(20)
(21)
(21)
where σ is the ratio of the minimum flow area Amin to the frontal area Afr. ηohstdβ represents the heat transfer power per unit temperature difference and per unit core volume, and Estdβ represents the friction power expenditure per unit core volume. The subscripts std is any preferred standard condition for comparison. A higher plot on ηohstdβ vs. Estdβ characterizes that a surface is better from the viewpoint of heat exchanger volume required. Geometries having large values of ηohstdβ will require less core volume for a given fluid-side performance. As shown in , Case C has the best volume goodness factor, the next is Case E, then Case F, Case D, Case B in descending order, and the last one is Case A.
Figure 17. Volume goodness comparisons for different PCHE configurations.
Conclusions
This article compares the effects of six different PCHE configurations on the heat transfer and flow friction characteristics for supercritical LNG by three dimensional numerical simulations. Main conclusions can be summarized as follows:
At the same inlet velocity, the effects of different heat transfer enhancement models are concluded such that Case C > Case D > Case F > Case E > Case B > Case A. The comparative results of all delta VG and airfoil configurations can indicate that delta VGs arranged upstream the airfoils can provide better heat transfer performance than delta VGs arranged downstream the airfoils. Heat transfer performance of common-flow-up configuration is not always better than that of common-flow-down configuration. This means that the arrangement of VGs should be properly designed in order to further enhance heat transfer.
Moreover, the comparative results indicate that at the same inlet velocity, the f-factors of Case C and Case E are smaller than those of Case D and Case F, respectively. The results of the numerical simulations depict that the hydraulic performance of the common-flow-up configuration is better than that of the common-flow-down configuration.
The volume goodness criterion is adopted to evaluate the overall heat transfer performance of the different PCHE configurations at the same mass flow rate. The results show that Case C has the best volume goodness factor, the next is Case E, then Case F, Case D, Case B in descending order, and the last one is Case A.
| Nomenclature | ||
| A | = | area, m2 |
| Af | = | fin area, m2 |
| Afr | = | frontal area, m2 |
| Amin | = | minimum flow area, m2 |
| Ao | = | total surface area, m2 |
| Aw | = | wall surface area, m2 |
| c1, c2, cμ | = | turbulence model constant |
| cp | = | specific heat at constant pressure, J/(kg⋅K) |
| = | ||
| d | = | inner diameter, mm |
| Dh | = | hydraulic diameter, mm |
| Estdβ | = | friction power expenditure per unit core volume, see EquationEq. (21) |
| f | = | Darcy friction factor |
| G | = | mass flux, kg/(m2⋅s) |
| Gk | = | generation of turbulence kinetic energy, kg/(m⋅s3) |
| h | = | heat transfer coefficient, W/(m2⋅K) |
| h* | = | enthalpy, J/kg |
| H | = | channel height, mm |
| Hf | = | airfoil height, mm |
| HVG | = | VG height, mm |
| j | = | Colburn factor |
| k | = | kinetic energy, m2/s2 |
| L1, L2, L3 | = | channel length, mm |
| Lf | = | airfoil chord length, mm |
| LNG | = | liquefied natural gas |
| LNG- FPSO | = | liquefied natural gas - floating production storage and offloading |
| LNG- FSRU | = | liquefied natural gas - floating storage and regasification units |
| LV | = | longitudinal vortex |
| LVG | = | VG length, mm |
| m | = | mass flow rate, kg/s |
| n | = | total cross section number |
| N | = | number of fin rows |
| NACA | = | National Advisory Committee for Aeronautics |
| NG | = | natural gas |
| Nu | = | Nusselt number |
| = | mean Nusselt number | |
| p | = | pressure, Pa |
| P | = | perimeter, mm |
| PCHE | = | printed circuit heat exchanger |
| P1 | = | longitudinal pitch, mm |
| Pt | = | transverse pitch, mm |
| Pr | = | Prandtl number |
| Q | = | heat transfer rate, W |
| Re | = | Reynolds number |
| SST | = | shear stress transport |
| Sϕ | = | source term, W/m3 |
| t | = | temperature, K |
| u, v, w | = | x, y, z velocity components, m/s |
| UDF | = | user defined function |
| VG | = | vortex generator |
| W | = | channel width, mm |
| Wf | = | maximum airfoil thickness, mm |
| WVG | = | VG thickness, mm |
| x, y, z | = | Cartesian co-ordinates |
| Greek symbols | ||
| α | = | VG attack angle, ° |
| Γϕ | = | diffusion coefficient, m2/s |
| Δp | = | total pressure drop, Pa |
| Δpa | = | acceleration pressure drop, Pa |
| Δpf | = | frictional pressure drop, Pa |
| Δt | = | temperature difference, K |
| ΔT | = | logarithmic mean temperature difference, K |
| ε | = | dissipation rate, 1/s |
| ηf | = | fin efficiency |
| ηo | = | surface efficiency |
| ηohstdβ | = | heat transfer power per unit temperature difference and per unit core volume, see EquationEq. (20) |
| λ | = | thermal conductivity, W/(m⋅K) |
| μ | = | dynamic viscosity, kg/(m⋅s) |
| μt | = | turbulent eddy-viscosity, kg/(m⋅s) |
| ρ | = | density, kg/m3 |
| σ | = | ratio of the minimum flow area Amin to the frontal area Afr |
| σk, σt, σε | = | turbulence model constant |
| ϕ | = | dependent variable |
| ω | = | specific dissipation rate, 1/s |
| Subscripts | ||
| b | = | mean value |
| f | = | fin, frictional, film temperature |
| fr | = | frontal area |
| i | = | i cross section |
| ideal | = | ideal condition |
| in | = | inlet |
| L | = | local |
| max | = | maximum value |
| min | = | minimum value |
| out | = | outlet |
| std | = | standard condition |
| w | = | wall |
Additional information
Funding
Notes on contributors

Ling-Hong Tang
Linghong Tang is a visiting scholar at the Department of Energy Sciences of Lund University. He is an associate professor in the School of Mechanical Engineering, Xi’an Shiyou University. He received his Ph.D. degree in engineering thermophysics from Xi’an Jiaotong University in 2009, and he finished his postdoctoral research from Harbin Engineering University in 2014. His main research interests are numerical heat transfer and compact heat exchangers.

Jie Pan
Jie Pan is an associate professor at the Department of Oil and Gas Storage and Transportation Engineering of Xi’an Shiyou University. His major research fields are multiphase flow in petroleum engineering, LNG heat exchanger and LNG cold energy utilization.

Bengt Sundén
Bengt Sundén received his M.Sc. in Mechanical Engineering 1973, Ph.D. in Applied Thermodynamics and Fluid Mechanics 1979, became Docent in Applied Thermodynamics and Fluid Mechanics 1980, all at Chalmers University of Technology, Göteborg, Sweden. He is a professor of Heat Transfer, Lund University, and he serves as Professor Emeritus and Senior Professor in Heat Transfer since 2016-10-01. He is a fellow of the ASME. The research activities cover compact heat exchangers, heat transfer enhancement, gas turbine heat transfer, combustion-related heat transfer including thermal radiation, CFD-methods, liquid crystal thermography, condensation and evaporation on micro-nanostructured surfaces, nanofluids, impinging jets, aerospace heat transfer, computational modeling and analysis of multiphysics and multiscale phenomena for fuel cells (SOFC, SOEC, PEMFC), thermal management of batteries.
References
- V. Smil, Natural Gas: Fuel for the 21st Century. Chichester: Wiley, 2015.
- D. Popov, et al., “Cryogenic heat exchangers for process cooling and renewable energy storage: A review,” Appl. Therm. Eng, vol. 153, pp. 275–290, Feb 2019. DOI: 10.1016/j.applthermaleng.2019.02.106.
- W. Won, S. K. Lee, K. Choi and Y. Kwon, “Current trends for the floating liquefied natural gas (FLNG) technologies,” Korean J. Chem. Eng., vol. 31, no. 5, pp. 732–743, Mar 2014. DOI: 10.1007/s11814-014-0047-x.
- S. Baek, G. Hwang, S. Jeong and J. Kim, “Development of compact heat exchanger for LNG FPSO,” Presented at the Twenty-First International Offshore and Polar Engineering Conference, Maui, Hawaii, USA, June 19–24, 2011.
- D. H. Lee, M. K. Ha, S. Y. Kim and S. C. Shin, “Research of design challenges and new technologies for floating LNG,” Int. J. Nav. Archit. Ocean Eng., vol. 6, no. 2, pp. 307–322, 2014. DOI: 10.2478/IJNAOE-2013-0181.
- Y. L. Fan and L. G. Luo, “Recent applications of advances in microchannel heat exchangers and multi-scale design optimization,” Heat Transf. Eng., vol. 29, no. 5, pp. 461–474, 2008. DOI: 10.1080/01457630701850968.
- F. Xin, T. Ma, Y. T. Chen and Q. W. Wang, “Two-Dimensional chemical etching process simulation for printed circuit heat exchanger channels based on cellular automata model,” Heat Transf. Eng., vol. 39, no. 7–8, pp. 617–629, 2018. DOI: 10.1080/01457632.2017.1325660.
- D. Reay, C. Ramshaw and A. Harvey, Process Intensification: Engineering for Efficiency, Sustainability and Flexibility. Oxford: Butterworth-Heinemann, 2013.
- S. K. Mylavarapu, X. Sun, R. E. Glosup, R. N. Christensen and M. W. Patterson, “Thermal hydraulic performance testing of printed circuit heat exchangers in a high-temperature helium test facility,” Appl. Therm. Eng., vol. 65, no. 1–2, pp. 605–614, Jan 2014. DOI: 10.1016/j.applthermaleng.2014.01.025.
- W. X. Chu, X. Li, T. Ma, Y. T. Chen and Q. W. Wang, “Experimental investigation on SCO2-water heat transfer characteristics in a printed circuit heat exchanger with straight channels,” Int. J. Heat Mass Transfer, vol. 113, pp. 184–194, Oct 2017. DOI: 10.1016/j.ijheatmasstransfer.2017.05.059.
- H. H. Khan, A. M. Aneesh, A. Sharma, A. Srivastava and P. Chaudhuri, “Thermal-hydraulic characteristics and performance of 3D wavy channel based printed circuit heat exchanger,” Appl. Therm. Eng., vol. 87, pp. 519–528, May 2015. DOI: 10.1016/j.applthermaleng.2015.04.077.
- A. M. Aneesh, A. Sharma, A. Srivastava and P. Chaudhury, “Effects of wavy channel configurations on thermal-hydraulic characteristics of Printed Circuit Heat Exchanger (PCHE),” Int. J. Heat Mass Transfer, vol. 118, pp. 304–315, Mar 2018. 2017.10.111. DOI: 10.1016/j.ijheatmasstransfer.
- S. M. Lee and K. Y. Kim, “A parametric study of the thermal-hydraulic performance of a zigzag printed circuit heat exchanger,” Heat Transfer Eng., vol. 35, no. 13, pp. 1192–1200, 2014. DOI: 10.1080/01457632.2013.870004.
- T. Ma, L. Li, X. Y. Xu, Y. T. Chen and Q. W. Wang, “Study on local thermal-hydraulic performance and optimization of zigzag-type printed circuit heat exchanger at high temperature,” Energy Convers. Manage, vol. 104, pp. 55–66, March 2015. 03.016. DOI: 10.1016/j.enconman.2015.
- J. Pan, et al., “Numerical investigation on thermal-hydraulic performance of a printed circuit LNG vaporizer,” Appl. Therm. Eng, vol. 165, p. 114447, Jan. 2020. DOI: 10.1016/j.applthermaleng.2019.114447.
- T. L. Ngo, Y. Kato, K. Nikitin and N. Tsuzuki, “New printed circuit heat exchanger with S-shaped fins for hot water supplier,” Exp. Therm. Fluid Sci., vol. 30, no. 8, pp. 811–819, 2006. DOI: 10.1016/j.expthermflusci.2006.03.010.
- N. Tsuzuki, Y. Kato and T. Ishiduka, “High performance printed circuit heat exchanger,” Appl. Therm. Eng., vol. 27, no. 10, pp. 1702–1707, 2007. 07.007. DOI: 10.1016/j.applthermaleng.2006.
- X. Y. Xu, Q. W. Wang, L. Li, S. V. Ekkad and T. Ma, “Thermal-hydraulic performance of different discontinuous fins used in a printed circuit heat exchanger for supercritical CO2,” Numer. Heat Transfer A Appl., vol. 68, no. 10, pp. 1067–1086, Nov 2015. DOI: 10.1080/10407782.2015.1032028.
- T. Ma, et al., “Effect of fin-endwall fillet on thermal hydraulic performance of airfoil printed circuit heat exchanger,” Appl. Therm. Eng., vol. 89, pp. 1087–1095, Oct 2015. DOI: 10.1016/j.applthermaleng.2015.04.022.
- W. X. Chu, X. H. Li, T. Ma, Y. T. Chen and Q. W. Wang, “Study on hydraulic and thermal performance of printed circuit heat transfer surface with distributed airfoil fins,” Appl. Therm. Eng., vol. 114, pp. 1309–1318, Mar 2017. DOI: 10.1016/j.applthermaleng.2016.11.187.
- X. Y. Cui, et al., “Numerical study on novel airfoil fins for printed circuit heat exchanger using supercritical CO2,” Int. J. Heat Mass Transfer, vol. 121, pp. 354–366, Jan 2018. DOI: 10.1016/j.ijheatmasstransfer.2018.01.015.
- W. X. Chu, K. Bennett, J. Cheng, Y. T. Chen and Q. W. Wang, “Thermo-hydraulic performance of printed circuit heat exchanger with different cambered airfoil fins,” Heat Transfer Eng., vol. 41, pp. 708–722, 2019. DOI: 10.1080/01457632.2018.1564203.
- Z. Zhao, K. Zhao, D. Jia, P. Jiang and R. Shen, “Numerical investigation on the flow and heat transfer characteristics of supercritical liquefied natural gas in an airfoil fin printed circuit heat exchanger,” Energies, vol. 10, pp. 1828–1845, 2017. Nov. DOI: 10.3390/en10111828.
- P. A. Brandner and G. J. Walker, “Hydrodynamic performance of a vortex generator,” Exp. Therm. Fluid Sci., vol. 27, no. 5, pp. 573–582, 2003. DOI: 10.1016/S0894-1777(02)00271-6.
- R. D. Mehta, I. M. M. A. Shabaka, A. Shibl and P. Bradshaw, “Longitudinal vortices imbedded in turbulent boundary layers,” Presented at the AIAA 21st Aerospace Sciences Meeting, Reno, Nevada, USA, Jan. 10–13, 1983. DOI: 10.2514/6.1983-378.
- X. H. Wu, P. Yuan, Z. M. Luo, L. X. Wang and Y. L. Lu, “Heat transfer and thermal resistance characteristics of fin with built-in interrupted delta winglet type,” Heat Transfer Eng., vol. 37, no. 2, pp. 172–182, 2016. DOI: 10.1080/01457632.2015.1044397.
- H. Naik and S. Tiwari, “Effect of rectangular winglet pair in common flow down configuration on heat transfer from an isothermally heated plate,” Heat Transfer Eng., vol. 39, no. 20, pp. 1774–1789, 2018. DOI: 10.1080/01457632.2017.1388946.
- L. H. Tang, J. Pan and B. Sundén, “Parametric study and optimization on heat transfer and flow characteristics in a rectangular channel with longitudinal vortex generator,” Numer. Heat Transfer A Appl., vol. 76, no. 11, pp. 830–850, Oct 2019. DOI: 10.1080/10407782.2019.1673095.
- L. H. Tang, W. X. Chu, N. Ahmed and M. Zeng, “A new configuration of winglet longitudinal vortex generator to enhance heat transfer in a rectangular channel,” Appl. Therm. Eng., vol. 104, pp. 74–84, May 2016. DOI: 10.1016/j.applthermaleng.2016.05.056.
- L. H. Tang, S. C. Tan, P. Z. Gao and M. Zeng, “Parameters optimization of fin-and-tube heat exchanger with a novel vortex generator fin by Taguchi method,” Heat Transfer Eng., vol. 37, no. 3–4, pp. 369–381, 2016. 1052715. DOI: 10.1080/01457632.2015.
- S. Mokhatab, J. Y. Mak, J. V. Valappil and D. A. Wood, Handbook of Liquefied Natural Gas, Burlington: Gulf Professional Publishing, 2013.
- Y. Yan, C. Sun, H. Han and Y. Li, “Experimental study on thermal performance of FLNG spiral wound heat exchanger under sloshing conditions,” J. Therm. Sci., vol. 28, no. 5, pp. 1042–1053, Aug 2019. DOI: 10.1007/s11630-019-1202-9.
- B. B. Kanbur, L. Xiang, S. Dubey, F. H. Choo and F. Duan, “Cold utilization systems of LNG: A review,” Renew. Sust. Energy Rev., vol. 79, pp. 1171–1188, 2017. Nov. DOI: 10.1016/j.rser.2017.05.161.
- L. Pu, et al., “Thermal performance analysis of intermediate fluid vaporizer for liquefied natural gas,” Appl. Therm. Eng, vol. 65, no. 1–2, pp. 564–574, Apr 2014. DOI: 10.1016/j.applthermaleng.2014.01.031.
- S. Chen, et al., “Pinch point analysis of heat exchange for liquid nature gas (LNG) cryogenic energy using in air separation unit,” Int. J. Refrig., vol. 90, pp. 264–276, June 2018. DOI: 10.1016/j.ijrefrig.2017.12.015.
- H. K. Versteeg and W. Malalasekera, An Introduction to Computational Fluid Dynamics: The Finite Volume Method, London, UK: Pearson Education, 2007.
- D. Palko and H. Anglart, “Theoretical and numerical study of heat transfer deterioration in high performance light water reactor,” Sci. Technol. Nucl. Install., vol. 2008, pp. 1–5, Aug 2008. DOI: 10.1155/2008/405072.
- F. R. Menter, “Two-Equation eddy-viscosity turbulence models for engineering applications,” Aiaa J, vol. 32, no. 8, pp. 1598–1605, 1994. DOI: 10.2514/3.12149.
- L. H. Tang, X. P. Du, J. Pan and B. Sundén, “Air inlet angle influence on the air-side heat transfer and flow friction characteristics of a finned oval tube heat exchanger,” Int. J. Heat Mass Transfer, vol. 145, p. 118702, Dec. 2019. DOI: 10.1016/j.ijheatmasstransfer.2019.118702.
- C. B. Dang and E. Hihara, “In-tube cooling heat transfer of supercritical carbon dioxide. Part 1. Experimental measurement,” Int. J. Refrig., vol. 27, pp. 736–747, Nov. 2004. DOI: 10.1016/j.ijrefrig.2004.04.018.
- W. M. Kays and A. L. London, “Heat transfer and flow friction characteristics of some compact heat exchanger surfaces,” Trans. ASME, vol. 72, pp. 1075–1097, 1950.