
 ?Mathematical formulae have been encoded as MathML and are displayed in this HTML version using MathJax in order to improve their display. Uncheck the box to turn MathJax off. This feature requires Javascript. Click on a formula to zoom.
Abstract
Boiling phase-change plays a crucial role in heat transfer as it can dissipate higher heat fluxes than single phase. Bubble nucleation, growth, motion (oscillation or leaping), coalescence and departure, govern the boiling and the heat transfer performance on wires. Many factors affect the bubble mechanisms and interactions taking place, which include the nature of the fluid, experimental conditions, thermocapillary effects, etc. This work investigates the bubble oscillation and leaping phenomena caused by thermocapillary effects in the presence of oxygen and air as non-condensable gases during boiling on a platinum micro-wire. More in particular, the bubble oscillation performance is compared under various bulk temperatures and heat fluxes for two different non-condensable gases. It is observed that for a similar fluid bulk temperature, the lower the heat flux the longer the bubble displacement. Moreover, bubble oscillation phenomenon is influenced by the concentration of non-condensable gas dissolved in the liquid showing larger harmonic periods and shorter waiting times with decrease in the contact line pinning force by approximately 7–44% in the presence of air when compared to nitrogen. Last during oscillations, bubble leaping phenomenon was observed as a consequence of the interaction between the jet flows above the oscillating bubble.
Introduction
Research in pool boiling heat transfer could be traced back to the 1930s and the established seminal pool boiling curve by Nukiyama [Citation1]. Despites almost 100 years have passed since the work of Nukiyama, the last 30 years have seen an increased number of experimental works focused on the boiling process to better understand the mechanisms of phase change heat transfer in the so called nucleate boiling region [Citation2]. In particular, the nucleate boiling region, where the heat flux is lower than the critical heat flux empowers high heat-transfer coefficients with a relatively low-temperature difference between the wall and the fluid. Several mechanisms have been proposed to explain the energy transfer during nucleate boiling, such as enhanced convection, transient conduction, microlayer evaporation and contact line heat transfer [Citation2]. In addition, other influencing factors, such as surface characteristics including wettability and structure, the composition of the fluid, and thermocapillary effects, provide potential alternatives to enhance heat transfer during nucleate boiling regime [Citation3, Citation4]. Furthermore, with the trend in the miniaturization of heat transfer devices, the need for a microscale understanding of boiling heat transfer has become paramount [Citation5]. Therefore, the complete understanding of bubble dynamics during nucleate boiling on micro-structures or micro-wires is key for the optimization of heat transfer process [Citation3–8]. Especially for a thin heating wire, there exist many interesting phenomena during subcooled nucleate pool boiling, which include bubble top jet flow [Citation3, Citation9, Citation10], bubble oscillating [Citation11], bubble circling [Citation12, Citation13], bubble coalescence [Citation14], and bubble leaping [Citation15, Citation16], among others.
In addition, when looking into the effect of temperature on fluids, Marangoni thermocapillary convection induced by surface tension gradients, due to temperature differences along a liquid-vapor interface, may ensue. Thermocapillary convection was first described by Carlo Marangoni in the 1860s [Citation17], who investigated the spreading of an oil drop on a water surface. However, it was not until the early 1960s, when few studies emerged linking surface tension variations as being responsible for observed jets and thermocapillary convection within bulk fluids, which could be effectively exploited to enhance the heat transfer during nucleate boiling. Some researchers [Citation3, Citation8, Citation12–16, Citation18] have indicated that thermocapillary plays an essential role in bubble migration. Due to the local surface tension differences caused by the gradient/variation in the temperature field, under subcooling conditions, i.e., bulk temperature colder than that of the wire, thermocapillary convection may drive the fluid around the bubble upwards, which combined to the different density of the bulk fluid leads to a rising plume above the bubble [Citation11, Citation19].
When looking into the motion of a typical bubble oscillating over a wire caused by Marangoni flow, three stages are readily identified: First, a bubble nucleates and grows from a nucleation site and thereafter migrates along the wire from the nucleation site toward another stationary bubble. Secondl, when the nucleated moving bubble is close to the stationary bubble, it reverses the direction of the motion especially at relatively low heat fluxes. During this stage, the temperature in front edge of the moving bubble is lower than on the rear edge. Thus, the bubble migration shifts in the opposite direction. The absence of bubble coalescence was described by Zhou et al. [Citation12] as per the presence of a thin liquid film that prevents the coalescence of bubbles. Similarly, Ozbey et al. [Citation11] found that the horizontal component of the thermocapillary thrust force counteracts that of the drag force and an oscillating bubble stops upon approaching another stationary bubble and thereafter oscillating bubble moves in the opposite direction repeating the stages described above.
In detail, the dominant driving force of the oscillating bubble arises from the thermocapillary convection, which is strongly influenced by the phase-change heat transfer process around the bubble [Citation20]. Due to the asymmetrical temperature distribution around the moving bubble, the unbalanced horizontal component of the Marangoni force and pressure difference around the bubble could lead the bubble to move toward the higher temperature region. Meanwhile, an increasing drag force as the bubble grows bigger coupled to the decrease in the temperature gradient as the bubble approaches a stationary bubble, both oppose to the oscillating bubble motion. In this situation, the evaporation happens at the bubble interface on the hot liquid layer and the condensation happens at the bubble interface on bulk liquid. To note is the visibly indicated plume rising above the bubble, extending further, and vanishing into the bulk fluid caused by the density difference as the bulk fluid near the bubble apex heats up and/or due to thermocapillary effects as these types of plumes were additionally observed to develop in the horizontal direction, i.e., no buoyancy effect, on vertical wires [Citation21]. Moreover, the thermocapillary effect is influenced by the operating conditions, which are sensitive to subcooling degree while less sensitive to the system pressure [Citation3].
In order to study the Marangoni effect on the bubble dynamics during nucleate boiling, some researchers [Citation22] highlight that Marangoni flow with water might be slightly more substantial than it is with ethanol as a working fluid presumably owed to the greater variation in surface tension with temperature for water than for other organic fluids. In addition, the bubble velocity increases with increasing heat flux, and the maximum bubble diameter provides the maximum bubble velocities [Citation3]. It was noticed by Pi and Rangwala [Citation23] that the back-and-forth bubble oscillating motion could be observed on inclined wires at small heat flux, whilst higher heat fluxes were required for such oscillation motion on horizontal wires presumably due to the faster bubble growth and associated buoyancy forces. These observations further indicated that the thermocapillary thrust is strong enough to act against buoyancy. More recently, Xu et al. [Citation24] investigated bubble oscillating on a micro-wire in subcooled nucleation pool boiling conditions; in their work, the oscillating velocity decreases with increasing the micro-wire diameter for the same heat flux. It is also reported that increasing the subcooling degree would increase the velocity of the oscillating bubble for some diameters.
In addition, several studies have indicated the influence of non-condensable gases on the thermocapillary flow for a stationary bubble. The diffusion resistance is caused by the non-condensable gas, which increases the vapor pressure and temperature gradient along the bubble interface, which in turn enhances the thermocapillary flow around the bubble [Citation22–25]. Wang et al. [Citation20] stated that the non-condensable gas inside the bubble may decrease phase-change heat transfer facilitating bubble return. By comparing numerical analysis with experimental result, Christopher et al. [Citation26] indicated that non-condensable gases limit the heat transfer at the bubble interface. In their numerical study, Marangoni flow caused by temperature gradients on the bubble interface is not strong enough to cause bubble motion unless non-condensable gases or some other mechanism is present to reduce the condensation heat transfer at the interface. The liquid sub-cooling degree could be hence directly correlated with the increases heat transfer rate and bubble velocity. This conclusion was proposed by Ozbey et al. [Citation11], who speculated that Marangoni convection would not be strong enough to move the bubble unless non-condensable gases exist inside the bubbles since the presence of non-condensable gases degrades condensation heat transfer. In their results, bubble oscillation was attributed to the Marangoni thrust force, and the increase in heat flux resulted in higher oscillation velocities due to the increase in temperature gradients. However, no experimental observations support the numerical results and predicted trends [Citation11, Citation26]. In addition, dissolved gases’ concentration around the moving bubble may change when the bubble motion occurs. Therefore, although there is a detailed numerical analysis of non-condensable gases on immobile bubbles and speculation on the influence of bubble motion, there is still a need for more experimental analysis to understand further the influence of non-condensable gases on bubble oscillation due to the complex interaction between bubbles.
Bubble leaping is a further mechanism often investigated combined with bubble oscillating since the leaping process is highly related to the Marangoni effect. A vertical leaping of the small bubble with a jumping height of 0.12 mm has been reported by Lu and Peng [Citation14]. This work on bubble leaping is complemented by Ozbey et al. [Citation11], who reported a bubble leaping height of 0.050 mm from the wire as a consequence of Marangoni thrust force acting on the bubble initiated by the nucleation jet flow. When the oscillating bubble approaches a nucleation site of a stationary growing bubble, a sharp opposite temperature gradient along the wire ensues, which slows down the bubble and the carried inertia may push the bubble to leap above the heating surface [Citation11]. During the leaping the bubble significantly shrinks during process [Citation11]. Another type of bubble leaping during bubble oscillating has been defined by Lu and Ding [Citation9] in which the superposition of lift force applied by the jet flow and the buoyancy force caused the bubble to rise above the wire. After the bubble rises, the diameter of the leaping bubble starts to decrease due to condensation. After that, the Marangoni thrust force drags the bubble back to the wire. The bubble volume variation and interfacial thermocapillary forces were critical in bubble leaping and oscillating processes [Citation14].
So far, the mechanisms of thermocapillary force on bubble oscillating still need further investigation, especially when accompanied by complex internal and interfacial flows. Although previous numerical studies have speculated that the presence of non-condensable gas is key to bubble motion and oscillations reported, there are no experimental results to prove this. In addition, the effect of the concentration of non-condensable gas on bubble oscillation is not clear to date. From the above, current analysis of bubble dynamics on a wire mainly focuses on isolated bubbles. The objectives of this study are to investigate the effect of non-condensable gas and the degree of subcooling on bubble oscillation. Bubble oscillation observations at various bulk temperatures and heat flux are here observed and further analyzed by measuring the bubble growth diameter, velocity evolution, and frequency. In addition, the further insights on the effect of non-condensable gas concentration on bubble oscillation and leaping were provided.
Experimental setup
Experiments are conducted in a pool boiling apparatus comprised by an enclosed chamber and a platinum wire of 100 µm in diameter and 80 mm length for a wide range of pressures and bulk fluid temperatures. Schematics of the experimental setup is shown in . shows schematics of the boiling chamber is a cylindrical vessel made of stainless-steel (outer diameter of 150 mm, inner diameter of 140 mm and depth of 100 mm), with two optical glass windows of 80 mm in diameter on the front and back sides. Two thermocouples with ±0.1 K accuracy were located within the chamber above and below the micro-wire to measure the vapor and liquid temperature respectively. A cartridge heater, controlled by a proportional integral derivative controller, was installed at the bottom of the chamber to preheat, and maintain the bulk fluid temperature conditions the most uniform possible within the boiling chamber. A high-speed camera and a light source were arranged in the front and back of the boiling chamber to observe and record bubble dynamics. During the experiments, the pressure of the boiling chamber is maintained ambient pressure at approximately 102 kPa. The heating power Q and heat flux on the wire are calculated via EquationEqs. (1)
(1)
(1) and Equation(2)
(2)
(2) :
(1)
(1)
(2)
(2) where Q is the heating power (kW); U is the voltage (V); I is current (A);
is heat flux (kW/m2); and A is the surface area of the wire (m2).
Figure 1. Schematic of the experimental setup including experimental chamber with an inner and outer diameters equal 140 and 150 mm, respectively, and 100 mm in depth, two transparent windows of 80 mm diameter, cartridge heater, liquid and vapor thermocouples, platinum micro-wire, valves for the control of the non-condensable gas inlet and outlet, temperature and heater controllers for the bulk fluid as well as for the wire.
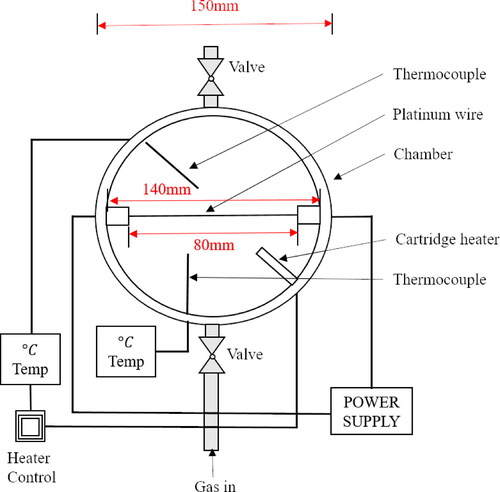
The experiments used deionized water for the investigation. The non-condensable gas was bubbled through the bottom valve to change the concentration of non-condensable gas in the fluid. Pure nitrogen and air (containing both nitrogen and oxygen) were selected in this experiment. In order to ensure that non-condensable gases are fully dissolved in 1 L deionized water by bubbling nitrogen or air for one hour prior to the first experiment. Thereafter gases were bubbled for 30 min between different heat flux experiments. In the case of nitrogen, the top and bottom values are closed during the experiment to make sure there is no air in this chamber. Different bulk fluid temperatures were maintained during the experiments to investigate the bubble dynamics with different heating power and under different subcooling conditions. For the case of air as non-condensable gas, bubble oscillating phenomena could be observed when the bulk temperature ranged between 25 and 65 °C bulk temperature with heat flux between 835 and 1,336 kW/m2. For nitrogen as non-condensable gas, bubble oscillating phenomena could be observed between 35 and 55 °C bulk temperature with heat flux between 1,336 and 2,000 kW/m2.
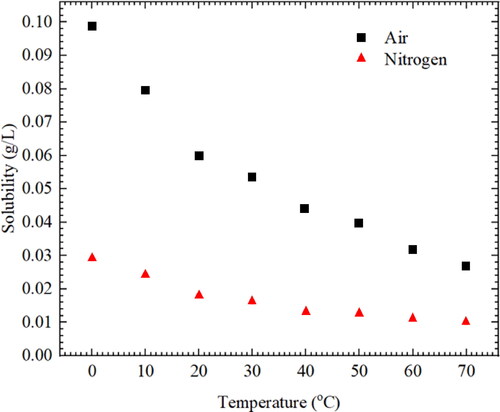
To understand the effect of non-condensable gas in the bubble oscillation behavior, nitrogen and air (which is made of approximately 78% nitrogen and 21% oxygen) was respectively used as dissolved gases during the boiling experiments to investigate non-condensable gases’ effect on bubble oscillating. And the similar experimental observations after most of the non-condensable gases present in the bulk fluid were also carried out via boiling showing absence of oscillations. The concentration dissolved gas in a bulk liquid can be estimated for each individual component, i.e., for nitrogen and for oxygen, following Henry’s law as represented in EquationEq. (3)(3)
(3) [Citation27], while the total air concentration can be calculated by adding the individual dissolved gas concentrations of nitrogen and oxygen as in EquationEq. (4)
(4)
(4) :
(3)
(3)
(4)
(4) where
is the concentration as the mass of gas to volume/mass of water,
is mole fraction or molar fraction of the dissolved gas either nitrogen N or oxygen O, M is the molar mass (kg/mol), and
is Henry’s law constant which is function of the system pressure [Citation27]. The soluble gas rate calculations for air and nitrogen in water are shown in .
Figure 2. Dissolved gas in water.
A high-speed camera (Mako-CCD, Allied vision, Germany) enable the recording of up to 500 frames per second in 640 480 pixels. The sequence of images is then used to monitor and extract quantitatively the bubbles motion by making use pf the software ImageJ. Quantitative measurements included bubble frequency, bubble growth rate, and bubble oscillation velocity. The measurement error of the bubble oscillation velocity was defined by the camera recording uncertainty which is ±16 frames per second (0.032 s) as recording at 500 frames per second and the image resolution which is about ± 4px. The uncertainty propagation was calculated as follows [Citation11]:
(5)
(5) where
is the uncertainty in this experiment,
and
are the experimental variables and their corresponding uncertainties, respectively. All uncertainties used in this experiment are listed in .
Table 1. Uncertainties in the experimental parameters.
Experiment results of bubble oscillation with dissolved air
The bubble oscillation dynamics at different sub-cooling degrees and range of heat fluxes were investigated and compared. In the case of air as dissolved gas, the bubble nucleates and grows in a rather unstable fashion while tiny bubbles appear upon departure for heat flux above 1,336.9 kW/m2. Hence experiments were conducted at 3 different applied heat fluxes ranging between 833.6 and 1,336.9 kW/m2 to avoid vibrations of the heating wire owed to the bubble instabilities, which are represented in . additionally includes the conditions studied when nitrogen is present as the dissolved gas. Under these conditions, all heat fluxes at different bulk temperatures were systematically addressed to explore the effective mechanisms of the isolate bubble interactions.
Table 2. Experimental conditions when oscillation bubble start under air and nitrogen as the dissolved non-condensable gas.
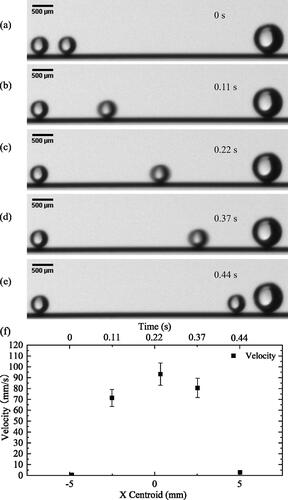
Bubbles oscillation snapshots and quantification of the position and velocity under 25 °C fluid bulk temperature at 835 kW/m2 are represented in . In the first stage, oscillating bubble velocity accelerates during the motion from the left end to the midpoint, which can be observed in . In the second stage, when the bubble is past the midpoint, the movement velocity slows down from the midpoint to the right end as shown in . The bubble repeats the first and second stages described above when moving from left to right. The velocity of the bubble on the wire function the X-centroid and time is reported in with the highest velocity at the midpoint and deceleration showing as the oscillating bubble approaches the stationary one.
Figure 3. Bubble oscillating snapshots at 25 °C bulk temperature and 835 kW/m2 heat flux: (a) bubble at right end at 0 seconds; (b) bubble between right end and midpoint at 0.11 seconds; (c) bubble at the midpoint at 0.22 seconds; (d) bubble between the midpoint and left end at 0.37 seconds; (e) bubble at left end at 0.44 seconds; (f) velocity function of X-centroid position and time of snapshots (a) to (e).
The bubble movement, as described above, is caused by thermocapillary stress due to the temperature gradients created during bubble growth. For the common fluids such as water, the surface tension of the fluids exhibits an Eötvös rule where the surface tension decreases with increasing temperature [Citation11]. The thermocapillary force, drives then the fluid around the bubble from the high-temperature region to the cold-temperatures region. As the bubble oscillates reaching one of the fixed bubbles at either extreme, the temperature gradient changes direction and as such the new temperature gradient field drives the bubble to move in the opposite direction from the cold-temperature region to the high-temperature region.
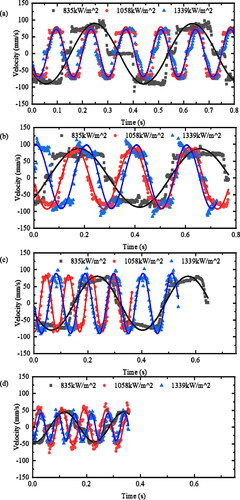
When a bubble nucleates and grows to a specific diameter from the nucleation site on the thin wire, it migrates along the wire from the nucleation site and oscillates between two stationary bubbles. In this process, the oscillating bubble repeats the motion stages described in . A plot of the bubble oscillating velocity at different heat fluxes and various bulk temperatures studied here is shown in . It can be seen from that for bulk temperatures equal 45 and 55 °C the lower the heat flux, the longer the bubble oscillating period and the longer waiting time before a bubble begins the motion in the opposite direction. Especially, bubble velocity variation is more significant between 835.6 and 1,058.4 kW/m2 than the velocity variation between 1,058.4 and 1,336.9 kW/m2. It is clear from the data presented that the number of bubble oscillating period increases with higher heat flux and decreases with higher bulk temperature. Trends represented in are representative of this oscillating phenomenon dominant during boiling on wires and under specific experimental conditions studied and presented in .
Figure 4. Bubble oscillating velocity (mm/s) versus time (s) with different heat fluxes (kW/m2) for different bulk temperatures: (a) 25 °C; (b) 35 °C; (c) 45 °C; and (d) 55 °C.
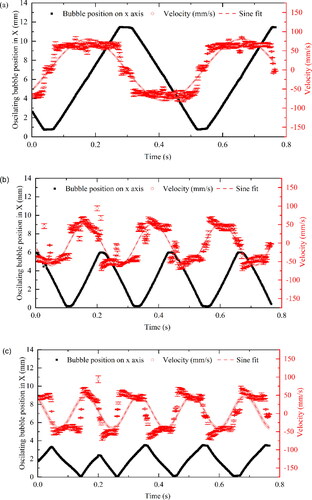
The effect of heat flux on the oscillatory bubble motion can be observed by comparing the oscillating bubble velocity and distance between a moving bubble and the onset position obtained at difference bulk temperatures of 25 and 35 °C, which are represented in and , respectively. On the one hand, experimental results show a reduced trend in the offset distance between bubble location and onset point with increasing heat flux. In the case of 25 °C bubble oscillation distance range between 10 mm for low heat flux and 4 mm for medium and high heat flux, while at higher fluid bulk temperature of 35 °C the oscillating distances are 11, 6 and 3 mm. On the other hand, the more considerable offset distance takes a slightly longer oscillating period with decreasing heat flux. For instance, at 25 °C bulk temperature, the maximum velocity is about 100 mm/s independently of the heat flux studied, while the oscillating complete period (defined as one full oscillation cycle between two stationary bubbles) at is approximately 2.5 s at 835 kW/m2. This is significantly longer than an oscillating period of 2.0 s at 1,058.4 kW/m2 than 1.3 s at 1,339 kW/m2. In this work, the longer distances traveled are a consequence of the longer periods at low heat flux when compared to high heat flux conditions, i.e., 835 versus 1,339 kW/m2, which are in turn related to the distance between stationary bubbles.
Figure 5. Bubble oscillating velocity (mm/s) and travel distance (mm) with 25.0 °C bulk temperature under various heat fluxes (a) 835.6 kW/m2; (b) 1,058.4 kW/m2; and (c) 1,336.9 kW/m2.
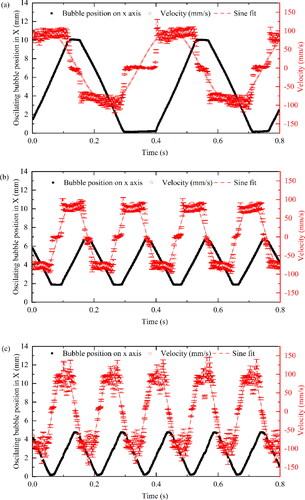
Figure 6. Bubble oscillating velocity (mm/s) and travel distance (mm) with 35.0 °C bulk temperature under various heat fluxes (a) 835.6 kW/m2; (b) 1,058.4 kW/m2; and (c) 1,336.9 kW/m2.
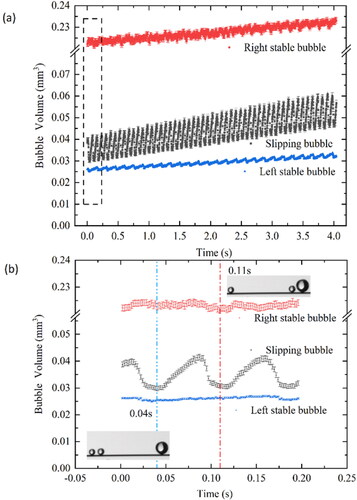
When a nucleated bubble starts to oscillate on the wire, the diameter of the moving bubble depends on its location and the distance between the two stationary bubbles. In an oscillating bubble has a higher growth rate than the two stationary bubbles located at the left and right ends. The oscillating bubble’s growth rate is approximately 0.00251 ± 0.00022 mm3/s, which is 2–3 times that of the left and right stationary bubbles calculated as 0.00078 ± 0.00001 and 0.00127 ± 0.00006 mm3/s. It can be seen that the volume of the stationary bubbles is influenced by the oscillating bubble, which are represented versus time between 0 and 4 seconds in . Moreover, oscillating bubbles often happen when two stationary bubbles have a clear volume difference. Enlarged area within the dashed lines from are further detailed in , which shows the changing volume of bubbles during bubble oscillation for a smaller time scale from 0 to 0.20 s. After the bubble nucleates and grows, then it oscillates toward the left stationary bubble and then starts to shrink with a volume of approximately 0.03 mm3 at 0.04 s. Thereafter as the bubble changes direction and moves toward the right stationary bubble, it grows to approximately 0.045 mm3 at 0.11 s, as shown in . Despites the bubble volume oscillates between 0.03 and 0.04 mm3, i.e., 15% differences in volume when considering the average for a 2.5% change in diameter. And hence for simplicity, the forces acting in the vertical direction such as buoyancy forces were neglected, which is a reasonable assumption. In addition, the change in volume of both the small and the big stationary bubbles are less pronounced than that of the oscillating bubble. To explain that the change in volume of the oscillating bubble, as the oscillating bubble gets closer to one of the stationary bubbles, these two bubbles’ diameters decrease synchronously, which may be due to the aspect ratio change due to exerted stresses and/or to the cooling of the wire and the bubbles causing condensation. At 0.04 and 0.11 s, the oscillating bubble stops in front of the left and right stationary bubbles respectively and the volume of the large stationary bubble on the right decreases from 0.225 to 0.222 mm3 while the volume change of the small left bubble is less obvious, which may be explained by the insufficient resolution of the camera. Although the volume change of the right stationary bubble is not significant, the volume of the stationary bubble reaches a minimum value at each harmonic motion as the moving bubble approaches the stationary one.
Figure 7. Bubble volume (mm3) versus time (s) with 1,058kW/m2 heat flux at 25°C bulk temperature (a) between 0 and 4 s and (b) enlarged region within dashed lines representing time between 0 and 0.25 s.
Fast Fourier transform (FFT) results of air bubble oscillating
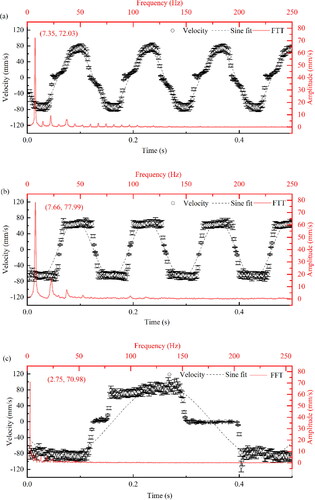
Since the bubble oscillating process can be consider as a harmonic motion, differences on the experimental behavior function of the experimental condition are more clearly to be observed when looking at the frequency of the harmonic motion, which is represented in along with the bubble velocity. The FFT analysis of the bubble motion for a fluid bulk temperature of 45 °C shows the oscillation frequency increase from 2.75 to 7.65 Hz by increasing the heat flux from 835.6 to 1,058 kW/m2, which is in the same order of magnitude as the values estimated via the characteristic oscillation frequency which is approximately 8 Hz for heat fluxes between 835.6 and 1,058 kW/m2.
As shown in , the bubble oscillating velocity and frequency do change non-monotonically with different heat fluxes. The maximum oscillating velocity was observed at a heat flux of 1,058 kW/m2. From FFT analysis results, the amplitude value relevant to the bubble velocity sits at an average value of 74.50 mm/s with a deviation of ±3.50 mm/s regardless of the conditions studied. At low bulk temperatures of 25 °C heat flux has a negligible impact on the bubble velocity. To note is the different multiple vertical peaks showing smaller amplitudes at higher frequencies implying the non-uniform motion of the oscillating bubbles. Nonetheless, the amplitude of the peaks at frequencies higher than the dominant one is generally 4 to 6 times smaller than that of the dominant one as can be extracted from .
Figure 8. FFT analysis of bubble velocity (mm/s) versus time (s) and amplitude (mm/s) versus frequency (Hz) with 45 °C bulk temperature, and air as non-condensation gas. In brackets the frequency in Hz and the amplitude in mm/s is shown. (a)1,336.9 kW/m2; (b) 1,058.4 kW/m2; and (c) 835.6 kW/m2.
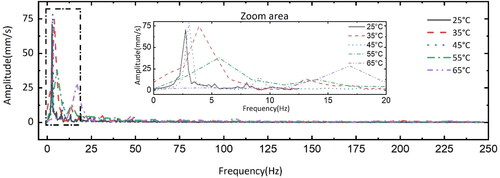
illustrates the frequency and amplitude at low heat fluxes of 835 kW/m2 for different fluid bulk temperatures between 25 and 65 °C. The result shows that the maximum amplitude decreases as with increasing the fluid bulk temperature while the frequency at which the maximum peak appears decreases with decreasing fluid bulk temperature. The most frequent maximum bubble oscillating amplitude is reported within the dominant frequency, which is higher than 70 Hz in the range of bulk temperature between 25 and 45 °C with peak frequency values in different bulk temperatures are similar, between 2 and 6 Hz. As the bulk temperature increases, considerable noise is noticed for bulk temperatures above 55 °C with maximum amplitude value halved, i.e., between 25 and 35 mm/s, when compared to 25–45 °C.
Figure 9. Amplitude (mm/s) versus frequency (Hz) with changing bulk temperature between 25 and 65 °C at the lowest heat flux 835 kW/m2.
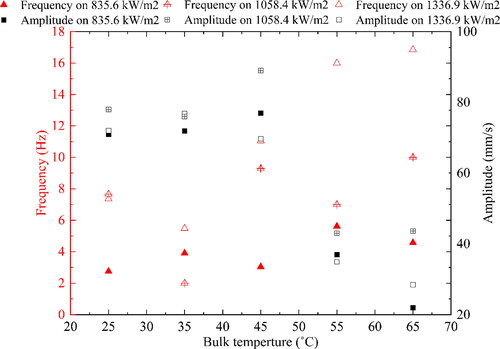
shows a summary of the FFT analysis as maximum amplitude and dominant frequency values for the three different heat flux studied at the different bulk fluid temperatures studied. The maximum amplitude is reported here for the medium of the heat flux 1,058 kW/m2 while frequency typically increases with increasing heat flux. These differences in the amplitude could be explained by the different temperature gradients produced by stationary bubbles of different volumes and at different distances, which constrain both the oscillating bubble distance and velocity.
Figure 10. Frequency (Hz) and amplitude (mm/s) change versus bulk fluid temperatures (°C) under various heat flux.
FFT results of nitrogen bubble oscillating
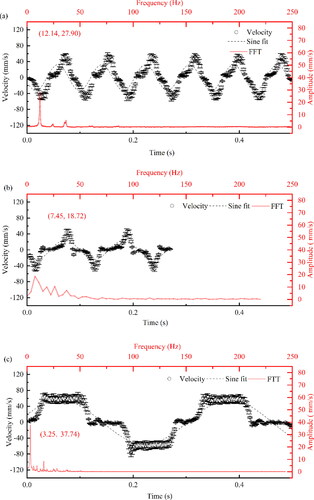
and show the FFT analysis as velocity versus time and amplitude versus frequency for oscillating nitrogen bubbles at bulk fluid temperatures of 45 and 55 °C, respectively, where nitrogen is considered as a non-condensable gas. Compared with the FFT analysis results in the presence of air as non-condensable gas () at 45 °C, lower amplitudes are reported for oscillating bubble in the presence of nitrogen as non-condensable gas when compared to air. When looking at the dominant frequency, values under nitrogen gas conditions ranged between 18 and 45 Hz compared to values between 2 and 6 Hz in the presence of air as non-condensable gas. In the presence of nitrogen as non-condensable gas, there is also noise in the frequency reported seemingly as it happened in the presence of air as non-condensable gas. Nonetheless, the secondary peaks frequency values in the presence of nitrogen are within the range of 5–10 Hz whereas 2–8 Hz is the range reported in the presence of air. This implies that the period was not a regular sine wave caused by the velocity decay with time. The type of dissolved gas plays hence an essential role in bubble oscillation. In the presence of nitrogen as non-condensable gas, the maximum oscillating velocity is around 75 mm/s at 45 °C bulk temperature and a heat flux of 1,790 kW/m2, while oscillating velocities in the presence of air as non-condensable gas were in the order of 100 mm/s for heat fluxes between 835 and 1,337 kW/m2.
Figure 11. FFT analysis of bubble velocity (mm/s) versus time (s) and amplitude (mm/s) versus frequency (Hz) at 45 °C bulk temperature, with nitrogen as non-condensable gas (a) 2,218 kW/m2; (b) 1,790 kW/m2; and (c) 1,336 kW/m2.
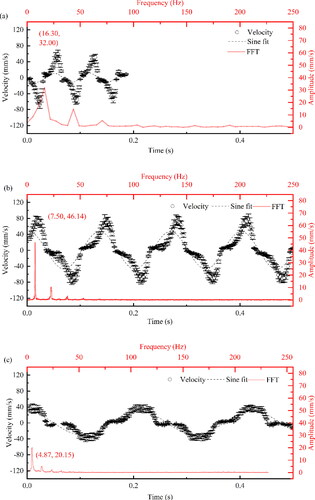
Figure 12. FFT analysis of bubble velocity (mm/s) versus time (s) and amplitude (mm/s) versus frequency (Hz) 55 °C bulk temperature, with nitrogen as non-condensable gas (a) 2,218 kW/m2; (b) 1,790 kW/m2; and (c) 1,336 kW/m2.
The difference between two types of gas on bubble oscillation could be explained by the generated vapor within the bubble diffusing through the thick layer of non-condensable gas to condense at the top of the bubble when a bubble nucleates on the wire [Citation21]. Due to the accumulation of gas, the partial pressure of the vapor and the saturation temperature both decrease along the interface and/or from the bottom to the top of the bubble. The corresponding temperature gradient within the bubble in the presence of non-condensable gas induces a thermocapillary flow around the bubble interface, which removes heat from the condensed vapor. Thermocapillary convection hence reduces it is the driving temperature gradient that leads to a decrease in the interface temperature near the bubble base and an increase near the bubble top. As a consequence, the intensity of the thermocapillary flow around the bubble diminishes. A steady state mass transfer through the bubble interface may be reached when the evaporated mass flow rate at the base of the bubble equals the condensing mass flow rate at the top of the bubble.
Overall, FFT analysis of the amplitude and frequency shows clear differences when comparing the cases of bubble oscillation under air and under nitrogen as the non-condensable gas present. Nitrogen-accumulated bubbles have shorter harmonic motion periods and longer waiting times. Furthermore, the oscillation of the bubbles in the presence of nitrogen as non-condensable gas requires much higher heat fluxes than in the presence of air. Results on the amplitude and frequency imply that oscillating bubbles in the presence of nitrogen require significantly higher thermocapillary forces to overcome drag forces.
Bubble leaping
The bubble leaping behavior could be observed during bubble oscillation on the thin wire under specific experimental conditions. Bubble leaping phenomenon was observed only in deionized water under air as non-condensable gas at 835.65 and fluid bulk temperature of 25 °C. Two different bubble leaping observations are represented in . Qualitatively, the bubble leaping behavior reported here typically ensues when a rather big bubble (when compared to small nucleated bubbles) chases a small moving bubble in the same direction. In this case, the periodic leaping process experiences two stages: the departing and returning stages. The departing and returning stages also present an accelerating and a decelerating stage. During the departing stage, the bubble first leaps from the wire with departing velocity and acceleration reaching a maximum value. Then it decelerates to zero at the highest centroid position, which is around 0.31 mm, away from the wire. Then, in the returning stage, the leaping bubble velocity accelerates during the bubble return motion from the highest position toward the wire. The departing force is larger than the attraction force in the acceleration process, while the attraction force should be larger than the escaping/buoyancy force in the decelerating/returning process, while departing and attraction forces balance each other as the bubble reaches the maximum velocity. The location at maximum velocity or zero acceleration is termed as the equilibrium position.
Figure 13. Bubble leaping when giant bubble chasing small bubble: (a-f) Bubble leaping with time (g) superimposed snapshots of the bubble motion and leaping from (a-f).
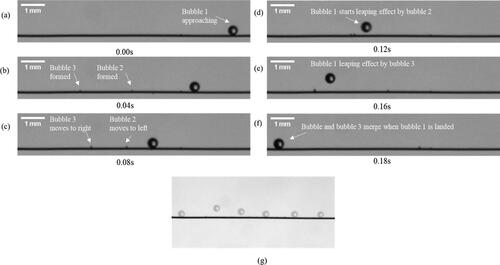
As shown in , a small bubble formed randomly while a larger bubble moved from the left to the right side of the wire. Due to the nucleation of the small bubble, the temperature of the wire locally changes cooling down near the newly nucleated bubble. The decrease in the wire temperature near the nucleated bubble influences the oscillating bubble motion. As the oscillating bubble approaches the nucleated bubble, it decelerates as a consequence of the temperature drop along the wire and then it jumps over the small nucleated bubble, as shown in . The jumping process begins with a vertical decelerating motion as qualitatively described above. When looking closely at the snapshots of the bubble leaping behavior reported in , the oscillating bubble moves from left to right with a thermocapillary and/or buoyancy driven jetting flow directed toward the upper left corner at an angle of approximately 45°. When the two bubbles become closer to each other, then the larger bubble decelerates and nearly stops in front of the small one. The jet flow from the large bubble, represented by white dashed lines, changes direction from an inclined to a more vertical orientation. Meanwhile, when the large bubble stops its motion, the jet flow from the small bubble, represented by white dash lines, changes direction from vertical to an inclined direction toward the large bubble. The inertia carried by the larger bubble toward the right side as it stops coupled to the jet flow from the small bubble are put forward as the mechanisms leading to the leaping behavior of the large bubble. The bubble position and velocity at the different X-centroid positions are represented in for reference.
Figure 14. (a) Bubble leaping process. (b) Y-centroid position and velocity versus X-centroid position for bubble leaping.
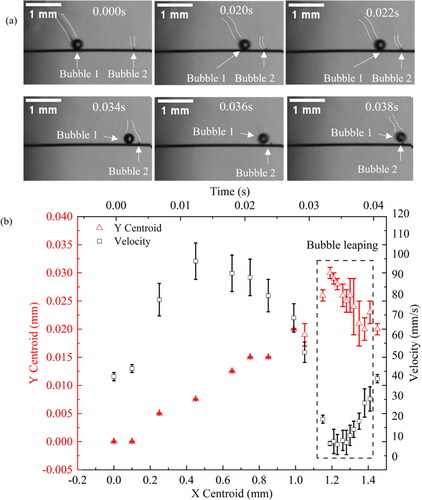
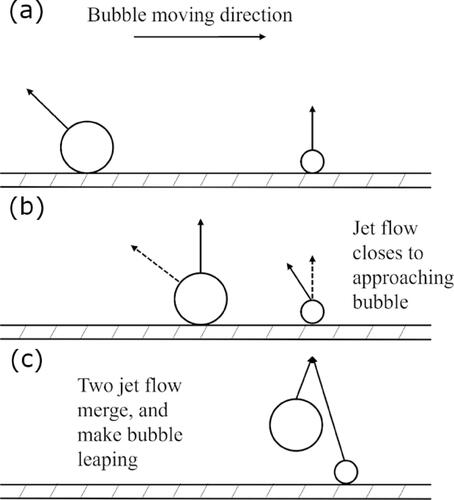
introduces the schematic representation of the bubble leaping phenomenon reported in and . The initial position of bubble the larger bubble, i.e., bubble 1, is represented with a white arrow in at 0.0 s and is considered as X-centroid equals 0. A detailed analysis of the Y-centroid position and velocity versus X-centroid position are shown in . The distance between the two bubbles before bubble 1 starts leaping is measured as 1.03 mm. As bubble 1 approaches the small bubble 2, bubble 1's velocity decreases from 51.32 to 19.89 mm/s and then leaps with the highest point of 0.030 mm. Streamline flows of the two bubbles before leaping ensues, which orientations of the jets are represented in with a black arrow. As the oscillating bubble approaches the stationary one it decelerates and the orientation of the jet changes from oblique to vertical while that of the stationary bubbles inclines toward the oscillating one as represented in . As the bubble decelerates then the leap ensues, and the two jets merge at an intermediate position as represented in . Thereafter, leaped bubble slowly accelerates and descends to the thin wire to merge with the stationary one and continues its motion. The next section analyses the forces involved during the bubble oscillation in the presence of air and nitrogen gas bubbles.
Figure 15. Schematic interaction between bubbles: streamline of jet flows of two chasing bubbles.
Force balance analysis during bubble oscillation
This section analyses the force balance during different bubble oscillation stages along the heated wire. On one hand, in the cases where dissolved air is present bubble oscillations were observed for bulk temperatures between 25 and 65 °C and heat fluxes between 835 and 1,336 kw/m2. On the other hand, in the presence of nitrogen as the dissolved gas, bubble oscillations required a bulk temperature between 35 and 55 °C and heat fluxes above 1,336 kW/m2, and it rarely occurs for heat fluxes below 1,336 kW/m2. In these stages, the jet flow during bubble oscillation is driven by the bubble motion, i.e., thermocapillary or Marangoni effect, and changes direction from oblique to perpendicular as the bubble slows down. When looking at a bubble sitting on a wire, there will be different forces acting on it as represented in . Assuming that the volume of the moving bubble does not increase significantly in one entire cycle of the bubble’s periodic motion, as discussed in , then the contact angle is similar when moving between two stationary bubbles. The force analysis of the bubble stopping next to the stationary bubble is shown in while the force balance analysis during bubble motion is shown below in .
Figure 16. Forces acting on a bubble during different bubble oscillating stages (a) Bubble stopping next to a stationary bubble; (b) Bubble oscillating on the wire. Symbols represent: θ contact angle stationary bubble, θa and θr advancing and receding contact angles for moving bubble, Fp pinning force, FB buoyancy force, FD drag force and FMa (X) and FMa (Y) thermocapillary Marangoni forces in the X and Y directions.
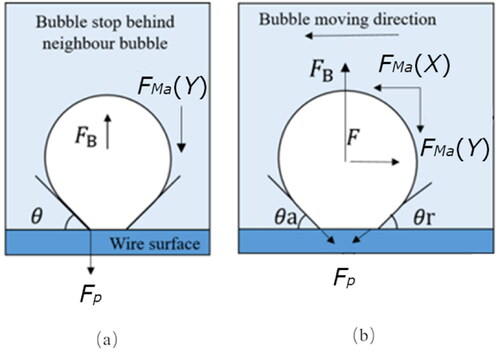
In , when an oscillating bubble stops next to a stationary one the wall-characteristic temperature gradient at the oscillating bubble is at a minimum and left and right contact angles becomes of similar magnitude as the driving force is not enough to overcome bubble pinning to the wire. However, when Marangoni force is strong enough to overcome the main resistance to the motion the bubble then moves and oscillates along the wire. The contact line pinning force, is described by EquationEq. (6)
(6)
(6) :
(6)
(6) where
and
is the advancing and receding contact angles (°) of the oscillating bubble respectively,
is the surface tension and rb is the bubble base radius. In order to estimate the forces empowering the bubble motion, the rather small differences between advancing and receding contact angles were measured for each frame and the average values were used in the calculations.
In addition to pinning, viscous drag force, FD, acting at the bubbles’ interface by the bulk fluid additionally opposes to bubble motion. According to Hadamard–Rybczynski law [Citation11] FD is expressed as:(7)
(7) where
is the liquid viscosity (kg/m s), ub is the bubble velocity (mm/s), and r is the bubble radius (mm). Then the complete force balance where Marangoni force,
favors the bubble motion while both pinning forces, Fp, and viscous drag force, FD, oppose to the motion can be expressed as EquationEq. (8)
(8)
(8) with an accelerating motion for F > 0 while decelerates for F < 0.
(8)
(8)
Therefore, the minimum thermocapillary force, required for the bubble motion to ensue in the horizontal direction could be calculated when the bubble achieves maximum velocity and has a 0 acceleration, i.e., F = 0. For the different experimental conditions, i.e., fluid bulk temperatures, at 1,336 kW/m2, the contact line pinning force, the drag force and the thermocapillary Marangoni force
for air and nitrogen moving bubbles are calculated and displayed in and , respectively.
Table 3. Contact line and drag forces of air bubbles at 1,336 kW/m2.
Table 4. Contact line and drag forces of nitrogen bubbles on 1,336 kW/m2.
When looking at the results presented in and Citation4 comparing the different forces involved for dissolved nitrogen and dissolved air at the same heat flux 1,336 kW/m2, since the size of the bubbles and the velocities displayed are in the same order of magnitude, drag forces are then similar for the different conditions and type dissolved gas. In addition, drag force opposing to the bubble motion have relatively low influence in the oscillations as this is two orders of magnitude smaller than pinning or thermocapillary forces. Then, when comparing the different forces opposing to the bubble motion, pinning forces Fp calculated by EquationEq. (6)(6)
(6) under different conditions and types of non-condensable gas seems to increase with fluid bulk temperature, although the estimated values are within the error bounds. When comparing the different types of dissolved gas, a 6–44% greater pinning forces are estimated in the presence of dissolved nitrogen when compared to air, with the closest values reported at higher fluid bulk temperatures. Since the force balance in EquationEq. (8)
(8)
(8) is mainly governed by the pinning and/or thermocapillary forces, the same trend is reported when looking at the thermocapillary ones with higher thermocapillary forces required for of nitrogen bubbles to oscillate than that of air bubble, also with similar differences between 7 and 44% greater in the presence of nitrogen gas. This result again indicates that the non-condensable gas causes the periodic movement of the bubbles.
Since the bubble oscillation is driven by a thermocapillary force resulting from the temperature gradient arising along the wire as the bubble grows, interfacial flow then ensues from low surface tension to high surface tension regions, i.e., from hot to cold. For ordinary fluids such as water, this means that the interfacial flow moves toward the colder region helping the bubble to move toward the hotter region so to ensure mass conservation. As such, the bubble velocity varies linearly with the temperature gradient [Citation28]. Although a linear relation between the bubble velocity, ub, and the bubble thermal wall-characterized temperature gradient has also been reported in the work of Lamas et al. [Citation21], the similar relation is used to propose by Lajeunesse and Homsy [Citation28], as shown in EquationEq. (9)
(9)
(9) :
(9)
(9) where γT is the change in surface tension with temperature as
is a characteristic dimension in this case assumed as 1 as there is no geometry constrain as in Lajeunesse and Homsy [Citation28],
is function of the aspect ratio of the cross section assumed as the bubble diameter, and µf is the fluid viscosity at the bulk temperature. In the case of γT, the conditions used for the estimation of the surface tensions and temperatures are those at the boiling point and those of the bulk fluid.
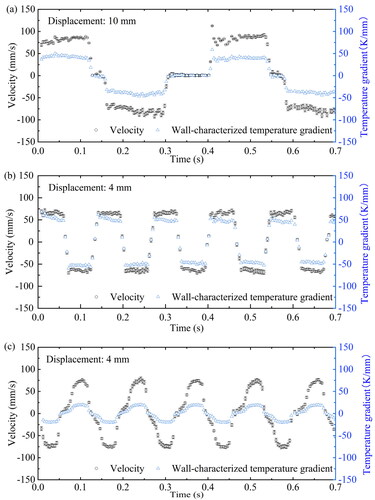
then shows the wall-characterized temperature gradient calculated via EquationEq. (9)(9)
(9) and the oscillating velocities versus time for the different heat flux studied at a bulk fluid temperature of 25 °C under air as non-condensable gas. For simplicity on the representation and analysis, the bubble motion toward the left is considered as positive displacement, while the movement in the opposite direction toward the right is considered negative. The velocity of the bubble oscillation reaches same quantitative absolute maximum values either in the positive or the negative directions, and so does the temperature gradient that simultaneously reaches the maximum positive and negative values of similar magnitude. The maximum value of the wall-characterized temperatures gradient for the different heat fluxes studied were 24.6, 50.0 and 40.7 K/mm at 835, 1,058 and 1,339 kW/m2, respectively, which reveals the strong oscillations of the wire temperature. From it can be seen that although the wall-characterized temperature gradient is significantly different; the maximum velocity at 1,058 and 1,339 kW/m2 heat flux of is approximate 70 mm/s in both cases, while 89 mm/s are reported at 835 kW/m2. Although the bubble velocity has a linear relationship with the temperature gradient, the different heat flux applied seems not to contribute linearly to the wire temperature gradient. This implies that the heat flux is not the main parameter that affects the temperature gradient; nonetheless, it has an effect, to some extent, on the bubble oscillation displacement. Although not accounted for in EquationEq. (9)
(9)
(9) explicitly, the temperature gradient and bubble oscillating velocities are more sensitive to the total bubble displacement, which were 10, 4 and 4 mm for heat flux of 835, 1,058 and 1,339 kW/m2, respectively. Displacement distances reported here are the same as in the case of earlier . When looking into for air as non-condensable gas and at 25 °C fluid bulk temperature, at low and medium heat flux displaying a bubble displacements of 10 and 4 mm, respectively, the wall-characterized temperature gradient is close to each other approximate 40 K/mm with a maximum difference of around 10 K/mm. Whereas for the highest of the heat flux at 1,339 kW/m2 there is a bubble displacement of 4 mm providing a wall-characterized temperature gradient significantly lower of approximate 20 K/mm. In view of the above, the distance between two stationary bubbles plays as well as the size of the stationary bubbles play a more important role on the oscillations than the heat flux or the bulk temperature. By accurately engineering nucleation sites on the wire allowing for a control distance between stationary bubbles, the velocity and temperature gradient ensuing along the wire may be tailored for the specific application.
Figure 17. Bubble oscillating velocity (mm/s) and wall-characterized temperature gradient (K/mm) at 25 °C bulk temperature and air as non-condensable gas for different heat flux (a) 835 kW/m2; (b) 1,058 kW/m2; and (c) 1,339 kW/m2. Maximum displacement is included as figure inset.
Next, this study aims to provide some further insights on the relation between bubble position along the wire during the oscillation with its respective wall-characterized temperature gradient, which are represented in for 25 °C in, at 835 kw/m2 and with air as non-condensable gas. As the oscillating bubbles moves toward a stationary bubble, the bubble velocity is constant and so is the wall-characterized temperature gradient. As the oscillating bubble approaches a stationary bubble, then the bubble decelerates as a consequence of the decrease in the temperature gradient in turn reducing the thermocapillary force favoring the bubble displacement. The result reminds the reader that the decrease in the temperature gradient is a consequence of the heat removed near the stationary bubble as it nucleates and grows. As a temperature gradient ensues around the stationary bubble, then the temperature gradient felt by the oscillating bubble reverses, and it moves in the opposite direction. Thereafter the bubble accelerates reaching a similar maximum velocity than before the oscillation reverses. For the different oscillations, it can be noticed that both the maximum magnitudes of the oscillating distance as well as that of the wall-characterized temperature gradient do not change considerably between periods and are maintained at 10 mm and 40 K/mm, respectively. Despite the bubble growth of all three bubbles involved (one oscillating and two stationary) the removal of heat from the wire and the environment, these do not affect the values of the position, velocity and/or temperature gradient. The maximum and minimum values of the X-centroid position represent to some extent the positions of the stationary bubbles on the left and right ends.
Figure 18. Position X-centroid (mm) and temperature gradient (K/mm) during the oscillating motion at 25 °C and 835 kw/m2 and air as non-condensable gas.
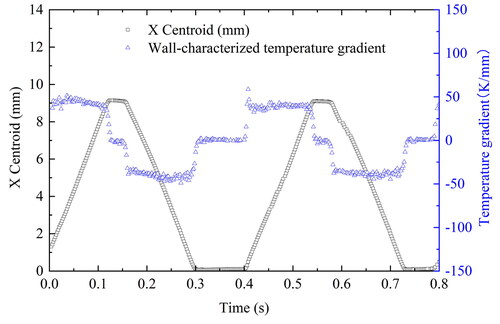
This analysis demonstrates that although the velocity of an oscillating bubble slows down as they approach the stationary ones, the distance between stationary bubbles seems not to affect the maximum temperature gradient, maximum thermocapillary force, and maximum final velocity during the oscillations.
Conclusions
The dynamic bubble oscillations have been visually observed during pool boiling with subcooled deionized water on a horizontal thin platinum wire. Bubble oscillation phenomenon governed by thermocapillary forces has been analyzed under different bulk temperatures, heating powers and the type of dissolved gas. Besides the reported oscillations, bubble leaping resulting from different bubble interactions has been further reported.
This work first observes and analyses the effect of dissolved gases on the bubble oscillating phenomenon. A FFT analysis is proposed to analyze the effect of the different non-condensable dissolved gases on the bubble oscillations. Major conclusions drawn from this study are summarized as follows:
From the FFT and force balance analyses, the results indicate that the oscillating bubble dynamics clearly varies with different solubility of non-condensable gases such as nitrogen and air in terms of bubble, while heat flux and bulk temperature seems to have a lesser effect.
In the presence of dissolved air (0.041 g/l) bubble oscillation ensues for longer harmonic periods, shorter waiting times and require smaller heat fluxes when compared to experiments carried out under dissolved nitrogen (0.018 g/l) gas.
Higher heat flux anticipates the more occurrences of nucleated bubbles shortening the oscillating distance.
The contact line force calculations shows that the contact line force increases by approximately 7 to 44% in the presence of nitrogen as the dissolved gas when compared to air.
The result could conclude on the need for dissolved gas in the bulk fluid for the bubble oscillations to ensue.
| Nomenclature | ||
| A | = | Surface area of the wire, m2 |
| = | Characteristic dimension | |
| = | Mass of gas to mass of water, g/L | |
| F | = | Force, N |
| = | Pinning force, N | |
| FD | = | Drag force, N |
| FB | = | Buoyancy force, N |
| FFT | = | Fast Fourier transform |
| FMa (X) | = | Marangoni force in the horizontal X-direction, N |
| FMa (Y) | = | Marangoni force in the vertical Y-direction, N |
| I | = | Current, A |
| = | Henry’s law constant | |
| = | Molar mass, kg/mol | |
| Q | = | Heating power, W |
| = | Heat flux, kW/m2 | |
| r | = | Bubble radius, mm |
| rb | = | Bubble base radius, mm |
| T | = | Temperature, °C or K |
| = | Uncertainty in this experiment | |
| = | Bubble velocity, mm/s | |
| U | = | Voltage, V |
| V | = | Bubble volume, mm3 |
| = | Mole fraction mol, % | |
| = | Experimental variables | |
| X | = | X-centroid position, mm |
| Y | = | Y-centroid position, mm |
| Greek symbols | ||
| = | Temperature gradient, K/mm | |
| = | Surface tension, N/m | |
| = | Contact angle, | |
| = | Advancing contact angle, | |
| = | Receding contact angle, | |
| = | Function of the aspect ratio of the cross section | |
| = | Liquid viscosity, | |
| γT | = | Surface tension change with temperature, N/(m·K) |
| Subscripts | ||
| N | = | Nitrogen |
| O | = | Oxygen |
Additional information
Notes on contributors

Ningxi Zhang
Ningxi Zhang is a Ph.D. student at the Institute for Multiscale Thermofluids in the School of Engineering, University of Edinburgh. He graduated from the University of Glasgow. His research is on bubble dynamics of the phase-change phenomenon.

Daniel Orejon
Daniel Orejon is a Senior Lecturer in Chemical Engineering at the Institute for Multiscale Thermofluids at the University of Edinburgh. Prior to that he graduated from the University of Seville, received his Ph.D. degree from the University of Edinburgh, worked as Post-doctoral Researcher Associate and as Assistant Professor at the International Institute for Carbon-Neutral Energy Research at Kyushu University in Japan. In addition he holds a Visiting Associate Professorship at WPI-I2CNER (World Premier International Research Center – International Institute for Carbon-Neutral Energy Research) at Kyushu University Japan since April 2019, an Associate Editorship for the International Journal of Heat and Mass Transfer and he has a Fellowship of the Higher Education Academy.

Jionghui Liu
Jionghui Liu is a Research Associate at the Institute for Multiscale Thermofluids in the School of Engineering, University of Edinburgh. He obtained the Ph.D. degree in Power Engineering from Xi’an Jiaotong University. His Ph.D. research was focused on spray cooling in electrical and high-power devices. And then he worked as a post-doctoral at Queen Mary, University of London on flow boiling and condensation of the mixture in the micro-scale heat exchangers. His current work is focused on the phase-change phenomenon and enhance methods in the heat transfer process of thermal management systems.
Khellil Sefiane
Khellil Sefiane is a Professor of Thermophysical Engineering at University of Edinburgh, Associate Editor of International Journal of Multiphase Flow and Exxon Mobil Fellow with expertise in novel experimental techniques for heat and mass transfer, phase change, moving contact line, and flow regime transitions in mixture. He received the Institute of Physics Printing & Graphics Science Group Prize for his “Fundamental studies on droplet evaporation”, and elected U.K. representative on EUROTHERM committee, member of the Scientific Council of the International Center for Heat and Mass Transfer. He has published more than 230 refereed journal papers.
References
- S. Nukiyama, “The maximum and minimum values of the heat Q transmitted from metal to boiling water under atmospheric pressure,” J. Soc. Mech. Eng., vol. 37, no. 206, pp. 367–374, 1934. DOI: 10.1016/0017-9310(66)90138-4.
- J. Kim, “Review of nucleate pool boiling bubble heat transfer mechanisms,” Int. J. Multiph. Flow, vol. 35, no. 12, pp. 1067–1076, 2009. DOI: 10.1016/j.ijmultiphaseflow.2009.07.008.
- G. R. Duursma, F. Jiang, K. Sefiane, S. Duff, and H. Beji, “On the effects of thermocapillary driven oscillations on bubble growth during boiling of FC-72 on a thin wire,” Int. J. Therm. Sci., vol. 50, no. 10, pp. 1809–1819, 2011. DOI: 10.1016/j.ijthermalsci.2011.01.020.
- Y. Hwasung, K. Sridharan, and M. L. Corradini, “Bubble dynamics in pool boiling on nanoparticle-coated surfaces,” Heat Transf. Eng., vol. 36, no. 12, pp. 1013–1027, 2015. DOI: 10.1080/01457632.2015.979116.
- C. David, H. Wang, and X. Peng, “Dynamics of bubble motion and bubble top jet flows from moving vapor bubbles on microwires,” J. Heat Transf., vol. 127, no. 11, pp. 1260–1268, 2005. DOI: 10.1115/1.2039109.
- S. Zhen, X. Chen, and H. Qiu, “Bubble dynamics and heat transfer during pool boiling on wettability patterned surfaces,” Heat Transf. Eng., vol. 39, no. 7–8, pp. 663–671, 2018. DOI: 10.1080/01457632.2017.1325676.
- P. M. Chinmay and S. G. Kandlikar, “Review of the manufacturing techniques for porous surfaces used in enhanced pool boiling,” Heat Transf. Eng., vol. 35, no. 10, pp. 887–902, 2014. DOI: 10.1080/01457632.2014.862141.
- O. Ayako, H. Sakashita, and H. Yoshida, “Macrolayer formation model for prediction of critical heat flux in saturated and subcooled pool boiling,” Heat Transf. Eng., vol. 42, no. 21, pp. 1775–1788, 2021. DOI: 10.1080/01457632.2020.1826738.
- J. F. Lu and J. Ding, “Bubble jet flow interaction during pool boiling of subcooled water on horizontal thin wires,” Heat Mass Transf., vol. 48, no. 9, pp. 1637–1646, 2012. DOI: 10.1007/s00231-012-1010-1.
- L. Zhou, et al., “Multi-jet flows and bubble emission during subcooled nucleate boiling of aqueous n-butanol solution on thin wire,” Exp. Therm. Fluid Sci., vol. 58, pp. 1–8, Oct. 2014. DOI: 10.1016/j.expthermflusci.2014.06.009.
- A. Ozbey, M. Karimzadehkhouei, K. Sefiane, A. Koşar, and J. R. E. Christy, “On bubble dynamics in subcooled nucleate boiling on a platinum wire,” Int. J. Therm. Sci., vol. 137, pp. 1–12, Mar. 2019. DOI: 10.1016/j.ijthermalsci.2018.11.007.
- L. Zhou, L. Wei, Y. Li, X. Du, and B. Wang, “Bubble circling phenomena in subcooled nucleate pool boiling on microwires,” Int. J. Heat Mass Transf., vol. 64, pp. 945–951, Sept. 2013. DOI: 10.1016/j.ijheatmasstransfer.2013.05.023.
- H. Jiang, Y. Zhou, H. Chu, and Y. Yan, “Experimental investigation of bubble jet flow, sweeping and rotation on horizontal or inclined micro-wire during subcooled boiling,” J. Therm. Anal. Calorim., vol. 141, no. 1, pp. 95–106, 2020. DOI: 10.1007/s10973-019-09083-x.
- J. F. Lu and X. F. Peng, “Bubble separation and collision on thin wires during subcooled boiling,” Int. J. Heat Mass Transf., vol. 48, no. 23–24, pp. 4726–4737, 2005. DOI: 10.1016/j.ijheatmasstransfer.2005.05.033.
- Z. Wang, X.-F. Peng, and X.-D. Wang, “Bubble behavior during boiling of subcooled binary mixtures on very thin wires,” Heat Trans. Asian Res., vol. 36, no. 2, pp. 105–111, 2007. DOI: 10.1002/htj.20142.
- J. F. Lu and X. F. Peng, “Bubble leaping and slipping during subcooled boiling on thin wires,” Int. J. Therm. Sci., vol. 45, no. 9, pp. 908–916, 2006. DOI: 10.1016/j.ijthermalsci.2005.12.003.
- J. K. Platten and D. Villers, “An introduction to thermocapillary convection,” in Wetting Phenomenon, vol. 354, J. De Coninck and F. Dunlop, Eds. Heidelberg, Berlin: Springer, 1990, pp. 69–77. DOI: 10.1007/3-540-52338-3_8.
- J. F. Lu and X. F. Peng, “Bubble slippage on thin wires during subcooled boiling,” Int. J. Heat Mass Transf., vol. 49, no. 13–14, pp. 2337–2346, 2006. DOI: 10.1016/j.ijheatmasstransfer.2005.08.036.
- J. F. Lu and X. F. Peng, “Bubble oscillation on thin wire during subcooled boiling,” Int. J. Heat Mass Transf., vol. 51, no. 17-18, pp. 4461–4469, 2008. DOI: 10.1016/j.ijheatmasstransfer.2007.12.025.
- H. Wang, X. Peng, S. V. Garimella, and D. M. Christopher, “Microbubble return phenomena during subcooled boiling on small wires,” Int. J. Heat Mass Transf., vol. 50, no. 1–2, pp. 163–172, 2007. DOI: 10.1016/j.ijheatmasstransfer.2006.04.038.
- M. I. Lamas, J. M. Jabardo, and A. Arce, “Thermocapillary and not thermocapillary convection around non-condensable gas bubbles,” J. Braz. Soc. Mech. Sci. Eng., vol. 35, no. 4, pp. 493–503, 2013. DOI: 10.1007/s40430-013-0046-6.
- L. Zhou, X. Du, Y. Yang, P. Jiang and B. Wang, “Thermocapillary effect on bubble sweeping and circling during subcooled nucleate pool boiling of water over microwire,” Int. J. Heat Mass Transf, vol. 88, pp. 276–283, 2015. Sep DOI: 10.1016/j.ijheatmasstransfer.2015.04.096.
- X. Pi and A. S. Rangwala, “The influence of wire orientation during nucleate pool boiling in subcooled dodecane,” Int. J. Heat Mass Transf., vol. 137, pp. 1247–1257, Jul. 2019. DOI: 10.1016/j.ijheatmasstransfer.2019.03.088.
- N. Xu, H. Jiang, L. Peng, D. Wang, and H. Chu, “Dynamic analysis of bubble attachment and sweeping on microwire in subcooled nucleate pool boiling,” J. Therm. Sci., vol. 30, no. 5, pp. 1842–1858, 2021. DOI: 10.1007/s11630-021-1512-6.
- J. R. Thome, “Boiling in microchannels: a review of experiment and theory,” Int. J. Heat Fluid Flow, vol. 25, no. 2, pp. 128–139, 2004. DOI: 10.1016/j.ijheatfluidflow.2003.11.005.
- D. M. Christopher, H. Wang, and X. Peng, “Numerical analysis of the dynamics of moving vapor bubbles,” Int. J. Heat Mass Transf., vol. 49, no. 19–20, pp. 3626–3633, 2006. DOI: 10.1016/j.ijheatmasstransfer.2006.02.039.
- S. Rolf, “Compilation of Henry’s law constants (version 4.0) for water as solvent,” Atmos. Chem. Phys., vol. 15, no. 8, pp. 4399–4981, 2015. DOI: 10.5194/acp-15-4399-2015.
- E. Lajeunesse and G. M. Homsy, “Thermocapillary migration of long bubbles in polygonal tubes. II. Experiments,” Phys. Fluids, vol. 15, no. 2, pp. 308–314, 2003. DOI: 10.1063/1.1531617.