
 ?Mathematical formulae have been encoded as MathML and are displayed in this HTML version using MathJax in order to improve their display. Uncheck the box to turn MathJax off. This feature requires Javascript. Click on a formula to zoom.
Abstract
This study used a trait-state-occasion (TSO) model to isolate stable trait variance, occasion-specific state variance, and shared method related variance in a measure for leisure satisfaction in a Dutch nationally representative nine-year panel study. Findings indicate that satisfaction with leisure time is a consistently stronger indicator of overall leisure satisfaction than satisfaction with leisure activities. About half of the variance in leisure satisfaction is stable trait variance, with the remaining variance being mostly occasion-specific and to a lesser extent attributable to shared method variance and error. However, these findings depend on the age group we consider. Several socio-demographic variables relate directly to the trait aspect of leisure satisfaction. Our study underscores the importance of recognizing that over time leisure satisfaction measurements have considerable stable and more volatile elements and that one should control for shared method effects.
Satisfaction with leisure is a fundamental concept in the social psychological study of leisure phenomena. Ever since Ragheb and Beard (Citation1980) conceptualized and empirically measured leisure satisfaction, researchers have focused on various aspects of this construct such as its relation to leisure participation and leisure attitudes (Ragheb & Tate, Citation1993) and to overall well-being and life satisfaction (Ateca-Amestoy, Citation2011; Newman, Tay, & Diener, Citation2014; Stiglitz, Sen, & Fitoussi, Citation2009; Van Praag & Ferrer-i-Carbonell, Citation2004). The extent to which people are satisfied with their leisure, either about the time they have for leisure or about the activities they undertake during their free time, or both, has been studied predominantly with cross-sectional designs and less often with longitudinal research designs. Irrespective of research designs used, the fact that leisure satisfaction varies between individuals and over time makes it an interesting phenomenon for empirical research.
Moreover, if research is going to use leisure satisfaction as a core predictor of other individual outcomes such as overall well-being, we must understand its measurement properties. Unfortunately, we know little about this psychometric aspect of the leisure satisfaction construct, especially in longitudinal designs. This knowledge gap is surprising, especially because in 1980 Ragheb and Beard had called for an exploration of the stability of leisure satisfaction over time “to determine the extent to which these perceived satisfactions might be relatively transient or more stable in the manner of intelligence and certain personality traits” (Ragheb & Beard, Citation1980, p. 348). We are aware of only one longitudinal study that included satisfaction with leisure time in a more general study of components of general life satisfaction (Schimmack, Krause, Wagner, & Schupp, Citation2009). By applying the trait-state-occasion model (TSO) model (Cole, Martin, & Steiger, Citation2005) within the structural equation modeling (SEM) framework, this study sets out to broaden our knowledge about the longitudinal structure of leisure satisfaction in three ways. First, we use Dutch nationally representative longitudinal panel data covering nine years, and we model the construct of leisure satisfaction with two indicators: satisfaction with leisure time and with leisure activities. This approach allows us to see which indicator is a relatively more important indicator of general leisure satisfaction. Second, we decompose the variation in the leisure satisfaction construct into four components: the trait or time-invariant component, a time-varying occasion or state-specific component, a method-factor component, and all other unaccounted-for variance in the observed indicators. Thus, we hypothesize that leisure satisfaction measured at a moment in time is a blend of stable, unstable, and method-related aspects. By dissecting the construct’s total variance over time, we assess the relative stability of the construct over time, net of the influence of occasion-specific or situational influences.
We also investigate how the latent longitudinal structure of leisure satisfaction compares among different age cohorts. This analysis allows us to inspect how stable, occasion-specific, and method-related measurement properties of the construct behave for people who are at different moments in their lives. Ragheb and Beard (Citation1980) also emphasized the need to study determinants of leisure satisfaction. Therefore, we investigate how and to what extent predictors that explanatory analyses of leisure satisfaction often include relate to the stable part of leisure satisfaction over time. Existing cross-sectional and longitudinal studies usually only look at the leisure satisfaction construct holistically and do not separate different types of variances that blend leisure satisfaction, but we want to examine how socio-demographic characteristics relate to the stable trait part of leisure satisfaction once we control for occasion-specific variance and method-related variance. This study is novel because no previous study has used advanced SEM modeling with the TSO model to separate state, trait, and method variance in leisure satisfaction, and there are no study-related well-known predictors of the stable over time variance of leisure satisfaction.
Leisure satisfaction: Conceptualization and application in empirical research
Ragheb and Beard (Citation1980) were the first researchers who set out to systematically study the characteristics of the leisure satisfaction concept and to provide students of leisure with measurement instruments to measure leisure satisfaction empirically. They defined leisure satisfaction as:
The positive perceptions or feelings which an individual forms, elicits, or gains as a result of engaging in leisure activities and choices. It is the degree to which one is presently content or pleased with his/her general leisure experiences and situations. This positive feeling or contentment results from satisfaction or felt or unfelt needs of the individual. (Ragheb & Beard, Citation1980, p. 330)
Ragheb and Beard argued that leisure satisfaction is a multidimensional construct with six subdimensions tapping various aspect of overall leisure satisfaction: the degree to which leisure activities fulfill psychological, educational, social, relaxational, physiological, and aesthetic personal needs. This original conceptualization of satisfaction with leisure domain experiences has provided the basis for several theoretical and empirical studies on the antecedents and consequences of leisure satisfaction and on the associations between leisure satisfaction and subjective well-being indicators, such as happiness and general life satisfaction. Many studies currently conceptualize leisure satisfaction as a domain-specific indicator of subjective well-being (SWB), with leisure SWB focusing on the evaluations and affective reactions to leisure measured by leisure satisfaction or affective experiences in leisure (Kuykendall et al., Citation2017; Newman et al., Citation2014).
As examples of relevant empirical research, Ragheb and Tate (Citation1993) studied leisure satisfaction as an outcome variable and found it was directly related to affective leisure attitude, leisure participation, and leisure motivation. Newman et al. (Citation2014) emphasized the theoretical importance of leisure satisfaction by making it a key ingredient in a conceptual model for explaining subjective well-being. Also, in recent studies in the leisure sciences (Choi & Yoo, Citation2017; Ito & Walker, Citation2014; Ito, Walker, Liu, & Mitas, Citation2017) and in vocational psychology (Kuykendall et al., Citation2017; Kuykendall, Tay, & Ng, Citation2015) leisure satisfaction features as a core mediating or outcome variable. Most of these studies were cross-sectional. However, leisure satisfaction may unfold in various degrees during a person’s life course, and consequently, may relate more or less strongly to other constructs, such as life satisfaction, depending on the place in a person’s life (Kleiber, Mannell, & Walker, Citation2011, p. 379). Therefore, it is important to study if such a fundamental construct is relatively transient or more stable over time. In the remainder of this contribution, we set out to answer this question.
Variance decomposition of leisure satisfaction
We hypothesize that the variance in people’s leisure satisfaction over time consists of several elements. There is variance that is entirely stable over time, a part that is occasion-specific, and a residual variance part that includes remaining random measurement error or systematic measurement error unrelated to the stable or occasion-specific variance (Steyer & Schmitt, Citation1990). The fully stable part is a time-invariant component of the total variance in leisure satisfaction, denoted as the construct’s trait component. This trait variance reveals stability in individuals’ leisure satisfaction over long periods of time that would theoretically persist indefinitely (Schimmack et al., Citation2009). In other words, it measures a person’s base level of leisure satisfaction that is free of situational effects. Some authors (Caspi & Roberts, Citation2001; Donnellan, Kenny, Trzesniewski, Lucas, & Conger, Citation2012) consider rank-order consistency as a critical criterion for identifying trait attributions: the extent to which people maintain their relative ordering on a dimension over time relative to other people in their group. For example, it may be that leisure satisfaction shows mean-level changes over time, which are related to age (e.g., older cohorts report higher average leisure satisfaction levels than younger cohorts). However, despite such changes in absolute levels in leisure satisfaction, individuals may maintain their position on the leisure satisfaction dimension relative to other individuals (as the development of leisure satisfaction affects individuals that belong to the same cohort similarly). Rank-order consistency is usually assessed by correlating scores of repeated measurements over a considerable timespan, allowing to examine whether people maintained their position relative to other individuals in the sample. Consequently, the correlation of individual differences in the time-invariant aspect of leisure satisfaction from one time point to the next is 1.0, irrespective of the time elapsed.
Second, variance in leisure satisfaction may consist of occasion-specific variance, the “state component.” This component extracts the time-varying part of the total variance in leisure satisfaction that is systematic. In other words, it uncovers systematic changes in persons’ leisure satisfaction over time. Such systematic changes can result from situational influences at the measurement moment, for example, having become a (new or single) parent caring for a child, having to provide informal care, or having fallen ill for a longer time. Whereas the trait component is perfectly stable over time, differences in the time-varying state component are not perfectly stable over time, with an over-time correlation of individual differences in this component being less than 1.0
Third, variance in leisure satisfaction consists of residual variance, which consists of random (i.e., nonreplicable) influences when leisure satisfaction was measured (e.g., mood swings in respondents that occurred during data collection). Residual variance can also include nonrandom (i.e., replicable) influences of factors that are unrelated to the state or trait component. In panel designs, an important reason for such systematic residual variance is “shared method variance,” which is “the covariance between two or more variables that is not explained by the construct of interest but instead derives from the method inherent to the specific set of measures” (Cole, Citation2012, p. 591; Podsakoff, MacKenzie, Lee, & Podsakoff, Citation2003). A well-known example is that a survey-question not only measures a specific content related to the construct intended to be measured but also elicits a socially desirable response. If the same question is repeatedly administered, then one measures not only the construct’s content, but also a characteristic of the measurement method. This means that if shared method variance occurs, the relation between measures for leisure satisfaction over time represents not only stability of the leisure satisfaction construct, but also of the method used to measure that construct. As Cole points out, neglecting shared method variance in longitudinal designs may lead to upwardly biased estimates of both the variance of the trait component and the stability of the state components. We will apply a SEM modeling approach that enables us to isolate these stable, unstable and method related components of variance in leisure satisfaction over time.
Existing findings
Currently, we know little about the stability of satisfaction in the domain of leisure. While reviewing the literature, we mostly encountered studies that investigated the stability of life satisfaction, general well-being, or happiness. Lucas and Donnellan (Citation2007), using two nationally representative panel studies from the German Socio-Economic Panel Study (GSOEP) and the British Household Panel Study (BHPS), found that only 34–38% of the variance in life satisfaction is stable trait variance, and that an appreciable amount of instability is presumably due to contextual circumstances. Schimmack and colleagues (2009) also analyzed data from the GSOEP panel study to estimate the relative importance of trait and state variance in cognitive evaluations of life satisfaction and related domain satisfaction with health, household income, housing, and recreation. The latter study is important as it is, to our knowledge, the only study that included a single indicator of leisure satisfaction (i.e., satisfaction with leisure time). These authors report annual stability of the state component in the leisure time indicator of .92 and six-week stability of the state component of .99 (with the latter finding presumably indicating it is difficult in a short-term study to distinguish between the trait and state component because state variance hardly changes). Interestingly, they also found that the reliability estimate of leisure satisfaction was almost lowest, save satisfaction with housing. The authors interpret this finding as an indication that leisure satisfaction judgments may be more challenging to make and therefore less reliable.
Method
Data
The data for this study come from waves 1 through 9 of the Longitudinal Internet Studies for the Social sciences (LISS) panel administered by CentERdata, the Netherlands. This LISS panel, initiated in 2007, is a representative sample of Dutch individuals based on a true probability sample of households drawn from the population register who participate in monthly internet surveys. Households that did not have a computer or internet access were provided with these materials to be able to participate. The survey questions that we use in this study were included for the first time in the wave of 2008 and then administered yearly to all respondents up to and including the year 2016. The panel contains 12,685 respondents over nine years. As is often the case in panel studies of this size, not all panel members always completed all questions; 21 panel members did not complete any of the questions on leisure satisfaction, and we omit them from further analysis.
Operational definitions
We use two questions from the LISS panel for measuring the construct “satisfaction with leisure.” In the questionnaire, these leisure satisfaction questions were asked before the question on general life satisfaction. We use the question, “how satisfied are you with the amount of leisure time that you have?” as a measurement of satisfaction with leisure time. The question “how satisfied are you with the way in which you spend your leisure time?” measures people’s satisfaction with leisure activities. We note the content validity of the latter indicator is indistinct: people may interpret the question as “how satisfied are you with the activities that you do in your leisure time?” As such, it may measure satisfaction with leisure activities. However, the question may also measure other aspects of leisure (Kleiber et al., Citation2011): leisure time satisfaction (because the second question also makes explicit reference to the time aspect) or people’s psychological experience of leisure. Here we assume the question mainly measures leisure activity satisfaction with the proviso that it may measure satisfaction with other elements of leisure as well. Both questions used an 11-point rating scale, ranging from 0 = entirely dissatisfied to 10 = entirely satisfied. Cronbach’s alpha of a scale of both variables ranged from .684 for the first 2008 wave to .762 for the last 2016 wave.
We use the following socio-demographic characteristics of respondents at the first moment of observation as predictors of the stable part of leisure satisfaction: gender (0 = male; 1 = female); age (measured in years); educational attainment (highest completed level) with categories primary education (reference), intermediate secondary education, higher secondary/preparatory university education, intermediate vocational education, higher vocational education, and university; the number of children present in the household under the age of 18; main occupation with the categories working full-time (reference), self-employed, seeking a job, studying, housekeeper, pensioner, and otherwise occupied. Finally, we include dummy variables for a classification of working hours in paid employment that is used by Statistics Netherlands (CBS) (with 0 hours being the reference category, 1–19, 20–27, 28–34, and more than 34 hours) and hours for providing informal care (with 0 hours the reference category, 1–8 hours, 9–16 hours, and more than 16 hours). Finally, we construct a composite variable that measures the average time (in hours) that persons daily spend on one or more of 26 leisure activities (e.g., playing a music instrument, hobbies, going out, cinema, theatre, dining out, terrace lounging), sports, and watching tv.
To investigate whether the trait variance, occasion-specific variance, or method variance change with age, we include a variable age cohort that distinguishes six categories: younger than 26, 26–30, 31–40, 41–50, 51–60, and over 60 at the start of the panel. We report descriptive statistics of all variables used in .
Table 1. Descriptive Statistics of Leisure Satisfaction Indicators and Socio-Demographic Background Variables.
Statistical modeling approach
As Andreß, Golsch, and Schmidt (Citation2013, pp. 7-10) point out, a limitation of panel data is that some of the original panel members have permanent missing information due to drop out of the panel. This attrition threatens the representativeness of the panel. Thus, despite the careful design of the LISS panel, it is likely our findings also suffer from bias due to panel attrition. However, missingness in a panel may also be temporary, for example, because there was no interview in a specific year. Such nonresponse can also cause bias, but temporarily missing information can be imputed from the data that we have observed for the panel members. However, whether imputation is necessary depends on the type of missingness. Therefore, first, we investigated whether the missing data in the leisure satisfaction indicators was missing completely at random (MCAR) or missing at random (MAR) because then we could use full information maximum likelihood estimation to estimate the model parameters (Allison, Citation2012).
Data are MCAR if missingness on any variable in a model does not depend on the values of any other variable in the model and missingness in Y is unrelated to values of Y itself. Data are missing at random (MAR) when (1) not MCAR, indicated by Little’s MCAR test (R. J. A. Little, Citation1988) being significant; and (2) missingness may be predicted by other observed variables and does not depend on any unobserved variables. If we can predict missingness from observed variables, then multiple imputation (MI) is appropriate (Garson, Citation2015, pp. 11–15).
We tested the null hypothesis that the data are MCAR by using Little’s MCAR test (R. J. A. Little, Citation1988). This test was significant, which indicated the “missingness” in the indicators is not MCAR. Next, we explored whether the MAR assumption would hold by estimating a logistic regression with the outcome being missing versus not missing for each leisure satisfaction indicator and socio-demographic variables as predictors. Inspection of logit parameters showed consistent significant effects of gender, age, and working hours on the missing versus not missing outcome and for some indicators of the number of children and educational attainment. This indicated the MAR assumption was not supported either. Therefore, we used multiple imputation (Rubin, Citation1987) by specifying a model for the missing data mechanism. We generated 20 multiple imputed datasets for full sample analysis and 100 multiple imputed datasets for age-specific subgroup analysis. The latter was necessary because of model convergence issues for some imputed datasets. Each leisure satisfaction indicator was used to impute the missing values on all the other indicators. Also, we included all socio-demographic variables as auxiliary covariates that were used in the logistic regression. Then, SEM was applied to the multiple imputed datasets using full information maximum likelihood.
Several SEM models have been developed that allow separating stable trait variance from other sources of variance in a longitudinal repeated measures designs (Cole et al., Citation2005; Newsom, Citation2015; Prenoveau, Citation2016). We apply the TSO model with shared method variance factors (LaGrange & Cole, Citation2008), shown in . The TSO model has several components. First, we have the repeated measurements for satisfaction with leisure time (in the figure: SLT1 to SLT9) and satisfaction with leisure activities (SLA1 to SLA9). They function as indicators for nine separate latent state factors (SSAT1 to SSAT9). We assume that the direct relationship between the indicator and state factor is time-invariant, which is expressed by imposing equality constraints on the indicators’ unstandardized loading parameters. By implementing this model constraint, we assume the interpretation of the questions has not changed over time, known as the metric measurement invariance assumption. This assumption holds that a change of one unit on the latent state variable (SSAT1 to SSAT9) has the same amount of change in the scores of the indicators, irrespective of the time of measurement (with the constrained loading being equal to for the satisfaction with leisure time indicators, and equal to
for the satisfaction with leisure activities indicators). A second component is the single latent TSAT factor (the oval at the top in ). All nine latent state factors load on this time-invariant latent variable, which extracts the variance in the time-varying latent state factors that is stable over time. Following Kenny and Zautra’s (Citation1995) conceptualization of a stable trait factor, we fix the unstandardized factors loadings of this general trait factor to one (the 1s next to the arrows running from SSAT to SSAT1 to SSAT9). This model constraint sets the scale of the latent trait variable to the scale of the latent state variables and says that each time-specific state factor is equally weighted over time by using equal units assigned to the latent trait variable (Bollen, Citation1989, pp. 198–199). This approach is congruent with the trait notion of a constant effect from the latent stable trait factor TSAT (Newsom, Citation2015).
Figure 1. Hypothesized trait-state-occasion (TSO) model with shared method variance factors.
TSAT = Trait Leisure Satisfaction; SSAT1 to SSAT9 = State Leisure Satisfaction; O1 to O9 = Latent variable measuring occasion-specific variance in state aspect of leisure satisfaction; SLT1 to SLT9 = wave specific item on Satisfaction with Leisure Time; SLA1 to SLA9 = wave specific item on Satisfaction with Leisure Activities; MLT = Shared Method Variance latent variable for Satisfaction with Leisure Time; MLA = Shared Method Variance latent variable for Satisfaction with Leisure Activities.
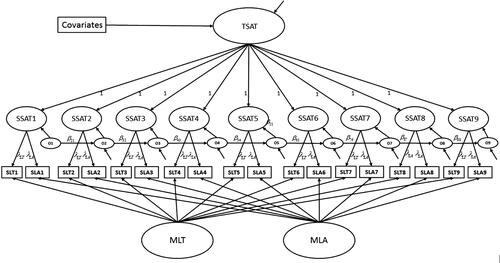
A third component of the TSO model are the time-specific latent occasion factors (O1 to O9). They represent that portion of the relative position in leisure satisfaction at a moment in time (SSATT) that cannot be explained from knowing an individual’s position on the leisure satisfaction trait (TSAT) (Prenoveau, Citation2016). In other words, they represent residual variation in the leisure satisfaction state factors once stable variance from the leisure satisfaction trait factor is accounted forFootnote1. We model a lag-1 autoregressive effect between the adjacent occasion factors ( to
), which inform us about the extent to which the effects of situational characteristics carry over from one time point to the next (Prenoveau, Citation2016). We do not impose stationarity (i.e., we do not constrain the autoregressive effects to be equal over time). In this way, we can examine whether the impact of situational characteristics weakens over time with increasing durations, or rather that the impact of situational effects remains relatively stable between adjacent time points, controlling for the stability of the trait factor TSAT.
The final model component is the part in which we control for shared method variance. Method factors extract variance that is attributable to the method inherent to a measurement. Because we want to rule out that the model estimates that indicate across-time stability are inflated, we include two method factors MLT and MLA, each specific to the items that measure satisfaction with leisure time, and satisfaction with leisure activities, respectively. Both method factors are assumed to be independent of each other and unrelated to the state factor TSAT. Based on the variance estimates of this model, we will be able to determine the proportions of trait variance, occasion-specific variance and method specific variance, by taking the ratio of each specific source of variance and the sum of trait variance, occasion-specific variance, shared method variance, and residual variance.
For setting the scales of the latent variables in this model, we use effects coding (T. D. Little, Slegers, & Card, Citation2006). We constrain the set of loadings for a given construct to have an average of 1.0. As Little and colleagues point out, this method uses the effects constraints to provide an optimal balance across the possible indicators to establish the scale for the estimated parameters, where the loading parameters are estimated as an optimal balance around 0, but no single loading is necessarily constrained to be 0. Estimates of the latent variances are the average of the indicators’ variances accounted for by the construct, and the latent means are estimated as optimally weighted averages of the set of indicators means for a given construct. Effects coding yields a construct scaling that is in a meaningful metric; namely, a given latent variable will be on the same scale as the average of all its manifest indicators (T. D. Little et al., Citation2006, p. 63).
Results
Model parameters of the trait-state-occasion model
reports the parameter estimates of the TSO model with shared method variance factors in unstandardized and fully standardized form. In this table, only the unstandardized parameters reflect the equality constraints that were imposed on the model because we use the raw data as input for the analysis rather than a correlation matrix. As standard deviations of the indicators for satisfaction with leisure time and leisure activities vary slightly between measurement occasions, the fully standardized solution does not reflect the equality constraints directly. Although the χ2 test of exact fit is significant with χ2(116) = 517.163, p=.000, the other fit indices suggest a very good fit of the proposed model to the data: RMSEA = 0.019, 90 percent confidence interval of RMSEA = 0.017 (lo) - 0.020 (hi), p(RMSEA ≤.05) = 1.000, comparative fit index (CFI) = 0.989, Tucker-Lewis-Index (TLI) = 0.985, and standardized root mean square residual = 0.041.
Table 2. Parameter Estimated of Trait-State-Occasion Model with Method Factors.
Part A of shows the relationship between the indicators of satisfaction with leisure time (SLT1 to SLT9) and satisfaction with leisure activities (SLA1 to SLA9) to the state factors (SSAT1 to SSAT9). Both sets of indicators are strongly related to the state factors. Inspection of the loadings indicates that satisfaction with leisure time is a somewhat stronger predictor of state-specific leisure satisfaction than satisfaction with leisure activities.
Next, we turn to the loadings of the indicators for satisfaction with leisure time and leisure activities on the method factors (part B of ). Here we see an interesting difference: for satisfaction with leisure time, method-factor loadings are relatively high up to about the fourth wave and then start to decrease, with the method loading at wave nine becoming negative. In contrast, for satisfaction with leisure activities, method-factor loadings are relatively stable across waves. We can only speculate about explanations for this difference. One explanation may lie in the “object” that respondents repeatedly have to evaluate. When the object of evaluation is the fuzzy concept of “time,” then in earlier waves such evaluations may be somewhat more prone to error, resulting in stronger relations between the items concerned and the method factor. In later waves, the respondents seek or have learned to reduce the ambiguity by aligning their estimation to earlier evaluations of leisure time. Consequently, items in later waves will be less strongly related to the method factor for leisure time. In contrast, for respondents, the evaluation of concrete ‘activities’ may be consistently easier to perform over time. Therefore, the resulting common method variance of such a measurement may be more stable. Another explanation for the stable loadings of the method factor for the satisfaction with leisure activities items may be that the method factor consistently picks up the possible indeterminacy of content of the satisfaction with leisure activity item. As argued before, we cannot rule out that this item measures not only satisfaction with leisure activities but also satisfaction with leisure time, or psychological experience, or both. Consequently, once variance that the leisure activity satisfaction item shares with the leisure time satisfaction item (thus essentially capturing the time aspect of leisure satisfaction by the state factor) the remaining across-time systematic variance of the activity item may enter the method factor. The method factor then measures the remaining item-specific content regarding activity and psychological experience. Unfortunately, we lack other variables that measure the latter content aspects for accurately validating the content and method factor.
Parts C and D of show the parameter estimates that result from model constraints necessary for model identification and substantive reasons. As shown in , we assume that each time-specific state factor is equally weighted over time, which is congruent with the trait notion of a constant effect from the latent stable trait factor TSAT on the state factors LSAT1 to LSAT9 (Part D of ). The fully standardized loadings show that the general trait factors predict the state factors well, with loadings varying around a value of .80. Part C of gives the constrained effects of time-specific latent occasion factors (O1 to O9) on the leisure satisfaction at a particular moment in time (SSATT). These time-specific latent occasion factors cannot be explained from knowing an individual’s position on the leisure satisfaction trait (TSAT). Neither can these factors be interpreted as method variance because the latter is controlled in the model by including the method factors. The average standardized effect of the occasion factors on the time-specific state factors is substantial, with an average loading of close to .60.
Part E of shows the lag-1 autoregressive effects between the time-specific latent occasion factors. These occasion factors represent aspects of the state factors that fluctuate over time; consequently, the autoregressive effects show the degree to which the completely unstable variance at time t of the state factor predicts the completely unstable variance in the state factor at t + 1. Note that these autoregressive effects were not constrained to be equal over time. We can evaluate the effect size of the autoregressive effects by squaring the fully standardized autoregressive effects, as this yields R-square values (Prenoveau, Citation2016). Effect sizes range between .069 for wave 5 to .203 for occasion wave 9. These findings suggest that occasion-specific circumstances are relatively persistent over time, in addition to a stable overall leisure satisfaction.
Variance decomposition of the TSO model
Which proportion of total variance is attributable to stable trait variance (i.e., the common consistency), the occasion-specific variance (occasion specificity), method variance (method specificity), and remaining error? There are several ways to calculate coefficients for each of these types of variance (Newsom, Citation2015). Here, we calculate these variance components by first calculating the average of the squared trait loadings, of the squared occasion loadings, of the squared method factor loadings and the average residual variance resulting from the fully standardized solution. Then, from this the common consistency can be calculated as follows:
Occasion specificity, method specificity, and the proportion of residual variance can be determined similarly. The results of this variance decomposition are reported in .
Table 3. Variance Decomposition of Leisure Satisfaction into Proportion of Total Variance Attributable to Trait, State, Method and Error Variance (Full Sample and Age-Group Specific Estimates).
In the full sample, 47% of the total variance in leisure satisfaction is completely stable over time, whereas 25% of the total variance is attributable to occasion-specific circumstances. Furthermore, 10% is method-specific variance, and the remaining residual variance is relatively large: 17% of the total variance in leisure satisfaction cannot be attributed to stable, unstable, or method related influences. also shows the consistency and specificity coefficients for different age groups. Several interesting differences between the age groups can be observed. First, common consistency is lower for the age groups up to and including 30 years in comparison to the age groups of those who are older than 30. From 30 years onwards, common consistency becomes relatively stable across the different age groups, varying slightly between .41 and .46. For persons ages 26–30, occasion specificity is relatively high, indicating occasion-related circumstances have an important impact on the reported leisure satisfaction at that moment in a person’s life. For the youngest age group and the age groups of 30 years and older, occasion specificity is lower, and for the latter group, it stabilizes around a value of .30. Concerning method specificity, there are no large differences between age groups, but the evidence indicates that method effects are an important part of the leisure satisfaction measurement: about 10% of the total variance in over-time leisure satisfaction is attributable to characteristics of the measurement method. Finally, we see that residual variance is considerably larger for those persons who belong to the age group of people younger than 26 years old than for people who belong to the other age groups: the residual variance for the youngest people is 24%, but for the other groups it is maximally 18%. Overall, leisure satisfaction is measured with more error in the youngest age group than in the other age groups, and this age group is characterized by a common consistency and an occasion specificity that each account for about one-third of the total variation in leisure satisfaction.
Effects of background characteristics on the trait aspect of leisure satisfaction
Finally, we investigate to what extent several well-known socio-demographic predictors of leisure satisfaction predict variance in the stable part of leisure satisfaction. We elaborated the structural regression part of our SEM model by first repeatedly estimating the TSO model with method factors for each independent variable separately, that is, with each model only including one socio-demographic variable as a covariate; this gives the bivariate (uncontrolled) path coefficient between the predictor and the latent trait factor. Next, we estimate the TSO model with method factors in which all socio-demographic variables are included as covariates simultaneously; this gives the controlled path coefficients between each specific socio-demographic variable and the latent trait factor while controlling for all other socio-demographic variables. By comparing the uncontrolled and controlled effects, we can see how the uncontrolled effects change once all other variables included in the model are held constant. reports both the bivariate (uncontrolled) and multivariate (controlled) unstandardized path coefficients. Note that these results are also average effects based on 20 multiple imputed datasets.
Table 4. Bivariate and Multiple Structural Regression of the Trait Component of Leisure Satisfaction on Socio-Demographic Background Characteristics (Unstandardized Path Coefficients), SEM Model Results.
First, we see that gender is not significantly related to the trait aspect of leisure satisfaction in the bivariate analysis. But when other variables are held constant, women on average score lower on the trait aspect of leisure satisfaction than men. Age is positively related to trait leisure satisfaction both in the uncontrolled and controlled analysis. Another important predictor of leisure satisfaction is the number of young children in the household: we see that in both the uncontrolled and controlled analysis the number of children is negatively related to the trait aspect of leisure satisfaction, although in the controlled analysis its path coefficient is much weaker, presumably because its effect is both partially mediated by other variables such as working hours, and partially spurious due to variables such as level of schooling and age acting as a common cause. We do not find a direct relationship between income level and the stable part of leisure satisfaction, once other variables are held constant. The same holds for the effects of educational attainment: uncontrolled we find that relative to those persons who only completed primary education, those who completed higher levels of education score on average lower on trait leisure satisfaction (except those persons who completed intermediate secondary education). Many of these differences disappear once other variables are held constant, presumably because of partially mediating (e.g., via income and working hours) and partially spurious associations (e.g., due to gender and age differences). Turning to the effect of people’s main occupation, we see that once other variables are held constant, self-employed persons, students, housekeepers, pensioners, and persons who are otherwise occupied score significantly higher on the stable part of leisure satisfaction than people who are working full-time. Next, we consider the direct associations between working hours and hours for informal care on the one hand and trait leisure satisfaction on the other. Here, the findings indicate that once we control for other variables, people who work part-time (1–19 hours or 20–27 hours) or full-time (28–34 hours) on average score higher on the stable part of leisure satisfaction than people who do not work.
In contrast, holding constant for other variables, hours of informal care are negatively directly related to the trait aspect of leisure satisfaction, with people who provide 9–16 hours of informal care and people who provide more than 16 hours of informal care being significantly lower on the trait aspect of leisure satisfaction than persons who do not provide informal care. Finally, we see a significant positive association between actual leisure time and the trait aspect of leisure satisfaction, but only if other variables are not held constant. Once the influence of other variables is accounted for, leisure time is not directly associated anymore with trait leisure satisfaction. This means that the other variables included in the analysis most likely act as a common cause for both leisure time and trait leisure satisfaction. All variables explain 31 percent of the trait variance of leisure satisfaction.
Conclusions and discussion
In this article, we have heeded Ragheb and Beard’s (Citation1980) call to investigate whether perceived leisure satisfaction is relatively transient or more stable over time and to study its antecedents. We have found that satisfaction with leisure time generally relates more strongly to an underlying construct that measures overall leisure satisfaction than satisfaction with leisure activities. Nazio and MacInnes (Citation2007) contend that satisfaction with leisure time measures time stress. Because leisure is a time-intensive commodity (Ateca-Amestoy, Citation2011, p. 61) which presumably is more subject to occasional constraints, there may be more variation in this aspect of leisure satisfaction, resulting in a stronger association between satisfaction with leisure time and overall leisure satisfaction. Leisure activities, however, are probably more under the control of the individual, which translates into less variation in the satisfaction with leisure activities scores than in the satisfaction with leisure time scores and consequently a somewhat weaker relationship of the variable with overall leisure satisfaction. Such a difference in variation can be inferred from , where the standard deviations of the satisfaction with activities variables per wave are consistently smaller than the standard deviations of the satisfaction with leisure time variables. Alternatively, the somewhat weaker loading may reflect that the satisfaction with leisure activities indicator may be measuring multiple aspects of leisure such as leisure time, activity and psychological state, and this indeterminacy may cause a somewhat weaker association with the latent state variable.
Secondly, we have found that more than half of the total variation in overall leisure satisfaction consists of either occasion-specific variance, method-specific variance, or remaining error. In the full sample, the trait aspect accounted for 47% of the total variation in overall leisure satisfaction, with occasion-specific influences explaining about 25% of its variance. Interestingly, consistency and specificity statistics were age-specific: measurement error was substantially larger for the youngest age group, and occasion-specificity was largest for persons ages 26–30. Many young people enter the first job, settle down, or start a family in this period of their life. Therefore, it may be a period during which time stress occurs more often. The residual variance for the youngest age group was largest among all the age groups considered. Thus, measurements of leisure satisfaction may be more unreliable for young people than for older persons. For all age groups older than 30 we found the common consistency in leisure satisfaction to be relatively stable above 40%. Our findings add support and insight to Kleiber and colleagues’ contention that “there are likely times in people’s lives when leisure participation and satisfaction a highly salient and important to them” (Kleiber et al., Citation2011, p. 379). The stable (trait) part, more dynamic (occasion) part and residual part of general leisure satisfaction vary systematically with the stage in a person’s life when leisure participation and satisfaction may be more or less important, and gratifying leisure fulfillment may be more or less easy to achieve and report in surveys.
Another interesting finding is that method specificity is similar among the different age groups. Importantly, method specificity covers about 10% of the total variation in overall leisure satisfaction, which underscores the necessity of controlling for method-dependent correlations between indicators in longitudinal studies on leisure satisfaction.
We also found autoregressive effects between the occasion-specific latent variables. Significant autoregressive effects between such variables indicate that occasion-specific circumstances are somewhat persistent over time. Thus, the TSO model shows that the degree to which overall leisure satisfaction at a certain moment in time is correlated with overall leisure satisfaction at a later point in time is the combined result of the influence of both an underlying stable trait as well as occasion-specific circumstances that persist over time (Cole et al., Citation2005).
Finally, we examined the extent to which direct relationships exist between several socio-demographic background characteristics and the trait aspect of leisure satisfaction. Being female rather than male, having an increasing number of children, having university level schooling compared to only having completed only primary schooling, or providing an increasing number of hours of informal care were associated with lower levels of trait leisure satisfaction. In contrast, being older, or being self-employed, studying, housekeeper, pensioner or being otherwise occupied rather than being full-time employed, or working part-time rather than full-time were directly associated with higher levels in the trait aspect of leisure satisfaction.
Several of these findings are in accordance with earlier findings by Ateca-Amestoy (Citation2011) and Van Praag and Ferrer-i-Carbonell (Citation2004), but there are also some important differences. For example, Ateca-Amestoy (Citation2011) conjectured that being self-employed or being unemployed would have a negative impact on leisure satisfaction. However, in the current study, we found no significant difference between the employed and people who were seeking a job at the first wave, at least as far as the stable over-time leisure satisfaction is concerned. Presumably, the fact that most job seekers at a certain moment in time become part-time or even fulltime employed again can explain this lack of difference between employed and job-seeking persons on the long-term trait aspect of leisure satisfaction. In other words, being in the situation of seeking a job is an occasion-specific event that for most people who can regain employment will not affect their long-term overall leisure satisfaction. Moreover, being self-employed rather than being full-time employed was positively related to the trait aspect of leisure satisfaction, which may illustrate the positive impact of self-determination that goes together with being self-employed. Interestingly, Van Praag and Ferrer-i-Carbonell (Citation2004) found a negative effect of self-employment on leisure satisfaction, but we note that they used a random effects panel model on the blended leisure satisfaction variable (i.e., in which stable, unstable and method variance were not separated) and a different set of control variables. Noteworthy is also the finding that actual leisure time is not directly associated with the trait aspect of leisure satisfaction once other variables are held constant.
Comparing the (controlled) effects of socio-demographic characteristics on leisure satisfaction found in this study with the effects of such characteristics in life satisfaction and subjective well-being studies (SWB) reveals overlap in findings as well as also some differences. Comparing findings between studies is not straightforward because of differences in design, operational definitions, and usage of control variables between studies. Also, in this study, we have examined effects of background characteristics on the long-term, stable trait variance of leisure satisfaction, whereas studies on life satisfaction and SWB have examined the total variance in such constructs. In an overview study of determinants of SWB, Diener, Suh, Lucas, and Smith (Citation1999) concluded that life satisfaction and SWB had been found to remain relatively stable across the lifespan. Batz and Tay (Citation2018) and Batz-Barbarich, Tay, Kuykendall, and Cheung (Citation2018) show that effects of gender on SWB are generally inconclusive, which may be the result of the SWB construct consisting of different types and components. They report positive, although small, effects of education and income across studies. Lucas, Clark, Georgellis, and Diener (Citation2004) found evidence that unemployment has a long-lasting negative effect on individuals’ life satisfaction. Our study found that women report lower levels of overall leisure satisfaction than men and that overall leisure satisfaction increases with age. Furthermore, we found a negative effect of the level of schooling on overall leisure satisfaction, but only between those who attained university level schooling and those with the lowest level of schooling. Finally, we found no evidence for a direct association between income and overall leisure satisfaction when other variables were controlled.
Also, being in the situation of seeking a job was not found to lower the long-term trait leisure satisfaction in comparison to persons who work fulltime. Presumably, being in this type of unemployment position is for most persons an occasion-specific event that does not have a long-term negative effect on the stable trait aspect of leisure satisfaction, unless one becomes long-term unemployed. Although Lucas et al. (Citation2004) found that unemployment can have a long-lasting influence on people’s set-point level of satisfaction, we note that Lucas et al.’s study and the current study differed regarding design, nature of the dependent variable being analyzed, and analysis. Future research could address how set-point theory, that holds that that inborn personality factors cause an inevitable return to genetically determined SWB set points (Lucas, Citation2007), fares when distinguishing between the trait and state components of life and leisure satisfaction. The number of children in the household has generally been found to have a negative effect on life satisfaction (Angeles, Citation2010) and our findings corroborate this conclusion also for the trait aspect of leisure satisfaction. Finally, our findings are also in accordance with earlier studies that found positive effects of self-employment and higher levels of engagement in leisure activities and negative effects of informal caregiving on life satisfaction (Brajsa-Zganec, Merkas, & Sverko, Citation2011; Brown & Frankel, Citation1993; Hajek & König, Citation2016; Hessels, Arampatzi, van der Zwan, & Burger, Citation2018)
Our study underscores the importance of recognizing that over-time leisure satisfaction measurements have a stable and more volatile element, and that shared method effects must be considered in longitudinal research that includes this construct. However, the results of this study are also relevant to those researchers who want to measure leisure satisfaction in a cross-sectional design. First, researchers should consider for which population they want to assess leisure satisfaction. We have found that the measurement properties of the leisure satisfaction indicators were age-group specific. For example, for the youngest age group, the residual variance was largest. If this residual variance consists of mainly random measurement error, then using these measures may weaken the observed associations that these variables have with other variables for this specific age group. Similarly, we found that for people between 26 and 30 years old, occasion-specificity was considerably higher than for other age groups. Therefore, if such an age group is studied, it makes sense to include covariates for measuring events that affect individuals at this stage in their life. Another recommendation concerns the type of predictor variables to include in studies that seek to explain leisure satisfaction. We suggest including predictors that are more stable over time, such as personality traits (relating to the common consistency variance in leisure satisfaction), and more dynamic characteristics, such as unemployment history (relating to the occasion-specificity variance). Finally, we recommend using measurements for leisure satisfaction for which construct validity has been carefully assessed because this allows the researcher to interpret the substantive findings with more confidence. The necessity for this was illustrated in the current study by the indeterminacy of the content of the satisfaction with leisure activities item.
The findings of this study call for further research. One issue that needs further investigation is what general survey questions on satisfaction with leisure time and leisure activities measure regarding content validity and construct validity. It would be important to examine how the stable and dynamic element of the general questions relate to the six subdimensions of Ragheb and Beard’s (Citation1980) leisure satisfaction scale over time. Unfortunately, no data are currently available that would allow such a longitudinal investigation. Also, we have not addressed the influence of occasion-specific time-varying socio-demographic characteristics on the occasion-specific part of overall leisure satisfaction. For example, job seeking may have a negative effect on the occasion-specific part of leisure satisfaction, as expected by Ateca-Amestoy (Citation2011). A related aspect for future research lies in modeling the interrelationships between the time-specific background variables and leisure satisfaction, as this will help us to understand better the mechanisms via which background characteristics affect the stable and occasion-specific part of leisure satisfaction.
Notes
1 Occasion factors are identified in the model by a single loading for each state factor set equal to 1, the residual variance for each state factor set equal to 0, and the variance at the first occasion set equal to 1.
Related Research Data
References
- Allison, P. D. (2012, April). Handling missing data by maximum likelihood. In SAS global forum (Vol. 2012). Haverford, PA: Statistical Horizons.
- Andreß, H.-J., Golsch, K., & Schmidt, A. W. (2013). Applied panel data analysis for economic and social surveys. Berlin, Germany: Springer.
- Angeles, L. (2010). Children and life satisfaction. Journal of Happiness Studies, 11(4), 523–538. doi:https://doi.org/10.1007/s10902-009-9168-z
- Ateca-Amestoy, V. (2011). Leisure and subjective well-being. In S. Cameron (Ed.), Handbook on the economics of leisure (pp. 52–76). Cheltenham, England: Edward Elgar Publishing.
- Batz-Barbarich, C., Tay, L., Kuykendall, L., & Cheung, H. K. (2018). A meta-analysis of gender differences in subjective well-being: Estimating effect sizes and associations with gender inequality. Psychological Science, 29(9), 1491–1503.
- Batz, C., & Tay, L. (2018). Gender differences in subjective well-being. In Handbook of well-being. Salt Lake City, UT: DEF Publishers. doi:nobascholar.com.
- Bollen, K. A. (1989). Structural equations with latent variables. New York, NY: Wiley.
- Brajsa-Zganec, A., Merkas, M., & Sverko, I. (2011). Quality of life and leisure activities: How do leisure activities contribute to subjective well-being? Social Indicators Research, 102(1), 81–91.
- Brown, B. A., & Frankel, B. G. (1993). Activity through the years — leisure, leisure satisfaction, and life satisfaction. Sociology of Sport Journal, 10(1), 1–17.
- Caspi, A., & Roberts, B. W. (2001). Personality development across the life course: The argument for change and continuity. Psychological Inquiry, 12(2), 49–66. doi:https://doi.org/10.1207/S15327965PLI1202_01
- Choi, S.-H., & Yoo, Y.-J. (2017). Leisure attitude and satisfaction with leisure and life: proposing leisure prioritization and justification. World Leisure Journal, 59(2), 140–155. doi:https://doi.org/10.1080/16078055.2016.1216886
- Cole, D. A. (2012). Latent trait-state models. In R. Hoyle (Ed.), Handbook for structural equation modeling (pp. 585–600). New York, NY: The Guilford Press.
- Cole, D. A., Martin, N. C., & Steiger, J. H. (2005). Empirical and conceptual problems with longitudinal trait-state models: Introducing a trait-state-occasion model. Psychological Methods, 10(1), 3–20.
- Diener, E., Suh, E. M., Lucas, R. E., & Smith, H. L. (1999). Subjective well-being: Three decades of progress. Psychological Bulletin, 125(2), 276–302. doi:https://doi.org/10.1037/0033-2909.125.2.276
- Donnellan, M. B., Kenny, D. A., Trzesniewski, K. H., Lucas, R. E., & Conger, R. D. (2012). Using trait–state models to evaluate the longitudinal consistency of global self-esteem from adolescence to adulthood. Journal of Research in Personality, 46(6), 634–645.
- Garson, G. D. (2015). Missing values analysis & data imputation. Asheboro, NC: Statistical Publishing Associates.
- Hajek, A., & König, H.-H. (2016). Informal caregiving and subjective well-being: Evidence of a population-based longitudinal study of older adults in Germany. Journal of the American Medical Directors Association, 17(4), 300–305. doi:https://doi.org/https://doi.org/10.1016/j.jamda.2015.10.015
- Hessels, J., Arampatzi, E., van der Zwan, P., & Burger, M. (2018). Life satisfaction and self-employment in different types of occupations. Applied Economics Letters, 25(11), 734–740. doi:https://doi.org/10.1080/13504851.2017.1361003
- Ito, E., & Walker, G. J. (2014). Similarities and differences in leisure conceptualizations between Japan and Canada and between two Japanese leisure-like terms. Leisure/Loisir, 38(1), 1–19. doi:https://doi.org/10.1080/14927713.2014.880613
- Ito, E., Walker, G. J., Liu, H., & Mitas, O. (2017). A cross-cultural/national study of Canadian, Chinese, and Japanese university students' leisure satisfaction and subjective well-being. Leisure Sciences, 39(2), 186–204. doi:https://doi.org/10.1080/01490400.2016.1165637
- Kenny, D. A., & Zautra, A. (1995). The trait-state-error model for multiwave data. Journal of Consulting and Clinical Psychology, 63(1), 52.
- Kleiber, D. A., Mannell, R. C., & Walker, G. J. (2011). A social psychology of leisure. State College, PA: Venture.
- Kuykendall, L., Lei, X., Tay, L., Cheung, H. K., Kolze, M., Lindsey, A., & Engelsted, L. (2017). Subjective quality of leisure & worker well-being: Validating measures & testing theory. Journal of Vocational Behavior, 103, 14–40. doi:https://doi.org/https://doi.org/10.1016/j.jvb.2017.07.007
- Kuykendall, L., Tay, L., & Ng, V. (2015). Leisure engagement and subjective well-being: A meta-analysis. Psychological Bulletin, 141(2), 364.
- LaGrange, B., & Cole, D. A. (2008). An expansion of the trait-state-occasion model: Accounting for shared method variance. Structural Equation Modeling, 15(2), 241–271.
- Little, R. J. A. (1988). A test of missing completely at random for multivariate data with missing values. Journal of the American Statistical Association, 83(404), 1198–1202. doi:https://doi.org/10.1080/01621459.1988.10478722
- Little, T. D., Slegers, D. W., & Card, N. A. (2006). A non-arbitrary method of identifying and scaling latent variables in SEM and MACS models. Structural Equation Modeling, 13(1), 59–72.
- Lucas, R. E., & Donnellan, M. B. (2007). How stable is happiness? Using the STARTS model to estimate the stability of life satisfaction. Journal of Research in Personality, 41(5), 1091–1098.
- Lucas, R. E. (2007). Adaptation and the set-point model of subjective well-being: Does happiness change after major life events? Current Directions in Psychological Science, 16(2), 75–79.
- Lucas, R. E., Clark, A. E., Georgellis, Y., & Diener, E. (2004). Unemployment alters the set point for life satisfaction. Psychological Science, 15(1), 8–13.
- Nazio, T., & MacInnes, J. (2007). Time stress, wellbeing and the double burden. In G. Esping-Andersen (Ed.), Family formation and family dilemmas in contemporary Europe (pp. 155–184). Barcelona, Spain: FBBVA.
- Newman, D. B., Tay, L., & Diener, E. (2014). Leisure and subjective well-being: A model of psychological mechanisms as mediating factors. Journal of Happiness Studies, 15(3), 555–578. doi:https://doi.org/10.1007/s10902-013-9435-x
- Newsom, J. T. (2015). Longitudinal structural equation modeling: A comprehensive introduction. New York, NY: Routledge.
- Podsakoff, P. M., MacKenzie, S. B., Lee, J. Y., & Podsakoff, N. P. (2003). Common method biases in behavioral research: A critical review of the literature and recommended remedies. Journal of Applied Psychology, 88(5), 879–903.
- Prenoveau, J. M. (2016). Specifying and interpreting latent state–trait models with autoregression: An illustration. Structural Equation Modeling: A Multidisciplinary Journal, 23(5), 731–749.
- Ragheb, M. G., & Beard, J. G. (1980). Leisure satisfaction: concept, theory, and measurement. In S. E. Iso-Ahola (Ed.), Social psychological perspectives on leisure and recreation (pp. 329–353). Springfield, IL: Charles C. Thomas.
- Ragheb, M. G., & Tate, R. L. (1993). A behavioural model of leisure participation, based on leisure attitude, motivation and satisfaction. Leisure Studies, 12(1), 61–70. doi:https://doi.org/10.1080/02614369300390051
- Rubin, D. B. (1987). Multiple imputation for nonresponse in surveys. New York, NY: John Wiley & Sons.
- Schimmack, U., Krause, P., Wagner, G. G., & Schupp, J. (2009). Stability and change of well being: An experimentally enhanced latent state-trait-error analysis. Social Indicators Research, 95(1), 19. doi:https://doi.org/10.1007/s11205-009-9443-8
- Steyer, R., & Schmitt, M. J. (1990). Latent state-trait models in attitude research. Quality and Quantity, 24(4), 427–445. doi:https://doi.org/10.1007/BF00152014
- Stiglitz, J. E., Sen, A., & Fitoussi, J.-P. (2009). Report by the commission on the measurement of economic performance and social progress. Retrieved from http://ec.europa.eu/eurostat/documents/118025/118123/Fitoussi±Commission±report
- Van Praag, B. M., & Ferrer-i-Carbonell, A. (2004). Happiness quantified: A satisfaction calculus approach. Oxford, England: Oxford University Press.
