
Abstract
The European Atlas of the Seas is a web-based information system aimed at the general public, but it is also capable of supporting selected nonspecialist professionals in addressing environmental issues, human activities, and policies related to the coast and sea. It includes a collection of maps and associated fact sheets based on data originating primarily from the European Commission and its agencies, which present a snapshot of key natural and socio-economic elements of the coastal and marine regions of the European Union. It provides a suite of basic instruments for map analysis and data combination to derive ad hoc maritime indicators.
Introduction
“Geography is a representation in picture of the whole known world together with the phenomena that are contained therein.” With this line, Ptolemy, Claudius Ptolemaeus, the Greek scholar who laid down the basics of scientific cartography at the Library of Alexandria, Egypt, in the 2nd century, opened his fundamental work Geographia, also known as Cosmographia (Berggren and Jones Citation2000). But which “phenomena” should be included? Ptolemy recognized that the mapmaker has to make choices, a major one being the subject of the map. Having to select what to include and what to leave off, the resulting map reflects what the mapmaker thought was important. In the maritime domain, the Ptolemaic revival driven by early Renaissance humanists in the 13th, 14th, and 15th centuries led to the first, really accurate maps of coastal and marine regions—Portolan Charts—because they were drawn by people who had navigation and trade in mind (Harley and Woodward Citation1987). Their maps recorded the accrued experience and wisdom of generations of seafarers, acquired mostly in the European marginal seas, providing practical, no-nonsense tools made for sailors who were starting to explore the world's oceans.
The thread of this seafaring tradition can be followed all the way to modern nautical charts, but it is also leading toward a new kind of sea maps, which represent the broadening of interests and uses of the marine environment typical of contemporary society (Wright and Bartlett Citation2000). The European Atlas of the Seas presented here is a reflection of the latest concerns of modern maritime map makers, that is, the European Commission (EC), who must take into account a variety of environmental requirements and economic sectors. New maps and new tools, poised to take full advantage of their information potential, are needed to try and characterize all marine regions, to reconcile the apparently conflicting needs of protecting their ecological balance and exploiting their natural resources. The first idea of a European Atlas of the Seas was set forward in 2007 by the EC “Blue Paper” (European Commission Citation2007) that launched the Integrated Maritime Policy (IMP)Footnote1 of the European Union (EU). The Atlas was devised as a communication tool aimed at the general public based on data originating primarily, if not exclusively, from the EC and its Agencies (European Commission Citation2012a). The map collection and the related fact sheets, constituting the bulk of the Atlas, were to present a snapshot of the key environmental and socio-economic elements that characterize the coastal and marine environment of the EU Member States (MS) and their Outermost Regions.
Conceptual work on the Atlas was originally conducted by the EC Directorate General (DG) for Maritime Affairs and Fisheries (MARE) in 2008, while the actual development of system architecture and infrastructure, data collection, map services and descriptive text took place in 2009. The first prototype was published in 2010, to undergo a public consultation and user survey. Version 1 of the Atlas, accounting for 50% more content than the prototype (about 70 thematic maps, in total) was released in 2011; Version 2, with better performance and interoperability, at the end of 2012; an enhanced Version 2.1, hosted by the European Environment Agency (EEA), in early 2013. The task to develop a Version 3, in the period 2013-2014, was assigned to the EC Joint Research Centre (JRC), through an agreement with the EC DG MARE, with the aim to facilitate access to new services and features, as well as the interaction with other information access tools currently available or planned.
At the JRC, the conceptual design of marine (and coastal) information systems took the first steps already in the early 1990s (Barale Citation1991). By the end of that decade, on-line access to basin-wide satellite data on the European Seas was ensured via the setup of preliminary web-based systems (Barale et al. Citation1999). In recent years, the Environmental Marine Information System (EMIS),Footnote2 also based on satellite data and numerical model outputs, has been published to facilitate access to a suite of data products by the scientific community. The EMIS includes mapping tools that provide information by way of geo-referenced maps, created in real time, and supplies users with basic navigation and interrogation tools for regional assessments. Following in EMIS’ wake, the original European Atlas of the Seas has been upgraded to improve access to both environmental and socio-economic information on the European Seas, and to provide a suite of ready-made instruments for the evaluation of marine and coastal issues. Unlike the prototype, the current version of the Atlas still provides a reference point on coastal and marine issues for the general public, but is also capable of helping selected (nonspecialist) professionals concerned with environmental issues, human activities, or policies related to Europe's seas and coasts.
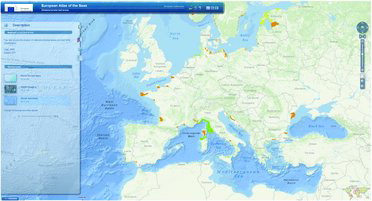
The general appearance of the viewer welcoming users to the European Atlas of the SeasFootnote3 centered on the European continent, is illustrated in . The Atlas is available in English, German and French; it covers all of the European marginal and enclosed seas (i.e., Mediterranean Sea, Black Sea, Baltic Sea, North Sea, Celtic Seas, Bay of Biscay, and Atlantic Iberian Coast), as well as the EU Outermost Regions (i.e., waters surrounding the Azores, Madeira and Canary Islands; plus French Guiana, Guadeloupe, and Martinique, in the Atlantic Ocean; and Réunion in the Indian Ocean); and is composed of a number of data layers, described in the following paragraphs, mirroring the main themes relevant for the IMP (e.g., Integrated Coastal Management issues; European Commission Citation2012b). In the following, the basic features of the Atlas Version 2.1 shall be reviewed, and some elements presented about its envisioned future progress. In particular, the sources and composition of the database currently available, as well as the key information technology (IT) solutions adopted for data storage, access and display, will be discussed in some detail. Examples will be provided of a few simple maritime indicators, combining natural and socio-economic elements, as obtained from selected data layers (and marine basins) of the Atlas. A first case will introduce an index extracted from a single data layer (sea surface temperature), to obtain a preliminary assessment of residential and recreational potential of coastal regions. A second case will be devoted to a double indicator, coupling elements drawn from more data layers (compliance to water quality criteria and aggregated tourism infrastructures) for a complementary assessment of problem areas relevant to the same theme.
Atlas of the Seas Data Layers
The European Atlas of the Seas presents a number of geographical layers to be used in composing a user's customized map. The scope of the Atlas aligns with the EU policies under the IMP umbrella. Hence, the main sources of data for the Atlas are the EC Services, that is, EC DG Energy, Enterprise & Industry, Environment, Eurostat, JRC, MARE and Mobility & Transport, as well as several agencies, the EEA, European Maritime Safety Agency (EMSA), European Fisheries Control Agency (EFCA), and European Market Observatory for Fisheries and Aquaculture (EUMOFA). Several EC-funded programs, projects, and networks, either initiated directly under the auspices of the EC Services and Agencies above or via the EU Seventh Framework Programme for Research (FP7), as well as other national governmental agencies and commercial companies from the EU countries and beyond (United States, primarily), play a part in populating the Atlas database. In addition, contributions are provided by a number of international associations and institutions, such as the Association of the European Cadastre, Land Registry and National Mapping Authorities (EuroGeographics); the European Maritime Heritage (EMH); the General Bathymetric Chart of the Oceans (GEBCO); the International Aquarium Forum (IAF); the International Council for the Exploration of the Sea (ICES); the International Hydrographic Organization (IHO); the International Tanker Owners Pollution Federation (ITOPF); the United Nations Educational, Scientific and Cultural Organization (UNESCO); the United Nations (UN) Food and Agriculture Organization (FAO) and International Maritime Organization (IMO).
In the Atlas, “background layers” are designed to provide basic information on the sites of interest (and to be displayed as a map backdrop). The World Terrain Base layer provides a base map to underline all thematic layers. It offers worldwide coverage at the 1:1,000,000 scale and features shaded relief imagery, bathymetry, and coastal water features to be used as a neutral background for other maps. The World Imagery layer comprises high-resolution (1 m or better) satellite and aerial images, for selected parts of the world, and low-resolution satellite images elsewhere. The Ocean Base Map layer includes bathymetry, names of water bodies and undersea features, and depth values (in m). Associated land features include administrative boundaries, cities, inland waters, and roads, overlaid on land cover and shaded relief imagery.
Further to the background layers, a number of “thematic layers” relating natural and socio-economic elements of the European oceans, seas, and coastal regions are included in the Atlas. These data are classified under eight main categories (i.e., the IMP themes recalled above) detailed as follows:
“geography” provides basic information on EU countries, basins, bathymetry (depth and relief names), coastal lines (land cover and infrastructures), hydrography, drainage basins, and links to other regional atlases.
“nature” includes sea surface temperature, wind, waves, tides, sea level change, coastal geology, coastal erosion, marine biology and ecology, protected areas (Natura 2000 sites), and Large Maritime Ecosystems (LME).
“tourism” deals (primarily) with coastal infrastructures (e.g., accommodation offered) and environment (e.g., bathing water quality) but also covers also UNESCO world heritage sites, maritime museums and aquariums.
“security and safety” reports on incidents that have occurred at sea and the possible response to natural disasters. It includes layers on density and location of incidents, pollution-response vessels and coastal defence works.
“people and employment” provides demographic and economic statistics for coastal regions, for example, Gross Domestic Product, population density, changes, age groups, employment, and unemployment by sector.
“transport and energy” (and resources) offers layers on shipping (i.e., transported passengers and goods, by port and route), offshore wind farms (existing and planned facilities), electricity, and gas submarine networks.
“governance and European policies” deals with political aspects of maritime affairs: Marine Conventions, Regional Advisory Councils, European Maritime Day, and European Marine Observation & Data Network (EMODnet).
“fisheries and aquaculture” provides layers on fish stocks, fishing fleets, zones, quotas and catches; production, processing facilities, consumption and trade; employment, Fisheries Local Action Groups (FLAGs); and available aid.
The total volume of these layers, which includes raster and vector marine data and coastal data organized according to the Nomenclature of Units for Territorial Statistics (NUTS) hierarchical system,Footnote4 a geocode standard developed to subdivide the EU MS for statistical purposes, is approximately 1.4 GB. All maps follow consistent cartographic rules and can be extracted for external use. A progressive degree of simplification is adopted for small-scale visualisations, while more detailed data are used for large-scale visualisations. The Atlas database is updated regularly with the latest releases from each provider. Automatic update procedures have been developed to ensure a quick upload from the different data sources. For most thematic layers, historical data remain accessible after the updates so that time series may be constructed to visualize the evolution of an indicator over a given period. The database may be enlarged with the addition of ancillary layers covering new themes, in particular when relevant to the “blue economy” (i.e., foreseen in the EC Blue Growth StrategyFootnote5), like maritime transport, mineral or living resources, climate change, and new biotechnologies. Rather than aiming to be a mere geographic data catalogue, the European Atlas of the Seas is conceived both as an access point to maritime data, organized into a Geographic Information System (GIS), and as a generator of high-quality thematic representations, for professionals in the maritime sector, European policy makers, and citizens at large.
Atlas of the Seas Infrastructure
The current European Atlas of the Seas infrastructure is based on the Environmental Systems Research Institute (ESRI™) stack, including the ArcGIS™ Application Programming Interface (API) for Flex® and ArcGIS™ Server.Footnote6
For the server side infrastructure, around 80 map services—standard protocols for serving geo-referenced map images over the Internet, which are generated by a map server using data from a GIS database (Scharl and Tochtermann Citation2007)—are currently displayable in the Atlas. The major part of these map services are published using an ArcGIS™ Server instance devoted specifically for this purpose (and hosted by the EEA). These map servicesFootnote7 can be re-used by external applications by means of the ESRI™ Representational State Transfer (REST) API, the Keyhole Markup Language (KML) format (Wilson Citation2008) or the Open Geospatial Consortium (OGC) Web Map Service (De la Beaujardiere Citation2006). Additionally, some map services published by external partners (i.e., Eurostat, EEA and ESRITM map services) are systematically re-used. In the future, the Atlas should become more and more an aggregator of external map services, reinforcing its distributed nature.
For the client side infrastructure, the Atlas cartographic interface (see ) is based on the ArcGISTM FlexR viewer. It provides basic functionalities such as panning and zooming, map layer selection, legend display and object selection. A time slider is used to scroll through temporal data across time. The planned evolution of this interface will include, among other features, the following items:
map generation tools, to allow users to better specify and export a map;
two user profiles: a “citizen profile” and a more advanced “expert profile”;
improved interactivity using innovative mapping techniques (Gaffuri Citation2012); and
improved temporal visualisation to display animated maps.
To improve the communication between the users and the developers of the Atlas, a user's feedback collection tool is available to send feedback messages. An information news feed on the Atlas evolution is also available for the regular users.
Maritime Indicators
The collection of maps provided by the European Atlas of the Seas presents a broad outline of natural and socio-economic features in the marine and coastal regions of the European continent. The Atlas tools for map exploration and combination can be used to extract ad hoc indications on various maritime themes from each data layer, or to combine together more layers for a comparative look at the same themes. The basic idea behind this characteristic of the Atlas is to provide not just nonspecialists but professional users with analysis and interpretation capabilities, to couple data into ecological and socio-economic indicators.
Simple results obtained from the analysis of an environmental parameter like Sea Surface Temperature (SST) illustrate how a climatic variable may be translated into a straightforward indicator of (social and) economic potential. Effective environmental management entails that a proper “value” be assigned, on a given scale, to each territorial unit under consideration, so that appropriate choices can be made when required. Marine regions can be classified on the basis of their climatic traits, in order to assess their potential for Residential and Recreational (R&R) purposes. The annual mean SST provides a first estimate of how appealing a coastal region may be for the development of new settlements or tourism. shows a R&R index obtained from the classification of the European Seas on the basis of the satellite-derived SST climatological average (from the 2000–12 data set by the Moderate Resolution Imaging Spectrometer, MODIS, onboard the TERRA orbital platform) provided by the Atlas. The index is assigned the value 1 for SST>24°C and 0 for SST<6°C, with a linear distribution between these extremes. Higher values of this index indicate a higher development potential of coastal regions. Such a rudimentary tool, of course, can lead to results of awkward interpretation. Considering the Mediterranean Sea only (see the classification of coastal waters, within 100 km from the coast, in 10 categories of development aptitude, based on the R&R index, in ), it would seem that the south-western basin offers a much higher potential than the northwestern basin, while in fact the Middle East coastal areas cannot compete, as far as R&R values go, with the French Côte d’Azur or the Italian Riviera. Hence, more information should be introduced, to specialize the indicator and generate a more elaborate analysis.
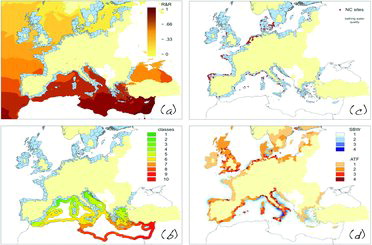
Some of the limitations of a simple climatic index, based on SST statistics alone, can be overcome by taking into account other critical aspects of either the marine environment (e.g., water quality) or the maritime economy (e.g., existing facilities). The combination of additional parameters can be used to refine the “value” assigned to the territorial units of interest, expanding the basis of the evaluation and providing an assessment more relevant for specific management sectors. To remain in the marine and coastal tourism domain, it is evident that water pollution represents a key issue for its growth. Measuring how the tourism industry is affected by water pollution is crucial for several EU MS. So far, the EU water policy has been rather successful in helping protect water resources and the quality of European bathing sites. However, shows that, in 2011, 259 coastal sites were declared either of poor water quality or non compliant with the mandatory limits imposed by the Bathing Water Directive 2006/7/EC (Anonymous Citation2006). An ad hoc index would be needed to synthesize another “value,” derived from water quality parameters, to provide indications about this phenomenon (Belfiore et al. Citation2003).
Directive 2006/7/EC requires EU MS to identify bathing areas and to monitor them for microbiological pollution and other substances. Data on the state of bathing waters (originating from the EEA), available in the Atlas, provide information for the 2011 bathing season, from May to September. The data are classified () in four groups based on the EU MS reports: excellent (1), good (2), sufficient (3), or poor/noncompliant (4) water quality. The reports take into account the impact on water quality due to a number of processes, such as coastal runoff (e.g., river input, farmland discharges, urban/industrial wastewater treatment) or various maritime activities (e.g., cargo and ferry traffic, but also tourism pressure itself, especially during summer). The problem becomes ever more critical when bathing waters of low quality are located in major tourist areas. This occurrence can be easily checked by coupling the state-of-bathing-waters (SBW) index with a tourism pressure index, showing the aggregated number of outfits, bedrooms and bed-places (as reported for NUTS 3 regions in 2011, according to Eurostat data available in the Atlas). In , the coupled SBW and aggregated-tourism-facilities (ATF) indicator highlights regions where managers might need to concentrate their effort in order to improve the match between recreational facilities and clean, safe bathing sites.
Conclusions
The latest version of European Atlas of Seas is based on a novel approach to the exploitation of available marine (environmental) and maritime (socio-economic) data, for two distinct purposes. The first, aimed at the general public, is to ensure a quick but detailed and authoritative reference source of maps, facts, and figures about the seas and coastal regions surrounding the European continent. The second aims at a selected professional audience composed of practitioners either holding policy-oriented and managerial positions in both the public and private sector or responsible for the planning and execution of projects and programs, or again involved with educational institutions, nongovernmental organizations, and international bodies with the ambition of providing scientific support to nonspecialist users.
The basic examples illustrated here suggest that there exist vast opportunities for improving the way in which marine and maritime data can be gathered, combined and interpreted for deriving appropriate indicators. One of the most interesting recent developments in this field is perhaps the Ocean Health Index proposed by Halpern et al. (Citation2012), an indicator based on 10 public goals for a healthy coupled human–ocean system (food provision, fishing opportunity, natural products, carbon storage, coastal protection, tourism and recreation, coastal livelihoods and economies, sense of place, clean waters, biodiversity). So far, this Index has been estimated at the Country level only, but there are plans to use the Atlas for computing a similar indicator at a much higher spatial resolution. Ultimately, it is envisioned that the new indicators derived from the Atlas database will cater to the needs of the EU Maritime Spatial Planning community (Schaefer and Barale Citation2011), substituting a scientific approach to the mere political point of view that today commonly guides management of sea space.
The future Atlas will continue to be compatible with, though separate from, the wider family of existing EC JRC information systems, as well as with their spatial data product generation mechanisms. Further, the Atlas will be interfaced to other databases, including both JRC in-house archives and relevant external sources, while maintaining use of data layers from other EC Services and Agencies, national governmental agencies or commercial companies, international associations and institutions. As already mentioned above, more advanced data interpretation capabilities will also be added, for the combination of basic information into advanced indicators. The resulting new Atlas shall be equipped with map services and analysis tools, such as product-to-product correlations, or time series visualisation, capable of providing great flexibility to map analysis.
Acknowledgements
The present review paper stems from activities carried out at the Institute for Environment and Sustainability (IES), Joint Research Centre (JRC) of the European Commission (EC). Preliminary exploratory research on the Atlas of the Seas themes has been undertaken as part of the Framework Programme 7 (FP7) JRC Action SEACOAST. The authors wish to express their gratitude to the many colleagues from the EC JRC and from the EC Directorate General (DG) for Maritime Affairs and Fisheries (MARE) who contributed to these activities. In particular, thanks are due to A.F. Woestyn, who led the early development of the Atlas of the Seas at the EC DG MARE.
Notes
The Integrated Maritime Policy (IMP) aims for a coherent approach to maritime issues and increased coordination of different policy areas, focusing on multi-sector topics, for example, “blue growth” (economic growth based on different maritime sectors) and coordination of different sectors and actors, for example, “marine knowledge.” For details see http://ec.europa.eu/maritimeaffairs/policy/index_en.htm
Available at http://emis.jrc.ec.europa.eu/. An expanded version, the Global Marine Information System (GMIS), covering the world's oceans, is available at http://gmis.jrc.ec.europa.eu/
The current online version (2.1) of the European Atlas of the Seas is accessible to the general public on the EC DG MARE website: http://ec.europa.eu/maritimeaffairs/atlas/maritime_atlas/
More on this EU strategy at http://ec.europa.eu/maritimeaffairs/policy/blue_growth/index_en.htm
Full documentation on these IT elements is available at http://support.esri.com/en/
A complete list is available at http://maratlas.discomap.eea.europa.eu/arcgis/rest/services/Maratlas
References
- Anonymous. 2006. Directive 2006/7/EC of the European Parliament and of the Council of 15February 2006 concerning the management of bathing water quality and repealing Directive 76/160/EEC. Official Journal of the European Union L64:37–51.
- Barale, V. 1991. Marine remote sensing information system (MARSIS): A conceptual design. International Journal of Remote Sensing 12(4):795–802.
- Barale, V., D. Larkin, L. Fusco, J.M. Melinotte, and G. Pittella. 1999. OCEAN project: The European archive of CZCS historical data. International Journal of Remote Sensing 20(7):1201–1218.
- Belfiore, S., M. Balgos, B. McLean, J. Galofre, M. Blaydes, and D. Tesch. 2003. A Reference Guide on the Use of Indicators for Integrated Coastal Management. ICAM Dossier 1, IOC Manuals and Guides No. 45. Paris: UNESCO.
- Berggren, J.L., and A. Jones. 2000. Ptolemy's Geography: An Annotated Translation of the Theoretical Chapters. Princeton, NJ: Princeton University Press.
- De la Beaujardiere, J., ed. 2006. OpenGIS® Web Map Server Implementation Specification. Document OGC® 06-042, V. 1.3.0. Open Geospatial Consortium Inc.
- European Commission. 2007. Communication from the Commission to the European Parliament, the Council, the European Economic and Social Committee and the Committee of the Regions - An Integrated Maritime Policy for the European Union (“the Blue Book”). . COM (2007) 575 final.
- European Commission. 2012a. Green Paper - Marine Knowledge 2020 - From Seabed Mapping to Ocean Forecasting. . COM (2012) 437 final.
- European Commission. 2012b. Integrated Coastal Zone Management: OURCOAST Outcomes and Lessons Learned. Luxemburg: Publications Office of the EU.
- European Environment Agency. 2013. European bathing water quality in 2012. EEA Report No 4/2013. Luxemburg: Publications Office of the European Union.
- Gaffuri, J. 2012. Toward web mapping with vector data. In Geographic Information Science, Lecture Notes in Computer Science, . Vol. 7478, N. Xiao, M.-P. Kwan, M. F. Goodchild and S. Shekhar (eds.), 87–101. Berlin/Heidelberg: Springer.
- Halpern, B.S., C. Longo, D. Hardy, K.L. McLeod, J.F. Samhouri, S.K. Katona, K. Kleisner, S.E. Lester, J. O’Leary, M. Ranelletti, A.A. Rosenberg, C. Scarborough, E.R. Selig, B.D. Best, D.R. Brumbaugh, F.S. Chapin III, L.B. Crowder, K.L. Daly, S.C. Doney, C. Elfes, M.J. Fogarty, S.D. Gaines, K. Jacobsen, L.B. Karrer, H.M. Leslie, E. Neeley, D. Pauly, S. Polasky, B. Ris, K.St. Martin, G.S. Stone, U.R. Sumaila, and D. Zeller. 2012. An index to assess the health and benefits of the global ocean. Nature 488: 615–620.
- Harley, J.B., and D. Woodward. 1987. The History of Cartography. Volume 1: Cartography in Prehistoric, Ancient, and Medieval Europe and the Mediterranean. Chicago: The University of Chicago Press.
- Knuth, D. 1997. The Art of Computer Programming. Volume 1: Fundamental Algorithms, . 3rd edition. Reading, MA: Addison-Wesley.
- Schaefer, N., and V. Barale. 2011. Maritime spatial planning: Opportunities and challenges in the framework of the EU Integrated maritime policy. Journal of Coastal Conservation 15: 237–245.
- Scharl, A., and K. Tochtermann. 2007. The Geospatial Web: How Geobrowsers, Social Software and the Web 2.0 Are Shaping the Network Society. London: Springer.
- Wilson, T., ed. 2008. OGC® KML. . Document OGC® 07-147r2, V. 2.2.0. Open Geospatial Consortium Inc.
- Wright, D.J., and D.J. Bartlett, eds. 2000. Marine and Coastal Geographical Information Systems. London: Taylor & Francis.