
 ?Mathematical formulae have been encoded as MathML and are displayed in this HTML version using MathJax in order to improve their display. Uncheck the box to turn MathJax off. This feature requires Javascript. Click on a formula to zoom.
ABSTRACT
Activated carbon nanofibers (CNFs) were derived from electrospun nanofibers with subsequent heat treatment. They were characterized by scanning electron microscopy and Fourier transform infrared spectroscopy. The applicability of activated CNFs for preconcentration and determination of organophosphorus pesticides (OPPs) was investigated by high-performance liquid chromatography with diode array detector (HPLC-DAD). Some important parameters influencing the extraction efficiency, such as amount of sorbent, pH, flow rate and amount of salt, were investigated by response surface method (RSM). The obtained results showed that this analytical method will be useful for the analysis of OPPs in tap water with high precision and accuracy.
Introduction
Carbon nanofibers (CNFs) have been derived from electrospun polymer nanofibers, such as polyacrylonitrile (PAN) by the processes of stabilization, carbonization and graphitization. Since CNFs derived from electrospun PAN have a higher specific surface area, higher loading capacity and high mechanical flexibility, they are good candidates for applications in filters, scaffolds and fuel cells for bio-medical, energy applications and also as a sorbent used in solid phase extraction (SPE).[Citation1–Citation5] The SPE is a common preconcentration procedure for extraction and determination of low concentration of pesticides. Although this process is a powerful technique, it suffers from some limitations such as being excessively time-consuming and labour intensive.[Citation6–Citation8]
Organophosphorus pesticides (OPPs) such as ethion, fenitrothion and diazinon are neurotoxic and are released into the environment from manufacturing, transportation and agriculture applications. Due to their low cost and broad-spectrum activity, they are widely used for agricultural purposes.[Citation9–Citation11] When they are absorbed by humans, because of acetyl-cholinesterase deactivation, they become very toxic. Therefore, developing novel analytical methods capable of performing rapid detection of these compounds in the environment becomes necessary and is of special interest.
Nowadays, several numerical methods are widely used for either modelling or optimizing the complex and nonlinear processes generally found in nanoscience and technology.[Citation12–Citation16] Response surface methodology (RSM) is a combination of mathematical and statistical techniques used to evaluate the relationship between a set of controllable experimental factors and observed results. The main goal of RSM is to optimize the response, which is influenced by several independent variables, with minimum number of experiments.[Citation17,Citation18] Therefore, the application of RSM in extraction will be helpful in an effort to find and optimize an important parameter.
This paper will focus on the fabrication of activated CNFs and their application as an efficient sorbent for preconcentration and determination of OPPs in water samples by high-performance liquid chromatography with diode array detection (HPLC-DAD) following a discussion on the several important parameters influencing the extraction efficiency (recovery percent of OPPs). According to the literature, there has not been a previous report regarding the utilization of RSM for the predicting recovery percent of OPPs. Hence, in this work, a study has been conducted to investigate the effects of four parameters including amount of sorbent, solution pH, flow rate and amount of salt on recovery percent of OPPs. For this purpose, response surface model based on the central composite design (CCD) was employed to investigate quantitatively the effect of variables on the response.
Experimental
Materials
PAN (Mw = 80,000) was purchased from Polyacryle Co. (Isfahan, Iran). N-N,dimethylformamide (DMF), hydrochloric acid, sodium hydroxide, acetonitrile, methanol, ethanol, potassium hydroxide and sodium chloride were obtained from Merck Co. (Darmstadt, Germany). All OPPs (ethion, fenitrothion and diazinon) were obtained from Sigma-Aldrich Co. (Steinheim Germany) and were used without further purification. All OPPs and reagents used in this study were of analytical grade.
Stock standard solution (300 µg mL−1) of ethion, fenitrothion and diazinon were prepared in methanol and stored at 4°C. Working standard solutions were prepared daily by diluting with deionized water.
Electrospinning and preparation of CNF
The polymer solutions (8–16 wt%) were prepared by dissolving PAN powder in DMF via magnetic stirrer for 24 h at 50°C. These polymer solutions were used for electrospinning. The electrospinning device used in this experiment was produced by Fanavaran Nano-meghyas Co. (Tehran, Iran). To produce electrospun nanofibers, the polymer solutions were placed into a 5 mL plastic syringe with an 18 gauge (diameter = 0.12 mm) needle tip as a nozzle for electrospinning. A syringe pump fed polymer solution to the needle tip. The metallic needle was connected to a positive high voltage and the collector (aluminium foil) was connected to the ground. The grounded collector was located at different distances (10–15 cm). All electrospinning experiments were carried out at room temperature.
The electrospun nanofibers were picked-up from the collector and were stabilized by heating in air from room temperature to 280°C at a rate of 1°C/min and holding for 4 h under air flow. Then the stabilized nanofibers were carbonized in a tubular high-temperature furnace (EX1200-30L, Exciton, Tehran, Iran) at a heating rate of 30°C/min up to 800°C for 1 h in a N2 atmosphere. The obtained carbonized carbon nanofiber has been activated with the addition of KOH and has been placed in a furnace under N2 flow up to 850°C. The activated product was washed using distilled water, filtered and then dried at room temperature.
Measurement and characterization
The morphology of the gold-sputtered electrospun nanofibers was observed by scanning electron microscope (SEM) (Hitachi S-4160, Tokyo, Japan).
The infrared spectra of samples were recorded on a Perkin Elmer Spectrum 100 in the wave number range of 500–4000 cm−1; a nominal resolution for all spectra was 4 cm−1.
Analyses were performed using a Knauer HPLC system with an EA4300F SMART LINE pump and an S-260 UV detector (Knauer, Berlin, Germany). The analytical column was C18 column (250 mm × 4.6 mm, 10 μm) perfect sill Target ODS-3. The working conditions of HPLC were isocratic; mobile phase was acetonitrile:water::85:15; and flow rate was 1.1 mL min−1. Injection volume was 20 μL and the wavelength of the DAD was fixed at 220 nm for the residual analysis of ethion and fenitrothion and also 247 nm for the analysis of diazinon. The pH of solutions was measured with a Metrohm 781 pH/Ion meter (Metrohm AG, CH-9100 Herisau, Switzerland) supplied with a combined electrode.
Sampling
River water samples were collected in 1 L amber glass bottles (without any further treatment), and cooled in refrigerator. Prior to extraction, each sample was filtered through a 0.45 µm membrane filter and then was used for extraction.[Citation19] The spiked with concentration level of 3 ng mL−1 of each OPPs were extracted using the optimized procedure and then analyzed using HPLC.
Extraction procedure
The packed fiber solid phase extraction (PF-SPE) device is a rectangle made of 5 mg PAN nanofibers into the tip of a needle syringe using a fine steel rod (about 0.5 mm diameter). Prior to a preconcentration step, the PF-SPE column was activated with 200 mL of ethanol and then 200 mL of water. Then, the water sample (1 mL) was loaded through the sorbent by the pressure of air forced by gas-tight plastic syringe (5 mL), with the flow carefully controlled in a slow drop-wise manner. After the analytes were eluted through the sorbent, the content of the column was washed with 100 mL of water, and the sorbed targets were desorbed by 1.0 mL of methanol. Finally, 20 mL of elution solvent was analyzed by HPLC system.
Experimental design and optimization
In this study, RSM was used in the experimental design and optimization. The effects of four independent analytical parameters, amount of sorbent (mg), solution pH, flow rate (mL min−1) and amount of salt (mg), in the extraction of analytes have been considered using RSM based on a CCD. The experiment was performed for at least three levels (coded as –1, 0 and +1) of each factor to fit a quadratic model. The coded values were calculated according to the following equation:
where and
refer to the high and low levels of the variables
(i = 1, 2, 3, 4), respectively. The behaviour of the system is explained by the following quadratic polynomial equation:
where is the predicted response,
and
are the independent variables,
is constant coefficient and
,
,
are coefficients estimated from the regression.[Citation17,Citation18] The RSM was applied to the experimental data using statistical software, Design-expert (version 8.0.3, Stat-Ease, Minneapolis, MN, USA, 2010). The experimental parameters and their levels are given in .
Table 1. Design of experiment (factors and levels).
Results and discussion
Structure and properties
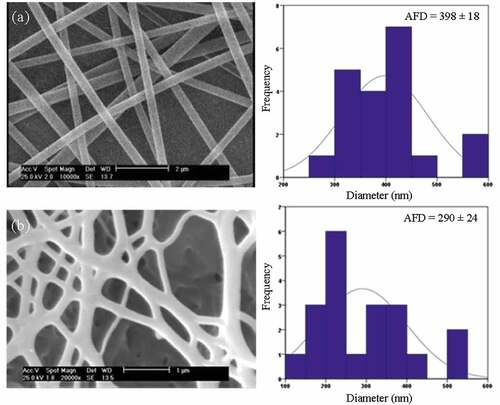
In this study, the electrospun nanofibers with different diameters were prepared by changing the electrospinning parameters to determine the optimum conditions for improved structure and morphology which is required for carbonization process. It is found that PAN nanofibers electrospun at conditions of 14.4 wt% polymer concentration, 12.5 cm of tip-to-collector distance and 15 kV of the applied voltage had suitable structure and morphology for production of CNFs. Further PAN nanofiber characteristics, which provided under different electrospinning conditions, are provided in ). shows SEM micrographs and fibre diameter distribution of as-spun PAN and PAN-derived CNFs. It can be seen that CNFs have a smooth surface morphology and uniform diameter along their length, which could enhance their absorbance capability. Considering the average fibre diameter (AFD), reveals that the CNFs are much thinner than the PAN nanofibers, which is attributed to the shrinkage of PAN nanofibers and weight loss caused during the carbonization.
Figure 1. SEM micrographs and fibre diameter distribution of: (a) PAN nanofiber, and (b) PAN-derived CNFs.
Fourier transform infrared (FTIR) spectra of the as-spun PAN nanofibers, and those carbonized at 800°C are shown in .
Figure 2. FTIR spectra of (a) PAN, and (b) PAN-derived CNFs.
PAN nanofibers had a characteristic vibration at 2241–2243 cm−1 due to the C≡N nitrile group. The vibrations of the aliphatic CH groups (CH, CH2 and CH3) were observed at 2870–2931, 1450–1460, 1350–1380 and 1220–1270 cm−1. The strong bands observed at 1737 and 1684 cm−1 correspond to C=O stretching and the amide group, respectively.[Citation3,Citation20]
The FTIR spectrum of heat-treated PAN nanofibers is characterized by the absence of the 2241–2243 cm−1 peak intensity (C≡N nitrile group), the absence of the intensity of the aliphatic CH groups as well as the amide group. The band around 1588 cm−1 is due to a mix of C=N, C=C and N–H groups, which is attributed to the cyclization and cross-linking, and therefore preparing the chemical structure for subsequent high-temperature carbonization.[Citation3,Citation20]
Analysis of variance
The experimental results concerning recovery percent of ethion (Y1), fenitrothion (Y2) and diazinon (Y3) using four parameters are shown in . As illustrated, the values of recovery percent of diazinon are more than other pesticides that could be attributed to the presence of two pyrimidine nitrogen atoms. According to the FTIR spectra, a mix of C=N, C=C and N–H groups in CNFs (band around 1588 cm−1) can react with two pyrimidine nitrogen atoms in diazinon resulting in a strong adsorption and thus high values of recovery percent. However, further investigation is needed to understand any specificity of the CNFs to this analyte.
Table 2. Experimental design and results of the central composite design.
The results of the second-order response surface model in the form of analysis of variance (ANOVA) for ethion and fenitrothion recovery percent are shown in . A similar trend was also observed for diazinon recovery percent. In this work, statistical conclusions were obtained at 95% confidence level. Using 5% significance level, the factor is considered significant if the p-value is less than 0.05.
Table 3. ANOVA analysis for responses Y1 (ethion recovery) and Y2 (fenitrothion recovery).
By linear regression analysis of EquationEquation (2)(2)
(2) , the predicted response functions (Y1 and Y2) were obtained and given as
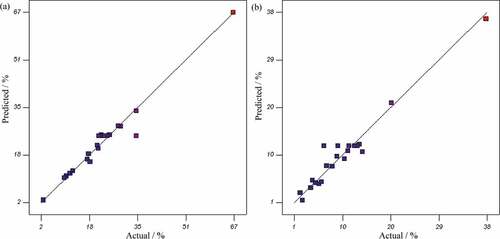
As can be seen in , the prob > F-values for both the responses Y1 and Y2 are lower than 0.05 indicating that quadratic models were significant and have a good agreement with experimental data. The coefficient of determination (RCitation2) that was found to be close to 1 (0.96 for Y1 and 0.95 for Y2) also revealed a high correlation between observed and predicted values. This can be also seen in by comparing the actual values against the predicted responses by the models for recovery percent of ethion and fenitrothion. The “adequate precision” measures the signal–to-noise ratio. The ratio greater than 4 is desirable and demonstrates that models are significant. The adequate precision for Y1 and Y2 were 16.8 and 13.3, respectively, which indicate both models were significant.
Figure 3. Comparison between the actual and predicted value of: (a) ethion, and (b) fenitrothion recovery.
Effects of significant parameters
In this study, the influence of all the single factors and interactions of two factors on recovery percent of ethion was investigated. The main effect plots which describe the influence of single factors on recovery percent of ethion are shown in .
Figure 4. Main effect plots of factors on ethion recovery: (a) amount of sorbent, (b) solution pH, (c) flow rate, and (d) amount of salt.
It is illustrated that increasing the amount of sorbent causes an increase followed by a decrease in recovery percent of ethion (). It was found that recovery percent increased by increasing the amount of sorbent (activated CNFs mass) to 15 mg of packing quantity and then it decreased with increasing amount of sorbent. Furthermore, maximum ethion recovery occurred at solution pH = 4, as shown in . It is obvious that increasing the solution pH causes a decrease in recovery percent of ethion. The same behaviour was also observed for fenitrothion and diazinon. The reason may be related to the degradation of OPPs in alkaline medium.[Citation21,Citation22] The influence of flow rate on recovery percent of ethion is shown in . Higher ethion recovery was found in low flow rate (10 mL min−1). It is obvious that CNFs have very high surface areas resulting in a high extraction capacity. However, the interaction between CNFs and analytes could not be complete within a short time. Therefore, increasing the flow rate, due to the limited rate of adsorption of analytes on the surface of CNFs, leads to a decrease in recovery percent of OPPs. From , it is observed that increasing the amount of salt causes an increase in recovery of ethion, and the maximum ethion recovery was found to be at 200 mg. Increasing trends of recovery percent were also found for fenitrothion and diazinon. This effect can be attributed to decrease of analyte solubility in water samples with increasing ionic strength. Thus, the partitioning from the aqueous solution to the acceptor is improved and therefore the recovery percent increases.[Citation8] The same result was found to be correct by Maddah et al.[Citation8] when they studied the application of electrospun polystyrene nanofiber as an efficient sorbent for preconcentration and determination of OOPs in water.
The response surface and contour plots for ethion recovery are illustrated in .
Figure 5. Response surface and contour plots showing the effect of: (a) salt and sorbent amount, and (b) salt amount and solution pH, on ethion recovery.
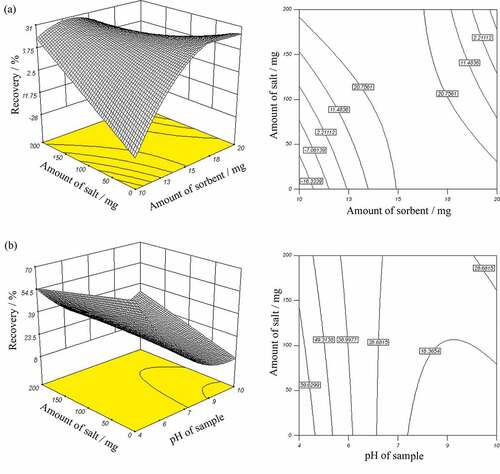
shows the effect of sorbent and salt amount (mg) on recovery percent of ethion. This figure presents the response surface and the contour plots as an estimate of recovery (%) as a function of two parameters: amount of sorbent and amount of salt (solution pH = 7, flow rate = 20 mL min−1). It can be seen that ethion recovery increases as the amount of salt is increased at low sorbent values. For 13 mg of sorbent, increasing the salt content from 0 to 150 mg leads to an increase in ethion recovery from 2% to 20%. However, at higher sorbent values, the decrease in ethion recovery with an increase in salt content is observed. Further investigation shows that at any given salt content, increasing the amount of sorbent leads to an increase followed by decrease in recovery percent of analyte. The result indicated that the optimum amount of sorbent for the extraction of the investigated pesticide was about 15 mg. The response surface and the contour plots in represent the recovery percent of ethion at different solution pH and amount of salt. It is obvious that at any given salt content, the recovery percent of ethion increases with decreasing the solution pH. It can be seen that maximum recovery percent of ethion (60%) was achieved at lowest solution pH as well as salt content. By visualizing these results it can be said that salt content played a small role in recovery percent of ethion in combination with solution pH. However, it was the key component in combination with amount of sorbent. Three-dimensional surface plots reveal that the interactions between salt content and amount of sorbent and also between solution pH and salt content were statistically significant.
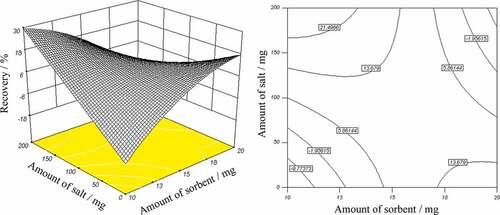
shows the combined effect of varying salt content and sorbent value on recovery percent of fenitrothion under solution pH and flow rate of 7 and 20 mL min−1, respectively. It can be seen that at higher sorbent values, increasing the salt content leads to decrease in recovery. On the other hand, at lower sorbent values, the fenitrothion recovery increases with increasing salt content. In fact, maximum recovery percent of fenitrothion (30%) was obtained at the lowest sorbent value (10 mg) and highest salt content (200 mg). Moreover, fenitrothion recovery percent increased, when salt content was at low value and amount of sorbent was increased from 10 to 20 mg.
Figure 6. Response surface and contour plots showing the effect of salt and sorbent amount on fenitrothion recovery.
Optimization
Response surface methodology has been used successfully to optimize the parameters affecting the recovery percent. The optimal conditions of the analytical parameters for efficient extraction of analytes were established from the quadratic form of the RSM. Independent variables, namely the amount of sorbent (mg), solution pH, flow rate (mL min−1) and amount of salt (mg), were set in the range and dependent variables (recovery percent of ethion, fenitrothion and diazinon) were fixed at maximum. The optimum conditions in the tested range for maximum recovery percent of OPPs were amount of sorbent = 12.38 mg, solution pH = 4, flow rate = 21.44 mL min−1 and amount of salt = 199.89 mg. The obtained value of desirability (=1) shows that the estimated function may represent the experimental model and desired conditions. In order to confirm the predictive ability of the RSM model for response, a further experiment was carried out according to the optimized conditions. It was observed that the experimental value obtained was in good agreement with the value predicted from the model, with relatively small error between the predicted and the actual values.
Application to real sample analysis
The present method was applied to the preconcentration and determination of ethion, fenitrothion and diazinon in Rodsar river water samples. The recoveries of the spiked ethion, fenitrothion and diazinon were determined and the results shown in .
Table 4. Results of determination and recoveries of Rodsar river water samples spiked at concentration level of 3 ng mL−1 of each OPPs.
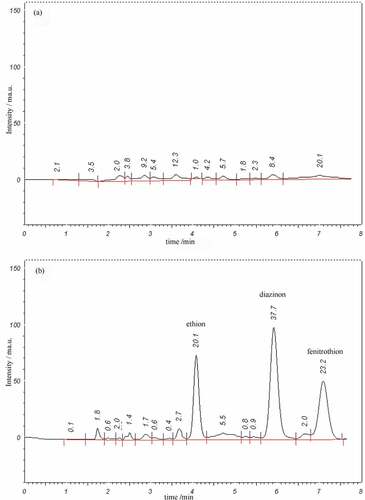
shows the HPLC chromatograms obtained following preconcentration of 2.0 mL of unspiked () and spiked (at 3 ng mL−1 for each analyte; ) water sample on PF-SPE under optimized conditions. The retention times were 5.1 min for ethion, 5.9 min for diazinon and 7.1 min for fenitrothion. The recoveries of ethion, fenitrothion and diazinon were obtained at 105%, 98% and 102%, respectively.
Figure 7. HPLC chromatograms of Roudsar river water sample of: (a) unspiked, and (b) spiked with 3 ng mL−1 ethion, fenitrothion and diazinon under optimized conditions.
Comparison of PF-SPE with other methods
A comparison of the important features of the proposed method with the other previously reported methods in the literature[Citation23–Citation26] was carried out for further demonstration of the superiority of this method.
LOD, limits of detection.
gives information on methodologies for determination of OPPs in water samples. A comparison of this method with other previously reported methods demonstrates the feasibility of using PF-SPE-HPLC method and its reliability for analysis of OPPs in real water samples.
Table 5. Comparison of the current PF-SPE method with the other previously reported methods for determination of OPPs in water samples.
Conclusions
In this study, the fabrication of activated CNFs form electrospun PAN nanofibers and its applicability as sorbent for SPE of OPPs at trace levels in water samples were investigated. The obtained results showed good precision and linear dynamic range. The method was a convenient, safe and simple for the determination of trace quantities of ethion, fenitrothion and diazinon in water samples with satisfactory results. Moreover, the impact of four analytical parameters for efficient extraction of analytes, including the amount of sorbent (mg), pH of the sample, flow rate (mL min−1) and amount of salt (mg), in the extraction of analytes was quantitatively determined by response surface model based on the CCD technique.
Funding
The authors acknowledge the Department of Chemistry of Imam Hossein University and Iran Nanotechnology Initiative Council (INIC) for partially financing this work.
References
- Inagaki, M.; Yang, Y.; Kang, F. (2012) Carbon nanofibers prepared via electrospinning. Advanced Materials, 24: 2547–2566.
- Yoon, S.-H.; Lim, S.; Song, Y.; Ota, Y.; Qiao, W.; Tanaka, A.; Mochida, I. (2004) KOH activation of carbon nanofibers. Carbon, 42: 1723–1729.
- Arshad, S.N.; Naraghi, M.; Chasiotis, I. (2011) Strong carbon nanofibers from electrospun polyacrylonitrile. Carbon, 49: 1710–1719.
- Wang, G.; Pan, C.; Wang, L.; Dong, Q.; Yu, C.; Zhao, Z.; Qiu, J. (2012) Activated carbon nanofiber webs made by electrospinning for capacitive deionization. Electrochimica Acta, 69: 65–70.
- Hammel, E.; Tang, X.; Trampert, M.; Schmitt, T.; Mauthner, K.; Eder, A.; Pötschke, P. (2004) Carbon nanofibers for composite applications. Carbon, 42: 1153–1158.
- Zulin, Z.; Huasheng, H.; Xinhong, W.; Jianqing, L.; Weiqi, C.; Li, X. (2002) Determination and load of organophosphorus and organochlorine pesticides at water from jiulong river estuary. China Marine Pollution Bulletin, 45: 397–402.
- Ahmadi, F.; Rajabi, M.; Faizi, F.; Rahimi-Nasrabadi, M.; Maddah, B. (2014) Magnetic solid-phase extraction of Zineb by C18-functionalised paramagnetic nanoparticles and determination by first-derivative spectrophotometry. International Journal of Environmental Analytical Chemistry, 94: 1123–1138.
- Maddah, B.; Javadi, S.S.; Mirzaei, A.; Rahimi-Nasrabadi, M. (2015) Application of electrospun polystyrene nanofibers as solid phase extraction sorbent for the preconcentration of diazinon and fenitrothion in environmental waters. Journal of Liquid Chromatography & Related Technologies, 38: 208–214.
- Prieto, A. (1999) Analysing organophosphorus pesticides in wines using graphitized carbon black extraction cartridges. Food Additives & Contaminants: Part A, 16: 57–61.
- Slobodnik, J.; Öztezkizan, Ö.; Lingeman, H.; Brinkman, U.A.T. (1996) Solid-phase extraction of polar pesticides from environmental water samples on graphitized carbon and Empore-activated carbon disks and on-line coupling to octadecyl-bonded silica analytical columns. Journal of Chromatography A, 750: 227–238.
- Wang, X.; Tang, Q.; Wang, Q.; Qiao, X.; and Xu, Z. (2014) Study of a molecularly imprinted solid‐phase extraction coupled with high‐performance liquid chromatography for simultaneous determination of trace trichlorfon and monocrotophos residues in vegetables. Journal of the Science of Food and Agriculture, 94: 1409–1415.
- Moghri, M.; Shamaee, H.; Shahrajabian, H.; Ghannadzadeh, A. (2015) The effect of different parameters on mechanical properties of PA-6/clay nanocomposite through genetic algorithm and response surface methods. International Nano Letters, 5: 133–140.
- Pourmortazavi, S.M.; Rahimi-Nasrabadi, M.; Fazli, Y.; Mohammad-Zadeh, M. (2015) Statistical optimization of synthesis procedure and characterization of europium (III) molybdate nano-plates. Applied Physics A, 119: 929–936.
- Honary, S.; Ebrahimi, P.; Rad, H.A.; Asgari, M. (2013) Optimization of preparation of chitosan-coated iron oxide nanoparticles for biomedical applications by chemometrics approaches. International Nano Letters, 3: 1–5.
- Rahimi-Nasrabadi, M.; Pourmortazavi, S.M.; Ganjali, M.R. (2015) Facile synthesis optimization and structure characterization of zinc tungstate nanoparticles. Materials and Manufacturing Processes, 30: 34–40.
- Shariati-Rad, M.; Irandoust, M.; Amri, S.; Feyzi, M; and Ja’fari, F. (2014) Magnetic solid phase adsorption, preconcentration and determination of methyl orange in water samples using silica coated magnetic nanoparticles and central composite design. International Nano Letters, 4: 91–101.
- Myers, R.H.; Montgomery, D.C.; Anderson-cook, C.M. (2009) Response Surface Methodology: Process and Product Optimization using Designed Experiments, 3rd Ed.; John Wiley and Sons: USA.
- Gu, S.Y.; Ren, J.; Vancso, G.J. (2005) Process optimization and empirical modeling for electrospun polyacrylonitrile (PAN) nanofiber precursor of carbon nanofibers. European Polymer Journal, 41: 2559–2568.
- Larki, A.; Rahimi Nasrabadi, M.; Pourreza, N. (2015) UV-Vis spectrophotometric determination of trinitrotoluene (TNT) with trioctylmethylammonium chloride as ion pair assisted and disperser agent after dispersive liquid–liquid microextraction. Forensic Science International, 251: 77–82.
- Pavia, D.L.; Lampman, G.M.; Kriz, G.S.; Vyvyan, J.R. (2001) Introduction to Spectroscopy, 4th Ed.; Brooks/Cole; Cengage Learning: Independence, KY.
- Konrad, J. G.; Chesters, G.; Armstrong, D.E. (1969) Soil degradation of malathion, a phosphorodithioate insecticide. Solid Science Society of America Proceedings, 33: 259–262.
- Han, X.; Balakrishnan V.K.; Buncel, E. (2007) Alkaline degradation of the organophosphorus pesticide fenitrothion as mediated by cationic C12, C14, C16, and C18 surfactants. Langmuir, 23: 6519–6525.
- El-Kabbany, S.; Rashed, M.M.; Zayed, M.A. (2000) Monitoring of the pesticide levels in some water supplies and agricultural land, in El-Haram, Giza (A.R.E.). Journal of Hazardous Materials, 72: 11–21.
- Lambropoulou, D.A.; Albanis, T.A. (2001) Optimization of headspace solid-phase microextraction conditions for the determination of organophosphorus insecticides in natural waters. Journal of Chromatography A, 922: 243–255.
- Liang, P.; Guo, L.; Liu, Y.; Liu, S. Zhang, T. (2005) Application of liquid-phase microextraction for the determination of phoxim in water samples by high performance liquid chromatography with diode array detector. Microchemical Journal, 80: 19–23.
- Li, J.; Zhao, X.; Shi, Y.; Cai, Y.; Mou, S.; Jiang, G. (2008) Mixed hemimicelles solid-phase extraction based on cetyltrimethylammonium bromide-coated nano-magnets Fe3O4 for the determination of chlorophenols in environmental water samples coupled with liquid chromatography/spectrophotometry detection. Journal of Chromatography A, 1180: 24–31.
Appendix
Table A1. SEM micrographs and fibre diameter distribution of PAN nanofibers electrospun under different conditions.