
 ?Mathematical formulae have been encoded as MathML and are displayed in this HTML version using MathJax in order to improve their display. Uncheck the box to turn MathJax off. This feature requires Javascript. Click on a formula to zoom.
ABSTRACT
In 2013, a carbon disclosure mandate was adopted by UK-listed companies. This motivated our study to explore the effects of the 2013 carbon disclosure regulation (CDR) and Greenhouse Gas (GHG) emissions on firms’ market value for voluntary disclosers versus non-disclosers pre- and post-2013 CDR. Using a sample of FTSE 350 firms in a short (2010–2016) and long window (2010–2020), our difference-in-differences design shows a beneficial (adverse) effect of the 2013 CDR on market value for voluntary carbon disclosers (non-disclosers). Also, we document the negative impact of GHG emissions on market value after the 2013 CDR for voluntary disclosers. In contrast, a somewhat positive GHG-market value nexus is noted in the case of non-disclosers post-2013 CDR. Our evidence suggests that voluntary carbon disclosers are heavier GHG emitters and, hence, bear much higher environmental risks/liabilities, a negative attribute that became ever more taxing to their market value after the 2013 CDR.
The UK's 2013 carbon disclosure regulation (CDR) influenced the market values differently for firms based on their disclosure behaviours, showing a positive (negative) impact for voluntary carbon disclosers (non-disclosers).
In the post-CDR era, the GHG emissions of voluntary disclosers were penalized with lower market value while the GHG emissions of non-disclosers were somewhat rewarded with higher valuation.
Compared to non-disclosers, voluntary disclosers are typically larger emitters facing greater environmental risks after the CDR; a negative attribute that continues to undermine their market valuation.
HIGHLIGHTS
1. Introduction
Corporate sustainability reporting is increasingly seen as crucial for supporting a sustainable global economy, integrating traditional financial indicators with broader sustainability objectives, such as environmental preservation (Baboukardos, Citation2017). A critical component of this reporting is the disclosure of greenhouse gas (GHG) emissions, which is vital for achieving sustainability goals (DEFRA, Citation2010, Citation2013). The importance of such disclosures is underscored by the adoption of frameworks like the Global Reporting Initiative (GRI), the United Nations Sustainable Development Goals (SDGs), and the 2016 United Nations Framework Convention on Climate Change (UNFCCC) (Alsaifi et al., Citation2020). Stock exchanges likewise play a key role in promoting the vitality of carbon disclosures as investors increasingly factor GHG emissions into their investment decisions (Baboukardos, Citation2017; Depoers et al., Citation2016; Matsumura et al., Citation2014).
Prior research on the value-relevance of environmental performance posits a negative impact of GHG emissions on firm value (Barth et al., Citation2001; Matsumura et al., Citation2014). With the prevailing unfavourable view of GHG emissions by stakeholders, including investors, they are commonly used to proxy for future environmental liabilities (Clarkson et al., Citation2015), prompting firms to strategically manage their carbon footprints (Downar et al., Citation2021). Therefore, carbon disclosures can showcase a firm’s commitment to mitigating this negative attribute and, in turn, improve stakeholder relationships (Downar et al., Citation2021).
However, carbon disclosures remain voluntary in many countries. Unerman and O’Dwyer (Citation2007) posit that the mounting impact of GHG emissions on climate change is raising public and investor concerns over corporate environmental risks, which, in turn, erodes stakeholders’ trust in voluntary carbon disclosures. As the perceived credibility of voluntary carbon disclosures continues to decline, firms endure significant devaluations in capital markets (Baboukardos, Citation2017). Consequently, there have been many calls for mandatory carbon disclosure requirements (Unerman & O’Dwyer, Citation2007).
On the 30th of September 2013, the UK mandated the disclosure of GHG emissions in the annual reports for listed firms, pursuant to the Carbon Disclosure Regulation (CDR) (DEFRA, Citation2013; UK Secretary of State, Citation2013). Before the CDR, firms were only required to report emissions of individual installations to a public registry under the European Union Emissions Trading System (EU-ETS). While the shift to comprehensive corporate-level emissions reporting marked a significant change from voluntary to mandatory disclosure, we note that many FTSE indexed firms disclosed carbon emissions voluntarily in the annual report before the CDR.
Drawing on the legitimisation perspective of neo-institutional theory (Suchman, Citation1995), we posit that firms voluntarily disclosing their carbon emissions pre-CDR are seeking legitimacy by aligning their actions with societal norms and values, particularly in environmental stewardship. We examine the impact of carbon disclosure and the underlying GHG emissions on the market valuation of FTSE 350 firms, focusing on the shift from a voluntary to a mandatory disclosure regime post-CDR. We analyse the impact of regulatory changes by comparing firms that voluntarily disclosed their GHG emissions with those that did not before the 2013 CDR. While previous research provides valuable insights on the operational (Downar et al., Citation2021) and valuation effects (Baboukardos, Citation2017; Gerged et al., Citation2021) of the CDR, we extend these insights by delineating the unique effects for voluntary carbon disclosers vs. non-disclosers; an area has not been explored before.
Our findings are twofold. First, the fixed-effects regression with a difference-in-differences design shows a beneficial (adverse) effect of the CDR on firm valuation for voluntary disclosers (non-disclosers). Second, in the post-CDR era, we document a negative (somewhat positive) impact of GHG emissions on firm valuation for voluntary disclosers (non-disclosers). A conventional two-sample T-test confirms that voluntary disclosers are characterised by higher GHG emissions, a negative trait that became evermore taxing to their market valuation post-CDR. Our results are robust across various measures and alternative checks addressing endogeneity concerns.
This study contributes to understanding the value-related implications of both carbon disclosure policies and underlying GHG emissions in pre- and post-regulation contexts. We explore how the shift from a voluntary to a mandatory reporting regime creates disparities in the market valuation of voluntary carbon disclosers versus non-disclosers. Pre-CDR valuation premiums or discounts associated with voluntary disclosers may or may not persist as regulation moves to level the playing field between both groups. Hence, our study provides a detailed view of the strategic corporate policies around carbon transparency (i.e. voluntary disclosure versus non-disclosure) and how these policies affect firm valuation in a post-regulation context. Furthermore, by offering updated empirical findings of voluntary disclosers and non-disclosers, the current study enriches the literature on the value relevance of GHG emissions in the post-CDR era, thus contributing to the broader discourse on corporate environmental accountability.
The paper is organised as follows: Section 2 outlines the theoretical framework and formulates hypotheses. Section 3 introduces the research design and empirical model; Section 4 presents empirical findings and robustness checks; Section 5 discusses the findings; Section 6 concludes key findings, delineates limitations, and proposes avenues for future research.
2. Literature review: theoretical framework and hypothesis development
2.1. The 2013 CDR and firm value for voluntary disclosers vs. non-disclosers
Global climate change, primarily driven by GHG emissions, has garnered the attention of stakeholders ranging from governments to investors and the international community, underscoring its significance in financial markets (Baboukardos, Citation2017; Busch & Hoffmann, Citation2011). The extensive ramifications of climate change on capital markets are keenly observed, with a particular focus on carbon emissions and their impact beyond mere financial performance, shaping strategic risks and opportunities (Martin & Moser, Citation2016). This scenario has propelled investors to seek detailed reports on climate-related risks and opportunities, reflecting the growing importance of environmental information in assessing firm value (Wang et al., Citation2014).
In this context, the UK stands out due to its substantial GHG emissions. The UK passed a landmark legislation – the Climate Change Act 2008 –, which laid down significant reduction targets for corporate emissions; 80% by 2050 and an interim of 34% by 2020. In September 2013, the UK mandated that publicly traded companies disclose detailed carbon information in their annual reports, thus enhancing the accessibility and quality of emission data (Baboukardos, Citation2017; Downar et al., Citation2021). This move led to significant improvements in reporting, with the majority of firms disclosing their emissions and integrating climate risks into their governance strategies (CDP, Citation2016). However, it is notable that many firms had already been disclosing carbon data voluntarily in their annual reports before the 2013 CDR was enacted.
Prior research suggests that the 2013 CDR induced a significant increase in firm valuations (Baboukardos, Citation2017), particularly through reduced information asymmetry (Downar et al., Citation2021; Gerged et al., Citation2021). This is in line with evidence suggesting that UK investors prefer mandatory over voluntary environmental disclosures in annual reports, as regulation is commonly seen as necessary to compel firms to provide valuable information (De Villiers & Van Staden, Citation2011; Tauringana & Chithambo, Citation2015).
Theoretically, Suchman’s (Citation1995) legitimisation framework within neo-institutional theory helps explain why voluntary carbon disclosers might experience an uptick in market value. Firms engage in carbon disclosure not just for compliance but to align with societal norms and values, thus enhancing their legitimacy and market standing (Abraham & Cox, Citation2007; Elmagrhi & Ntim, Citation2022). Transparent environmental disclosures, such as carbon information, not only meet regulatory demands but also position firms as sustainable leaders, potentially attracting better investments and fostering robust stakeholder relationships (Matsumura et al., Citation2014).
Furthermore, carbon disclosure can reduce investors’ estimation risks (Lambert et al., Citation2007) and aid in optimal resource allocation (Healy & Palepu, Citation2001). The 2013 regulatory changes likely boosted the market valuations of disclosing firms by increasing transparency and reducing information asymmetry (Downar et al., Citation2021). However, the valuation effects of these disclosures vary based on whether firms voluntarily disclosed their carbon emissions before the 2013 CDR. Although voluntary disclosures before the regulation offered competitive advantages (Leuz & Verrecchia, Citation2000), the 2013 CDR may have levelled the playing field, potentially dissipating the unique advantage previously held by voluntary disclosers (Bagnoli & Watts, Citation2007; Breuer et al., Citation2022). With these premises in mind, we posit the following hypothesis:
H1a: The effect of the UK’s 2013 carbon disclosure regulation on the firms’ value is negative (positive) for voluntary disclosers (non-disclosers) of GHG emissions.
From the perspective of neo-institutional theory advanced by Suchman (Citation1995), disclosing carbon emissions could enhance a company's market value by aligning with environmental norms and values, thus boosting legitimacy among stakeholders like investors and customers (Abraham & Cox, Citation2007; Elmagrhi & Ntim, Citation2022; Ntim & Soobaroyen, Citation2013). This alignment not only attracts investment but also strengthens stakeholder relationships and distinguishes the company in a competitive market (Matsumura et al., Citation2014).
However, for companies that underperform environmentally, choosing not to disclose may initially seem advantageous, allowing them to blend in with other non-disclosers considered “average” performers (Healy & Palepu, Citation2001; Matsumura et al., Citation2014). Yet, this strategy risks exposure in a post-regulation context (i.e. the 2013 CDR), potentially leading to negative consequences, such as market devaluation due to diminished credibility and increased legal risks (Matsumura et al., Citation2014). These complex dynamics suggest a paradox where voluntary disclosers might gain capital market benefits, whereas non-disclosers could endure significant costs following mandatory compliance with the CDR. Consequently, we formulate an alternative hypothesis that captures this paradoxical conjecture.
H1b: The effect of the UK’s 2013 carbon disclosure regulation on the firms’ value is positive (negative) for voluntary disclosers (non-disclosers) of GHG emissions.
2.2. GHG emissions and firm value
Leveraging the value-relevance framework of environmental performance (Barth et al., Citation2001; Matsumura et al., Citation2014), this study examines the firm-valuation effects of carbon emissions in capital markets. The link between carbon emissions and firm value is complex, as documented by diverse and inconsistent prior evidence. Diverse factors (i.e. the actual versus the symbolic nature of carbon performance and varying regulatory contexts) shape the complexities of this relationship (Haque, Citation2017; Haque & Ntim, Citation2020; Wang et al., Citation2014; Ziegler et al., Citation2009). While some studies show that carbon emissions negatively affect firm value through metrics like Tobin’s Q (Busch & Hoffmann, Citation2011), others find positive effects under certain economic structures (Wang et al., Citation2014). Conversely, a stream of prior research shows that the symbolic carbon performance (i.e. the adoption of process-oriented carbon reduction measures) rather than the actual reductions in GHG emissions are associated with higher market values (Delmas et al., Citation2013; Haque & Ntim, Citation2020).
In the UK, a negative effect of GHG emissions on the market value of firms listed on the London Stock Exchange was documented (Baboukardos, Citation2017). This indicates that UK investors view emissions data as indicative of environmental risks and liabilities. However, there appears to be a softening in the negative impact of GHG emission post-2013 CDR (Baboukardos, Citation2017), which is likely due to proactive emission reductions by firms (Downar et al., Citation2021) that led to diminishing the perceived environmental risks.
In the post-2013 CDR landscape, where emissions are subject to public disclosure, regulatory oversight and peer scrutiny, a trend towards sustained annual reductions is anticipated to lessen the negative impact on valuation (Baboukardos, Citation2017). The enhanced comparability of carbon disclosures could also refine investors’ assessments of carbon-related risks, influencing their valuation decisions (Verrecchia, Citation1983). Companies reporting annual emission reductions might experience reduced capital market penalties by mitigating perceived carbon risks (Baboukardos, Citation2017). However, it is essential to note that firms that voluntarily disclose carbon emissions are usually larger and may face greater challenges in achieving consistent reductions (Matsumura et al., Citation2014). Conversely, the smaller operational scale of non-disclosers could provide them with more flexibility in reducing emissions steadily, suggesting that post-2013 CDR, voluntary disclosers and non-disclosers might encounter different capital market reactions to their GHG emissions. Hence, the second hypothesis emerges as follows:
H2: The negative effects of GHG emissions on the firms’ value are more pronounced for voluntary carbon disclosers than non-disclosers after the UK’s 2013 carbon disclosure regulation.
3. Research design
3.1. Sample and data sources
Our study investigates the impact of voluntary carbon disclosure and underlying GHG emissions on firm value, utilising an unbalanced panel of FTSE 350 firms for short (2010–2016) and long windows (2010–2020). Notably, the sampling windows cover pre- and post-2013 CDR periods, which provides a valuable demarcation to assess the effects of voluntary carbon disclosure policy and GHG emissions pre- and post-legislation. Data, including the closing annual lists of FTSE 350 companies and all relevant variables, were sourced from Bloomberg as of 31st December each year. The selection of FTSE 350 companies, representing the largest firms by market capitalisation on the London Stock Exchange, is strategic due to their significant environmental impact and associated risks. The choice of the post-2008 period aims to reduce any confounding effects of the financial crisis on the results. Similarly, we end our sampling period in 2020 to avoid the confounding effects of the climate-related financial disclosure (CFD) Regulation 2022 in the annual reports of 2021.
In constructing our sample, we included all firm-year observations with available data, thus avoiding survivorship bias. After discarding observations with completely missing data, the final sample consists of 3274 firm-year observations spanning the ten sectors of the industry classification benchmark (ICB). displays the distribution of these observations by year and sector and identifies the number of voluntary carbon disclosers – firms that reported GHG emissions in their annual reports before the 2013 CDR – within each sector annually (see the section on independent variables for further details).
Table 1. Sample composition detailed by industry type and year.
3.2. Firms’ value – dependent variable
Our study employs Tobin'sQ as a primary metric for assessing capital market valuation, which is in line with previous literature confirming its widespread use (Reiter, Citation2021). We calculate Tobin'sQ using Bloomberg data based on the market value ratio to replacement cost. As a robustness check, we use the average closing Bid-Ask Spread percentages, which are indicative of information asymmetry and inversely related to firm value (Lee & Zhong, Citation2022). To complement these measures, we also use total shareholder return and the implied cost of equity capital – the latter being an inverse proxy of firm value derived by averaging the price-earnings growth and modified price-earnings growth estimates of Easton (Citation2004).Footnote1 The definitions and operational measurements of all study variables are detailed in .
Table 2. Variable definitions.
3.3. Voluntary carbon disclosure and GHG emissions – independent variables
Our research focuses on the impact of carbon disclosure and GHG emissions on firm value in the UK, specifically analysing the period before and after implementing the UK's 2013 CDR. We differentiate between companies that voluntarily disclosed their GHG emissions before the regulation took effect in September 2013 and those that did not. We develop a binary variable “Voluntary”, coded 1 for voluntary disclosers and 0 for others, to enable the use of difference-in-differences design in subsequent analyses. This variable and the actual emissions data were sourced from Bloomberg and verified on a firm-by-firm basis from annual reports.
To account for the influence of the 2013 CDR, we introduce another binary variable, “CDR”, which is assigned a value of 1 for financial years ending on or after 30th September 2013, the date from which the CDR mandated GHG emissions disclosure in annual reports, and 0 for prior periods (Baboukardos, Citation2017; Downar et al., Citation2021; Gerged et al., Citation2021).
In line with previous literature (Baboukardos, Citation2017; Downar et al., Citation2021; Matsumura et al., Citation2014), we measure GHG emissions as the total of Scope 1 and Scope 2 emissions in thousands of metric tons. The total of Scope 1 and Scope 2 emissions was log-transformed “LnGHG” for analytical consistency. We note that Scope 3 emissions are excluded due to the variability in their definition and measurement (Downar et al., Citation2021).
3.4. Control variables
A comprehensive set of control variables was employed in empirical modelling, as guided by extant literature on firm valuation (Baboukardos, Citation2017; Gerged et al., Citation2021; Haque, Citation2017). These controls include key financial indicators, such as firm size, expressed as the natural logarithm of total assets (Ln.Size), the Book-to-Market Ratio (B2M) for evaluating risks and growth prospects, the debt-to-assets ratio (Leverage) to measure financial leverage, and return on assets (ROA) as a profitability metric.
Additionally, we include variables, such as R&D activity, analyst coverage, and long-term growth projections, which are crucial for understanding a firm's market valuation and its capacity to attract external funding. The presence of R&D activity, represented by a binary variable, underscores the elevated risks and informational asymmetry inherent in such companies (Aboody & Lev, Citation2000). Analyst coverage (Analysts) is factored in to reflect the quality of a firm's informational environment, where increased analyst attention correlates with lower capital costs and enhanced market valuations (Botosan et al., Citation2011; Botosan & Plumlee, Citation2005). Moreover, we adjust for forecasted long-term growth (LGTM Growth) to consider analysts’ expectations about a firm's future growth prospects (Botosan & Plumlee, Citation2013; Easton, Citation2009).
Our study further corrects for competitive pressures that affect a company's market valuation, underlying cost of capital and disclosure practices (Ali et al., Citation2014; X. Li, Citation2010). We use the Herfindahl-Hirschman index (HH Index) to gauge industry competition, where higher values suggest lower competition, potentially allowing firms to better manage increased compliance costs and enhance financial valuation (Clarkson et al., Citation2015; Rhoades, Citation1993).
We also control for corporate initiatives related to environmental responsibility and governance structures that demonstrate a firm's commitment to addressing climate change and reducing GHG emissions. This entails the inclusion of binary variables for the implementation of Emission Reduction Initiatives (ERI) and the existence of a CSR and/or Sustainability committee (Baboukardos, Citation2017). Lastly, the market systematic risk is controlled by including the beta coefficient (Beta) to gauge its impact on information asymmetry and cost of capital during the robustness checks (Botosan et al., Citation2011).
3.5. Empirical design
To examine the firms’ valuation effects of carbon disclosure and GHG emissions before and after the 2013 CDR for voluntary disclosers vs. non-disclosers, we estimate the following difference-in-differences regression model with fixed effects, taking into account all control variables as discussed earlier.
(1)
(1) Where
represents the value of the firm (i) in a year (t).
is a binary taking the value of 1 for firms that disclosed their total GHG emissions in the annual reports before the 2013 CDR and 0 otherwise.Footnote2
is a binary taking the value of 1 for financial years ending on or after 31st September 2013 (the date of carbon disclosure regulation) and 0 for before that.
is the natural logarithm of total GHG emissions included in Scope 1 and Scope 2. The coefficients of interest are –
,
,
, and
. The coefficient
represents the effect of the 2013 CDR for the voluntary carbon disclosers
, while
represents the effect of the regulation
for non-disclosers. According to H1a, we expect a negative (positive) sign for
(
). According to H1b, we expect a negative (positive) sign for
(
).
According to H2, we expect negative signs for both and
, with
potentially demonstrating a higher negative coefficient. The coefficient
represents the effect of GHG emissions of voluntary disclosers post the 2013 regulation
while
represents the effect of GHG emissions post the 2013 CDR for non-disclosers
. We should note that
(
) represents the effect of GHG emissions for voluntary disclosers (non-disclosers) before the 2013 CDR.
This empirical design examining voluntary carbon disclosers and non-disclosers pre and post-2013 CDR is consistent with a long stream of prior studies that employed a difference-in-differences model, as discussed by (De George et al., Citation2016). It should allow us to compare the voluntary (treatment group) with non-disclosers (control group) with respect to the post-effect of the 2013 CDR (the event) and the GHG emissions of both groups. The difference-in-difference design uncovers significant economic outcomes that appear in the data quickly but reverse over the long term (D. Li et al., Citation2022). As such, we run the baseline model of Eq. (1) for short (2010–2016) and long windows (2010–2020) to observe whether or not the 2013 CDR short-term economic effects persist in the long term. The application of short and long windows is consistent with prior literature (Chen et al., Citation2013; DeFond et al., Citation2011; Hong et al., Citation2014). To further understand the results of the difference-in-differences regressions, we rerun the baseline model in Eq. (1) by partitioning the full sample into two subgroups: voluntary disclosers and non-disclosers. The subgrouping regression presents a closer look at the unique effects of ,
, and the interaction term
for the two distinct groups of firms.
We run firm-fixed effects and year-fixed effects estimation with robust standard errors clustered at the firm level.Footnote3 Based on the Hausman test, we find that the fixed-effects estimation fits better than the random-effects estimation. Robust standard errors clustered at the firm level are used to control for heteroscedasticity and autocorrelation bias (Petersen, Citation2009; Wooldridge, Citation2010). The firm-fixed effects eliminate biases caused by time-invariant omitted variables, while year-fixed effects eliminate biases caused by omitted variables that vary across years but are constant across firms (Wooldridge, Citation2010). We use the one-year lag for all the independent and control variables to rule out reverse causality bias.
4. Empirical findings
4.1. Diff-in-diff and subgroup fixed-effects regressions results
The descriptive analysis and correlation matrix of our study variables are presented and briefly discussed in the Online Appendices file. The examination of the difference-in-differences (Diff-in-Diff) and subgroup regression analyses, detailed in , employs fixed-effects estimations for Tobin'sQ (Panel A) and the Bid-Ask Spread (Panel B) over two temporal spans: the short (2010–2016) and long window (2010–2020). In the short window, we introduce Model 1, focusing on the logarithm of GHG emissions (LnGHG) with all control variables; Model 2 implements a standard Diff-in-Diff approach; Model 3 incorporates all pertinent variables to evaluate Hypotheses 1a, 1b, and 2 in line with Equation (1); Model 4 (Model 5) presents the subgroup regressions to dissect the effects of CDR, LnGHG, and their interaction for voluntary carbon disclosers (non-disclosers). The structure applied to Models 1 through 5 is systematically applied to Models 6 through 10 for the long window analysis.
Table 3. Diff-in-diff regressions and subgroup analysis with fixed effects for FTSE 350 firms
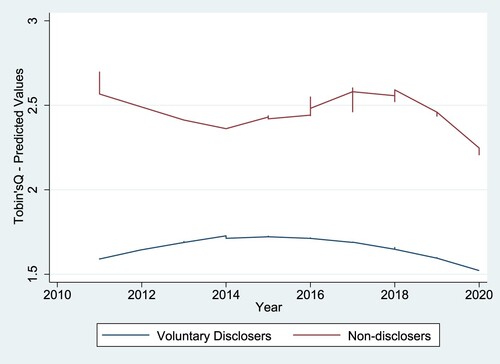
Tobin'sQ results for both temporal periods provide robust support for Hypothesis H1b, though not for Hypothesis H1a. Model 3 illustrates a significant positive influence (+0.546, p < 0.05) of the 2013 CDR on voluntary disclosers and a significant negative impact (−0.696, p < 0.01) of
for non-disclosers within the short window. These findings persist in the long window (Model 8), suggesting enduring economic repercussions from the 2013 CDR on firm value, which are beneficial for voluntary disclosers and adverse for non-disclosers. The predicted values of Tobin’sQ, as illustrated in , were obtained in the post-estimation of Model 8 in the long window. The graphical illustration of predicted values depicts the stark differences between voluntary carbon disclosers and non-disclosers very clearly over the years, especially after the 2013 CDR. In addition, the subgroup analysis further substantiates a sustained firm devaluation for non-disclosers after 2013, evidenced by the negative effect of
in Model 5 and Model 10 (−0.744, p < 0.10; and – 0.606, p < 0.05, respectively).
Figure 1. Predicted values of Tobin's Q.
The Bid-Ask Spread findings in Panel B complement the results of Tobin'sQ, affirming the reduced (increased) information asymmetry for voluntary disclosers (non-disclosers) post-2013 CDR. Model 8 in Panel B reveals a significant positive effect (+0.089, p < 0.05) of for non-disclosers and a significant negative impact (−0.158, p < 0.01) of
for voluntary disclosers post-2013 CDR. These patterns are in line with earlier research that posits that capital markets penalise firms lacking voluntary carbon disclosures (Matsumura et al., Citation2014).
Hypothesis 2 postulates a pronounced negative effect of GHG emissions on firm valuation for voluntary disclosers compared to non-disclosers following the 2013 CDR. The short-term Tobin'sQ results (Model 3) validate this with a significant negative effect (−0.095, p < 0.05) for , contrasting with a positive yet weakly significant coefficient (+0.078, p < 0.1) for
. The long window results (Model 8) mirror this pattern, emphasising the substantial and enduring negative impact of GHG emissions on firm value, specifically for voluntary disclosers.
Contrastingly, the GHG emissions of non-disclosers, while showing a positive effect on Tobin’sQ, fail to reveal consistent evidence in either the Bid-Ask Spread or the subgroup analysis, casting doubt on the robustness of this finding.Footnote4 Finally, we conduct a two-sample T-test to check for significant differences in the levels of GHG emissions. Results confirm that, on average, voluntary disclosers generate 3576 thousand metric tons of GHG emissions more than non-disclosers (T-value = 8.79, p < 0.01), thus facing greater environmental risks and experiencing more pronounced devaluation effects of GHG emissions post-regulation.
4.2. Robustness checks
The robustness of the initial findings, using Tobin'sQ as a firm value indicator, underwent several validations.Footnote5 The first robustness check involved adopting the Bid-Ask Spread as an inverse proxy for firm value, and the results align qualitatively with those of Tobin'sQ (Section 4.1; , Panel B). Further, we obtain consistent results (unreported) when employing total shareholder return as an alternative firm valuation metric.Footnote6
For the second robustness tests, we rerun the baseline fixed-effects model incorporating firm controls, year controls and industry-year controls, with robust standard errors clustered at the firm level; results (unreported) remain qualitatively consistent. In additional attempts to detect industry-specific trends, we replicate the baseline results independently for each of the ten sectors in the ICB classification.Footnote7 Results (unreported) show consistent findings mainly from the largest sectors – Basic Materials, Consumer Services, Financials, and Oil & Gas. We further check the sensitivity of results by excluding the financial sector from the full sample in the baseline regressions, and the results (unreported) remain consistent.
The third test applied fixed effects panel quantile regression (FEPQR), following Canay (Citation2011) method, which allows examination of the entire conditional distribution of firm value rather than just the mean. This approach is especially useful when addressing the presence of extreme outliers and skewed distributions (M. Li, Citation2015). The consistency of the FEPQR findings, displayed in , across the ten quantiles of Tobin’sQ for both the short and long windows reinforces the robustness of the initial results. Similarly, FEPQR evidence for the Bid-Ask Spread, total shareholder return, and the average implied cost of equity capital (unreported) further corroborate the baseline results. We also check for the effect of the outliers in the baseline results by winsorising the continuous variables of interest (Tobin’sQ and LnGHG) at the top and bottom one percent of observations; results (unreported) remain consistent in the short and long windows.
Table 4. Diff-in-diff with fixed effects panel quantile regression of Tobin’sQ for FTSE 350 firms
The fourth robustness check took into account additional controls, such as the 2014/95/EU directive on non-financial disclosures (Al-Dosari et al., Citation2023) and the COVID-19 pandemic.Footnote8 The short and long-window results (unreported) remain similar after accounting for these additional controls. However, the subgroup analysis revealed that voluntary disclosers faced significant devaluation during the pandemic period (2019–2020). The post-COVID devaluations of voluntary disclosers is also evident in .
Finally, the fifth robustness check employed propensity score matching (PSM) to circumvent selection bias. We match each voluntary discloser (treatment group) with a non-discloser (control group) using the period before the 2013 CDR, with replacement.Footnote9 It is argued that “disclosure is closely associated with performance” (Al-Dosari et al., Citation2023, p. 189). In essence, control variables identified in the baseline model may impact disclosure choices since they may affect corporate performance. Hence, we include all control variables of the baseline model in the PSM matching process, along with year controls and industry controls. The matched samples’ regression results, presented in Footnote10, demonstrate consistent evidence as follows: 1- a significant devaluation observed for non-disclosers post-CDR, and 2- an adverse (beneficial) effect of GHG emissions observed for the valuation of voluntary disclosers (non-disclosers) post-CDR. Overall, these robustness checks reinforce the original findings, suggesting that the initial conclusions drawn from Tobin'sQ are stable across different measures and methodological approaches, as well as when additional variables are considered.
Table 5. PSM sample-based regressions and subgroup analysis of Tobin’sQ with fixed effects FTSE 350 firms
5. Discussion of findings
Our research reveals how corporate environmental transparency and underlying performance are closely linked to market valuation, thus affirming the significant role of sustainability disclosures in capital markets (Barth et al., Citation2001; Matsumura et al., Citation2014). The relationship between environmental effects and firm value supports the longstanding argument that investors should consider GHG emissions information in their valuation decisions. Utilising Suchman's (Citation1995) legitimisation perspective under the neo-institutional theory, we understand that voluntary carbon disclosers are perceived with enhanced legitimacy compared to non-disclosers, because they align with societal norms and values. The enhanced legitimacy of voluntary disclosers, potentially bolstering their stakeholder trust and support (Elmagrhi & Ntim, Citation2022), is likely to be rewarded with higher market valuation (Suchman, Citation1995).
We find that strategic legitimacy plays a critical role where companies anticipate and adapt to changing norms, potentially before they become enshrined in formal regulation. Our findings also explore the dual effects of regulation, as suggested by Bagnoli and Watts (Citation2007) and Breuer et al. (Citation2022), whereby mandatory disclosure could either erode the competitive advantage of voluntary disclosers or enhance their market credibility and comparability. Specifically, the 2013 CDR carries a “double-edged sword” effect for voluntary disclosers: they might lose the informational competitive advantage due to increased comparability with non-disclosers, or they might gain market credibility, leading to enhanced firm valuation (Healy & Palepu, Citation2001; Verrecchia, Citation2001). Our evidence supports the latter, suggesting that the market benefits of regulation outweigh the costs of eroded competitive advantage for voluntary disclosers.
Furthermore, the reduced information asymmetry and improved comparability in the post-CDR era revealed the extent of underlying environmental risks of voluntary disclosers compared to their non-discloser counterparts. Our findings support the value-relevance of GHG emissions (Matsumura et al., Citation2014), providing distinct evidence of capital market costs (benefits) for voluntary carbon disclosers (non-disclosers) following the 2013 CDR. The T-test comparison shows that voluntary disclosers are heavier in emissions than non-disclosers. Being the heavier GHG emitters, voluntary disclosers bear much higher environmental risks, a fact that was brought to light by the CDR and became ever more taxing to their firm value.
Our findings contribute to prior literature on corporate environmental transparency and underlying performance in several ways. First, we extend the empirical evidence on the differences between voluntary carbon disclosers and non-disclosers (Matsumura et al., Citation2014) by examining the UK-based transition to a mandatory carbon disclosure regime in 2013. Second, while we reaffirm the value-relevance of GHG emissions in investment decisions (Barth et al., Citation2001; Matsumura et al., Citation2014), we extend the current knowledge by providing evidence on the differences between voluntary disclosers and non-disclosers after the shift to mandatory reporting regime. Third, we extend prior debates on the “double-edged sword” of disclosure regulation for voluntary disclosers – loss of competitive advantage versus reinforced credibility (Breuer et al., Citation2022). Our evidence supports the latter, indicating that the benefits of disclosure regulations outweigh the cost of eroding competitive advantage for voluntary disclosers. Our evidence speaks to the importance of disclosure regulations in reducing information asymmetry and enhancing transparency (Healy & Palepu, Citation2001; Verrecchia, Citation2001).
These findings bear significant practical and policy implications as we bring support for the case of regulated environmental reporting to improve comparability and bolster the perceived reliability of disclosures. Furthermore, the improved comparability between voluntary disclosers and non-disclosers post-CDR allowed investors a better assessment of the relative carbon risks for both groups, thus enabling capital markets to accurately penalise (reward) GHG emissions of voluntary disclosers (non-disclosers). These insights are crucial for policymakers and corporate managers as they navigate the complexities of environmental disclosure, the underlying performance and the respective consequences on firm valuation.
6. Conclusions
This study examines the effects of voluntary carbon disclosure and the underlying GHG emissions on the market valuation of FTSE 350 firms, by differentiating between groups of voluntary disclosers and non-disclosers in the pre- and post-2013 CDR eras.
6.1. Empirical findings
We document a beneficial (adverse) impact of the CDR on the firm valuation of voluntary carbon disclosers (non-disclosers). Moreover, investors penalise the GHG emissions of voluntary disclosers with significant devaluations after the CDR, while non-disclosers are somewhat rewarded with a slight increase in their market value. This indicates that the improved transparency provided by the CDR revealed the magnitude of GHG emissions from voluntary disclosers compared to non-disclosers, which explains the significant GHG-based devaluations observed in voluntary disclosers post the CDR.
6.2. Theoretical implications
These findings contribute to our understanding of how capital markets respond to environmental transparency and underlying performance. The post-CDR positive market response to voluntary carbon disclosers supports the legitimisation perspective of the neo-institutional theory, suggesting that these companies are rewarded for aligning with societal expectations, thereby gaining legitimacy and reinforcing credibility (Elmagrhi & Ntim, Citation2022; Suchman, Citation1995). In addition, we bring support for the value-relevance of environmental performance by demonstrating how investors account for the relative differences in carbon risks between voluntary disclosers and non-disclosers.
6.3. Policy and practical implications
Our findings underline the significant role of regulation in mitigating information asymmetry and enhancing the comparability of environmental disclosures. Mandated disclosures enhance investors’ ability to assess environmental risks and adjust the market valuation of heavy polluters, thus supporting the role of capital markets in environmental governance. While disclosure regulation might eliminate the informational competitive advantage of voluntary disclosers (Breuer et al., Citation2022), the overall market benefits from enhanced credibility and comparability outweigh the lost advantages. These insights bring significant feedback for policymakers when weighing the costs and benefits of disclosure regulations. As for corporate managers, we provide valuable insights reaffirming the substantial value of voluntary disclosure policies in the absence of mandatory requirements.
6.4. Limitations and future studies
This research is limited to FTSE 350 firms from 2010 to 2020, which warrants caution in generalising inferences to broader contexts. We call on future research to explore different timeframes or contexts (i.e. the impact of the 2022 CFD Regulation). Future studies could also investigate the moderating impact of various board characteristics (i.e. how board composition affects the relationship between carbon disclosure, GHG emissions, and capital market metrics). Specifically, the increasing gender diversity on FTSE boards after 2020 presents a valuable opportunity to analyse how board composition by gender might moderate the valuation effects of corporate environmental reporting and underlying performance.
Supplemental Material
Download PDF (1.4 MB)Acknowledgements
We express our deepest gratitude to the editor and anonymous reviewers for the diligent guidance during the revision process. Their insightful remarks provided us with instrumental support to unlock the full potential of our paper.
Disclosure statement
No potential conflict of interest was reported by the author(s).
Data availability statement
The data that support the findings of this study are available from the corresponding author upon reasonable request.
Notes
1 See Section 4.2. on robustness checks for more information.
2 We note that when running the model through STATA, drops out for perfect collinearity.
3 We also use firm-fixed and industry*year-fixed effects to check for robustness, and the results remain similar.
4 Some substantiating evidence, albeit weak, is observed in the PSM sample-based regression (see ) for the long window results.
5 All unreported results in this section are available with detailed discussion in the Online Appendices file.
6 We thank the anonymous reviewer for suggesting the use of total shareholder return.
7 We thank the anonymous reviewer for recommending detailed checks for industry-specific trends.
8 We thank the anonymous reviewer for suggesting the use of these additional controls.
9 We thank the anonymous reviewers for suggesting the use of the PSM method. We note that we also apply PSM without replacement and obtain some consistent results. See pages 28–30 of the Online Appendices file.
10 The reported differences between the observations for voluntary disclosers (Models 4 and 9) and non-disclosers (Models 5 and 10, respectively) are due, at least in part, to the application of PSM with replacement. See pages 29–30 of the Online Appendices file for more information.
References
- Aboody, D., & Lev, B. (2000). Information asymmetry, R&D, and insider gains. The Journal of Finance, 55(6), 2747–2766. https://doi.org/10.1111/0022-1082.00305
- Abraham, S., & Cox, P. (2007). Analysing the determinants of narrative risk information in UK FTSE 100 annual reports. The British Accounting Review, 39(3), 227–248. https://doi.org/10.1016/j.bar.2007.06.002
- Al-Dosari, M., Marques, A., & Fairbrass, J. (2023). The effect of the EU's directive on non-financial disclosures of the oil and gas industry. Accounting Forum, 47(2), 166–197. https://doi.org/10.1080/01559982.2023.2198179
- Ali, A., Klasa, S., & Yeung, E. (2014). Industry concentration and corporate disclosure policy. Journal of Accounting and Economics, 58(2-3), 240–264. https://doi.org/10.1016/j.jacceco.2014.08.004
- Alsaifi, K., Elnahass, M., & Salama, A. (2020). Carbon disclosure and financial performance: UK environmental policy. Business Strategy and the Environment, 29(2), 711–726. https://doi.org/10.1002/bse.2426
- Baboukardos, D. (2017). Market valuation of greenhouse gas emissions under a mandatory reporting regime: Evidence from the UK. Accounting Forum, 41(3), 221–233. https://doi.org/10.1016/j.accfor.2017.02.003
- Bagnoli, M., & Watts, S. G. (2007). Financial reporting and supplemental voluntary disclosures. Journal of Accounting Research, 45(5), 885–913. https://doi.org/10.1111/j.1475-679X.2007.00258.x
- Barth, M. E., Beaver, W. H., & Landsman, W. R. (2001). The relevance of the value relevance literature for financial accounting standard setting: Another view. Journal of Accounting and Economics, 31(1-3), 77–104. https://doi.org/10.1016/S0165-4101(01)00019-2
- Botosan, C. A. & Plumlee, M. A. (2005). Assessing the construct validity of alternative proxies for expected cost of equity capital. The Accounting Review, 80(1), 21–53. https://doi.org/10.2308/accr.2005.80.1.21
- Botosan, C. A. & Plumlee, M. A. (2013). Are information attributes priced? Journal of Business Finance & Accounting, 40(9-10), 1045–1067. https://doi.org/10.1111/jbfa.12044
- Botosan, C. A., Plumlee, M. A. & Wen, H. (2011). The relation between expected returns, realized returns, and firm risk characteristics. Contemporary Accounting Research, 28(4), 1085–1122. https://doi.org/10.1111/j.1911-3846.2011.01096.x
- Breijer, R., & Orij, R. P. (2022). The comparability of non-financial information: An exploration of the impact of the non-financial reporting directive (NFRD, 2014/95/EU). Accounting in Europe, 19(2), 332–361. https://doi.org/10.1080/17449480.2022.2065645
- Breuer, M., Hombach, K., & Müller, M. A. (2022). When you talk, I remain silent: Spillover effects of peers’ mandatory disclosures on firms’ voluntary disclosures. The Accounting Review, 97(4), 155–186. https://doi.org/10.2308/TAR-2019-0433
- Busch, T., & Hoffmann, V. H. (2011). How hot is your bottom line? Linking carbon and financial performance. Business & Society, 50(2), 233–265. https://doi.org/10.1177/0007650311398780
- Canay, I. A. (2011). A simple approach to quantile regression for panel data. The Econometrics Journal, 14(3), 368–386. https://doi.org/10.1111/j.1368-423X.2011.00349.x
- CDP. (2016). CDP Climate Change Report 2016. https://b8f65cb373b1b7b15feb-c70d8ead6ced550b4d987d7c03fcdd1d.ssl.cf3.rackcdn.com/cms/reports/documents/000/001/289/original/UKedition-climate-change-report-2016.pdf?1477317422
- Chen, C., Young, D., & Zhuang, Z. (2013). Externalities of mandatory IFRS adoption: Evidence from cross-border spillover effects of financial information on investment efficiency. The Accounting Review, 88(3), 881–914. https://doi.org/10.2308/accr-50384
- Clarkson, P. M., Li, Y., Pinnuck, M., & Richardson, G. D. (2015). The valuation relevance of greenhouse gas emissions under the European Union carbon emissions trading scheme. European Accounting Review, 24(3), 551–580. https://doi.org/10.1080/09638180.2014.927782
- Clarkson, P. M., Overell, M. B., & Chapple, L. (2011). Environmental reporting and its relation to corporate environmental performance. Abacus, 47(1), 27–60. https://doi.org/10.1111/j.1467-6281.2011.00330.x
- De George, E. T., Li, X., & Shivakumar, L. (2016). A review of the IFRS adoption literature. Review of Accounting Studies, 21(3), 898–1004. https://doi.org/10.1007/s11142-016-9363-1
- De Villiers, C., & Van Staden, C. J. (2011). Where firms choose to disclose voluntary environmental information. Journal of Accounting and Public Policy, 30(6), 504–525. https://doi.org/10.1016/j.jaccpubpol.2011.03.005
- DeFond, M., Hu, X., Hung, M., & Li, S. (2011). The impact of mandatory IFRS adoption on foreign mutual fund ownership: The role of comparability. Journal of Accounting and Economics, 51(3), 240–258. https://doi.org/10.1016/j.jacceco.2011.02.001
- DEFRA. (2010). The contribution that reporting of greenhouse gas emissions makes to the UK meeting its climate change objectives: A review of the current evidence. https://assets.publishing.service.gov.uk/government/uploads/system/uploads/attachment_data/file/69262/pb13449-corporate-reporting-101130.pdf
- DEFRA. (2013). Environmental reporting guidelines: Including mandatory greenhouse gas emissions reporting guidance.
- Delmas, M. A., Etzion, D., & Nairn-Birch, N. (2013). Triangulating environmental performance: What do corporate social responsibility ratings really capture? Academy of Management Perspectives, 27(3), 255–267. https://doi.org/10.5465/amp.2012.0123
- Depoers, F., Jeanjean, T., & Jérôme, T. (2016). Voluntary disclosure of greenhouse gas emissions: Contrasting the carbon disclosure project and corporate reports. Journal of Business Ethics, 134(3), 445–461. https://doi.org/10.1007/s10551-014-2432-0
- Downar, B., Ernstberger, J., Reichelstein, S., Schwenen, S., & Zaklan, A. (2021). The impact of carbon disclosure mandates on emissions and financial operating performance. Review of Accounting Studies, 26(3), 1137–1175. https://doi.org/10.1007/s11142-021-09611-x
- Easton. (2004). PE ratios, PEG ratios, and estimating the implied expected rate of return on equity capital. The Accounting Review, 79(1), 73–95. https://doi.org/10.2308/accr.2004.79.1.73
- Easton. (2009). Estimating the cost of capital implied by market prices and accounting data. Foundations and Trends® in Accounting, 2(4), 241–364.
- Elmagrhi, M. H., & Ntim, C. G. (2022). Non-financial reporting in non-profit organisations: the case of risk and governance disclosures in UK higher education institutions. Accounting Forum, 47(2), 223–248. https://doi.org/10.1080/01559982.2022.2148854
- Gerged, A. M., Matthews, L., & Elheddad, M. (2021). Mandatory disclosure, greenhouse gas emissions and the cost of equity capital: UK evidence of a U-shaped relationship. Business Strategy and the Environment, 30(2), 908–930. https://doi.org/10.1002/bse.2661
- Haque, F. (2017). The effects of board characteristics and sustainable compensation policy on carbon performance of UK firms. The British Accounting Review, 49(3), 347–364. https://doi.org/10.1016/j.bar.2017.01.001
- Haque, F., & Ntim, C. G. (2020). Executive compensation, sustainable compensation policy, carbon performance and market value. British Journal of Management, 31(3), 525–546. https://doi.org/10.1111/1467-8551.12395
- Healy, P. M., & Palepu, K. G. (2001). Information asymmetry, corporate disclosure, and the capital markets: A review of the empirical disclosure literature. Journal of Accounting and Economics, 31(1-3), 405–440. https://doi.org/10.1016/S0165-4101(01)00018-0
- Hong, H. A., Hung, M., & Lobo, G. J. (2014). The impact of mandatory IFRS adoption on IPOs in global capital markets. The Accounting Review, 89(4), 1365–1397. https://doi.org/10.2308/accr-50720
- Lambert, R., Leuz, C., & Verrecchia, R. E. (2007). Accounting information, disclosure, and the cost of capital. Journal of Accounting Research, 45(2), 385–420. https://doi.org/10.1111/j.1475-679X.2007.00238.x
- Lee, C. M., & Zhong, Q. (2022). Shall we talk? The role of interactive investor platforms in corporate communication. Journal of Accounting and Economics, 74(2-3), 101524.
- Leuz, C., & Verrecchia, R. E. (2000). The economic consequences of increased disclosure. Journal of Accounting Research, 38, 91–124. https://doi.org/10.2307/2672910
- Li, D., Xing, L., & Zhao, Y. (2022). Does extended auditor disclosure deter managerial bad-news hoarding? Evidence from crash risk. Journal of Corporate Finance, 76, 102256. https://doi.org/10.1016/j.jcorpfin.2022.102256
- Li, M. (2015). Moving beyond the linear regression model: Advantages of the quantile regression model. Journal of Management, 41(1), 71–98. https://doi.org/10.1177/0149206314551963
- Li, X. (2010). The impacts of product market competition on the quantity and quality of voluntary disclosures. Review of Accounting Studies, 15(3), 663–711. https://doi.org/10.1007/s11142-010-9129-0
- Martin, P. R., & Moser, D. V. (2016). Managers’ green investment disclosures and investors’ reaction. Journal of Accounting and Economics, 61(1), 239–254. https://doi.org/10.1016/j.jacceco.2015.08.004
- Matsumura, E. M., Prakash, R., & Vera-Munoz, S. C. (2014). Firm-value effects of carbon emissions and carbon disclosures. The Accounting Review, 89(2), 695–724. https://doi.org/10.2308/accr-50629
- Ntim, C. G., & Soobaroyen, T. (2013). Corporate governance and performance in socially responsible corporations: New empirical insights from a Neo-Institutional framework. Corporate Governance: An International Review, 21(5), 468–494. https://doi.org/10.1111/corg.12026
- Petersen, M. A. (2009). Estimating standard errors in finance panel data sets: Comparing approaches. Review of Financial Studies, 22(1), 435–480. https://doi.org/10.1093/rfs/hhn053
- Reiter, N. (2021). Investor communication and the benefits of cross-listing. Journal of Accounting and Economics, 71(1), 101356. https://doi.org/10.1016/j.jacceco.2020.101356
- Rhoades, S. A. (1993). The herfindahl-hirschman index. Federal Reserve Bulletin, 79, 188.
- Suchman, M. C. (1995). Managing legitimacy: Strategic and institutional approaches. The Academy of Management Review, 20(3), 571–610. https://doi.org/10.2307/258788
- Tauringana, V., & Chithambo, L. (2015). The effect of DEFRA guidance on greenhouse gas disclosure. The British Accounting Review, 47(4), 425–444. https://doi.org/10.1016/j.bar.2014.07.002
- UK Secretary of State. (2013). Companies Act 2006 (Strategic Report and Director's report). Retrieved June 28, 2022, from https://www.legislation.gov.uk/uksi/2013/1970/contents/made
- Unerman, J., & O’Dwyer, B. (2007). The business case for regulation of corporate social responsibility and accountability. Accounting Forum, 31(4), 332–353.
- Verrecchia, R. E. (1983). Discretionary disclosure. Journal of Accounting and Economics, 5, 179–194. https://doi.org/10.1016/0165-4101(83)90011-3
- Verrecchia, R. E. (2001). Essays on disclosure. Journal of Accounting and Economics, 32(1-3), 97–180. https://doi.org/10.1016/S0165-4101(01)00025-8
- Wang, L., Li, S., & Gao, S. (2014). Do greenhouse gas emissions affect financial performance? – an empirical examination of Australian public firms. Business Strategy and the Environment, 23(8), 505–519. https://doi.org/10.1002/bse.1790
- Wooldridge, J. M. (2010). Econometric analysis of cross section and panel data. MIT Press.
- Ziegler, A., Busch, T., & Hoffmann, V. H. (2009). Corporate responses to climate change and financial performance: The impact of climate policy. CER-ETH-Center of Economic Research at ETH Zurich. Working paper (09/105).