
ABSTRACT
The Forest Kingfisher Todiramphus macleayii inhabits eucalypt savannas, rainforests and mangroves across its distribution in Australasia. Two Australian subspecies are consistently recognised but the taxonomic status of resident New Guinean populations is unsettled. Genomic data from populations sampled across the species’ Australian and New Guinean ranges support the recognition of resident New Guinean populations at the subspecies level as T. m. elisabeth. Further work is required to examine island populations that remain unsampled genetically and to place the species in a broader phylogenetic analysis of Todiramphus kingfishers. We also report genetically based detection of a migrant individual in New Guinea either from eastern Australia or the Trans-Fly region of southern New Guinea. Our study provides a first insight into how genetic diversity is structured within this species across its range. It highlights remaining areas for study and illustrates the potential of DNA sequence data in tracking migratory movements of the species.
Introduction
The Forest Kingfisher Todiramphus macleayii occurs primarily in Australia and New Guinea. In Australia it is common in eucalypt woodlands and savannas across monsoonal and subtropical Australia and in New Guinea it also occurs in lowland rainforests. Though unrecorded from seemingly suitable habitat of the Kimberley region of Western Australia, it otherwise ranges east from the Top End of the Northern Territory to subtropical Queensland and northern New South Wales (); Ford Citation1978; Schodde Citation1997; Johnstone and Storr Citation1998; Higgins Citation1999; eBird https://ebird.org; all eBird records herein accessed 15 December 2021). In New Guinea, it occurs in lowland eastern parts of the island, almost exclusively in Papua New Guinea (PNG) and east to the Bismarck Archipelago (); Mees Citation1982; Beehler and Pratt Citation2016; Gregory Citation2017).
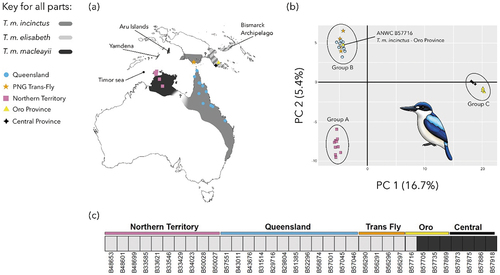
Figure 1. Genomic variation in Forest Kingfishers (drawn by Julian Teh). (a) Total distribution of the species (modified from Woodall and Kirwan Citation2020), key localities mentioned in the text, and sampling localities of Forest Kingfisher T. macleayii specimens used in this study (coloured symbols) sampled from five geographic regions – Northern Territory (squares) and Queensland (circles) from Australia, and Trans-Fly (star), Central Province (diamond) and Oro Province (triangle) from Papua New Guinea (PNG). Details of distribution north of Australia as shown broadly reflect available data (e.g. Mees Citation1982; Dickinson and Remsen Citation2013) but details especially when and where subspecies may overlap warrant closer study (see Introduction); (b) Results of PCA analysis of SNP data for the first two principal components PC1 and PC 2. Three genetic clusters are identified – Group A (Northern Territory), Group B (Queensland, Trans-Fly and ANWC B57716 from Oro Province) and Group C (Central and Oro Province). Colour coding follows Figure 1(a) – see text for discussion of subspecies assignments. (c) Results of STRUCTURE analysis. Two genetic clusters (K = 2) were determined to be the best fit to the data and highlight the distinctiveness of Group C relative to Groups A and B. Group Labels have been added to Table S1.
Three subspecies are usually recognised (Clements et al. Citation2021; Dickinson and Remsen Citation2013; Del Hoyo and Collar Citation2014; Gregory Citation2017; Gill et al. Citation2022) but the number has long been debated and, as we will show, uncertainty remains (e.g. Mayr Citation1937; Keast Citation1957; Mees Citation1982; Schodde Citation1997; Higgins Citation1999). Nominate T. m. macleayii generally refers to populations in Australia’s Northern Territory and some islands to its north and west (e.g. Mees Citation1982; Schodde Citation1997; Dickinson and Remsen Citation2013); they are blue-backed and only some females show a trace of green dorsally. The breeding range of migratory T. m. incinctus is eastern Australia and immediately north of Cape York Peninsula in the Trans-Fly region of New Guinea. It is readily distinguished by extensive greenish dorsal colour of adults of both sexes. Which subspecies occur between core ranges of these two subspecies is mostly unknown (but see Schodde Citation1997). Lastly, resident blue-backed New Guinean populations are generally assigned to T. m. elisabeth. Two factors have generated debate about whether T. m. elisabeth should be recognised or synonymised with nominate T. m. macleayii: (a) their shared blue dorsal plumage set against (b) the odd ‘leapfrog’ distribution pattern west and east of the populations of T. m. incinctus that results when they are synonymised as T. m. macleayii. Among recent works, for example, Del Hoyo and Collar (Citation2014) recognised T. m. elisabeth noting that it is barely separable from T. m. macleayii. Gregory (Citation2017), Clements et al. (Citation2021) and Gill et al. (Citation2022) recognised T. m. elisabeth but gave no comments on its differentiation from T. m. macleayii. Conversely, Beehler and Pratt (Citation2016) synonymised T. m. elisabeth with T. m. macleayii noting that they followed Mees (Citation1982) who in turn had noted that he synonymised the two reluctantly; his decision was based on examination of specimens at the American Museum of Natural History reported to him by M. LeCroy who could find no differences. Clearly, the question of whether T. m. elisabeth warrants recognition needs reassessment.
In eastern Australia, T. m. incinctus south of ~20°S is at least a partial migrant (Schodde Citation1997; Higgins Citation1999). Given its distinctive greenish dorsal plumage (), reliable literature and specimen records of its non-breeding season migration span a region from Yamdena (formerly Tanimbar Islands) in the west (Mees Citation1982) through mainland Papua New Guinea (PNG) to the Bismarck Archipelago in the east (Mayr Citation1937; Tubb Citation1945; Schodde and Hitchcock Citation1968; Coates Citation1985; Schodde Citation1997). In eastern lowland PNG, co-occurrence from roughly April-October of green-backed, non-breeding T. m. incinctus and resident blue-backed New Guinean birds e.g. around Port Moresby, is well documented (Tubb Citation1945; Coates Citation1985; ).
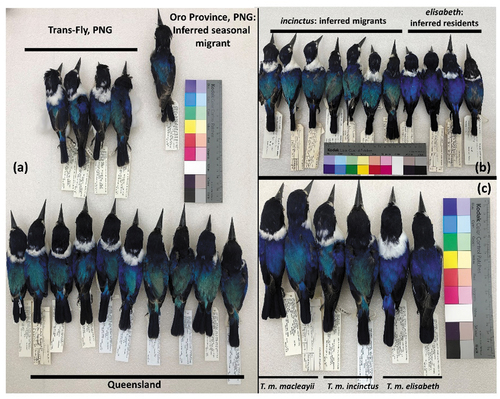
Figure 2. Phenotypic variation in Forest Kingfishers. (a) Specimens from Queensland (lower row), Trans-Fly, PNG (middle row) and an inferred migrant sampled in the Oro Province, PNG (ANWC B57716) (top right) all of which comprise Group B in ); (b) specimens collected in May-very early October from the Central Province PNG showing green-backed birds here argued to belong to inferred migrant T. m. incinctus and blue-backed birds argued to be resident T. m. elisabeth; (c) three pairs of representative specimens (male left and female right in each pair) of what we here conclude should be recognised as T. m. macleayii (left pair), T. m. incinctus (middle pair), and T. m. elisabeth (right pair).
No prior population genetics study has been done on this species. Our broad aim was to cast patterns of genomic data in Australian and mainland PNG populations against known patterns of the geographical variation in plumage and debates about subspecific taxonomy. Our specific aim was to describe genetic diversity in resident blue-backed populations of mainland New Guinea and so assess the merit of recognising them as T. m. elisabeth or assigning them to T. m. macleayii.
Materials and methods
Genetic data
We subsampled 34 tissue samples (liver, heart, or muscle) that had been stored at −80°C and held at the Australian National Wildlife Collection (ANWC) into 70% ethanol prior to DNA extraction (Supplementary Material, Table S1). They were from Australia: Northern Territory, including Melville Island (n = 10) and Queensland (12 between the tip of Cape York Peninsula and Rockhampton), and PNG: (Trans-Fly (4), Oro Province (4) and Central Province (4). Specimens collected before 1980 lacked frozen tissue samples and so were included in morphological but not genetic analyses.
Our protocols for the extraction of DNA, library preparation and generation of single nucleotide polymorphism (SNP) data essentially followed the Diversity Arrays Technology (DArT) pipeline as described elsewhere (Joseph et al. Citation2019a, Citation2019b, Citation2021). Details are in Supplementary Material but some details follow. Extractions were performed via a salting out method (Miller et al. Citation1988). Quantification of DNA was carried out initially via gel electrophoresis to confirm the presence of DNA, then using DropSense 96 and DropQuant® (Perkin-Elmer, Melbourne) to determine DNA concentration and Qubit Fluorometric Quantitation for some samples (e.g. failures to read or excessively high). Extractions returning DNA concentrations below thresholds for DArT were reattempted and/or concentrated under vacuum centrifuge. DNA extractions were then sent to DArT for library preparation.
SNPs were called using the standard DArT pipeline and SNP genotyping following Georges et al. (Citation2018) and Wells and Dale (Citation2018) and using a Woodland Kingfisher Halcyon senegalensis reference genome (Genbank Assembly accession number ASM1339759v1). SNPs were filtered by repeatability across replicates (>98%), call rate (<5% missing data), and singletons were removed using the call rate function in dartR (Gruber et al. Citation2018). A Principal Components Analysis (PCA) was performed to visualise population structure, based on the genetic distance between samples using Euclidean distance to identify population clusters. We ran STRUCTURE (Pritchard et al. Citation2000) using the same filtering protocol (10,079 SNPs; 34 individuals) 10 times for each value of K between 1 and 5. The model used assumed admixture and correlated allele frequencies. We used clumpp (Jakobsson and Rosenberg Citation2007) to summarise the repeated runs for each K and deltaK to select the best value of K (Evanno et al. Citation2005). The StamPP package in R (Pembleton et al. Citation2013) was used to generate FST statistics to compare genetic differentiation between subspecies pairs. Phylogenetic analyses were performed using RAxML, SVD Quartets, and SplitsTree (references in Supplementary Material).
Plumage colouration data
Given that earlier studies have described plumage variation well, at least in the visible spectrum (e.g. Mayr Citation1937; Keast Citation1957; Mees Citation1982; Schodde Citation1997; Higgins Citation1999), we restricted our examination to qualitative visual assessment of colour of the dorsal plumage of all specimens (n = 123) held at the Australian National Wildlife Collection, CSIRO, Canberra. We did not attempt to quantify variation in the size of the white wing-spot because most specimens were available as dried specimens without one accompanying spread wing. For detailed morphometric assessments see Keast (Citation1957) and Higgins (Citation1999).
Results
Genetic variation
After filtering from 59,992 binary SNPs (40.16% missing data), the number of SNPs reduced to 8,500 (1.85% missing data) (N = 34). The first and second principal components explained 16.7% and 5.4% of the total variation, respectively ()). Three distinct genetic clusters were evident in PCA and all phylogenetic analyses (Figures S1–S3): Group A comprised all individuals from the Northern Territory, Group B comprised all individuals from Queensland and PNG Trans-Fly as well as one of four samples from Oro Province (sample ANWC B57716), and Group C comprised all other samples from Oro and Central Provinces in PNG. Groups A and B are essentially only separated on the second principal component and show no further substructure. Substructure is evident within Group C between Oro and Central Province specimens along both the first and second principal components ()). Similarly, STRUCTURE found two genetic clusters (highest deltaK was for K = 2) Again, these corresponded to samples from Australia and Trans-Fly (Groups A and B) on one hand and Oro and Central Province (Group C in PCA) on the other. Again, ANWC B57716, a T. m. incinctus specimen from Oro Province, clearly associates with samples from Australia and Trans-Fly (Groups A and B) rather than the other samples from Oro and Central Province in eastern PNG.
The FST measures of genetic differentiation between Group C and either Group A (FST = 0.274) or Group B (FST = 0.240) were approximately five times higher than that between Group A and B themselves (FST = 0.05). No genetic structure was apparent between geographic regions within Group B (FST ≤ 0.01: Queensland, Trans-Fly, and ANWC B 57716 from Oro). Notably, differentiation between Central and Oro samples of Group C (FST = 0.113) was substantially higher than between Groups A and B (FST = 0.05).
Phylogenetic analyses (see Supplementary Material; Figures S1–S3) essentially confirmed the PCA and FST results for pattern and clustering of the three groups. They also corroborated placement of ANWC B57716 with Group B rather than with other individuals from the Oro Province, which fall in Group C. Relationships among Group B individuals themselves, however, were much less clear and poorly supported (Figures S1 and S3). That is, Group B individuals did not resolve as a single, strongly supported clade despite the apparently high levels of genetic similarity within the group.
Plumage variation
The Oro Province specimen ANWC B57716, and all Trans-Fly specimens have green dorsal colouration essentially identical to the Queensland specimens, reinforcing the cohesion of this group ()). Other specimens from the Central Province savannas (n = 23) were collected between May and September and clearly divided into two groups – greenish-backed Group B birds and blue-backed Group C, some of the latter having been labelled ‘elisabeth’ when collected in the 1960s ()). We find Group C subtly but readily distinguishable from Group A in having darker, more uniform dorsal blue that is not sexually dimorphic ()).
Discussion
We used genomic data to test the number of taxa that could be recognised within the Forest Kingfisher T. macleayii and whether the data could inform migration patterns. We were particularly interested in whether resident blue-backed populations of mainland New Guinea warrant recognition at least as a subspecies T. m. elisabeth or should be synonymised with T. m. macleayii of Australia’s Top End (see Introduction). Our results robustly and consistently defend support for the resident mainland New Guinean populations as taxonomically distinct from both T. m. macleayii (Northern Territory) and T. m. incinctus (Queensland and Trans-Fly). They support recognition of these populations at subspecies rank as T. m. elisabeth, which would be endemic at least to the lowlands of eastern mainland New Guinea.
Might T. m. elisabeth warrant recognition at species rank? It is distinct genetically ( and S1–S3) and phenotypically (). The magnitude of its genetic differentiation relative to other subspecies (; FST: 0.240, 0.274) is substantial and typical of between-species differences (Roux et al. Citation2016). Further, habitat differences relative to migrant T. m. incinctus are notable. T. m. elisabeth inhabits savanna woodland (Bell Citation1981) whereas non-breeding migrant T. m. incinctus in PNG is ‘essentially a bird of rainforest margins and secondary growth’ (Schodde and Hitchcock Citation1968). They only overlap in New Guinea when both are not breeding (Tubb Citation1945; Bell Citation1981; Coates Citation1985). We conclude that phylogenetic analysis of all Todiramphus and more extensive geographic sampling of T. macleayii are needed before changing the taxonomic status of T. m. elisabeth. For example, we were unable to sample island populations from Yamdena, Aru, and the Bismarck Archipelago ()) for which some species-group epithets are available e.g. insularis for Aru; toriu for Bismarck Archipelago. A broader phylogenetic analysis of Todiramphus might also probe reasons for the notable lack of support in our phylogenetic analyses for aligning all Group B individuals together (Figure S3). Possible explanations include gene flow, noisy data or an issue of outgroup selection.
A second key result affirmed the utility of DNA sequences in tracking migrant individuals. We inferred from our data that one specimen (ANWC B57716) collected in Oro Province along the north coast of PNG is likely a migrant T. m. incinctus (). This is consistent with what had already been deduced about this form’s movements from specimens and field observations (Mayr Citation1937; Tubb Citation1945; Schodde and Hitchcock Citation1968; Coates Citation1985; Schodde Citation1997). Perhaps notably, ANWC B57716 was a juvenile specimen that grouped with a Trans-Fly specimen (Figure S3).
Other issues concerning movements relate to the eastern and western extremes of the species’ geographical range. At the eastern extreme in the Bismarck Archipelago, the species is usually considered migratory (e.g. Mayr Citation1937; Mees Citation1982; Gregory Citation2017). Two records there (Hoskins, West New Britain Island, May 1984; Galai, West New Britain Island, January 1986) and photographs of an apparently blue-backed bird (Rabaul, East New Britain September 2019), however, are consistent with a resident population or vagrant or migrant T. m. elisabeth (https://ebird.org checklists S10394116, S16635584 and S60347107, respectively). To the west, recent Indonesian records and one Australian record from the Timor Sea ()) are from between April and October (https://ebird.org, checklists S18998436 and S49132187); these are presumably of non-breeding migrants from Australia but their subspecific identity is unrecorded. There may be resident populations in Indonesia (Coates and Bishop Citation1997). Although one bird photographed in the Ashmore Reef area in April 1990 appears most likely to be a green-backed T. m. incinctus, it could alternatively be a female T. m. macleayii (https://ebird.org/checklist/S18998436).
We have provided a first insight into how genetic diversity is structured within the Forest Kingfisher across most of its range. We have highlighted the need for its populations to be included in phylogenetic analyses of all Todiramphus kingfishers to better understand how many species should be recognised. Also warranting study are island populations still unsampled for genetic diversity. We have shown how useful DNA sequence data can be in assessing seasonal overlap of migratory and non-migratory populations and the occurrence of the species on islands in the Indo-West Pacific would benefit from this. Similarly, modern analyses of plumage colour in visible and ultraviolet wavelengths and based on all museum specimens worldwide would be of interest.
Data availability of statement
No proprietary data are associated with this paper. Data are available at figshare (doi:10.6084/m9.figshare.20407503).
Supplemental Material
Download MS Word (468 KB)Acknowledgements
We thank Julian Teh for preparing , Christopher Wilson (ANWC) for help with tissue subsampling and editors and reviewers for extremely helpful comments.
Disclosure statement
No potential conflict of interest was reported by the author(s).
Supplementary material
Supplemental data for this article can be accessed at https://doi.org/10.1080/01584197.2022.2122508
References
- Beehler, B. M., and Pratt, T. K. (2016). ‘Birds of New Guinea: Distribution, Taxonomy, and Systematics.’ (Princeton University Press: Princeton, NJ.)
- Bell, H. L. (1981). Information on New Guinean kingfishers, Alcedinidae. Ibis 123, 51–61. doi:10.1111/j.1474-919X.1981.tb00172.x
- Clements, J. F., Schulenberg, T. S., Iliff, M. J., Billerman, S. M., Fredericks, T. A., Gerbracht, J. A., Lepage, B. L., et al. (2019). ‘The eBird/Clements checklist of birds of the world: V2021.’ Available at https://www.birds.cornell.edu/clementschecklist/download/
- Coates, B. J. (1985). ‘The Birds of Papua New Guinea. I. Non-Passerines.’ (Dove Publications: Alderley.)
- Coates, B. J., and Bishop, K. D. (1997). ‘A Guide to the Birds of Wallacea. Sulawesi, the Moluccas and Lesser Sunda Islands, Indonesia.’ (Dove Publications: Alderley.)
- Del Hoyo, J., and Collar, N. (2014). ‘HBW and BirdLife Illustrated Checklist of the Birds of the World Volume 1. Non-Passerines.’ (Lynx Edicions: Barcelona.)
- Dickinson, E. C., and Remsen, J. V. (Eds.) (2013). ‘The Howard and Moore Complete Checklist of the Birds of the World. Vol. 1’. 4th edn. (Aves Press: Eastbourne).
- Evanno, G., Regnaut, S., and Goudet, J. (2005). Detecting the number of clusters of individuals using the software STRUCTURE: A simulation study. Molecular Ecology 14, 2611–2620. doi:10.1111/j.1365-294X.2005.02553.x
- Ford, J. (1978). Geographical isolation and morphological and habitat differentiation between birds of the Kimberley and the Northern Territory. Emu 78, 25–35. doi:10.1071/MU9780025
- Georges, A., Gruber, B., Pauly, G. B., White, D., Adams, M., Young, M. J., and Unmack, P. J. (2018). Genome wide SNP markers breathe new life into phylogeography and species delimitation for the problematic short-necked turtles (Chelidae: Emydura) of eastern Australia. Molecular Ecology 27, 5195–5213. doi:10.1111/mec.14925
- Gill, F., Donsker, D., and Rasmussen, P. (Eds.) (2022). ‘IOC World Bird List (v12.1).’ doi:10.14344/IOC.ML.12.1
- Gregory, P. (2017). ‘Birds of New Guinea Including Bismarck Archipelago and Bougainville.’ (Lynx Edicions: Barcelona.)
- Gruber, B., Unmack, P. J., Berry, O. F., and Georges, A. (2018). dartR: An R package to facilitate analysis of SNP data generated from reduced representation genome sequencing. Molecular Ecology Resources 18, 691–699. doi:10.1111/1755-0998.12745
- Higgins, P. (1999). ‘Handbook of Australian, New Zealand and Antarctic Birds. Volume 4: Parrots to Dollarbird.’ (Oxford University Press: Melbourne.)
- Jakobsson, M., and Rosenberg, N. A. (2007). CLUMPP: A cluster matching and permutation program for dealing with label switching and multimodality in analysis of population structure. Bioinformatics 23, 1801–1806. doi:10.1093/bioinformatics/btm233
- Johnstone, R. E., and Storr, G. M. (1998). ‘Handbook of Western Australian Birds. Volume 1. Non-Passerines (Emu to Dollarbird).’ (Western Australian Museum: Perth.)
- Joseph, L., Campbell, C. D., Drew, L., Brady, S. S., Nyari, A., and Andersen, M. J. (2021). How far east can a Western Whistler go? Genomic data reveal large eastward range extension, taxonomic and nomenclatural change, and reassessment of conservation needs. Emu Austral Ornithology 121, 90–101. doi:10.1080/01584197.2020.1854047
- Joseph, L., Campbell, C. D., Pedler, L., and Drew, A. (2019a [appeared 2021]). Genomic data show little geographical structure across the naturally fragmented range of the Purple-gaped Honeyeater. Australian Journal of Zoology 67, 226–230. doi:10.1071/ZO20074
- Joseph, L., Dolman, G., Jonsson, K., Iova, B., Campbell, C. D., Mason, I., and Drew, A. (2019b). Aberrantly plumaged orioles from the Trans-Fly savannas of New Guinea and their ecological and evolutionary significance. Emu Austral Ornithology 119, 264–273. doi:10.1080/01584197.2019.1605831
- Keast, J. A. (1957). Variation in the Australian Kingfishers (Aves: Alcedinidae). Records of the Australian Museum 24, 61–72. doi:10.3853/j.0067-1975.24.1957.645
- Mayr, E. (1937). Birds collected during the Whitney South Sea expedition. 35. Notes on New Guinea birds. 2. American Museum Novitates 939, 1–14.
- Mayr, E. (1941). The origin and the history of the bird fauna of Polynesia. Proceedings of the VI Pacific Scientific Congress 4, 197–216.
- Mees, G. F. (1982). Birds from the lowlands of southern New Guinea (Merauke and Koembe). Zoologische Verhandelingen 191, 1–188.
- Miller, S. A., Dykes, D. D., and Polesky, H. F. (1988). A simple salting out procedure for extracting DNA from human nucleated cells. Nucleic Acids Research 16, 1215. doi:10.1093/nar/16.3.1215
- Pembleton, L. W., Cogan, N. O. I., and Forster, J. W. (2013). StAMPP: An R package for calculation of genetic differentiation and structure of mixed-ploidy level populations. Molecular Ecology Resources 13, 946–952. doi:10.1111/1755-0998.12129
- Pritchard, J. K., Stephens, M., and Donnelly, P. (2000). Inference of population structure using multilocus genotype data. Genetics 155, 945–959. doi:10.1093/genetics/155.2.945
- Roux, C., Fraïsse, C., Romiguier, J., Anciaux, Y., Galtier, N., Bierne, N., and Moritz, C. (2016). Shedding light on the grey zone of speciation along a continuum of genomic divergence. PLoS Biology 14, e2000234. doi:10.1371/journal.pbio.2000234
- Schodde, R. (1997). Alcedinidae. In ‘Zoological Catalogue of Australia 37.2 Aves (Columbidae to Cracidae)’. (Eds W. W. K. Houston and A. Wells.) pp. 346–376. (CSIRO Publishing: Melbourne.)
- Schodde, R., and Hitchcock, W. B. (1968). Contributions to Papuasian ornithology. I. Report on the birds of the Lake Kutubu Area, Territory of Papua and New Guinea. Division of Wildlife Research Technical Paper Number 13. Commonwealth Scientific and Industrial Research Organization, Canberra.
- Tubb, J. A. (1945). Field notes on some New Guinea birds. Emu Austral Ornithology 44, 249–273. doi:10.1071/MU944249
- Wells, S. J., and Dale, J. (2018). Contrasting gene flow at different spatial scales revealed by genotyping-by-sequencing in Isocladus armatus, a massively colour polymorphic New Zealand marine isopod. Peer Journal 6, e5462. doi:10.7717/peerj.5462
- Woodall, P. F., and Kirwan, G. M. (2020). Forest Kingfisher (Todiramphus macleayii). In ‘Birds of the World Version 1.0’. (Eds J. Del Hoyo, A. Elliott, J. Sargatal, D. A. Christie, and E. de Juana.) (Cornell Lab of Ornithology: Ithaca, NY.) doi:10.2173/bow.forkin1.01