
ABSTRACT
In northern New Zealand, there is speculation that predation by a recovering shorebird, the South Island Pied Oystercatcher (Haematopus finschi), has caused the continuing decline of an endemic surf clam, the toheroa (Paphies ventricosa). Consequently, there have been requests by the public for these protected birds to be culled to protect and restore the toheroa. To better inform management and decision-making for these species we set out to understand the impact of oystercatcher predation on toheroa at Ripiro Beach in New Zealand. A study was conducted to establish the spatio-temporal overlap of toheroa and oystercatcher distributions, determine oystercatcher prey selection, and assess the impacts of oystercatcher predation on toheroa population size structure. Monthly surveys over a 12-month period indicated limited spatial overlap between the two species, and that most toheroa beds on Ripiro Beach are not subjected to oystercatcher predation. In areas where oystercatchers and toheroa co-occurred, oystercatchers consumed a variety of prey including polychaetes, small and medium-sized toheroa and a non-threatened surf clam (P. subtriangulata). While oystercatchers do feed on toheroa (and may be capable of locally reducing abundance of small toheroa in a population), feeding on larger individuals (>50 mm in length) was not observed. These results suggest that culling of oystercatchers would be of no benefit for the recovery of toheroa populations. It is likely that less obvious factors are impeding the recovery of toheroa in New Zealand. This study highlights the importance of understanding predator-prey interactions before implementing management actions such as lethal control.
Introduction
One of the greatest conservation challenges of our time is simultaneously managing the recovery of interacting species and their environment through an ecosystem-based management approach (Lee et al. Citation2016). Ecosystem-based management aims to conserve interactions and to identify the needs and objectives of different species within an ecosystem (Williams et al. Citation2011). However, protecting multiple species in an ecosystem is complicated as the actions taken to protect one species may conflict with the actions necessary to protect another. These actions can lead to conservation conflicts, for instance, between protected predator species and their protected prey (Marshall et al. Citation2016).
At Ripiro Beach (Ripiro Waka te Haua), on the west coast of the North Island in northern New Zealand (Aotearoa), there is a perceived conservation conflict between a protected endemic shorebird, the South Island Pied Oystercatcher/tōrea (Haematopus finschi), and a protected endemic surf clam, the toheroa (Paphies ventricosa) (Dickey Citation2014; RadioNZ Citation2014; Barrington Citation2014a, Citation2014b). Prior to European colonisation, toheroa were an important food source and species of cultural significance for Māori living near toheroa beaches (Ross et al. Citation2018; Pewhairangi Trego-Hall et al. Citation2020). By the end of the 1800s, Pākehā (New Zealanders of European descent) had recognised toheroa as a valuable food commodity. Commercial canneries opened in the early 1900s and clam harvesting also became a popular recreational activity (Murton Citation2006). After decades of unsustainable and largely unregulated harvest, toheroa populations eventually collapsed. Commercial and recreational harvesting became increasingly regulated during the mid-1900s and by 1980 all harvesting was completely prohibited (Akroyd et al. Citation2002; Murton Citation2006; Ross et al. Citation2018). Despite having now been protected for more than four decades, toheroa populations have failed to recover (Millar and Olsen Citation1995; Ross et al. Citation2018).
The absence of any real understanding or official explanation for the continued demise of toheroa has led to speculation among people living near these toheroa beaches as to the mechanisms preventing the recovery of this taonga (treasured) shellfish. At Ripiro, the beach with the largest remaining toheroa population in northern New Zealand, one explanation that has received considerable public attention is that predation by the South Island Pied Oystercatcher (hereafter referred to as oystercatcher) is preventing the recovery of toheroa. The oystercatcher is a natural predator of a variety of bivalve species and has been observed eating both toheroa and the closely related tuatua (Paphies subtriangulata) on Ripiro Beach (Baker Citation1973; Brunton Citation1976; Vallyon Citation2020). As such, there are now regular requests by the public for these protected birds to be culled (and even reports that oystercatchers have been illegally shot) to protect and restore the toheroa populations (Dickey Citation2014; RadioNZ Citation2014; Barrington Citation2014a, Citation2014b). This is a textbook example of a conservation conflict where the public is calling for the killing of one threatened endemic species to facilitate recovery of another. While it is certain that oystercatchers do feed on toheroa at Ripiro and elsewhere (Brunton Citation1976; Vallyon Citation2020), there is no evidence linking oystercatcher predation to the decline of toheroa and the extent to which they impact toheroa populations is unknown. For these protected predators and protected prey to be managed effectively, or if conservation managers are to evaluate the suitability of lethal control as a management option, it is first crucial to know if the oystercatchers impact toheroa populations at Ripiro Beach and to what degree. Essentially, the predator-prey dynamics of these two species should be understood before any management actions are taken (Bowen and Lidgard Citation2013).
To facilitate knowledge-based conservation management of the two species, a study was conducted to better understand their interactions and predator-prey dynamics. Specifically, we set out to determine (i) the overlap in the distribution of oystercatchers and toheroa, (ii) the prey selection of the oystercatchers; preferred species, size and depth of prey; (iii) the impact of oystercatcher predation on the size structure of toheroa populations (Table S1).
Methods
Study species
Predator: South Island Pied Oystercatchers (Haematopus finschi)
The South Island Pied Oystercatcher is an endemic New Zealand shorebird that has been protected since 1940 (Baker Citation1973). The birds gather in large flocks (>5000) in bays, estuaries and harbours in northern coastal areas of the North Island (Te Ika-a-Māui) during the nonbreeding season, with some oystercatchers travelling daily to the open coast to forage (Baker Citation1973). The oystercatchers are natural predators to animals living in the littoral zones such as crustaceans, bivalves, gastropods, limpets, polychaetes and chitons. They use prey-specific methods to exploit different types of prey and are behaviourally and morphologically adapted to feed on coastal and estuarine bivalves (Baker Citation1974).
When foraging for bivalves, oystercatchers search for their prey either visually by tell-tale siphon holes on the beach surface or tactically with their bills by ‘pecking’ the sand. Upon location of prey, oystercatchers will attempt to capture prey by probing deeply into the sediment with their bills (Hulscher Citation1996; Bachmann and Martínez Citation1999; Vallyon Citation2020). As the birds have a maximum bill length of 90 mm, the ability of an oystercatcher to successfully harvest bivalve prey is largely governed by the size and burial depth of the shellfish (larger bivalves are capable of burying deeper and can therefore be out of reach of a bird bill; Hulscher Citation1982; Leopold et al. Citation1989; Zwarts and Wanink Citation1993). Nevertheless, the birds are adept predators and can consume the flesh of bivalves without needing to excavate their shells from the sediment (Vallyon Citation2020; Video S1).
The oystercatchers on Ripiro Beach have been observed consuming bivalves by inserting their bills between the shell valves at the posterior end of the shell at the point where the siphon protrude. They then proceed to perform a scissoring-like motion with their bill while pivoting around the bivalve, cutting the flesh from the valves of the clam, before pulling the flesh from the shell and then ingesting it (see section below for behavioural observation methods conducted for this project; Vallyon Citation2020; Video S1).
Prey: Toheroa (Paphies ventricosa)
Toheroa are found on high energy surf beaches around the country, mainly on west coast beaches in the North Island including Te-Oneroa-a-Tōhē (90 Mile Beach), Ripiro, Muriwai, along the Kāpiti-Horowhenua coast, and in the southern South Island at Oreti and Blue cliffs beaches (in Te Waewae Bay) (Beentjes et al. Citation2006; Ross et al. Citation2018). Toheroa aggregate to form distinct beds, with the major beds typically associated with small, shallow streams or freshwater seeps that flow onto the beach. Post-settlement juveniles can be found between high and low tide marks, while adult beds of mixed size classes are generally situated in the mid-intertidal (Redfearn Citation1974; Cope Citation2018). Toheroa, which are the largest clams in New Zealand, can reach lengths of up to 180 mm (average 110 mm) in southern New Zealand, but in the North Island they rarely exceed 100 mm (average 80 mm) in length (Bennion et al. Citation2022a). Like other surf clams, toheroa are an infaunal species, and can bury themselves in the sand to depths of up to 30 cm where they extend their long siphons to the surface to filter feed on microalgae and excrete waste (Redfearn Citation1974; Powell Citation1979; Beentjes et al. Citation2006).
Prey: Tuatua (Paphies subtriangulata)
Tuatua are a relatively common species of surf clam in New Zealand and can be found in abundant populations around the country on surf beaches with moderate wave exposure. The shellfish do exist alongside toheroa on some beaches, mainly in the north of the North Island, such as on Ripiro Beach (Powell Citation1979; Williams et al. Citation2013a). Like their close relative the toheroa, juvenile tuatua often settle in the higher intertidal zone with their position moving further down the shore as they become larger in size. Contrary to toheroa, however, dense adult tuatua beds are more often found between the lower intertidal zone and the shallow subtidal zone (Williams et al. Citation2013a). The tuatua are also an infaunal species but usually burrow only a few centimetres into the sediment and can reach up to 76 mm in length (Powell Citation1979; Richardson et al. Citation1982).
Data collection
The distribution of oystercatchers and toheroa
The distribution of toheroa on Ripiro Beach is relatively well known, owing to semi-regular fisheries stock assessments (Redfearn Citation1974; Akroyd et al. Citation2008; Williams et al. Citation2013a) and ongoing research (Greenway Citation1969; Akroyd et al. Citation2002; Cope Citation2018; Ross et al. Citation2018; Bennion et al. Citation2022a; Bennion et al. Citation2022b). In contrast, the distribution of oystercatchers has received little scientific attention, other than a 1970s study in which Brunton (Citation1976) recorded oystercatchers on Ripiro Beach to the south of the areas presently occupied by adult toheroa beds. To determine the present-day spatio-temporal overlap in the distribution of toheroa and oystercatchers, monthly bird surveys were conducted at Ripiro Beach across 12 months from March 2019 to February 2020 (Table S1).
The surveys were conducted from a four-wheel drive vehicle driven between Omamari and the south-western end of the Pouto Peninsula (hereafter referred to as Pouto) and covered 62 km of Ripiro Beach (total length c. 82 km; Figure S1). When oystercatchers were sighted, the vehicle would stop, while observers identified and counted the birds (with the aid of binoculars where necessary) and recorded their location using a Garmin GPSMAP 64s. Where multiple birds were present, counts were conducted from left to right (field of view). Flocks of oystercatchers were allocated a single GPS position and were defined as ‘a group of oystercatchers foraging together with or without the presence of another shorebird species where all the nearest neighbour distances were within 100 m’ (Yasué Citation2005). Each monthly survey event consisted of between one and three individual surveys. The number of surveys per month varied with the time available on site and tidal and weather conditions. In the study region, daytime neap low tides tend to fall in the middle of the day, whereas spring low tides fall in the early morning and late afternoon, separated by a high tide. To maximise the amount of time that the beach could be traversed by car, surveys were always conducted during neap tides. Therefore, the lowest-elevation parts of the beach exposed only on spring low tides were not surveyed. As such, it is possible that oystercatcher presence, distribution and foraging behaviour could differ during such spring tides.
Oystercatcher prey selection
An observational study of oystercatcher foraging behaviour was conducted to gain a better understanding of the diet of oystercatchers at Ripiro Beach. Observations were made during neap tides in May (four days), June (two days) and July (three days) 2019 (Table S1). Behavioural data were collected on randomly selected focal individuals (Altmann Citation1974) from different flocks located along the beach on any given sampling day. In July, observations took place solely at the Third Stream toheroa bed where oystercatchers were observed and filmed for approximately 16 hours over a two-day period. Observations were made either from a vehicle, a vantage point in the adjacent sand dunes, or from a position on the beach far enough from the birds to not disturb them (~50 m). Oystercatcher activity (including feeding events) was recorded using a Nikon COOLPIX P1000 camera and video analyses subsequently conducted using Solomon Coder (an open-source behavioural coding programme; version: beta 17.03.22). A total of 7.5 hours of video footage were captured from observations of 71 individual oystercatchers. Where feeding events were observed, prey items were recorded and categorised as either polychaete, bivalve or unidentified.
To investigate the bivalve component of the oystercatcher diet, the feeding holes (Photo S1) made by the birds were excavated to determine prey selectivity, specifically: (a) bivalve species (toheroa or tuatua) (b) prey size (length in mm) and (c) the influence of bivalve size and burrowing depth on predation success. Feeding holes were excavated at five sites between Glink’s Gully and Pouto (predation analysis sites; Figure S1; Table S1). Sites were chosen where oystercatchers were observed either consuming shellfish or probing the beach with their bills in what appeared to be an attempt to capture shellfish. Between 30 and 55 predation holes were excavated at each site, with the number of holes examined determined by the number of holes present at a site and the time available for sampling (determined by tidal state; ). Hole sampling included recording the presence/absence of a clam, measuring the burial depth of the bivalve (beach surface to the upper edge of clam shell; Zwarts and Wanink Citation1993) and then excavating the hole to identify the clam species targeted by the oystercatcher (either toheroa or tuatua) and the length and status (alive or consumed) of each targeted clam. Feeding hole excavations were conducted over four days, two days in June 2019 and two days in August 2019 (Table S1). As toheroa are protected, handling and excavation of toheroa for this study was carried out under Special Permit no. 706–2.
Table 1. Species, burrowing depth and shell length of bivalves consumed by oystercatchers compared to the total excavated (all available) bivalves at the same site. Data obtained from feeding hole excavations in June and August 2019. Standard error is used where there is the mean.
Impact of oystercatchers on toheroa population structure
It was not possible (because of the time and resources available for this project) to conduct a full population survey of toheroa beds across Ripiro Beach for the purpose of investigating the impact of oystercatcher predation on toheroa abundance and size structure. Instead, sampling was conducted at four sites, two sites where oystercatcher predation was observed (First Stream and Third Stream) and two sites north of the observed oystercatcher distribution (Kopawai and Mahuta Gap; Figure S1; Table S1) over three days in September 2019 to determine whether predation influenced the population structure of toheroa beds through size-dependent mortality. At each site, 10 0.25 m2 quadrats were randomly positioned on the toheroa bed (evident by the siphon holes on the surface of the sediment created by the toheroa for feeding and waste excretion) and all toheroa within each quadrat were excavated, measured along the longest axis, and then reburied. Quadrats were excavated by hand as using spades or trowels would have resulted in unacceptable toheroa mortality.
Data analysis
All data were tested for normality and homogeneity of variances and where these assumptions were violated, transformation of the data was attempted. If test assumptions were still not met following transformation, non-parametric statistics were applied. All statistical analyses were performed in Statistica (V. 13) or R (V. 1.0.153), and figures and tables were made using RStudio (R Core Team Citation2019) or Microsoft Excel. The accepted level of significance for all statistical tests was p ≤ 0.05. Results are presented as means ± S.E.
The distribution of oystercatchers and toheroa
To visualise the spatio-temporal associations of oystercatchers and toheroa on Ripiro Beach, a bubble plot was generated in RStudio using the package ‘ggplot2’ (Wickham Citation2016).
Oystercatcher prey selection
At site P1, 90% of probe holes did not have a shell in or nearby and at the P2 and P3 sites all prey items were smaller than 15 mm and were not identified to species level. Therefore, these sites were excluded from further statistical analysis. However, statistical analyses were conducted on pooled First Stream and Third Stream predation site data as these were the locations of greatest interest due to being major toheroa beds (Figure S1).
To visualise the influence of prey size and depth on oystercatcher predation success, a combination of scatter plot and density plots were generated. The packages ‘ggplot2’ (Wickham Citation2016) and ‘ggridges’ (Wilke Citation2021) in RStudio were used to produce the figures. A Wilcoxon Rank Sum test was used to assess if burrowing depth (mm) influenced status (alive vs. consumed) of bivalves excavated from predation holes at First Stream and Third Stream. A second Wilcoxon Rank Sum test was used to assess if size (length in mm) influenced status (alive vs. consumed) of excavated bivalves.
Impact of oystercatchers on toheroa population structure
Toheroa population size-frequency plots were generated for each site (Mahuta Gap, Kopawai, First Stream and Third Stream; Figure S1) and Mann-Whitney U tests were used to test for differences between sites in the median lengths.
Results
The distribution of oystercatchers and toheroa
Oystercatcher abundance on Ripiro Beach varied in time and space. Their abundance peaked in March 2019 (322 in a single survey) then steadily declined through to December, when no oystercatchers were recorded on the beach (; ). When present, oystercatchers were predominantly observed in the southern half of Ripiro Beach (south of Glink’s Gully; ). Oystercatchers exhibited site fidelity and were most often recorded at First Stream and Third Stream (the southernmost major toheroa beds) and an area 6 km from Pouto (the southern boundary of the sampling area). The maximum number of oystercatchers recorded at the toheroa beds at First Stream and Third Stream at any one time was 17 and 30, respectively. Oystercatchers were only observed north of the First Stream in May (n = 5) and October (n = 1) ().
Figure 1. The spatio-temporal overlap of toheroa and oystercatchers from March 2019 to February 2020 with counts taken from the first survey of each month (with the addition of points from May and October displaying oystercatchers that were observed north of First Stream). Orange circles (top row) represent location of toheroa beds along Ripiro Beach. Grey/black circles represent number of oystercatchers at each location along the beach. Bubble plot of oystercatcher survey data produced in RStudio using the package ‘ggplot2’ (Wickham Citation2016).
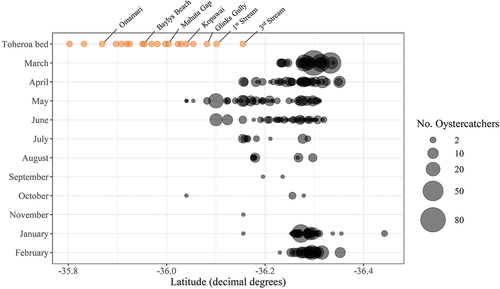
Table 2. Average count of oystercatchers on Ripiro Beach for each month that bird surveys were conducted.
Oystercatcher prey selection
Overall, 239 prey items were consumed by the 71 oystercatchers that were filmed. The prey items included 135 bivalves (56%), 59 polychaetes (25%) and 45 unidentifiable items (19%). At Third Stream, where observations were made for two consecutive days in July 2019, oystercatchers arrived at the stream (possibly from Kellys Bay, a roosting site in the Kaipara Harbour) approximately an hour after sunrise. Most birds rested or preened on arrival before beginning to forage roughly an hour later. Oystercatchers engaged in intense foraging sessions that typically last around an hour before switching to other activities, such as resting or preening. The oystercatchers engaged in three to four bouts of intensive foraging throughout an observation day.
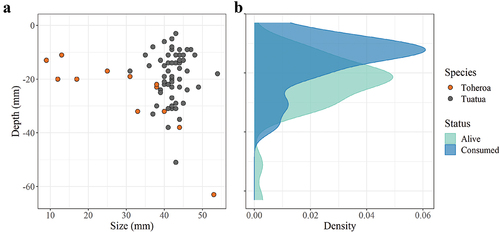
A total of 216 oystercatcher probe holes across all the predation sites were excavated to examine the oystercatchers’ selectivity (species, size and depth) of bivalve prey (). Of these, 167 probe holes contained clams (). The bivalves that were excavated from these predation holes, ranged in size from 9 mm to 54 mm. Consumption of specific prey size classes appeared, to some extent, to differ between feeding locations. At sites P2 and P3, oystercatchers were predominantly feeding on clams smaller than 15 mm (54% of clams excavated across all sites; ). Due to the small size, it was only possible to identify these bivalves to genus level (Paphies) (). Tuatua (37% of all clams excavated) was identified only at First Stream and Third Stream (Figure S1; ). Toheroa (8% of all clams excavated) were also mainly identified at First Stream and Third Stream, except for two found in P1 (Figure S1; ).
At the toheroa beds First Stream and Third Stream, 51% of bivalves excavated from predation holes were recorded as consumed (either completely or partially removed from their shells). Six (16%) of the consumed bivalves were toheroa and 31 (84%) were tuatua. In general, oystercatchers appeared to be targeting (or detecting) bivalves that were relatively shallow, regardless of size. Many of the tuatua that were excavated at these streams were buried shallow (10–30 mm beneath the surface) and were of an intermediate size-class (40–50 mm in length; ). Toheroa burial depth, on the other hand, appeared to be a function of size (Redfearn Citation1974; ). The mean burial depth of alive bivalves (24.1 ± 1.8 mm) was significantly deeper than the burial depth of consumed bivalves (16.2 ± 1.5 mm; W = 1001, p < 0.001) (). The mean length of alive bivalves (41 ± 1.1 mm) did not differ significantly from that of consumed bivalves (39.2 ± 1.5 mm; W = 671.5, p = 0.96).
Figure 2. The relationship between size and burial depth of bivalve species (toheroa and tuatua) found in oystercatcher predation holes (a) and the influence of bivalve burial depth on oystercatcher predation success (b). From predation hole excavation data collected at First Stream and Third Stream in June and August 2019. Plots produced in RStudio using the package ‘ggplot2’ (Wickham Citation2016).
Impact of oystercatchers on toheroa population structure
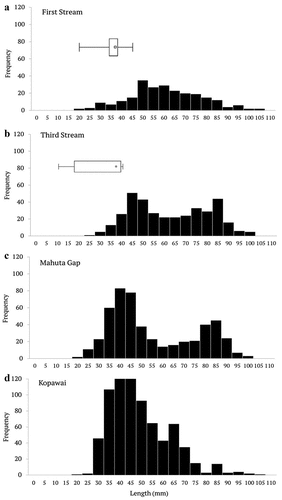
Toheroa population structure was not uniform across the four beds surveyed. Two modes were evident in the length-frequency distributions of toheroa at Third Stream and Mahuta Gap (40–50 mm and 80–85 mm in length; ). In contrast, the First Stream and Kopawai beds appeared to consist of a single cohort. There was a peak in frequency at lengths of 40 to 50 mm at Kopawai, and a broader peak at lengths of 50 to 60 mm at First Stream. At the two sites north of the recorded oystercatcher distribution (Mahuta Gap and Kopawai), toheroa in the 30 to 45 mm size class were most abundant, making up 49% of the sampled population. In comparison, at First Stream and Third Stream, where oystercatchers were frequently observed, this size class made up only 21% of the population (; Table S1). The median length of toheroa at beds subjected to oystercatcher predation was significantly larger than at beds where oystercatchers were not recorded (Z-adj = 12.43, p < 0.01). The mean length at predation sites (First Stream and Third Stream) was 59.8 ± 0.7 mm compared to 49.6 ± 0.5 mm at Mahuta Gap and Kopawai.
Figure 3. Size frequency distributions of toheroa in beds at First Stream and Third Stream (oystercatcher foraging sites), and at Mahuta Gap and Kopawai (no oystercatcher foraging). Superimposed are box-and-whiskers that display size range and median length of dead prey (toheroa and tuatua) excavated at First Stream and Third Stream (from the oystercatcher feeding hole excavation data); see oystercatcher prey selection.
Discussion
The New Zealand public can be passionate about toheroa, and there is considerable interest in facilitating their recovery. Because environmental managers and researchers have so far failed to provide an explanation and solution for the continued decline of this taonga (treasured) species, some members of the public living near the toheroa beaches have reached their own conclusion, identifying oystercatchers as the primary factor preventing toheroa recovery. However, the results of this study do not support their conclusions or the proposed course of action – the culling of the oystercatchers.
Our investigations into the spatio-temporal distribution patterns of oystercatchers and toheroa have found limited overlap between the two species. Oystercatchers were concentrated towards the southern half of the beach (as also observed by Brunton Citation1976), closest to their roosting sites in the Kaipara Harbour whereas most of the toheroa beds were found to the north of the observed oystercatcher distribution. While it was beyond the scope of the current study to conduct a full toheroa survey across the length of Ripiro Beach, recent surveys (1999, 2006 and 2011) have regularly recorded that most beds with medium to high densities of toheroa are in the central and northernmost areas of the beach (Akroyd et al. Citation2002, Citation2008; Williams et al. Citation2013a). These do not appear to be areas regularly used by oystercatchers foraging (although locals have reported that foraging in these more northern areas does occur).
During this study, oystercatchers were observed foraging at only two of the major toheroa beds (First Stream and Third Stream), and only from January to June. During their breeding season (July to December), oystercatchers were increasingly scarce and were observed across less of the beach. These findings clearly indicate that intense oystercatcher predation could only be occurring for approximately six months of each year. It is possible that the oystercatcher predation occurring over these months is sufficient to significantly modify the abundance or size distribution of toheroa at First Stream and Third Stream. However, it is important to note that despite this sustained predation, the First Stream and Third Stream toheroa beds have persisted over time and are still present today.
Our study of oystercatcher foraging behaviour and prey selection confirms that bivalves (including toheroa) are a significant food resource for oystercatchers foraging on Ripiro Beach (over half of recorded prey items). This is not unexpected, as bivalves are recognised to be the predominant prey of most oystercatcher species worldwide (Hulscher Citation1996). Our findings also indicate that the prey consumed by oystercatchers varies by location. When feeding at toheroa beds, oystercatchers consumed medium-sized toheroa and tuatua, in addition to the post-settlement juveniles and polychaetes consumed while feeding away from those adult beds. While these sub-adult toheroa appear to be a significant component of the oystercatchers’ diet at Ripiro – given the magnitude of toheroa recruitment observed on the west coast of northern New Zealand – this predation is unlikely to represent a significant bottleneck in toheroa life history (Ross Citation2020).
When the oystercatchers were foraging on known toheroa beds at First Stream and Third Stream (Figure S1), most prey were intermediate-sized (30–50 mm) tuatua that were buried a few centimetres beneath the surface of the substrate. These beds contain larger toheroa (up to ~100 mm) which were not observed being consumed by the oystercatchers. Whilst foraging, oystercatchers have a range of different prey sizes to choose from that offer diverse energetic outcomes and handling efforts (Leopold et al. Citation1989). To make the most profitable choice, an oystercatcher should choose a specific size of bivalve that returns the most energy for the least amount of time handling. Zwarts and Wanink (Citation1991) state that only a small fraction of prey in any given area is harvestable (defined as profitable and available) to a shorebird. Many profitable prey are inaccessible, while those that are accessible are often ignored due to their low profitability. As toheroa are typically buried deeper than tuatua, it seems likely that the tuatua are the most profitable choice of bivalve prey for the oystercatchers on Ripiro Beach, as reflected by the higher representation of tuatua excavated as prey items in the oystercatcher prey selection study (). It is also possible that the large, more profitable toheroa were buried beyond reach of the oystercatchers’ bill. Consequently, the significantly different size structure of the toheroa populations recorded at toheroa beds subjected to oystercatcher predation (First Stream and Third Stream) versus Kopawai and Mahuta Gap (Figure S1; Table S1) may indicate that only toheroa sized between 30 and 50 mm are ‘harvestable’ to the oystercatchers. As such, preference for a particular bivalve size class by the oystercatchers may have significant outcomes for the prey species by altering the size structure, density and abundance of those bivalve populations (Levings et al. Citation1986; Goss-Custard et al. Citation2001).
Given the relatively small numbers of oystercatchers we observed on Ripiro Beach throughout the year and the very limited overlap in distributions between oystercatchers and toheroa, it appears implausible that oystercatcher predation is a significant contributor to the decline of toheroa across Ripiro Beach. There is a possibility that the oystercatchers may be having a small, localised impact at First Stream and Third Stream, but these data would suggest they are not responsible for the decline of toheroa across Ripiro Beach. Consequently, it is considered improbable that the culling of oystercatchers would contribute to the recovery of toheroa populations. There is insufficient information available to assess the ecological consequences or conservation benefits of lethal control of the oystercatchers on Ripiro Beach. Instead, further research should be focused on identifying other factors, which may be inhibiting the recovery of the toheroa. Toheroa were formerly abundant on the beach south of Third Stream in the areas where oystercatchers were most abundant during this study. This includes the section of beach where concessions were issued for the commercial fishery, which closed in 1969 (Redfearn Citation1974). It has been argued that as these historic toheroa beds overlapped with the distribution of oystercatchers, it might be that oystercatcher predation can explain their disappearance. However, a more likely explanation is that the streams that have historically provided adult toheroa habitat have disappeared due to changing land use, including the planting of exotic pine (Pinus radiata) plantations (Williams et al. Citation2013b). It appears that regardless of oystercatcher presence and predation, this part of Ripiro Beach is no longer able to support adult toheroa beds.
In a rapidly changing world where numerous species are concurrently in decline, the government agencies responsible for environmental management are tasked with decision-making, often in the absence of sound ecological knowledge. Protecting multiple interacting species within an ecosystem-based management framework is complicated. Without an understanding of the dynamics of predator-prey relationships, culling (in addition to being an animal welfare and ethics issue) as a management response to a perceived conservation conflict is likely to be unsuccessful, as illustrated here by the case of the South Island Pied Oystercatcher and the protected surf clam, the toheroa.
Geolocation information
The study area covered the following extent: 35°54–36°21S, 173°41 - 174°01E.
Footage of a South Island Pied Oystercatcher extracting the flesh of a bivalve prey item in situ.
Download MP4 Video (239 MB)Supplemental Material
Download MS Word (15.5 KB)Example of an oystercatcher predation hole that was excavated to determine oystercatcher prey selectivity.
Download JPEG Image (3.9 MB)
Supplemental Material
Download JPEG Image (405 KB)
Summary of the studies conducted within this research project with corresponding data collection methods and key findings.
Download MS Word (15.8 KB)Acknowledgments
The authors would like to acknowledge the Te Roroa Iwi for their support in conducting this study and other toheroa-related research projects. We thank Taoho Patuawa and the Douglas family for their hospitality at Ripiro Beach, Barry Searle for sharing his local ecological knowledge, Jacinta Forde, Vanessa Taikato, Rebecca Gibson, Lauren Bartram and family, Matt Finnigan and Ludwik Rynkowski for their assistance with fieldwork and Cheryl Ward and Catherine Vallyon for their help with assembling and proofreading this manuscript. We thank the anonymous reviewers whose insightful comments improved the quality of our manuscript.
Disclosure statement
No potential conflict of interest was reported by the author(s).
Supplementary material
Supplemental data for this article can be accessed at https://doi.org/10.1080/01584197.2023.2174882.
Additional information
Funding
References
- Akroyd, J., Anne, M., Walshe, K. A. R., and Millar, R. B. (2002). Abundance, distribution, and size structure of toheroa (Paphies ventricosa) at Ripiro Beach, Dargaville, Northland, New Zealand. New Zealand Journal of Marine and Freshwater Research 36(3), 547–553. doi:10.1080/00288330.2002.9517110
- Akroyd, J., Walshe, K., Manly, B., Te Tuhi, J., Searle, B., and Searle, R. (2008). Distribution and abundance of toheroa (Paphies ventricosa) on Dargaville and Muriwai Beaches, 2006–07. Assessment Report 2008/29. New Zealand Fisheries, Wellington, New Zealand.
- Altmann, J. (1974). Observational study of behavior: Sampling methods. Behaviour 49(3–4), 227–266. doi:10.1163/156853974X00534
- Bachmann, S., and Martínez, M. M. (1999). Feeding tactics of the American oystercatcher (Haematopus palliatus) on Mar Chiquita coastal lagoon, Argentina. Ornitología Neotropical 10, 81–84.
- Baker, A. J. (1973). Distribution and numbers of New Zealand oystercatchers. Notornis 20(2), 128–144.
- Baker, A. J. (1974). Prey-specific feeding methods of New Zealand oystercatchers. Notornis 21, 219–233.
- Barrington, M. (2014a). Toheroa thieves caught on video? (New Zealand Herald). Available at https://www.nzherald.co.nz/northern-advocate/news/article.cfm?c_id=1503450&objectid=11313866
- Barrington, M. (2014b). Shell shock: Toheroa beach wipe-out in Northland. (New Zealand Herald). Available at https://www.nzherald.co.nz/northern-advocate/news/article.cfm?c_id=1503450&objectid=11258419
- Beentjes, M. P., Carbines, G. D., and Willsman, A. P. (2006). Effects of beach erosion on abundance and distribution of toheroa (Paphies ventricosa) at Bluecliffs Beach, Southland, New Zealand. New Zealand Journal of Marine and Freshwater Research 40(3), 439–453. doi:10.1080/00288330.2006.9517434
- Bennion, M., Lane, H., McDonald, I. R., and Ross, P. (2022a). Histopathology of a threatened surf clam, toheroa (Paphies ventricosa) from Aotearoa New Zealand. Journal of Invertebrate Pathology 188, 107716. doi:10.1016/j.jip.2022.107716
- Bennion, M., Ross, P. M., Lane, H. S., and McDonald, I. R. (2022b). Bacterial composition in the toheroa (Paphies ventricosa), a threatened surf clam from Aotearoa (New Zealand). Marine Biology 169(3), 1–9. doi:10.1007/s00227-022-04025-y
- Bowen, W. D., and Lidgard, D. (2013). Marine mammal culling programs: Review of effects on predator and prey populations. Mammal Review 43(3), 207–220. doi:10.1111/j.1365-2907.2012.00217.x
- Brunton, P. M. (1976). Toheroa predation by Black-backed Gulls on Dargaville Beach, North Island, New Zealand. Notornis 25(2), 128–140.
- Cope, J. (2018). The modification of toheroa habitat by streams on Ripiro Beach. MSc (Research) thesis, University of Waikato, Hamilton, NZ.
- Dickey, D. (2014). Toheroa beds under threat. (Stuff.) Available at http://www.stuff.co.nz/environment/10189751/Toheroa-beds-under-threat
- Goss-Custard, J. D., West, A., Stillman, R., Caldow, R., Caldow, R. W. G., McGrorty, S., and Nagarajan, R. (2001). Density-dependent starvation in a vertebrate without significant depletion. Journal of Animal Ecology 70(6), 955. doi:10.1046/j.0021-8790.2001.00553.x
- Greenway, J. P. C. (1969). Population surveys of toheroa (Mollusca: Eulamellffiranchiata) on Northland Beaches, 1962–67. New Zealand Journal of Marine and Freshwater Research 3(2), 318–338. doi:10.1080/00288330.1969.9515300
- Hulscher, J. B. (1982). The oystercatcher (Haematopus ostralegus) as a predator of the bivalve (Macoma balthica) in the Dutch Wadden Sea. Ardea 70(2), 89–152.
- Hulscher, J. B. (1996). Food and feeding behaviour. In ‘The Oystercatcher: From Individuals to Populations.’ (Ed. J. D. Goss-Custard.) pp. 12. (Oxford University Press Inc.: New York, NY.)
- Lee, L., Watson, J., Trebilco, R., and Salomon, A. (2016). Indirect effects and prey behavior mediate interactions between an endangered prey and recovering predator. Ecosphere 7(12), 1–26. doi:10.1002/ecs2.1604
- Leopold, M. F., Swennen, C., and De Bruijn, L. L. M. (1989). Experiments on selection of feeding site and food size in oystercatchers, Haematopus ostralegus, of different social status. Netherlands Journal of Sea Research 23(3), 333–346. doi:10.1016/0077-7579(89)90053-7
- Levings, S. C., Garrity, S. D., and Ashkenas, L. R. (1986). Feeding rates and prey selection of oystercatchers in the Pearl Islands of Panama. Biotropica 18(1), 62–71. doi:10.2307/2388364
- Marshall, K. N., Stier, A. C., Samhouri, J. F., Kelly, R. P., and Ward, E. J. (2016). Conservation challenges of predator recovery. Conservation Letters 9(1), 70–78. doi:10.1111/conl.12186
- Millar, R. B., and Olsen, D. (1995). Abundance of large toheroa (Paphies ventricosa Gray) at Oreti Beach, 1971–90, estimated from two-dimensional systematic samples. New Zealand Journal of Marine and Freshwater Research 29(1), 93–99. doi:10.1080/00288330.1995.9516643
- Murton, B. (2006). ‘Toheroa Wars’: Cultural politics and everyday resistance on a northern New Zealand beach. New Zealand Geographer 62(1), 25–38. doi:10.1111/j.1745-7939.2006.00046.x
- Pewhairangi Trego-Hall, T., Te Awhitu, L., and Mikahere-Hall, A. (2020). The politics of toheroa soup: A pūkōrero about whānau and me. Ata: Journal of Psychotherapy Aotearoa New Zealand 23(2), 113–122. doi:10.9791/ajpanz.2019.10
- Powell, A. W. B. (1979). Class Bivalvia. In ‘New Zealand Mollusca ’. Chapter 12. pp. 416. (William Collins Publishers Ltd.: Hong Kong.)
- RadioNZ. (2014). Call to cull native birds taking toheroa. (Radio New Zealand.) Available at https://www.rnz.co.nz/news/national/247317/call-to-cull-native-birds-taking-toheroa
- R Core Team. (2019). R: A language and environment for statistical computing. https://www.R-project.org/ [Verified 2 September, 2021].
- Redfearn, P. (1974). Biology and Distribution of the Toheroa, Paphies (Mesodesma) Ventricosa (Gray). pp. 1–52. (New Zealand Ministry of Agriculture and Fisheries: Wellington, New Zealand.)
- Richardson, J. R., Aldridge, A. E., and Smith, P. J. (1982). Analyses of tuatua populations — Paphies subtriangulata and P. donacina. New Zealand Journal of Zoology 9(2), 231–237. 10.1080/03014223.1982.10423851
- Ross, P. M. (2020). Assessment of impacts of mechanical spat harvesting on the surf clams of Te Oneroa-a-Tōhē. New Zealand Aquatic Environment and Biodiversity Report 250. Ministry for Primary Industries. pp. 23.
- Ross, P. M., Beentjes, M. P., Cope, J., De Lange, W. P., McFadgen, B. G., Redfearn, P., Searle, B., et al. (2018). The biology, ecology and history of toheroa (Paphies ventricosa): A review of scientific, local and customary knowledge. New Zealand Journal of Marine and Freshwater Research 52(2), 196–231. doi:10.1080/00288330.2017.1383279
- Vallyon, L. D. (2020). Birds vs. Clams: Assessing the impacts of South Island pied oystercatcher predation on Toheroa at Ripiro Beach, New Zealand. Masters thesis, The University of Waikato, Hamilton, NZ.
- Wickham, H. (2016). ggplot2: elegant graphics for data analysis. (Springer-Verlag: New York.) Available at https://ggplot2.tidyverse.org
- Wilke, C. O. (2021). ggridges: Ridgeline Plots in ‘ggplot2’. CRAN repository. v. 0.5.3., 2022. https://cloud.r-project.org/web/packages/ggridges
- Williams, J., Ferguson, H., and Tuck, I. (2013a). Distribution and abundance of toheroa (Paphies ventricosa) and tuatua (P. subtriangulata) at Ninety Mile Beach in 2010 and Dargaville Beach in 2011. (Ministry for Primary Industries: Wellington.) http://www.mpi.govt.nz/news-resources/publications.aspx [Verified 12 August 2020]
- Williams, R., Krkošek, M., Ashe, E., Branch, T., Clark, S., Hammond, P., Hoyt, E., et al. (2011). Competing conservation objectives for predators and prey: Estimating killer whale prey requirements for Chinook salmon. PLoS One 6(11), e26738. doi:10.1371/journal.pone.0026738
- Williams, J. R., Sim-Smith, C., and Paterson, C. (2013b). Review of factors affecting the abundance of toheroa (Paphies ventricosa). (Ministry for Primary Industries: Wellington.) pp. 1–80. https://www.researchgate.net/publication/269394999_Review_of_factors_affecting_the_abundance_of_toheroa_Paphies_ventricosa [Verified 2 September 2021]
- Yasué, M. (2005). The effects of human presence, flock size and prey density on shorebird foraging rates. Journal of Ethology 23(2), 199–204. doi:10.1007/s10164-005-0152-8
- Zwarts, L., and Wanink, J. H. (1991). The macrobenthos fraction accessible to waders may represent marginal prey. Oecologia 87(4), 581–587. doi:10.1007/BF00320424
- Zwarts, L., and Wanink, J. H. (1993). How the food supply harvestable by waders in the Wadden Sea depends on the variation in energy density. Body Weight, Biomass, Burying Depth and Behaviour of Tidal-flat Invertebrates. Netherlands Journal of Sea Research 31(4), 441–476.