
ABSTRACT
Geographic overlap of Olive-backed Oriole O. sagittatus and the Green Oriole O. flavocinctus is extensive in northern Australia, but they generally are separated by habitat. They overlap in New Guinea, however, where their habitat distinction is much reduced. Genetic methods in an earlier study detected unexpected hybridisation between the two species in New Guinea. Here, we ask whether hybridisation between the two species may have gone unnoticed in northern Australia, whether genetic methods again may detect it, and whether this may relate to habitat management and conservation. We find no evidence for hybridisation in Australia and conclude that its occurrence in New Guinea is indeed likely related to the reduced habitat distinction between the two species there relative to their range in Australia. We also examine taxonomic corollaries of our genomic data.
Introduction
The Olive-backed Oriole O. sagittatus and the Green Oriole O. flavocinctus are broadly sympatric across tropical northern Australia and the savannas of southern New Guinea (). They are not, however, each other’s closest relatives within Oriolus (Jønsson et al. Citation2019). The Halmahera Oriole O. phaeochromus of the Maluku Islands, Indonesia, and the Brown Oriole O. szalayi of New Guinea were found to be the closest relatives of O. sagitattus and O. flavocinctus, respectively, in phylogenetic analyses of mitochondrial DNA (see Jønsson et al. Citation2016, Citation2019 for further details). In Australia, O. sagitattus and O. flavocinctus co-occur widely in the tropics but are largely separated by habitat albeit with minimal overlap (for details see Higgins et al. Citation2006). O. sagittatus primarily inhabits open eucalypt woodlands and, less often, rainforests, mangroves and riparian areas. In contrast, O. flavocinctus typically inhabits rainforest edges and mangroves adjoining open woodlands and is less often in open eucalypt forests and woodlands. In their shared, restricted range in the Trans-Fly, mostly in Papua New Guinea (PNG), however, this habitat distinction does not apply. Both species occur in that region’s dominant habitat of Melaleuca forests and woodlands (swamp savannas of Paijmans Citation1971; see also Mees Citation1982; Bishop Citation2005; Beehler and Pratt Citation2016). Although the two species occur nowhere else on mainland New Guinea, O. flavocinctus is also found on the Aru Islands and the Lesser Sundas.
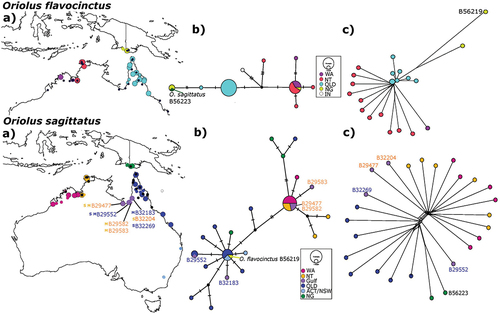
Figure 1. Variation in mtDNA and SNPs across the range of Olive-backed Orioles (O. sagittatus) and Green Orioles (O. flavocinctus). (a) for both species shows the sampling localities for the two species. Specimens indicated by registration numbers are from the Australian National Wildlife Collection (ANWC). For the indicated species, larger coloured circles show locations sampled for SNPs, smaller coloured circles show locations sampled for mtDNA only, black circles show the sampling locations of the other species. Colours correspond to geographic regions and differ between the two species. Blue and orange registration numbers of ANWC specimens highlight O. sagittatus individuals from the Gulf of Carpentariawhich variously group either with samples from north-western Australia (Western Australia – WA; Northern Territory – NT) shown in orange or eastern Australia (Queensland – QLD; Australian Capital Territory – ACT; New South Wales – NSW) shown in blue based on either mtDNA (superscript M) and/or SNPs (superscript S) (see text for further discussion). (b) for both species shows mtDNA haplotype networks for ND2. Unique haplotypes are scaled by number of individuals and coloured by sampling region (see inset for scale and legend). Black dots indicate unsampled, inferred haplotypes. Dashes represent 1 base pair (bp) difference. (c) for both species shows Unrooted Neighbor-Net networks based on 11,763 SNPs for O. sagittatus and 8,116 SNPs for O. flavocinctus. Each terminal represents a single individual, except the larger circle in the O. flavocinctus network, which represents several minimally differentiated individuals from QLD. Colours correspond to (a) in each species. Two individuals, ANWC B56223 and B56219, from PNG identified with introgressed mtDNAbut non-introgressed nuclear DNA by Joseph et al. (Citation2019) are indicated in (b) for each species.
Hybridisation between the two species in New Guinea has been documented through a genetic study of two specimens collected there in 2014 (Joseph et al. Citation2019). Only one of those two specimens was phenotypically aberrant and immediately suggestive of having been of hybrid origin. Genetic data from that specimen showed that it was descended from a relatively recent hybridisation event between the two species if indeed it was not a first-generation hybrid. The other specimen was a phenotypically unremarkable O. sagittatus. Critically, it was also revealed by genetic analysis to be of hybrid descent because it carried the mitochondrial DNA of O. flavocinctus. Other individuals of both species collected at the same time were shown by genetic analysis not to be of hybrid descent. Another, older New Guinean specimen in the American Museum of Natural History collected in 1937 is also phenotypically aberrant. This suggests that it too is of hybrid origin, but it has not been assessed genetically (see Rand Citation1938; Joseph et al. Citation2019).
Given the key finding that hybridisation in the ancestry of a phenotypically unremarkable O. sagittatus specimen from New Guinea was only detected by genetic analysis, we here ask whether hybridisation between O. sagittatus and O. flavocinctus might have been overlooked anywhere in their Australian ranges. Should it be detected and found to be widespread, it would be pertinent to how the two species and their habitats are managed. To address this, we report genomic data and mitochondrial DNA (mtDNA) sequence data from specimens of both species across their northern Australian range of sympatry. To detect individuals of hybrid descent but phenotypically largely typical of either species, specimens of each species ideally would be sought from the same or nearly the same locality and from similar time periods. Despite the opportunism involved in specimen collecting over time, we were nonetheless able to do this for several localities (Bullo River, Melville Island, Koolpinyah, Pajinka, McIlwraith Ranges; Table S1; ). If, however, hybridisation between the species is as frequent as its detection in just a few specimens from New Guinea suggests it could be, then so, too, a geographically broad survey of specimens could reasonably be expected to detect some evidence of hybridisation e.g., mtDNA typical of O. flavocinctus in a phenotypically typical O. sagittatus or vice versa. We also address whether our data are consistent with the prevailing subspecies taxonomy of both species as outlined in Schodde and Mason (Citation1999) and Higgins et al. (Citation2006).
Materials and methods
Table S1 lists all the specimens studied, most being from the Australian National Wildlife Collection (ANWC). shows the localities of 52 specimens sampled for genomic data (n = 26 for each species) mostly from Australia. Single nucleotide polymorphism (SNP) data were generated at the same time as and followed precisely the same protocols, as Johnston et al.’s (Citation2022) study of Forest Kingfishers Todiramphus macleayii using the Diversity Arrays Technology (DArT) pipeline. SNPs were aligned to Oriolus oriolus reference genome ASM1340023v1 (see Table S2). dartR (Gruber et al. Citation2018) was used to filter SNPs for reproducibility, call rate (threshold = 0.95) and monomorphic loci and to perform Principal Components Analyses (PCA) and STRUCTURE analyses using five replicates per K populations between 1 and 8 under a model assuming correlated allele frequencies and admixture. The best value of K was selected using Evanno’s delta K and mean log-likelihood (LnP(K)). stamPP (Pembleton et al. Citation2013) was used to generate FST diversity statistics (a measure of population differentiation) derived from the SNP data. Splitstree v4.19.0 (Huson and Bryant Citation2006) was used to calculate unrooted networks using the Neighbor-Net algorithm with variances estimated (Huson Citation1998).
We also generated a data matrix of 726 base pairs (bp) of the mtDNA ND2 gene from 39 O. sagittatus and 37 O. flavocinctus involving 32 and 31 newly sequenced individuals, respectively, of each species and sequences from (Joseph et al. Citation2019; Table S1). We used the protocols described in Dolman and Joseph (Citation2015) for DNA extraction and sequencing of ND2. The TCS (Templeton, Crandall and Sing’s) method in popart version 1.7 (Leigh et al. Citation2015) was used to generate unrooted haplotype networks from the ND2 alignment of each species.
Results
SNP data
Analyses of both species together used 17,763 SNPs and the mean call rate was 98.9% across 52 individuals. Single species analyses for O. flavocinctus and O. sagitattus used 8,116 SNPs and 11,763 SNPs, respectively, across 26 individuals of each species. The two species fall into two distinct clusters in unrooted networks (), PCA () and STRUCTURE (), and there is no evidence of hybridisation between them in Australian samples (). When the SNP data from the two oriole species are plotted together, PC 1 explains 61% of the variance and PC 2 just 1.9% (). Similarly, very high FST values were observed between the two species whether calculated among their Australian or PNG populations (0.63 and 0.60, respectively). STRUCTURE analyses selected K = 2 as the best-fit model based on mean log-likelihood (LnP(K)) and delta K (Figure S1). No substructuring was detected beyond K = 2; thus, we only show results from K = 2–4 (). When the SNP data from each species are examined separately (Figure S2), PC1 and PC2, as expected, explain far smaller (<11%) and slightly higher (still <10%) components of variance, respectively, than when the two species are plotted together. Samples from each species fell into either of three well-differentiated clusters, which in each species correlated almost exclusively with geography and current taxonomy ( and S2). These geographic groups were also estimated by unrooted networks (), but not in STRUCTURE analyses ().
Figure 2. Lack of evidence of hybridisation between O. sagittatus and O. flavocinctus based on genome-wide SNPs. (a) PCA analysis for the first two principal components (PC1 and PC2) and (b) STRUCTURE analysis for K 2–4. Both analyses support two clearly distinct clusters corresponding to the two species.
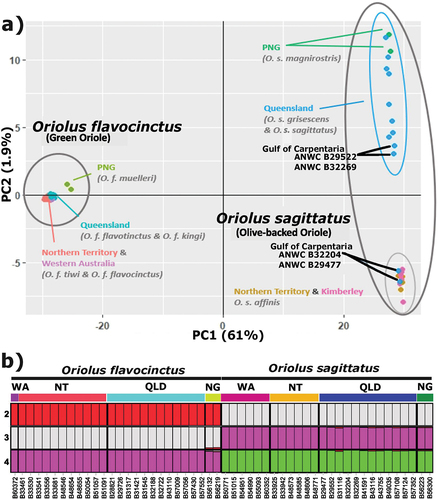
Notable outliers from the geographically based groupings were the samples of O. sagittatus from about 200 km apart around the base of the Gulf of Carpentaria (). They fell in the two clusters most widely separated from each other on PC1 in the PCA of O. sagittatus alone (Figure S2). Of the four Gulf of Carpentaria individuals sampled for SNPs, two grouped with individuals from the north-western Australian cluster, and two with the eastern Australian cluster (). Notably, one sample from Inkerman Station on the Staaten River and a sample from ~155 km to its south-west at Karumba (ANWC B32269 and B29552, respectively, shown with blue specimen registration numbers in ) fell in the otherwise eastern Australian cluster from Queensland (see also Figure S2). In contrast, another from Inkerman and a sample from ~280 km to its south-west at Escott (ANWC B32204 and B29477, respectively; shown with orange specimen registration numbers in ) aligned tightly with all samples from the Northern Territory and Western Australia (see also Figure S2). Supplementary Figures S3 and S4 show dorsal and ventral views of these specimens relative to representative specimens from elsewhere in the range and highlight their phenotypic variability.
In O. flavocinctus, no separation was apparent among samples of the two nominal subspecies from Cape York Peninsula (O. f. flavotinctus and O. f. kingi) and their zone of intergradation described in Schodde and Mason (Citation1999). Similarly, no separation was evident among samples of the two nominal subspecies from the Northern Territory and Western Australia (O. f. tiwi and O. f. flavocinctus).
In both species, however, the sampled individuals from Papua New Guinea (Table S1; Joseph et al. Citation2019) are strongly differentiated from samples of their respective Australian conspecifics. FST values show that this differentiation between PNG and, specifically, eastern Australian conspecifics is more pronounced by an order of magnitude in O. flavocinctus than in O. sagittatus (0.19 vs 0.05, respectively).
MtDNA data
The newly obtained mtDNA ND2 sequences from Australian individuals of O. sagittatus and O. flavocinctus (GenBank accession numbers OP433368-OP433430) showed that net nucleotide divergence between the two species was 9.49% closely comparable with 9.76% in the sampling of Joseph et al. (Citation2019). Nucleotide diversities within the two species were an order of magnitude lower than 1% (0.41% and 0.34% in O. sagittatus and O. flavocinctus, respectively). The sequences were within the range of diversity of each species as found in the earlier study (Joseph et al. Citation2019). No individuals from Australia of one species carried mtDNA of the other species (). MtDNA within each species showed population structuring consistent with that shown in the nuclear SNPs (). Both SNPs and mtDNA support two genetic groups in O. sagittatus from western (WA and NT) and eastern (QLD, ACT and NSW) Australia and individuals from the Gulf of Carpentaria are placed in both groups. Notably, while the Gulf of Carpentaria appears to be admixed, our limited sampling from this region did not find any individuals with mismatched SNP and mtDNA assignment to either the eastern or western groups ().
Discussion
Olive-backed and Green Orioles, O. sagittatus and O. flavocinctus, respectively, have been shown to have hybridised in New Guinea (Joseph et al. (Citation2019). Here we asked whether there is any genetic evidence from tropical Australia that these two species, which in Australia are regionally sympatric but strictly separated by habitat, have hybridised. Our findings resoundingly find no support for hybridisation in Australia. Their habitat distinction, which in places can be the edge between adjacent habitats of eucalypt woodland (O. sagittatus) and riparian rainforest (O. flavocinctus), is likely a very efficient pre-mating barrier, especially when coupled with their very distinct vocalisations (Higgins et al. Citation2006). This contrasts with their geographically more limited, shared range in New Guinea where they co-occur in habitat of predominantly tall Melaleuca woodland or ‘swamp forest’ described in Paijmans (Citation1971) and Joseph et al. (Citation2019). We note again, however, that these species are not the closest relatives within Oriolus (Jønsson et al. Citation2019).
The divergence between New Guinean and Australian populations of O. flavocinctus is slightly greater in magnitude than in the same comparison in O. sagittatus. This would likely be due either to longer separation and less connectivity, on one hand, or greater habitat specialisation on the other hand in O. flavocinctus relative to O. sagittatus. Both species are confined to a relatively small region in New Guinea so we cannot address whether drift is more likely there in one or the other species. The Carpentarian Barrier, which comprises the sparsely wooded plains fringing the Gulf of Carpentaria (Keast Citation1961), has likely had a more profound effect in isolating more rainforest-dependent O. flavocinctus than O. sagittatus. This is, of course, evident simply from their distributions, O. flavocinctus being much more sparsely distributed in the region of the Carpentarian Barrier, whereas O. sagittatus occurs more widely through that zone (Higgins et al. Citation2006; http://eBird.org, accessed 21 March 2023). It is beyond our scope here to examine the different degree of divergences further.
Within O. sagittatus, the coastal fringes of the south-eastern Gulf of Carpentaria have been considered as a zone of intergradation among three subspecies O. s. affinis (Gulf of Carpentaria westwards), O. s. grisescens (Cape York Peninsula), and O. s. sagittatus (rest of eastern Australia) (Schodde and Mason Citation1999). Our data are broadly consistent with this although we see no strong genomic structure within eastern Australia. SNP data from four specimens from this region, including two from one locality (Inkerman), fell into the two divergent clusters of genomic diversity in O. sagittatus. Supplementary Figures S3 and S4 highlight the phenotypic variability of these four specimens.
In contrast, in the more strictly rainforest-dependent O. flavocinctus, which is much more sparsely distributed and thus less well sampled in the south-eastern Gulf of Carpentaria (Higgins et al. Citation2006; http://eBird.org, accessed 21 March 2023), our data show only single clusters east and west of the Gulf of Carpentaria. This is consistent with recognising just two subspecies, O. f. flavocinctus for populations west of the Gulf of Carpentaria and O. f. kingi for all eastern populations. Recognition by Schodde and Mason (Citation1999) of O. f. tiwi on the Tiwi Islands might reflect natural selection or genetic drift in genes underpinning plumage traits, but that is not reflected in our data. Quantitative, spectrophotometric analyses of colour variation in this species are likely to be the most useful source of further data to be integrated with genomic data now available.
Supplemental Material
Download MS Word (3.8 MB)Acknowledgments
We are indebted to all collectors and permit-granting agencies who have enabled the collection of specimens used in this study. Comments from reviewers and editors greatly improved the manuscript.
Disclosure statement
No potential conflict of interest was reported by the author(s).
Data availability statement
No proprietary data are associated with this paper. All the SNP data for which this paper is dependent upon are available at doi:10.6084/m9.figshare.22306360. MtDNA sequences generated for this study are lodged with GenBank (accession numbers OP433368-OP433430).
Supplementary material
Supplemental data for this article can be accessed at https://doi.org/10.1080/01584197.2023.2214573.
References
- Beehler, B. M., and Pratt, T. K. (2016). ‘Birds of New Guinea: Distribution, Taxonomy, and Systematics.’ (Princeton University Press: Princeton, NJ.)
- Bishop, K. D. (2005). A review of the avifauna of the Trans-Fly Eco-region: The status, distribution, habitats and conservation of the region’s birds. Project Number 9S0739.02. WWF Project: Trans Fly Ecoregion Action Program.
- Dolman, G., and Joseph, L. (2015). Evolutionary history of birds across southern Australia: Structure, history and taxonomic implications of mitochondrial DNA diversity in an ecologically diverse suite of species. Emu 115, 35–48. doi:10.1071/MU14047
- Gruber, B., Unmack, P. J., Berry, O. F., and Georges, A. (2018). dartR: An R package to facilitate analysis of SNP data generated from reduced representation genome sequencing. Molecular Ecology Resources 18, 691–699. doi:10.1111/1755-0998.12745.
- Higgins, P. J., Peter, J. M., and Cowling, S. J. (Eds.) (2006). ‘Handbook of the Australian, New Zealand and Antarctic Birds. Volume 7: Boatbill to Starlings.’ (Oxford University Press: Melbourne.)
- Huson, D. H. (1998). SplitsTree: Analyzing and visualizing evolutionary data. Bioinformatics 14, 68–73. doi:10.1093/bioinformatics/14.1.68.
- Huson, D. H., and Bryant, D. (2006). Application of phylogenetic networks in evolutionary studies. Molecular Biology and Evolution 23, 254–267. doi:10.1093/molbev/msj030.
- Johnston, H., Fenker, J., Kearns, A., Drew, A., Mason, I. J., Moritz, C., and Joseph, L. (2022). Genomic insights into the taxonomy and migration of the Forest Kingfisher Todiramphus macleayii. Emu- Austral Ornithology 122, 276–281. doi:10.1080/01584197.2022.2122508
- Jønsson, K., Blom, M., Marki, P., Joseph, L., Sangster, G., Ericson, P., and Irestedt, M. (2019). Complete subspecies-level phylogeny of the Oriolidae (Aves: Passeriformes): Out of Australasia and return. Molecular Phylogenetics and Evolution 137, 200–209. doi:10.1016/j.ympev.2019.03.015
- Jønsson, K. A., Delhey, K., Sangster, G., Ericson, P. G. P., and Irestedt, M. (2016). The evolution of mimicry of friarbirds by orioles (Aves: Passeriformes) in Australo-Pacific archipelagos. Proceedings of the Royal Society B 283, 20160409. doi:10.1098/rspb.2016.0409
- Joseph, L., Dolman, G., Jønsson, K., Iova, B., Campbell, C. D., Mason, I., and Drew, A. (2019). Aberrantly plumaged orioles from the Trans-Fly savannas of New Guinea and their ecological and evolutionary significance. Emu – Austral Ornithology 119, 264–273. doi:10.1080/01584197.2019.1605831.
- Keast, A. (1961). Bird speciation on the Australian continent. Bulletin of the Museum of Comparative Zoology, Harvard 123, 305–495.
- Leigh, J. W., Bryant, D., and Nakagawa, S. (2015). POPART: Full-feature software for haplotype network construction. Methods in Ecology and Evolution 6(9), 1110–1116. doi:10.1111/2041-210X.12410.
- Mees, G. F. (1982). Birds from the lowlands of southern New Guinea (Merauke and Koembe). Zoologische Verhandelingen 191, 1–188.
- Paijmans, K. (1971). Vegetation, forest resources, and ecology of the Morehead-Kiunga area. In land resources of the Morehead-Kiunga Area. Land resources of the Morehead-Kiunga Area, Territory of Papua and New Guinea. CSIRO Land Research Series 29, 88–113.
- Pembleton, L. W., Cogan, N. O. I., and Forster, J. W. (2013). StAMPP: An R package for calculation of genetic differentiation and structure of mixed-ploidy level populations. Molecular Ecology Resources 13, 946–952. doi:10.1111/1755-0998.12129
- Rand, A. L. (1938). Results of the Archbold expeditions. No. 20. On some passerine New Guinea birds. American Museum Novitates 991, 1–20.
- Schodde, R., and Mason, I. J. (1999). ‘The Directory of Australian Birds: Passerines.’ (CSIRO Publishing: Collingwood Victoria.)