
ABSTRACT
Citizen science is a popular approach to biodiversity surveying, whereby data that are collected by volunteer naturalists may help analysts to understand the distribution and abundance of wild organisms. In Australia, birdwatchers have contributed to two major citizen science programs, eBird (run by the Cornell Lab of Ornithology) and Birdata (run by Birdlife Australia), which collectively hold more than 42 million records of wild birds from across the country. However, these records are not evenly distributed across space, time, or taxonomy, with particularly significant variation in the number of records of each species in these datasets. In this paper, we explore this variation and seek to determine which Australian bird species are least known as determined by rates of citizen science survey detections. We achieve this by comparing the rates of survey effort and species detection across each Australian bird species’ range, assigning all 581 species to one of the four groups depending on their rates of survey effort and species observation. We classify 56 species into a group considered the most poorly recorded despite extensive survey effort, with Coxen’s Fig Parrot Cyclopsitta coxeni, Letter-winged Kite Elanus scriptus, Night Parrot Pezoporus occidentalis, Buff-breasted Buttonquail Turnix olivii and Red-chested Buttonquail Turnix pyrrhothorax having the very lowest numbers of records. Our analyses provide a framework to identify species that are poorly represented in citizen science datasets. We explore the reasons behind why they may be poorly represented and suggest ways in which targeted approaches may be able to help fill in the gaps.
Introduction
Managing species for conservation cannot be done effectively if we do not know where they occur (Fuller et al. Citation2003; Watson et al. Citation2022), and yet despite this, resources for schemes aimed at verifying species’ distributions are typically very limited (Kuebbing et al. Citation2018). While the Wallacean shortfall (lack of knowledge of species’ distributions) is a well-recognised problem for many species groups (Cardoso et al. Citation2011; Hortal et al. Citation2015), it is an issue even for a well-studied and well-surveyed group like Australian birds, with recent research highlighting the issue for many species in the country (Leseberg et al. Citation2021; Webster et al. Citation2022a, Citation2022b; Maccoll et al. Citation2023). A key challenge facing Australian bird conservation is identifying which species and regions most need further survey effort to overcome these shortfalls.
An increasingly popular approach to surveying biodiversity is to leverage data generated by citizen science programs. There are several large-scale platforms that collect and curate volunteer-contributed occurrence data on Australian birds, with more than 50 million records from these platforms available in the Atlas of Living Australia. Globally, citizen science has led to numerous advances in understanding species’ populations in space and time (e.g. Van Strien et al. Citation2013; Johnston et al. Citation2020), although the application of citizen science data to biodiversity science has been hindered by several obstacles (Burgess et al. Citation2017), including real or perceived data quality issues (Binley and Bennett Citation2023), and statistical challenges during analysis (Johnston et al. Citation2023). As such, citizen science is likely underutilised in ornithology and bird conservation in Australia, particularly with respect to the Wallacean shortfall.
Here, we explore the taxonomic coverage of citizen science data for Australian birds. We seek to determine which species have the lowest frequency of records in citizen science surveys and do so by comparing rates of survey effort and species detection across species’ ranges. In so doing, we identify taxa that are poorly represented in citizen science datasets, explore the reasons behind this, and suggest how targeted citizen science efforts might help.
Materials and methods
Datasets
We used citizen science occurrence data from eBird (Cornell Lab of Ornithology Citation2022; see ebird.org and Sullivan et al. Citation2009 for more details) and Birdata (Birdlife Australia Citation2023; see birdata.birdlife.org.au for more details). We filtered the two datasets to include only records from mainland Australia; records from offshore islands and the Torres Strait were excluded, as were records referring to exotic, extinct, vagrant, or marine species. We removed duplicate (shared) checklists from the eBird dataset and removed data from non-complete checklists (e.g. incidental observations) from both datasets. Records from all years were included (we did not filter historical sightings), and we did not conduct any additional error checking beyond what is already done by each of the programs. We used distribution data (range maps) from Birdlife International (BirdLife International, and Handbook of the Birds of the World Citation2020) and the Australian Bird Guide (Menkhorst et al. Citation2017). We combined ranges for each species across the two sources, clipped them to mainland Australia, then filtered them to only include extant, non-vagrant distributions. We used IOC v13.2 taxonomy where possible, but as each of our four datasets uses a different taxonomic list, we manually resolved conflicts (Supplemental Online Material 1; Supplemental Online Material 2). The final occurrence and distribution datasets contained approximately 42 million observations of 581 species across 2.5 million checklists (= surveys, i.e. a list of birds seen on a dedicated birdwatching visit to a given site).
Analysis
We quantified the degree of survey effort and success in the combined citizen science dataset for each of the 581 species. We calculated the number of checklists (survey effort) and observations within each species’ range and scaled both of these by its range size to provide range-wise measures of checklist and observation density. We divided observation density by checklist density to calculate reporting rate (which could also be called an encounter rate, that is, a measure of survey success) for each species. Finally, we explored the relationship of these measures with threat status (least concern vs threatened/near threatened) via T-tests of the log of the reporting rate, observation density and checklist density, respectively.
Results
Species’ range sizes varied from 460 km2 (Noisy Scrubbird Atrichornis clamosus) to 7.7 million km2 (multiple continent-wide species). The mean range size was 2.4 million km2 and the median was 1.2 million km2. The number of observations for each species ranged from 4 (Coxen’s Fig Parrot Cyclopsitta coxeni) to 1.3 million (Australian Magpie Gymnorhina tibicen). The mean number of observations per species was 73,000 and the median was 16,000. The number of checklists in each species’ distribution ranged from 1200 (Noisy Scrubbird Atrichornis clamosus) to 2.6 million (continent-wide species). The mean number of checklists per species’ range was 1.1 million and the median was 960,000. The numbers of observations and checklists for each species were highly correlated (R2 = 0.252, p < 0.001). Observation densities ranged from 5.3 × 10⁻⁶ per km2 (Night Parrot Pezoporus occidentalis) to 1.0 per km2 (Forty-spotted Pardalote Pardalotus quadragintus). The mean observation density was 0.056 per km2 and the median was 0.019 per km2 (). Checklist densities ranged from 0.024 per km2 (Eyrean Grasswren Amytornis goyderi) to 11 per km2 (Forty-spotted Pardalote Pardalotus quadragintus). The mean checklist density was 0.99 per km2 and the median was 0.52 per km2 (). Reporting rates for each species ranged from 1-in -81,000 (0.0012%; Coxen’s Fig Parrot Cyclopsitta coxeni) to 1-in-2 (50%; Australian Magpie Gymnorhina tibicen). The mean reporting rate was 1-in-16 (6.2%), and the median was 1-in-27 (3.7%; ). The eleven species with reporting rates of less than one in every thousand checklists (<0.1%) are shown in . Threatened and near-threatened species tended to have lower reporting rates than least concern species (T75.3 = −4.20, p < 0.001). This relationship appears to be driven by these threatened and near-threatened species having higher checklist densities (T81.0 = 4.32, p < 0.001) but similar observation densities (T75.3 = −0.993, p = 0.324) across their ranges. A complete table of species data is available as Supplemental Online Material 1.
Figure 1. Citizen science survey effort (checklists per km2) versus success (observations per km2) for 581 native terrestrial Australian birds. Each species is plotted as a dot, with the colour of the dot indicating Australian threat status (Garnett and Baker Citation2021). Diagonal lines indicate log-bands of reporting rate (observations/checklists). The background shading divides the graph into four quadrants along the 1% reporting rate and 1 checklist per km2 lines. The top right quadrant (green) indicates species that are both well surveyed and readily detected (n = 137). The top left quadrant (yellow) indicates species that are less well surveyed but still readily detected (n = 324). The bottom left quadrant (orange) indicates species that are both poorly surveyed and scarcely detected (n = 63). The bottom right quadrant (red) indicates species that are well surveyed but still scarcely detected (n = 56).
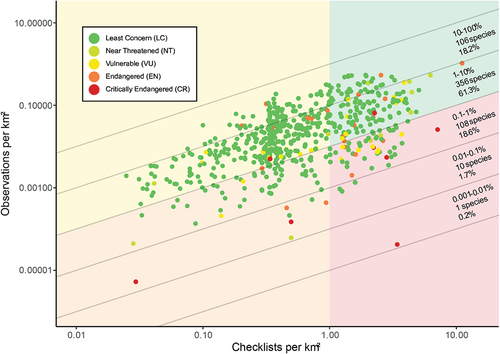
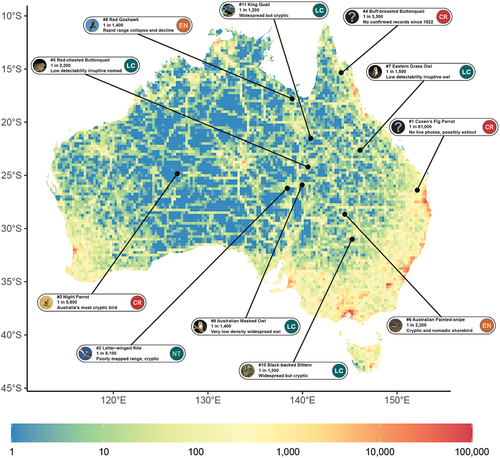
Figure 2. Map of Australia showing citizen science survey effort (checklist density) across the country, rendered as a 0.25×0.25 degree grid, and the locations (range centroids) of the eleven Australian birds with the lowest rates of citizen science survey success. These species all have reporting rates of less than one observation for every thousand checklists. At this resolution, one quarter of the continent has zero survey effort; The median number of checklists in a grid cell is 9 and the mean is 220.
Discussion
In this paper, we sought to identify the Australian bird species with the lowest frequency of records in citizen science platforms. Species fit into one of three groups that emerge from our analysis (). The first group (bottom right quadrant) are species that have very few records despite substantial survey effort across their range. The second group (left two quadrants) are those whose ranges are poorly surveyed (regardless of how frequently they are detected; see ). The final group (top right quadrant) are those whose ranges are well surveyed and for which there are ample observations across their range.
Group 1: Hide and Seek Champions of Australia
Overwhelmingly, the species in this group (56 species in the bottom right quadrant of ) tend to be either scarce (occur at low densities, e.g. Grey Goshawk Accipiter novaehollandiae), exhibit cryptic behaviour (e.g. Lewin’s Rail Lewinia pectoralis), or are primarily nocturnal (e.g. White-throated Nightjar Eurostopodus mystacalis); many are also difficult to identify and may be overlooked for more common lookalikes (e.g. Satin Flycatcher Myiagra cyanoleuca, Pectoral Sandpiper Calidris melanotos). Species in this group, particularly those not currently listed as threatened, may need further targeted research efforts to determine whether their poor reporting rates are due to historical or ongoing declines that have not been identified.
A substantial proportion (17/56; 30%) of the species in this group are currently threatened or near threatened. In particular, the Coxen’s Fig Parrot Cyclopsitta coxeni emerges as a species of major concern: despite having received 320,000 checklists of survey effort across its relatively small 95,000 km2 range, at a density of 3.4 checklists per km2, just four observations are recorded in the dataset. In all cases, birds were not seen again at the same location in follow-up visits (Garnett and Baker Citation2021), and the closely-related Double-eyed Fig Parrot Cyclopsitta diophthalma of northern Queensland is regularly encountered (reporting rate 1-in-10; 9.8%), suggesting that detectability should not be an issue for the species. Another species of concern is the Buff-breasted Buttonquail Turnix olivii. While its range has been less comprehensively surveyed by citizen scientists than the Coxen’s Fig Parrot (23,000 checklists of survey effort across its 47,000 km2 range at a density of 0.50 checklists per km2), only seven observations are recorded in the dataset; as with the Coxen’s Fig Parrot, all are unconfirmed and it has been suggested that many sight observations reported to be this species may in fact be misidentifications, particularly those from the Wet Tropics and Einasleigh Uplands bioregions (Webster et al. Citation2022a). Nevertheless, in contrast to the Coxen’s Fig Parrot, large tracts of the Buff-breasted Buttonquail’s range have not been covered by citizen scientists (), and it is possible that the species still occurs in very low densities somewhere. These two species, as well as the other 54 in the quadrant, demonstrate a known weakness of citizen science datasets; there will always be a subset of species that are scarce, cryptic, nocturnal, and/or difficult to identify, for which the ad hoc nature of data collection by citizen scientists will limit the ability for analysts to draw conclusions about their distribution and status. These known limitations suggest that these species require targeted attention, probably by specialists using species-specific survey methods, to collect robust data that can inform conservation.
Group 2: Hard to Survey, Harder to Find?
The 388 species in this group (left two quadrants of ) tend to occupy remote regions of Australia that are visited less frequently (e.g. Eyrean Grasswren Amytornis goyderi), and are often cryptic too, particularly those in the bottom left quadrant (e.g. Night Parrot Pezoporus occidentalis). Such species may be able to be adequately surveyed by citizen scientists, particularly if they are somehow incentivised to do so (see Callaghan et al. Citation2019 for discussion on this topic), but with present survey behaviours this is unlikely to occur. Only a small proportion of these species are considered threatened or near threatened (27/388; 7.0%). Notably, survey effort across the entire Australian continent is still less than 1 checklist per km2, meaning that the ~50 species whose ranges extend across the whole continent are still considered poorly surveyed under our three-group characterisation (). Although citizen science occurrence data of these species are still useful, scientific or conservation endeavours involving these species will probably require targeted surveys or alternative methods (e.g. tracking, bioacoustics) to fill in the data gaps left by citizen scientists.
Group 3: Well-Known and Well-Surveyed?
These 137 species (top right quadrant of ) tend to be both common and easily detected (e.g. Rainbow Lorikeet Trichoglossus moluccanus), and many typically have relatively small ranges that overlap with the densely populated regions parts of Australia (). Notably, almost one fifth (24/137; 18%) are threatened or near threatened, including Baudin’s Black Cockatoo Calyptorhynchus baudinii which is classified as Critically Endangered. These 24 threatened or near-threatened species include eight Wet Tropics endemics recently added as a result of global warming-induced altitudinal range contractions (Williams and de la Fuente Citation2021). Unlike those in group 1, adequate conclusions may be able to be drawn on the distribution and conservation status of most species in this group based on these citizen science datasets alone, without the need for additional survey effort.
Limitations and future outlook
The robustness of this analysis relies on the quality of the data used, and while conducting this research we did note some shortcomings in the data available. In particular, the quality of range maps used is a concern. Although the two sources of distribution data used are the most comprehensive, accurate, and up-to-date spatial datasets available for Australian bird distributions, and have been utilised in many peer-reviewed studies (e.g. Lees et al. Citation2022), we identified numerous issues during these analyses. For example, both datasets incorrectly map Letter-winged Kite Elanus scriptus as occurring in coastal southwest Australia despite a near complete lack of records from the region. Accurate distributional information is critical to successful biodiversity and conservation science (Whittaker et al. Citation2005), and this work has shown the urgent need for updated, more accurate, range maps of Australian birds which citizen science databases (like the ones we have analysed) can help inform.
Another issue in this analysis is spatial bias. Although spatial bias is a known problem in citizen science datasets (Backstrom Citation2022) we have not attempted to control for it here. Some species’ reporting rates may thus be artificially inflated by disproportionate visitation to a few sites within their range where birds are readily found. A key example is the Golden-shouldered Parrot Psephotellus chrysopterygius, which ranks 7th out of all 581 species by reporting rate (1-in-3; 35%) due to a cluster of sightings from one site in an otherwise poorly surveyed range (Garnett and Baker Citation2021).
A final set of issues worth mentioning are the general limitations of citizen science datasets (see Johnston et al. Citation2023 for an in-depth discussion). In particular, much has been written about the quality of observations in citizen science datasets (e.g. Binley and Bennett Citation2023), and while the quality of the two datasets used in this analysis is generally high, for the very rarest species even a small number of erroneous records may skew the results. This is particularly so for the two lost species discussed above, Coxen’s Fig Parrot Cyclopsitta coxeni and Buff-breasted Buttonquail Turnix olivii. Lastly, we observe that citizen science data in Australia are overwhelmingly from the past two decades, and stress that historical trends are difficult to identify within a framework that relies on current or recent citizen science data.
Conclusions
Our analyses categorise species into three groups, providing an impetus for where further research by both citizen scientists and specialists is warranted. Equally importantly, this research suggests that citizen science data, or a lack of such data, can act as a trigger to investigate a species’ range, status, and population trajectory more closely, especially if a species is poorly represented in what are some of the most comprehensive biodiversity databases currently in existence. In both cases, recognising how the benefits but also limitations of citizen science influence the way we assess individual species is critical if its value is to be harnessed for conservation.
Author contributions
Louis Backstrom: Conceptualisation, Methodology, Formal Analysis, Writing – Original Draft, Visualisation, Project Administration. Nicholas Leseberg: Conceptualisation, Methodology, Writing – Original Draft. Corey Callaghan: Conceptualisation, Methodology, Writing – Review & Editing. Chris Sanderson: Conceptualisation, Writing – Review & Editing. Richard Fuller: Conceptualisation, Writing – Review & Editing, Supervision. James Watson: Conceptualisation, Methodology, Writing – Original Draft, Supervision, Project Administration.
Supplemental Material
Download MS Word (149.8 KB)Supplemental Material
Download MS Word (16.6 KB)Acknowledgments
We thank Rohan Clarke, Glen Ehmke, Birdlife Australia, and CSIRO publishing for facilitating and permitting the use of the Australian Bird Guide range maps. We thank Mark Balman and Birdlife International for facilitating and permitting the use of the Birdlife International range maps. We thank the associate editor and two anonymous reviewers for providing critical, useful feedback on earlier versions of this manuscript.
Disclosure statement
No potential conflict of interest was reported by the author(s).
Data availability statement
All datasets used have been cited in the text. A GitHub repository with full code and outputs is available at https://github.com/Louis-Backstrom/CS-Gaps-Australia.
Supplementary data
Supplemental data for this article can be accessed at https://doi.org/10.1080/01584197.2023.2283443.
References
- Backstrom, L. J. (2022). Understanding and quantifying biases in citizen science datasets. BAdvSc(Hons) Thesis, University of Queensland, St Lucia, QLD.
- Binley, A. D., and Bennett, J. R. (2023). The data double standard. Methods in Ecology and Evolution 14(6), 1389–1397. doi:10.1111/2041-210x.14110
- Birdlife Australia. (2023). Birdata platform extract. Version: 12-05-2023. Available at https://birdata.birdlife.org.au/ [Verified 12 May 2023].
- BirdLife International, and Handbook of the Birds of the World. (2020). Bird species distribution maps of the world. Version: 2020.1. Available at www.datazone.birdlife.org/species/requestdis [Verified 14 January 2021].
- Burgess, H. K., DeBey, L. B., Froehlich, H. E., Schmidt, N., Theobald, E. J., Ettinger, A. K., and HilleRisLambers, J., et al. (2017). The science of citizen science: Exploring barriers to use as a primary research tool. Biological Conservation 208, 113–120. doi:10.1016/j.biocon.2016.05.014
- Callaghan, C. T., Rowley, J. J. L., Cornwell, W. K., Poore, A. G. B., and Major, R. E. (2019). Improving big citizen science data: Moving beyond haphazard sampling. PLoS Biology 17(6), e3000357. doi:10.1371/journal.pbio.3000357
- Cardoso, P., Erwin, T. L., Borges, P. A. V., and New, T. R. (2011). The seven impediments in invertebrate conservation and how to overcome them. Biological Conservation 144(11), 2647–2655. doi:10.1016/j.biocon.2011.07.024
- Cornell Lab of Ornithology. (2022). eBird basic dataset. Version: EBD_relDec-2022. Available at https://ebird.org/data/download [Verified 13 January 2023].
- Fuller, R. A., McGowan, P. J. K., Carroll, J. P., Dekker, R. W. R. J., and Garson, P. J. (2003). What does IUCN species action planning contribute to the conservation process? Biological Conservation 112(3), 343–349. doi:10.1016/S0006-3207(02)00331-2
- Garnett, S. T., and Baker, G. B. (2021). ’The Action Plan for Australian Birds 2020.’ (CSIRO Publishing: Clayton South, VIC.)
- Hortal, J., De Bello, F., Diniz-Filho, J. A. F., Lewinsohn, T. M., Lobo, J. M., and Ladle, R. J. (2015). Seven shortfalls that beset large-scale knowledge of biodiversity. Annual Review of Ecology, Evolution, and Systematics 46(1), 523–549. doi:10.1146/annurev-ecolsys-112414-054400
- Johnston, A., Matechou, E., and Dennis, E. B. (2023). Outstanding challenges and future directions for biodiversity monitoring using citizen science data. Methods in Ecology and Evolution 14(1), 103–116. doi:10.1111/2041-210x.13834
- Johnston, A., Moran, N., Musgrove, A., Fink, D., and Baillie, S. R. (2020). Estimating species distributions from spatially biased citizen science data. Ecological Modelling 422, 108927. doi:10.1016/j.ecolmodel.2019.108927
- Kuebbing, S. E., Reimer, A. P., Rosenthal, S. A., Feinberg, G., Leiserowitz, A., Lau, J. A., and Bradford, M. A. (2018). Long‐term research in ecology and evolution: A survey of challenges and opportunities. Ecological Monographs 88(2), 245–258. doi:10.1002/ecm.1289
- Lees, A. C., Haskell, L., Allinson, T., Bezeng, S. B., Burfield, I. J., Renjifo, L. M., and Rosenberg, K. V., et al. (2022). State of the world’s birds. Annual Review of Environment and Resources 47(1), 231–260. doi:10.1146/annurev-environ-112420-014642
- Leseberg, N. P., Mcallan, I. A. W., Murphy, S. A., Burbidge, A. H., Joseph, L., Parker, S. A., and Jackett, N. A., et al. (2021). Using anecdotal reports to clarify the distribution and status of a near mythical species: Australia’s night parrot (Pezoporus occidentalis). Emu - Austral Ornithology 121(3), 1–11. doi:10.1080/01584197.2021.1927760
- Maccoll, C., Leseberg, N. P., Seaton, R., Murphy, S. A., and Watson, J. E. M. (2023). Rapid and recent range collapse of Australia’s red goshawk Erythrotriorchis radiatus. Emu - Austral Ornithology 123(2), 93–104. doi:10.1080/01584197.2023.2172735
- Menkhorst, P., Rogers, D., Clarke, R., Davies, J., Marsack, P., and Franklin, K. (2017). ‘The Australian Bird Guide.’ (CSIRO Publishing: Clayton South, VIC.)
- Sullivan, B. L., Wood, C. L., Iliff, M. J., Bonney, R. E., Fink, D., and Kelling, S. (2009). eBird: A citizen-based bird observation network in the biological sciences. Biological Conservation 142(10), 2282–2292. doi:10.1016/j.biocon.2009.05.006
- Van Strien, A. J., Van Swaay, C. A. M., Termaat, T., and Devictor, V. (2013). Opportunistic citizen science data of animal species produce reliable estimates of distribution trends if analysed with occupancy models. Journal of Applied Ecology 50, 1450–1458. doi:10.1111/1365-2664.12158
- Watson, J. E. M., Simmonds, J. S., Ward, M., Yong, C. J., Reside, A. E., Possingham, H. P., and Rogers, A., et al. (2022). Communicating the true challenges of saving species: response to Wiedenfeld et al. Conservation Biology 36. doi:10.1111/cobi.13961
- Webster, P. T. D., Leseberg, N. P., Murphy, S. A., Joseph, L., and Watson, J. E. M. (2022a). A review of specimens of buff-breasted button-quail Turnix olivii suggests serious concern for its conservation outlook. Emu - Austral Ornithology 122(2), 121–130. doi:10.1080/01584197.2022.2090962
- Webster, P. T. D., Shimomura, R., Rush, E. R., Leung, L. K.-P., and Murray, P. J. (2022b). Distribution of black-breasted button-quail Turnix melanogaster in the Great Sandy Region, Queensland and associations with vegetation communities. Emu - Austral Ornithology 122(1), 71–76. doi:10.1080/01584197.2022.2047733
- Whittaker, R. J., Araújo, M. B., Jepson, P., Ladle, R. J., Watson, J. E. M., and Willis, K. J. (2005). Conservation biogeography: Assessment and prospect. Diversity and Distributions 11(1), 3–23. doi:10.1111/j.1366-9516.2005.00143.x
- Williams, S. E., de la Fuente, A., and Martínez-Yrízar, A. (2021). Long-term changes in populations of rainforest birds in the Australia wet tropics bioregion: A climate-driven biodiversity emergency. PLoS One 16(12), e0254307. doi:10.1371/journal.pone.0254307