
Abstract
Economic analysts have used trends in total factor productivity (TFP) to evaluate the effectiveness with which economies are utilizing advances in technology. However, this measure is problematic on several different dimensions. First, the idea that it is possible to separate out the relative contribution to economic output of labor, capital, and technology requires ignoring their complex interdependence in actual production. Second, since TFP growth has declined in recent decades in all of the developed market societies, there is good reason to believe that the decline is an artifact of the slower rates of economic growth that are linked to austerity policies. Third, reliance on TFP assumes that measures of the gross domestic product are accurately capturing changes in economic output, even as the portion of the labor force producing tangible goods has declined substantially. Finally, there are other indicators that suggest that current rates of technological progress might be as strong or stronger than in earlier decades.
Contemporary politics is marked by fundamental disagreements over questions of fact: Who was the victor in the 2020 presidential election? Do vaccines actually work at protecting people from COVID-19? Is the burning of fossils fuels producing catastrophic global climate change? In most of these cases, the divide is between the great majority of people with expert knowledge and political partisans.
In some cases, however, there is an epistemic divide within the expert community. For example, economists and economic journalists disagree on the question of whether the current rate of technological change is faster or slower than in the recent past. Brynjolfsson and McAfee (Citation2014) argue that new technologies such as robotics and artificial intelligence are moving so quickly that society needs fundamental reforms or we may face mass unemployment; this view is endorsed by Diamandis and Kotler (Citation2020). Andrew Yang ran in the Democratic presidential primaries in 2020 as an advocate of universal basic income as a way to cope with job-destroying technology.
On the other side, influential thinkers such as Gordon (Citation2016), Tyler Cowen (Citation2011), and Cowen and Southwood (Citation2019) have insisted that the rate of technological progress has slowed since 1970 and that is part of the reason that real incomes have also been rising slowly. Their argument is that our society has already harvested the low-hanging fruit of scientific and technological breakthroughs and it might simply be too costly or impractical to attempt to harvest the remaining fruits.
When one digs more deeply into this debate between techno-optimists and techno-pessimists, it turns out that much of the argument hinges on a single economic indicator that is little known outside of the world of economics and economic journalism. This indicator is a measure of productivity called total factor productivity (TFP).
In recent years, there have been healthy public debates about the strengths and weaknesses of some key economic indicators. For example, in the midst of the COVID-19 pandemic, it has been widely recognized that the official unemployment measures can be misleading since they do not count among the unemployed those who have given up looking for work. Analysts have emphasized the importance of looking both at the unemployment rate and trends in labor force participation that include people who have decided to drop out of the labor force for one reason or another.
Similarly, there has been broad recognition of the limitations of gross domestic product (GDP) as an economic indicator. A report by a group of prominent economists pointed out that GDP leaves out the degradation of the environment, the output of family members in the home, and various improvements in the quality of life (Stiglitz, Fitoussi, and Durand Citation2018). Moreover, GDP tells us nothing about how the things society produces are distributed. The latter is a critical omission at a time when the top 1% of households have been commanding an ever-larger share of national income.
To date, however, the TFP indicator has largely evaded these kinds of public debate even though it is widely used by economists and economic journalists. It is used as an indicator of the impact of scientific and technological advances on economic growth. It is calculated for different economies and for different economic sectors by both national and international statistical agencies and it serves as the empirical foundation of the argument in Gordon’s (Citation2016) highly influential book, The Rise and Fall of American Economic Growth.
Gordon’s thesis is that economic growth in the United States was dynamic and strong for the century between 1870 and 1970, but that growth has slowed markedly since 1970. His core support for this claim is the finding that TFP growth was almost three times greater between 1920 and 1970 (at 1.89% per year) than it was in the period from 1970 to 2014, when it slowed to 0.64% per year (Gordon Citation2016, 601).
In his conclusion, Gordon suggests that since the economy faces the headwinds of slowing technological advancement, we need to accept the likelihood that slower growth will continue into the future. Others who lack Gordon’s enthusiasm for taxation and redistribution have used his data to argue that the public needs to accept the reality of austerity. Since we have already harvested the low-hanging fruit of technological advancement, we have no choice but to accept that our standard of living will only improve slowly for the foreseeable future.
Moreover, parallel claims periodically show up in economic journalism. Martin Wolf (Citation2018), the chief economic commentator at the Financial Times, wrote a column that relies on TFP data to suggest that the impact of computer-based technologies might be far less than has been promised by techno-optimists. Larry Summers (Citation2018) argued in the Washington Post that the relatively slow growth of the Obama economy was a consequence of weak TFP growth.
All of this suggests the importance of taking a closer look at the TFP measurement. Its history is particularly interesting because it began as a way to see what parts of economic growth could not be explained by conventional measures. It started, in short, as an indicator of what could not be directly measured. But it gradually evolved into a rarely questioned measure of technological progress.Footnote1
The paper is organized into five parts. Part I explains what TFP is and how it is measured. Part II explains why the concept is conceptually flawed given the ways in which inputs of labor, capital, and technical change are intertwined. Part III seeks to explain why measured rates of TFP have been falling. Part IV extends this discussion by including several other measurement problems. Part V offers alternative data on technical change that provides additional grounds for discounting TFP data. Part VI is a conclusion.
Part I: what is TFP and how is it measured?
There is a body of work in economics that is quite critical of the TFP measure on methodological grounds. This line of argument has recently been reviewed and elaborated on by Felipe and McCombie (Citation2020). Their core argument is that both the equation and the quantities used in calculating TFP are drawn from one of the core accounting identities of national income accounting—that real value-added in the economy is equal to the sum of the labor share and the profit share. Their argument is that TFP involves no real independent measurement because the exercise is based on tautology. They suggest that what are perceived as changes in TFP are more properly understood as shifts in the relationship between the wage rate and the profit rate.
While this argument seems plausible, the approach taken here is different, albeit complementary. Rather than focusing on the mathematics of the measurement system, we will focus on the conceptual foundations of TFP and the potential empirical difficulties.
However, we also begin with the production function—one of the core tools of neoclassical economics. The basic idea is that there is a recipe for producing the different goods and services that are aggregated in the measure of GDP. For example, to produce a ton of steel requires X many parts of labor, Y amount of capital equipment, Q amount of raw material, and R amount of energy—and each of these quantities can be expressed in dollars. Economists recognize that different firms in the steel industry will be more or less efficient in the way they transform those inputs into output. They adjust for this by thinking of the aggregate production function for the industry as the weighted average of all steel-producing firms.
It follows that these different recipes for different products can in theory be aggregated together to create an aggregate production function for the whole economy; for an extended discussion of the resulting aggregation problems, see Felipe and McCombie (Citation2015). That aggregate production function will then tell you how inputs of X, Y, Q, and R will produce a certain level of GDP. In practice, however, many production functions focus only on labor and capital since they are by far the most important inputs.
But economists do not actually create the aggregate production function from the ground up since that would involve vast amounts of complex calculations. Instead, they estimate the production function by looking at how national income is divided between the share going to labor—wages, salaries, and benefits—and the return to capital as interest and profits. This is justified by the neoclassical assumption that in a system of competitive markets, each factor of production is rewarded according to its actual contribution to production.
Analysts of TFP are following a path that was pioneered by Solow (Citation1957) in his article., “Technical Change and the Aggregate Production Function.” Solow pulled together data on capital and labor inputs for the US private nonfarm economy for the years 1909–49 to estimate the importance of technical change in driving increases in labor productivity. He found that output per person-hour had essentially doubled in that period. He then divided output per year by the weighted average of the labor and capital inputs to figure out the residual—the improvements in output per hour that could not be explained by changes in the labor and capital inputs. His conclusion was that 12.5% of the improvement in labor productivity came from increased use of capital, while 87.5% came from technical change. His measure of technical change—essentially what later analysts have called TFP—rose from 1% per year in 1909 to 1.8% per year in 1949.
Solow’s calculations were admittedly crude; his goal was simply to estimate some order of magnitude of the role of technical change. Moreover, he acknowledged that estimates of the dollar value of the capital input into production raised extremely thorny issues that he was putting to the side.Footnote2 Nevertheless, his article stimulated others to develop more rigorous measurement schemes. Since 1957, a number of economists have built their reputations by refining the analysis of TFP. Moreover, different statistical agencies employ somewhat different methodologies in their reports of changes in TFP over time.
There are, for example, different strategies for estimating the labor input into the economy. Whereas Solow simply counted all person-hours of labor as equal, others have made adjustments for changes in the level of skill of the workforce. Gordon, for example, adjusts total hours of labor by an “educational productivity index” developed by Goldin and Katz (Citation2008) that reflects rising levels of educational attainment.
But despite significant differences in methodology, almost all measures of TFP for the United States show results similar to those found by Gordon—a distinct slowing in TFP growth after 1970. Gordon’s measure grew by only 0.57% annually from 1970 to 1994. This trend was interrupted in the decade between 1994 and 2004 when TFP increased to 1.03% per year and then it slid down to 0.4 per year from 2004 to 2014 (Gordon Citation2016, 575). The improvement between 1994 and 2004 is usually attributed to the impact of computerization, where technical change dramatically reduced the cost of computer power so that the technology could be used in a wide range of applications across the economy.
There is, however, a further complication to the story. The slowdown in TFP growth in the 2000s is not limited to the United States. Data provided by the Organisation for Economic Co-operation and Development (2021) shows that virtually all of the developed market economies have experienced similar slowdowns in TFP growth in the 21st century. This is somewhat surprising since it was a key finding of Goldin and Katz (Citation2008) that after 1980, the United States lost its global lead in educational attainment. In fact, Gordon relies on their findings to argue explicitly that the United States’ failure to invest more in education is a source of one of the “headwinds” that makes improvement in US TFP growth particularly difficult to achieve.
Moreover, the fact that the TFP slowdown is not confined to the United States suggests that there might be structural changes in advanced economies that have undermined the meaningfulness of this particular economic indicator. Before turning to these structural changes, it is important to analyze some of the most serious conceptual difficulties with TFP.
Part II: why is TFP conceptually flawed?
The fundamental problem with both the production function and TFP is that they treat both capital and labor as abstract and easily commensurable inputs into a production process that more or less automatically produces outputs. For many neoclassical economists, the economy would work pretty much the same way whether it is capital that hires labor or labor that hires capital. In the real world, however, it is capital that hires labor and vast amounts of effort are involved in matching workers with very specific machinery and tools and supervising them to maximize their work effort.
In actual production, whether it is goods or services, the dollar value of the capital equipment that is being used is not the key determinant of productivity; rather it is the fit between the capital equipment—including the structures—and the skills and motivation of the labor force. In fact, firms will often experiment with a new piece of capital equipment and discard it if it does not fit into the way that the workplace has been organized.
The complexity and specificity of this matching process mean that the entire exercise of attributing specific portions of output to capital, to labor, and to technical progress is an arbitrary and problematic exercise. One can see this clearly with a concrete example. In the 1970s and 1980s, the Japanese auto industry was making major inroads into the US auto market by producing cars that were both more reliable and less costly than those produced by the big three US auto companies. A major research project was set up at MIT to investigate how Japan had attained this edge (Womack, Jones, and Roos Citation1991; Kochan, Lansbury, and MacDuffie Citation1997).
The MIT researchers found that the Japanese had invented an alternative to mass production that eliminated various hidden forms of waste that were inherent in the American way of making cars. They labeled this technique as “lean production” and, in the ensuing decades, most global automobile firms have adopted some or all of the elements of the lean production system.
The core of lean production evolved out of the structural situation that Japanese auto producers confronted. The domestic market was far smaller than the American market, so firms could not emulate the US method of setting up a production line to produce hundreds of thousands of the same model of car, so they experimented with techniques that made it possible to quickly shift an assembly line from one model to another. Then instead of accumulating huge inventories of parts, they arranged for just-in-time delivery of parts so there would be no waste of unused inventories. Finally, they empowered assembly line workers to stop the line to correct errors to reduce the number of poorly assembled vehicles.
These techniques eliminated several types of waste and unnecessary expenditures. When problems with a particular model were identified, they could be quickly fixed by redesigning parts. Eliminating inventories of parts saved money and avoided the waste that occurred when parts were damaged. Short production runs also meant that production was coordinated with demand to avoid the cost of holding on to inventories of finished cars. Finally, making sure that the cars coming off the line were assembled properly eliminated the considerable waste of rework that occurred when production defects were ultimately detected.
As the MIT study found, these innovations made it possible for the Japanese to spend fewer person hours on each car while also improving the quality of the final product. So here is the question. In comparing lean production to mass production, how should one allocate the productivity gains among capital, labor, and technical progress? It is likely that the capital inputs in the two types of the factory are pretty similar. In terms of labor, the difference in pay rates and skill levels are also not that different. The key difference is that lean production workers are trained to focus on quality and empowered to stop the production line. So then should the gains be attributed to technical progress?
To be sure, lean production is a better way to make automobiles, but it does not really fit with what we usually think of as technological progress. There was not some great scientific breakthrough that made it possible to develop more effective machinery. Rather, it was trial and error over decades that lead to organizational learning and the discovery of a more effective way to combine labor and capital.
The fundamental point is that any effort to allocate the gains from lean production to the specific inputs of labor, capital, and technological advance is inherently arbitrary. Moreover, similar issues come up each time an economy develops new types of products. So, for example, as the market for computer software took off, firms had to figure out the best strategies for getting teams of programmers to collaborate effectively to produce decent products on a reasonable timeline. Or as airplanes become ever more complex, Boeing and its rivals struggle to integrate hardware and software into planes that are safe, comfortable and can be sold at a reasonable price point.
The solutions to these problems certainly require capital, labor, technology, and organizational skill, but the elements are so deeply intertwined that estimating the size of each one’s contribution is like trying to discern what part of the value of a Van Gogh painting was provided by red, blue, or yellow pigments.
Part III: why have measured rates of TFP been falling?
Nevertheless, this generic objection to the calculation of TFP does not in itself provide any leverage on why the measure was far more robust in the period from 1920 to 1970 and less robust in the half-century since 1970. Even if the theory behind the measure is misguided, there is still an empirical puzzle as to why all the developed market economies have seen reductions in TFP in the 21st century. To get at that requires digging more deeply into the specific calculations that TFP accountants employ.
As was clear in Solow’s methodology, TFP is essentially an effort to disaggregate changes in output/labor hour into what can be attributed to changes in capital inputs and what can be attributed to technical change. This means essentially that when labor productivity rises more slowly, so also will TFP. It turns out, therefore, that much of the United States’ decline in TFP that Gordon documents and the more general downturn in TFP across the OECD countries since 2000 can be explained by a decline in output/labor hour.
provides economywide measures of real GDP growth, labor productivity, and TFP for the United States for the period from 1985 to 2018. The figure clearly shows how tight the relationship is between these three variables.
Figure 1. Annual percentage change for United States: real GDP, labor productivity, and TFP. Notes: Labor productivity and TFP are from OECD Productivity Statistics. Real GDP is from BEA in 2012 dollars.
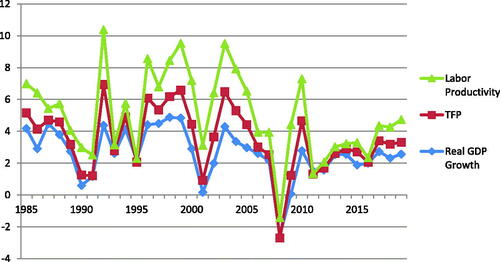
shows the relationship of these three variables for the United States and two other countries for the years from 1985 to 2019. Here again, one sees clearly that slower rates of real GDP growth correspond to slower rates of growth of labor productivity, and we know that slower growth of TFP is a direct corollary of that slowdown. The relationship between GDP growth and output per hour has been recognized by economists as Verdoorn’s (Citation1949) Law, elaborated by a Dutch economist in the 1940s. He argued that over the long term, faster growth of output produced increasing returns that show up as improving the productivity of labor. The probable mechanism is that managers tend to respond to increases in demand by finding ways to increase production from their existing supplies of labor and capital. And even as they hire more people and increase their capital stock, they continue to seek new ways to improve productivity.
Table 1. Comparing real GDP growth, labor productivity, and TFP.
In other words, much of the slowdown in TFP that Gordon bemoans can be seen as a byproduct of slower growth in inflation-adjusted output. This is particularly helpful in making sense of the decline in European TFP in the 21st century since there is abundant evidence that the European Community’s rules limiting government borrowing have played a key role in slowing growth in economic output (Blyth Citation2013; Shefner and Blad Citation2020).
Moreover, the fact that the decline in TFP is common across developed market economies points to the limitation of Gordon’s argument about the specific headwinds that the US economy faces. Even beyond slower growth, there could also be measurement issues that are related to structural changes that all advanced economies have experienced.
The reality is that what the economy produces has changed dramatically over the long time span that Gordon analyzes. Back in 1920, the bulk of what was produced in the economy consisted of tangible goods—raw materials, food, manufactured goods, buildings, and other physical infrastructure. Today, however, these tangible items have fallen to about 20% of output, and services that produce intangible outputs represent the bulk of economic activity. These services include health, education, other government services, financial services, transportation, retail and wholesale trade, business services, personal services (including barbers, beauty salons, and exercise facilities), entertainment, and social media. provides the labor force breakdown for the US economy for the year 2020.
Table 2. Employment by major industry sector (employment in thousands of jobs).
This shift creates two analytically separate problems, both of which impact measures of real economic growth. The first is the problem that Baumol (Baumol and Bowen Citation1966) identified—that there is no way to increase the productivity of a string quartet. Whatever the year, it is still going to require four people to play one of Mozart’s Milanese quartets. To be sure, the demand for live performances of classical music has not been growing. However, we have created many jobs that have a similar quality—from the greeters at big-box retailers, to childcare workers and elder care workers, to the growing number of people employed in archives and museums, and the multitudes working in medical offices handling the complexity of billing. While some of these people might indirectly contribute to output and many help improve the experience of others, their increasing numbers will inevitably be a drag on the economywide output per hour.
The second part of the problem is that service industries differ from goods-producing industries because of the difficulty of accurately measuring their inflation-adjusted output. To be sure, accurately measuring the inflation-adjusted output of goods-producing industries also presents challenges, but they are of a lesser magnitude. Moreover, there are some statistical methods that help to manage the problem with the output of physical products. With computers, for example, the continuous advances in chip technology have made it possible for each new generation of computers to be more powerful than the one before, often with lower prices. In order to capture these significant costless improvements in quality, statistical agencies use a technique called “hedonic price indicators” that adjust real prices to capture the change in the products’ capabilities over time.
This works with goods because analysts have two distinct data points to work with—the prices paid by users and the physical quantities of the specific items that were produced. With most services, either the physical quantity data does not exist or it is simply a measure of throughput. The total number of telephone calls or the number of meals served by restaurants is not as good an approximation as the total tons of a certain type of steel produced in a given year. For hospitals, for example, data might be available on the amount of revenue, the number of patient days spent in the hospital, and the numbers of different medical procedures, but there is no obvious way to separate out inflationary price rises from improvements in the quality of the product.
The problem is particularly severe for most government-provided services that are distributed, like public schooling, without users paying any fees. Since there are no market prices, statistical agencies make the output equal to the total costs that the government pays to its employees. The consequence is that there is no possible productivity gain: output is equal to the input. It follows that as government employment increased over the last century in developed market economies, this rise inevitably dragged down both GDP/hour of labor and TFP.
However, even for the services where there is a market price, the measures of output are problematic. For wholesale and retail trade, the prevailing method is to measure the sector’s output as equal to gross margins—the difference between the price that the product was obtained for and the price at which it is sold (Bureau of Economic Analysis Citation2020, ch. 5). However, these margins are likely to vary with the strength or weakness of demand and the amount of competition in a particular sector.
One can see the problem by thinking of the rise of Amazon and other internet retailers. Amazon has probably reduced margins for most conventional retailers who are operating at a much smaller scale.Footnote3 With books, for example, where Amazon alone now accounts for close to 50% of all sales, it seems likely that retail margins have fallen across the whole industry since Amazon routinely undersells the standard retail price. However, declining retail margins for books would translate into falling output for the retail sector. Moreover, retail productivity would likely fall even faster since Amazon has also hired tens of thousands of warehouse workers and delivery people. Since there were 17.4 million people employed in the retail trade sector in 2020, this would exert even further downward pressure on aggregate growth in labor productivity and correspondingly on TFP.
Similar problems also exist for measuring the output of financial services, including banking, insurance, and investment services. There have been repeated changes in the way that the financial sector’s output is measured in GDP (Christophers Citation2013) since there is no obvious way to assess the value of the services that banks, insurance companies, or brokerage firms provide to consumers. Here again, statisticians use some throughput measures that have a tenuous relation to what we think about as output in sectors producing tangible outputs.
In seeking to explain the declines in TFP, economists often address the possibility that output is not being correctly measured. However, they generally reject this hypothesis (Byrne, Fernald, and Reinsdorf Citation2016). They argue that to explain a long-term decline in TFP, errors in measurement would have to be getting worse each year and they see no reason to believe that. Moreover, the methodology of national income accounting is based on the idea that the estimates of economic output are equal to the incomes generated in producing that outcome. Since the latter calculation is put together from estimates of personal income and business profits, there is a built-in method to make sure that the estimates of total output are plausible. So long as the estimate of total output is reasonably sound, it does not really matter if the estimate for retail trade is too low or if the estimate for banking is too high. All that really matters for the purpose of calculating aggregate labor productivity and TFP is that the aggregate output measure is reasonably accurate.
To make the case that the decline in TFP is the result of mismeasurement, one has to argue that both inflation-adjusted GDP and national income have been rising faster than the official data suggests. On the output side, the explanation would involve two elements. First, for manufactured goods—from automobiles to cellphones to solar panels—the argument is that output data have been distorted by continuous costless quality changes.Footnote4 These quality improvements result in overstating inflation and hence underestimating real GDP growth. Second, in a number of service sectors, there have been real changes in the value of what consumers receive that are not captured in our current measures.
One obvious example would be healthcare outlays that now account for close to 18% of GDP. The reality is that up until the COVID-19 pandemic, average lifespans and, more importantly, quality-adjusted life years have been improving. In the 70 years from 1900 to 1970, longevity at age 70 increased by 2.7 years while in the 46 years from 1971, the increase was a more impressive 3.7 years (US Department of Health and Human Services Citation2019, Table 21). Moreover, one study shows that there were continuing improvements in the number of these years that were spent unburdened by illness or disability between 1987 and 2008 (Stewart, Cutler, and Rosen Citation2013). In short, the official data has been underestimating the real output of the health care sector.Footnote5
Another example has been addressed by Daly (Citation2014), who shows that the public sector’s contribution to GDP has been significantly underestimated because of the lack of output measures. His estimates include nearly $800 billion in benefits each year from our surface transportation system as well as health savings and other benefits of $22 trillion from the regulations that resulted from the Clean Air Act over twenty years.
Finally, the services available on the internet and from smartphones have produced misleading declines in GDP. Outlays for developing photographs and mailing them to friends have dropped precipitously, but electronic images and social media facilitate a vast expansion in people’s capacity to communicate in this way. Even before COVID-19, outlays for movie tickets were stagnant or rising slowly, but with a monthly subscription to Netflix, people can watch a movie every night.
However, if real GDP growth has been systematically underestimated in recent decades, it follows that national income has comparably been underestimated. There are, however, two dynamics that could cause analysts to understate gross domestic income. First is the shifting of profits to overseas locations by US-based corporations that is discussed in the next section. Since the profitability of some of those firms has been steadily rising, it is not implausible that the share of their global profits that are falsely attributed to other jurisdictions has been on an upward trajectory.
Second, wealthy individuals are able to disguise earned income as capital gains income that is taxed at a lower rate. This is important because capital gains income is excluded from estimates of national income. Partners in hedge funds and private equity have been able to use the carried interest provision in the tax code to have their massive earnings treated as capital gains rather than profits. Moreover, corporations have significantly increased their use of buybacks to return funds to shareholders. These buybacks now amount to more than $500 billion per year. These share buybacks mean that corporate executives who are provided generous stock options and stock grants are able to appropriate a significant share of corporate profits, but they are able to report the resulting income to the IRS as capital gains from stock sales (Palladino and Lazonick Citation2021).
The obvious question is how much more would GDP growth need to be for a recent year for the TFP statistic to be 1% higher than what was previously reported. Such an increase would eliminate most of the decline in TFP that Gordon has focused on. The answer is that GDP, which is currently on the order of $20 trillion, would need to be 1% higher each year than is currently estimated. All that would be needed is for the statisticians to be missing an additional $200 billion of output and income each year.
Part IV: other measurement problems
There are some further problems in the measurement of TFP. The first one is particular to the methods used by Gordon in his calculation of TFP. Gordon makes TFP equal to real GDP divided by the weighted average of the capital and labor inputs into the economy. He defines the labor input as 0.7-times the total hours of labor with an adjustment for the level of educational attainment. The capital input is 0.3 times the total stock of capital with some small adjustments from government data. To obtain the weighted average of these two quantities he multiplies them and then takes the square root of that number. He adjusts for inflation by calculating everything in 1950 dollars.Footnote6
The use of 0.7 and 0.3 means that Gordon is assuming that the production function has not changed over a century despite the fact that there have been such dramatic changes in what the economy produces. This choice seems totally arbitrary and unwarranted. In fact, the data show that the labor share has declined significantly in the United States since 1970 and it has also fallen across all of the developed market economies since 2000. How far it has fallen is a matter of considerable debate since this calculation is inherently complex. The wage share incorporates the compensation of top executives who might be appropriating some of the firm’s profits in their pay packages. Nevertheless, there is little dispute that in 2014 or 2021, the labor share in the United States is closer to 55% than it is to 70% (Aum and Shin Citation2020).
The reasons for the growth of the capital share are sharply debated, especially because most measures of new private fixed investment, both net and gross, have been trending downward. In other words, it does not seem as though the increase in capital’s share is necessary to finance higher levels of real investment. But regardless of the reasons for the rising capital share, it has an impact on the calculation of TFP.
A second problem is shared by Gordon and most other measures of TFP. It has to do with shifts in the measurement of the capital being mobilized in the economy. Historically, the capital was understood as consisting of physical entities such as buildings and machinery. However, over time, there has been growing recognition by economists and statistical agencies that there is an increasing share of the available capital stock that is made up of intangibles including software, databases, and various forms of intellectual property such as patents, trademarks, and proprietary business practices.
Over time, these statistical agencies have made efforts to include estimates of some of these types of intangible capital in their national income accounts. When they issue revised data that includes a previously neglected type of intangible capital within their measures of aggregate investment, it is in the nature of things that their estimates for recent years will be more accurate than their measures for years in the past.
There were, for example, investments in software in the 1950s to be used on early mainframe computers. However, it seems likely that the efforts by statisticians 50 or 60 years later to estimate retrospectively the size of those investments will produce underestimates. Moreover, some of the work that managers and managerial consultants were doing in the 1950s was the equivalent of software outlays since they were trying to establish the most efficient flows of work for both offices and factory floors. But those outlays would not be counted in the revisions.
But as analysts seek to include estimates in the national accounts of various forms of intangible capital, it seems that some of the improvements in output that in earlier years had been captured in the TFP measure are now being credited to capital.Footnote7 It follows logically that as greater outlays for intangible capital are included in estimates of total capital investment, then TFP will correspondingly fall. For example, when software outlays were not included in the category of capital, much of the contribution of computerization to increased output ended up as TFP. But once the software was included, its contribution got counted as part of the capital.
A third problem also cuts across all estimates of TFP. It is particularly important because, historically, the most important advances in output/person hour have occurred in manufacturing. This is true for three reasons. First, we have fairly reliable estimates of manufacturing output since we have both dollars paid and quantities. Second, there is no “string quartet problem” in manufacturing since artisanal production of luxury goods is tiny in comparison to total manufacturing output. Third, technological and organizational advances have made huge and continuous improvements in output per labor hour possible.
It follows that as the weight of manufacturing in the economy falls, so too will output per labor hour and TFP. But there is an additional problem created by globalization and the strategies by which transnational corporations attempt to minimize their tax bills. This issue is particularly acute in the United States, but giant firms based in Europe are following the same playbook.
The basic idea is that the globalization of production has given firms the opportunity to book their profits in locations with the lowest tax rates. This involves several distinct strategies. First, as parts and final products move across global boundaries, firms can manipulate prices to shift profits to low-tax jurisdictions. Second, it has become common for firms to shift their intellectual property to offshore subsidiaries in low-tax countries and then claim that a large share of the profits is returned on those portfolios of intellectual property (Block Citation2021).
The consequence is that there is then a growing divergence between the domestic value-added in manufacturing that is reported to government authorities and the actual domestic value-added. The most obvious case is that of Apple’s iPhone. Most of the critical research and development work on these phones is done in the United States, while the production of parts and final assembly are done abroad.
Both the US foreign trade statistics and national income statistics are distorted since the entire value-added of the iPhones imported into the United States is attributed to foreign countries. Moreover, the United States does not get credited for the value-added of all those iPhones that are sold elsewhere in the world. According to one analysis, each iPhone imported into the United States adds $332.75 to the US deficit, but actually, $228.75 of that amount is value-added that was produced in the United States but not counted as part of GDP (Xing Citation2019). A similar distortion occurs for much of the output of the pharmaceutical industry that develops their products in US labs and then produces them abroad (Setser Citation2020). Moreover, foreign transnational corporations have learned to play this same game.
This pattern helps to explain the US Bureau of Labor Statistics’ finding that from 2004 to 2016, the TFP of the US manufacturing sector declined at an annual rate of 0.3% (Brill, Chansky, and Kim Citation2018). Since real manufacturing output continued to rise in this period, the likely explanation is that TFP is dragged down because the hours of those research and development workers are included in the denominator but their contributions to output are recorded only in overseas locations.
Part V: alternative data on technical change
The verdict here is that it is unwarranted to use the trends in TFP to claim that there has been a decline in technological progress in the United States or other developed market economies. While Solow’s pioneering work in the 1950s played an important role in focusing the attention of economists on things that were not easily measured, employing the same approach today in a very different economic environment results only in distortion and confusion.
Fortunately, there are other indicators that can be brought to bear on the question of how today’s rate of technological progress compares to that of the past. One indicator is the diffusion curve that trace how long it takes for a new consumer product to be taken up by a high percentage of households. After all, the economic impact of new technologies depends not just on their availability in the marketplace, but whether the potential purchasers—consumers or businesses—opt to buy them.
This figure from the Our World in Data website shows that the rate of diffusion of new products has been much faster in the decades since 1980 than it was earlier in the 20th century (the sources for the data are provided at the website) (). It took, for example, 40 years for 90% of households to have access to electricity, whereas smartphones reached 80% of households within 12 years of Apple’s introduction of the iPhone. To be sure, many of the more recent innovations are less costly than electrification or the automobile, but it still took 27 years for radios to reach 90% of households.
Figure 2. Share of US households using specific technologies, 1903–2019. Source: OurWorldinData.org. See also Desjardins (Citation2018). Much of the data were part of The CHAT Data Set (Comin and Hobijn Citation2009).
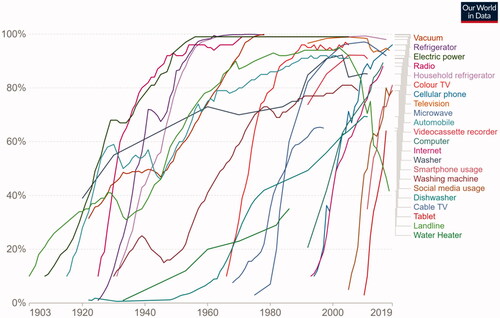
One obvious point that flows from the chart is the importance of price declines in driving rapid diffusion. The automobile, for example, jumped from 10% of households in 1915 to 49% in 1925, but then did not reach 90% of households until 1989. This fits with data compiled by Gordon (Citation2016, 153) that shows that the quality-adjusted price of Ford’s Model T car dropped from $722 in 1910 to $196 in 1923—a decline of 73%. However, after that the quality-adjusted prices leveled off.
Similarly, Nordhaus (Citation1998) shows that the cost of a unit of lighting fell at a 3.2% a year rate from 1910 to 1930 as tungsten substituted for carbon filaments, but then the rate of improvement slowed. Numerous studies have shown that factories experienced a dramatic increase in productivity in the 1920s and 1930s as electrification allowed for much more flexible usage of space since machines were no longer tethered to one central source of energy (Field Citation2011) With chemicals and petroleum, the shift from batch production to continuous process plants made possible significant price declines, but again prices tended to stabilize after that.
A search in both producer price data and consumer price data finds few other examples of sustained declines in prices of specific manufactured goods in the period from 1920 to 1970. In contrast, in the more recent period, the maturation of mass production technologies has made possible continuous improvements in manufacturing productivity across a wide range of products. Some of this can be attributed to the shift from mass production to lean production that has both squeezed out various forms of waste and created an expectation of continuous improvement (Womack, Jones, and Roos Citation1991). But it is also facilitated by the decline in cost of computing power that in turn facilitates increasingly sophisticated automation. This shift means that rapid price declines are occurring for a wide range of manufactured goods.
The computer itself is the most dramatic example, as the rapid advances in the processing capacity of microchips have facilitated amazing declines in the cost of computer power. Gordon presents evidence of this that cuts against his argument for a slowing rate of technological progress. He compared the computing power of a Cray-1 supercomputer in 1976 with a $449 Levono laptop in 2014. The resulting annual rate of price decline for computing power is a staggering 41% per year (Gordon Citation2016, 444). This, in turn, has facilitated ongoing price declines in a range of different products that incorporate computer chips.
Another startling case is that of solid-state lighting that relies on light-emitting diodes (LEDs). This technology required decades of development after some discoveries in the early 1960s, with the first commercial adoptions beginning around 2008. The technology uses only about 10% of the energy of equivalent incandescent bulbs and the lifespan of the bulbs is 15 to 25 times greater. With these advantages, rapid growth in demand has made dramatic cost reductions possible. One popular model cost $25.00 in 2009 and fell to less than $2.50 in 2019. So just between 2016 and 2018, installed penetration of LED bulbs rose in the United States from 14.9% to 30% (Elliot and Lee Citation2020, 2). Most analysts expect the diffusion curve to rise dramatically even if further reductions in price do not occur since the lifetime cost of these bulbs represents significant savings over the major alternatives.
Other examples are not as spectacular as these two, but they also show significant price declines. A recent study reports that quality-adjusted prices of smartphones declined 16% per year from 2010 to the first quarter of 2018, and the price customers paid for service fell 7.7% per year from 2010 to 2017 (Aizcombe, Byrne, and Sichel Citation2019). The cost of installed solar modules per watt of electricity fell from $2.00 a watt in 2010 to 20 cents a watt in 2020 (International Energy Agency Citation2020). The cost per megawatt-hour of wind power fell from $111 in 2009 to $44 in 2020 (Bloomberg Green Citation2020). The cost of batteries for utilities fell by 70% just between 2015 and 2018—declining from $2,152 per kilowatt-hour to $625 (US Energy Information Administration Citation2020). Battery packs for electric cars were $1,100 per kilowatt-hour in 2010, but they fell to $137 per kilowatt-hour in 2020, and further significant declines are expected as scientists and engineers work feverishly on new battery technologies (Bloomberg NEF Citation2020).
Given their importance in the battle against climate change, pricing data on these green technologies are easy to find. However, this is not true for a series of other cutting-edge technologies that are increasing in economic importance. The use of industrial robots is expanding rapidly, but there is little in the way of publicly available data on pricing trends. The market for 3D printers has also grown enormously with prices declining sharply. A buyers’ guide for consumers in 2015 listed models ranging in price from $599 to $2,200 (Hipolite Citation2015). In March 2021, Amazon’s prices ranged from $239 to $679. It seems highly likely that the models used by the industry have seen similar price declines.
Yet another fairly pedestrian but easily overlooked example are the cordless power tools used on construction sites and for household repairs and remodels. Driven largely by advances in battery technology, these tools have become significantly more powerful and more convenient to use over the last decade, while prices have fallen. For example, a DeWALT impact driver kit (used for driving screws) with two 3-amp hour batteries was introduced in April 2012 at $349, but it was available for $289 in April 2021 with two 4-amp hour batteries—providing 33% more use time between charges. Moreover, a model for more casual users with two 2-amp hour batteries was selling for $149 at the same time.
Part VI: conclusion
The point of this paper is not to claim that the United States and other developed market economies are healthy. On the contrary, these countries are pursuing growth models that are out of date, they are responding far too slowly to catastrophic climate change, and they have not taken sufficient steps to reverse the growing inequality of income and wealth. These economic failures have undermined public confidence and have produced deep political polarization that is a threat to the survival of democratic institutions.
However, it is of great importance to diagnose economic problems correctly, or else there is a risk that one will follow policies that will make things even worse. This paper has argued that the diagnosis that is widely accepted by economists that these economies are suffering from a sharp slowdown in long-term productivity growth is deeply flawed. First, TFP is not a reliable measure of technical progress and, second, there are multiple strong reasons to believe that the reported declines of TFP are the result of mismeasurement of other economic indicators.
Finally, there are other sources of data that suggest that slowing technical progress is not happening. Both the diffusion curves of innovation and price trends for a wide range of products suggest that technical progress might well be faster now than it was in the first half of the 20th century.
Acknowledgments
The author is grateful for comments from Matthew Keller, Jan Kregel, and Marian Negoita.
Notes
1 For an earlier analysis and critique of widely used measures of labor productivity, see Block and Burns (Citation1986).
2 The problem of measuring capital inputs was a central issue in the Cambridge capital controversy between Cambridge, Massachusetts and Cambridge, England (Harcourt Citation1972).
3 To be sure, there have been huge consumer gains that come from the convenience of shopping online and speedy delivery, but neither of these gains is calculated in GDP.
4 Some examples are provided below in part V.
5 To be sure, even before COVID-19, there was the increase in morbidity and mortality among white men without a college education, as reported by Case and Deaton (Citation2020).
6 The use of the 1950 base year is unique to Gordon since he assessing TFP growth over the entire period from 1920–2014. However, the choice of base year has significant consequences since it locks in the weights of different products in that year. For example, agricultural production represented a much larger share of output in 1920 than in 2014. This is the reason that statistical agencies routinely shift to a more recent base year or use a chain weighted methodology that adjusts each year’s number to the previous year.
7 Crouzet and Eberly (Citation2021) make a somewhat different argument. They argue that some of the business services that are currently treated as intermediate goods in the national accounts should be seen instead as capital investments. However, to explain the slower rate of TFP growth, they have to combine this correction with an increase in markups resulting from more monopoly power. Since Philippon (Citation2019) argues that the monopoly problem is more severe in the United States than in Europe, this approach would not explain the generality of the TFP decline.
References
- Aizcombe, A. D., M. Byrne, and D. E. Sichel. 2019. “Getting Smart about Phones: New Price Indexes and the Allocation of Spending between Devices and Service Plans.” NBER Working Paper 25645, National Bureau of Economic Research, Cambridge, MA.
- Aum, S., and Y. Shin. 2020. “Why is the Labor Share Declining?” Federal Reserve Bank of St. Louis Review 102 (4):413–428.
- Baumol, W., and W. Bowen. 1966. Performing Arts: The Economic Dilemma. Cambridge, MA: MIT Press.
- Block, F. 2021. “How Inequality Distorts Economics.” Dissent 68 (2):42–50. (Spring):doi:https://doi.org/10.1353/dss.2021.0037.
- Block, F., and G. A. Burns. 1986. “Productivity as a Social Problem.” American Sociological Review 51 (6):767–780. doi:https://doi.org/10.2307/2095366.
- Bloomberg Green. 2020. “Solar and Wind Cheapest Sources of Power in Most of the World.” April 28. https://www.bloomberg.com/news/articles/2020-04-28/solar-and-wind-cheapest-sources-of-power-in-most-of-the-world
- Bloomberg NEF. 2020. “Battery Pack Prices Cited Below $100/kWh for the First Time in 2020, While Market Average Sits at $137/kWh.” December 16. https://about.bnef.com/blog/battery-pack-prices-cited-below-100-kwh-for-the-first-time-in-2020-while-market-average-sits-at-137-kwh/
- Blyth, M. 2013. Austerity: The History of a Dangerous Idea. New York: Oxford University Press.
- Brill, M., B. Chansky, and J. Kim. 2018. “Multifactor Productivity Slowdown in U.S. manufacturing.” July. https://www.bls.gov/opub/mlr/2018/article/multifactor-productivity-slowdown-in-us-manufacturing.htm.
- Brynjolfsson, E., and A. McAfee. 2014. The Second Machine Age. New York: Norton.
- Bureau of Economic Analysis. 2020. NIPA Handbook: Concepts and Measures of National Income Accounting. Suitland, MD: Bureau of Economic Analysis. https://www.bea.gov/resources/methodologies/nipa-handbook.
- Byrne, D., J. Fernald, and M. Reinsdorf. 2016. “Does the United States Have a Productivity Slowdown or a Measurement Problem?” Brookings Papers on Economic Activity Spring 2016 (1):109–157. doi:https://doi.org/10.1353/eca.2016.0014.
- Case, A., and A. Deaton. 2020. Deaths of Despair and the Future of Capitalism. Princeton, NJ: Princeton University Press.
- Christophers, B. 2013. Banking across Boundaries. New York: Wiley-Blackwell.
- Comin, D.and B. Hobijn. 2009. “The CHAT Datasetie .” NBER Working Paper 15319., National Bureau of Economic Research, Cambridge, MA.
- Cowen, T. 2011. The Great Stagnation. New York: Dutton.
- Cowen, T., and B. Southwood. 2019. “Is the Rate of Scientific Progress Slowing Down?” https://www.agrarheute.com/media/2020-01/innovation_scientific_progress.pdf
- Crouzet, N., and J. C. Eberly. 2021. “Intangibles, Markups, and the Measurement of Productivity Growth.” NBER Working Paper 29109, National Bureau of Economic Research, Cambridge, MA.
- Daly, L. 2014. “What is Our Public GDP?” July. https://www.demos.org/research/what-our-public-gdp-valuing-government-twenty-first-century-economy
- Desjardins, J. 2018. “The Rising Speed of Technological Adoption.” February 14. https://www.visualcapitalist.com/rising-speed-technological-adoption/
- Diamandis, P., and S. Kotler. 2020. The Future is Faster than You Think. New York: Simon and Schuster.
- Elliot, C., and K. Lee. 2020. “Adoption of Light-Emitting Diodes in Common Lighting Applications.” https://www.energy.gov/sites/default/files/2020/09/f78/ssl-led-adoption-aug2020.pdf
- Felipe, J., and J. S. L. McCombie. 2015. The Aggregate Production Function and the Measurement of Technical Change. Cheltenham, UK: Edward Elgar.
- Felipe, J., and J. S. L. McCombie. 2020. “The Illusions of Calculating Total Factor Productivity and Testing Growth Models: From Cobb-Douglas to Solow and Romer.” Journal of Post Keynesian Economics 43 (3):470–513. doi:https://doi.org/10.1080/01603477.2020.1774393.
- Field, A. 2011. A Great Leap Forward: 1930’s Depression and U.S. Economic Growth. New Haven, CT: Yale.
- Goldin, C., and L. Katz. 2008. The Race between Education and Technology. Cambridge: Harvard University Press.
- Gordon, R. 2016. The Rise and Fall of American Growth. Princeton, NJ: Princeton University Press.
- Harcourt, G. C. 1972. Some Cambridge Controversies in the Theory of Capital. Cambridge, UK: Cambridge University Press.
- Hipolite, W. 2015. “Cheapest, Best & Most Reliable Desktop 3D Printers — 3DPrint’s 2015 Buyers Guide.” April 7. https://3dprint.com/55890/buy-3d-printer-cheap/
- International Energy Agency. 2020. “Evolution of solar PV module cost by data source, 1970–2020.” Updated June 30. https://www.iea.org/data-and-statistics/charts/evolution-of-solar-pv-module-cost-by-data-source-1970-2020.
- Kochan, T., R. D. Lansbury, and J. P. MacDuffie. 1997. After Lean Production. Ithaca, NY: Cornell.
- Nordhaus, W. 1998. “Do Real-Output and Real-Wage Measures Capture Reality? The History of Lighting Suggests Not.” Cowles Foundation Paper No. 957, Yale University, New Haven, CT.
- Organisation for Economic Co-operation and Development. 2021. Compendium of Productivity Indicators. Paris: OECD.
- Palladino, L., and W. Lazonick. 2021. “Regulating Stock Buybacks: The $6.3 Trillion Question.” Roosevelt Institute Working Paper, Roosevelt Institute, New York.
- Philippon, T. 2019. The Great Reversal: How America Gave up on Free Markets. Cambridge, MA: Harvard University Press.
- Setser, B. W. 2020. “When the Services Trade Data Tells You More about Tax Avoidance than About Actual Trade.” April 22. https://www.cfr.org/blog/when-services-trade-data-tells-you-more-about-tax-avoidance-about-actual-trade.
- Shefner, J., and C. Blad. 2020. Why Austerity Persists. Cambridge, UK: Polity.
- Solow, R. 1957. “Technical Change and the Aggregate Production Function.” Review of Economics and Statistics 39 (3):313–320.
- Stewart, S. T., D. M. Cutler, and A. B. Rosen. 2013. “US Trends in Quality-Adjusted Life Expectancy from 1987 to 2008: Combining National Surveys to More Broadly Track the Health of the Nation.” American Journal of Public Health 103 (11):e78–e87. doi:https://doi.org/10.2105/AJPH.2013.301250.
- Stiglitz, J., J.-P. Fitoussi, and M. Durand. 2018. Beyond GDP: Measuring What Counts for Economic and Social Performance. Paris: OECD.
- Summers, L. 2018. “No ‘Obamasclerosis’ Was Not a Real Problem for the Economy.” February 28. https://www.washingtonpost.com/news/wonk/wp/2018/02/28/no-obamasclerosis-wasnt-a-real-problem-for-the-economy/
- US Department of Health and Human Services. 2019. “Life Expectancy, by Age, Race, and Sex.” National Vital Statistics Report 68 (7):53.
- US Energy Information Administration. 2020. “Utility-scale battery storage costs decreased nearly 70% between 2015 and 2018.” October 23. https://www.eia.gov/todayinenergy/detail.php?id=45596.
- Verdoorn, J. P. 1949. “On the Factors Determining the Growth of Labor Productivity.” Italian Economic Papers 2:59–68.
- Wolf, M. 2018. “The Long Wait for a Productivity Resurgence.” June 8. https://www.ft.com/content/8bea636a-6d78-11e8-852d-d8b934ff5ffa
- Womack, J. P., D. T. Jones, and D. Roos. 1991. The Machine That Changed the World. New York: HarperCollins.
- Xing, Y. 2019. “How the iPhone Widens the U.S. Trade Deficit with China.” National Graduate Institute for Policy Studies Discussion Paper 19-21, National Graduate Institute for Policy Studies, Tokyo.