

Abstract
We introduce a novel diagnostic tool to improve the performance of public services. We propose a method to compute performance/productivity ratios, which can be applied as soon as data on production units' outcomes and resources are available. Assuming outcome improvement as the main objective in a public services context, these ratios have an intuitive interpretation: values below unity indicate that better outcomes can be attained through weaker resource constraints (pointing at scarcity of resources) and, conversely, values above unity indicate that better outcomes can be achieved with the given resources (pointing at unexploited production capacity). We demonstrate the practical usefulness of our methodology through an application to secondary schools, where we account for outlier behaviour and environmental effects by using a robust nonparametric estimation method. Our results indicate that in most cases schools' performance improvement is a matter of unexploited production capacity, while scarcity of resources is a lesser issue.
Acknowledgements
We are grateful to participants of the 2015 EWEPA conference in Helsinki, the Economics in Education Workshop at Maastricht University, Efficiency in Education workshop in London, VII EFIUCO at Universidad de Córdoba, Seminar participants at University of Lille, Knox Lovell, Ernest Reig, Hervé Leleu, and Finn Førsund for useful comments.
Disclosure statement
No potential conflict of interest was reported by the author(s).
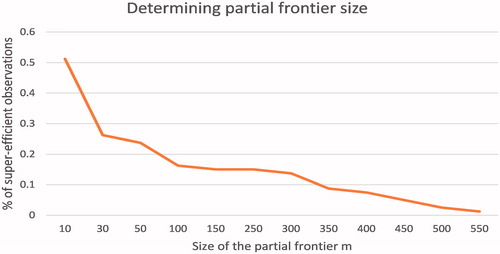
Figure A1. Determining partial frontier size.
Notes
1 For an overview, see Cherchye et al. (Citation2007).
2 Among factors affecting public service performance, Witte and Geys (Citation2013) emphasize the role of consumers’ coproduction, in an application to public libraries.
3 We adapt the traditional approach, applied to firm’s production, to the particular case of public services. For this purpose, the output-input setting is replaced by the outcome-resource setting.
4 We remark that we may also have used alternative returns-to-scale assumptions. One motivation for assuming constant returns-to-scale is that it allows for an intuitive (dual) interpretation of our productivity-performance measures in terms of “benefit-of-the-doubt” weighting, which we explain in Section 3.2. Another motivation, more practical, is that outcomes and resources will be generally represented by indicators, ratios or per-capita values, as in the example presented in next sections. Anyway, the methodology can be straightforwardly extended to the case of productivity measurement under variable returns-to-scale, which allows for distinguishing between scale efficiency and pure technical efficiency. We will illustrate this by means of a simple numerical and graphical example at the end of this section.
5 See also Lovell and Pastor (Citation1999), for a detailed discussion on productivity measurement with constant input. Lovell et al. (Citation1995) used the helmsman interpretation in the context of macroeconomic policy evaluation. Here, we use the same idea in the context of output assessments of micro-DMUs. As a specific example, our following empirical application will use the idea for a school performance assessment that focuses on educational outputs per pupil. Formally, our performance based method is the same is the one used by Collier, Johnson, and Ruggiero (Citation2011) to aggregate outputs while assuming constant input. A main difference between the two approaches, is that, like in Lovell et al. (Citation1995), we interpret the solution value of (8) directly as a relative performance measure, whereas Collier et al. (Citation2011) use (8) as a measure of aggregate output, which is then incorporated into a second-stage regression-based analysis of technical efficiency.
6 For brevity, we do not include a full formal treatment of the variable returns-to-scale case. The variable returns-to-scale DEA model for productivity analysis was first introduced by Banker et al. (Citation1984) and has been widely used in the literature. We refer to Banker et al. (Citation1984) for formal details.
7 We remark that the ratio formulation of actually expresses this measure as maximizing “profitability” (i.e. revenue over cost), a concept that is often used in the literature on productive efficiency measurement [see, for example, Grifel-Tatjé and Lovell (Citation2015)].
8 At this point, we remark that alternative methods to deal with heterogeneous operational environments have been proposed in a DEA context. See, for example, Banker and Morey (Citation1986) and Ruggiero (Citation1996), who specifically focused on controlling for exogenous/socio-economic conditions in a public sector context (similar to our own application in Section 4). In fact, the conditional efficiency approach builds further on insights from Banker and Morey (Citation1986) and Ruggiero (Citation1996) While we here choose to use the robust order-m procedure of Daraio and Simar (Citation2005, Citation2007), it is worth noting that our method is also easily adapted to these alternative DEA-based procedures.
9 It should be noted that this application uses a CRS assumption. There is a rich literature that compares constant (CRS), variable (VRS), decreasing (DRS) and/or increasing (IRS) returns-to-scale models in educational applications. Overall, this literature is inconclusive on the most appropriate model specification and on the existence of returns to scale in education (see, for example, Schiltz & De Witte, Citation2017, for a recent overview). We consider the use of alternative returns to scale assumptions as scope for further research.
10 As robustness checks we have redone the analysis for alternative selections of inputs and outputs: excluding the variable “time devoted to math exercises” from the resources as this variable shows a large variation and a wide spread between the minimum and maximum values; dropping the school average on the math exercises as output given the large difference among schools on this variable; adding a (positively oriented) score for inequality in abilities among the students as output by using the inverse of the standard deviation of the exercise scores. This shows that our above results are quite robust. This carries over to the qualitative conclusions that we draw from them, also regarding school characteristics that relate to unexploited production capacity or resource constraints hampering the schools’ performance (see below). The results are available upon request.
11 We do not report these analyses for compactness, but the results are available upon request.