
 ?Mathematical formulae have been encoded as MathML and are displayed in this HTML version using MathJax in order to improve their display. Uncheck the box to turn MathJax off. This feature requires Javascript. Click on a formula to zoom.
Abstract
The Chinese government announced to cut its carbon emissions intensity by 60%–65% from its 2005 level. To realize the national abatement commitment, a rational allocation into its subunits (i.e. industries, provinces) is eagerly needed. Centralized allocation models can maximize the overall interests, but might cause implementation difficulty and fierce resistance from individual subunits. Based on this observation, this article will address the carbon emission abatement quota allocation problem from decentralized perspective, taking the competitive and cooperative relationships simultaneously into account. To this end, this article develops an integrated cooperative game data envelopment analysis (DEA) approach. We first investigate the relative efficiency evaluation by taking flexible carbon emission abatement allocation plans into account, and then define a super-additive characteristic function for developing a cooperative game among units. To calculate the nucleolus-based allocation plan, a practical computation procedure is developed based on the constraint generation mechanism. Further, we present a two-layer way to allocate the CO2 abatement quota into different sub-industries and further different provinces in Chinese manufacturing industries. The empirical results show that five sub-industries (Processing of petroleum, coking and processing of nuclear fuel; Smelting and pressing of ferrous metals; Manufacture of non-metallic mineral products; Manufacture of raw chemical materials and chemical product; Smelting and pressing of non-ferrous metals) and two provinces (Guangdong and Shandong) will be allocated more than 10% of the total national carbon emission abatement quota.
1. Introduction
Along with the economic development in the past few decades, the climate change has become one of the most important international issues. The global warming would cause some disastrous consequences and threaten the survival and development of all human beings (Feng, Chu, Ding, Bi, & Liang, Citation2015; Guo et al., Citation2010; Wu, Chu, & Liang, Citation2016). To protect and govern the environment, the greenhouse gas emission abatement has been put on the agenda. In fact, many countries and international organizations have exerted continuous efforts to reduce their greenhouse gas emissions in reacting to global warming (Soytas & Sari, Citation2009; Yu, Wei, & Wang, Citation2014). Furthermore, it is widely acknowledged that the primary component of greenhouse gases is CO2, which contributes more than 50% to the atmospheric warming (IPCC, Citation2007), thus special attention should be paid to the CO2 emissions and its control strategy. As the largest energy consumer and carbon emitter in the world, China faces an enormous pressure to cut its carbon emission level (Wang, Zhang, Wei, & Yu, Citation2013; Wei, Ni, & Du, Citation2012; Yu et al., Citation2014; Zhang, Wang, & Da, Citation2014). In June 2015, at the Climate Change Summit held in Paris, the Chinese government submitted its voluntary carbon emissions abatement plan to United Nations, which committed to reduce its CO2 emissions by 60%–65% per unit gross domestic product (GDP) from the 2005 level.1 It is a great responsibility and contribution that China has announced for the humankind and international society. However, to realize the reduction commitment, a reasonable allocation of the national goal to different industries and provinces is of vital importance and necessity. For this reason, we would study the carbon emission abatement (CEA) quota allocation problem in China.
The carbon emission abatement allocation is a special resource allocation problem, which uses certain mechanisms to allocate the total CEA quota across the decision making units (DMUs) (Sun, Wu, Liang, Zhong, & Huang, Citation2014). It is notable that lots of previous articles have addressed the CEA allocation problem, while almost all studies adopt a centralized perspective (Chiu, Lin, Su, & Liu, Citation2015; Gomes & Lins, Citation2008; Lozano, Villa, & Brännlund, Citation2009; Wu, Du, Liang, & Zhou, Citation2013). The optimal allocation mechanism from the perspective of the central decision maker will indeed maximize the overall interests, but also ignore the interests of individuals. That is to say, the centralized allocation plan would harm some DMUs’ interests and cause suboptimal results for these DMUs (Feng et al., Citation2015). There is no doubt that in practice the centralized allocation plan might cause implementation difficulty and fierce resistance from DMUs and even a possibility of departures from the centralized allocation plan. For instance, the United States has announced to withdraw from the 2015 Paris Agreement saying that “the Paris accord will undermine (the U.S.) economy” and “puts (the U.S.) at a permanent disadvantage” (Chakraborty, Citation2017). Under this circumstance, the solution is to develop decentralized approaches. Based on this observation, we will try to address the carbon emission abatement quota allocation problem from a decentralized perspective.
Note in addition that there exist competitive and cooperative relationships simultaneously among related units in determining the carbon emission abatement quota allocation plan. On one hand, since the abatement quota allocated to each DMU is regarded as a constraint restricting its carbon emission permits (Wu et al., Citation2016), the individual DMU would compete with each other to minimize its allocated carbon emission abatement amount. On the other hand, some DMUs may also have enough incentives to establish alliances with others to achieve collaborative carbon emission abatement (Zhang et al., Citation2014), as the cooperation of carbon emission abatement is helpful to share relevant resources and curb the costs while cutting the carbon emission level. It is clear that considering the competitive and cooperative relationships among all DMUs simultaneously would provide valuable insights and generate a carbon emission abatement quota allocation plan that is more acceptable and stable. However, few works has been done on this topic. Motivated by this idea, a game theoretical approach would be of vital significance, and it is possible to cause satisfied results for each DMU through using game-based approaches.
In this article, we will use the famous nonparametric mathematical programming method, data envelopment analysis (DEA), to address the carbon emission abatement quota allocation problem in Chinese manufacturing industries. The most significant advantage of DEA methodology is that it requires no pre-specification of production functions and can also handle desirable and undesirable outputs simultaneously, which is highly fit with the circumstance of carbon emission abatement allocation problem. We consider that the national commitment to reduce its carbon emissions intensity by 60%–65% is essentially a total amount of carbon dioxide emission abatement quota. To address it, we develop an integrated cooperative game DEA approach to explore the carbon emission abatement allocation issue in Chinese manufacturing industries. To this end, we first investigate the relative efficiency evaluation by taking the flexible carbon emission abatement quota allocation plans into account. Analysis shows that any DMU can be efficient and all DMUs can also be simultaneously efficient with a common set of weights and allocation plans. Further, it involves in a phenomenon called the egoist’s dilemma (Nakabayashi & Tone, Citation2006) in determining a unique carbon emission abatement quota allocation plan, which implies also the game space. Afterwards, we define a super-additive characteristic function and develop a practical computation procedure to calculate the nucleons solution based on the constraint generation mechanism of Hallefjord, Helming, and Jørnsten (1995). Finally, we apply the integrated cooperative game DEA approach to allocate the carbon emission abatement quota in Chinese manufacturing industries in 2012 through a two-layer way, and analysis shows that the cooperative game DEA approach can generate a well-defined and acceptable allocation plan upon negotiations. In particular, five sub-industries (Processing of petroleum, coking and processing of nuclear fuel; Smelting and pressing of ferrous metals; Manufacture of non-metallic mineral products; Manufacture of raw chemical materials and chemical product; Smelting and pressing of non-ferrous metals) and two provinces (Guangdong and Shandong) will undertake more than ten percent of the total national carbon emission abatement commitment quota.
The major contribution of this article can be summarized as bellows: first, we develop an integrated cooperative game DEA approach, which takes the competitive and cooperative relationships among all DMUs into account. As a result, the generated allocation mechanism is considered as fair enough and all DMUs have motivations to accept the allocation scheme in the sense of compromise. Second, we present a two-layer allocation framework, namely, it allocates the national abatement goal to different manufacturing industries in the first stage, and in the second stage it further allocates the abatement share of each industry into different provinces. This article is different from existing literature that focuses mainly on provincial or regional allocation studies. Third, we applied the integrated cooperative game DEA approach to the empirical study of Chinese manufacturing industries. Hence, it presents a feasible way for Chinese government to realize its carbon emission abatement commitment that is submitted to United Nations ahead of the Paris Climate Change Summit, 2015. On the theoretical aspect, this article develops a new approach to address the carbon emission abatement quota allocation problem from a decentralized perspective, which is different from existing literature with mainly centralized models. On the application aspect, it solves a real-world problem and provides practical findings and implications.
The remainder of this article is organized as follows. In Section 2, we survey a relevant literature review. In Section 3, we introduce the real-world problem and summarize mathematical notations. Later, Section 4 proposes a cooperative game DEA approach and also a computation procedure of nucleolus solution based on the constraint generation mechanism. Afterwards, we present a two-layer empirical study of allocating the carbon emission abatement quota in Chinese manufacturing industries in Section 5. Eventually, Section 6 concludes this article and provides some perspectives.
2. Literature review
This article will address the carbon emission abatement allocation problem in Chinese manufacturing industries through integrating data envelopment analysis and game theory. Hence, there are mainly three relevant research streams, i.e. DEA and game DEA approach, DEA-based resource allocation study, and environmental performance and carbon emission abatement research.
2.1. DEA and game DEA approach
DEA, known as a famous nonparametric method to evaluate the relative efficiency of peer DMUs that convert multiple inputs into multiple outputs, was first introduced by Charnes, Cooper, and Rhodes (Citation1978) with constant returns to scale (CRS) assumption and further extended by Banker, Charnes, and Cooper (Citation1984) with variable returns to scale (VRS) assumption. The underlying logic of DEA methodology is that there exists an ideal performance (i.e. efficient production possibility surface) that can be used to assess the relative efficiency of individual DMUs. To this end, a convex combination of a set of comparable and homogeneous DMUs is calculated to construct an efficiency frontier. Then each DMU can be projected onto the frontier, and the certain DMU is evaluated by comparing itself to its projection on that frontier.
Since its seminal work in Charnes et al. (Citation1978) and Banker et al. (Citation1984), the DEA methodology has attracted more and more attention from scholars all over the world, and the DEA methodology and its applications have been extensively studied in the literature (Emrouznejad, Citation2014; Emrouznejad & Yang, Citation2018). On the application aspect, the literature has witnessed DEA-based approaches in different areas from public sector such as universities, hospitals, sports, and disaster relief operations to private sector such as banks, supply chains, manufacturing industries, and mergers and acquisitions (An, Meng, Ang, & Chen, Citation2018; Li, Liang, Li, & Emrouznejad, Citation2018a; Li, Zhu, & Zhuang, Citation2018e). On the methodology aspect, many innovative concepts and models have been proposed to extend and enrich the DEA theory. For example, Sexton, Silkman, and Hogan (Citation1986) suggested using peer appraisal to replace traditional self-evaluation in cross-efficiency approach, and peer DMUs’ optimal relative weights are used to evaluate other DMUs’ efficiency. Andersen and Petersen (Citation1993) proposed a novel super-efficiency approach, which excludes the evaluated DMU while constructing the efficiency frontier. Both the cross-efficiency approach and super-efficiency approach are supposed to improve DEA’s discrimination power among efficient DMUs. In view of the fact that traditional DEA methods do not take DMUs’ internal production system into account, Färe and Grosskopf (Citation1996) proposed a network DEA model which opens the “black-box.” Another two most important approaches are directional distance function (Chung, Färe, & Grosskopf, Citation1997) and slacks-based measure (Tone, Citation2001), both of which relax the proportional input extraction and output expansion requirement. The former requires the input extraction and output expansion in a given direction, while the later immediately estimates the input and output slacks without explicit direction. Additionally, some integrated approaches are also proposed. For example, Tone and Tsutsui (Citation2009) firstly extended the lacks-based measure (SBM) model to network situations. Li, Shi, Emrouznejad, Xie, and Liang (Citation2018g) proposed a network SBM approach for evaluating the environmental performance of Chinese industrial systems. Arabi, Munisamy, and Emrouznejad (Citation2015) proposed a slacks-based distance function approach and applied it to calculate the Malmquist–Luenberger productivity index. Kao and Liu (Citation2018) studied the cross-efficiency measurement and decomposition for both series and parallel production system.
The traditional DEA methodology maximizes the individual utility without considering the impacts of other DMUs’ decisions, however, in circumstances associated with conflicts of interests each DMU must pay attention to other DMUs involved and corresponding impacts, that is, all DMUs should make a consensus and transigent decision. After all, there always exist direct or indirect competitions among all DMUs (Liang, Wu, Cook, & Zhu, Citation2008a). To take the competition and cooperation into account, some game DEA approaches and its applications have been studied. Banker (Citation1980) provided a two-person zero-sum game to interpret the DEA efficiency, and that work was further extended to a constrained version by Banker, Charnes, Cooper, and Clarke (Citation1989). Liang et al. (Citation2008a) proposed a DEA game cross efficiency method to address the non-uniqueness of cross efficiency scores, and proved that the optimal cross-efficiency scores construct a Nash equilibrium. Further, Wu, Liang, Yang, and Yan (Citation2009a) and Wu, Liang, Yang (2009b) adopted a Nash bargaining game and a cooperative game, respectively, to improve the traditional cross efficiency methods. Liang, Cook, and Zhu (Citation2008b) proposed both a centralized cooperative game DEA model and a non-cooperative game DEA model for evaluating series-linked two-stage network processes. Omrani, Beiragh, and Kaleibari (Citation2015) combined principal component analysis technique with conventional DEA models to reduce the number of inputs and outputs, and further combined the bargaining game with DEA model to obtain more realistic efficiency results. Li, Zhu, Chen, and Xue (Citation2018b) unified the unbalanced evaluation standard in cross-efficiency method, and further proposed a game-like iterative procedure to obtain the optimal balanced cross-efficiency scores. Omrani, Shafaat, and Alizadeh (Citation2019) integrated data envelopment analysis and cooperative game for evaluating energy efficiency of transportation sector in Iran. To see more studies on game DEA approaches the readers are encouraged to Chen, Liang, and Yang (Citation2006), Du, Liang, Chen, Cook, and Zhu (Citation2011), Wu and Liang (Citation2012), etc.
This article will propose an integrated cooperative game DEA approach for the carbon emission abatement quota allocation problem. The proposed approach is also based on a directional distance function concept, and we consider both desirable outputs and undesirable outputs simultaneously in the game framework.
2.2. DEA-based resource allocation study
Resource allocation problem has traditionally become one of the most important application areas of DEA methodology (Fang & Zhang, Citation2008; Korhonen & Syrjänen, Citation2004; Li, Song, Dolgui, & Liang, Citation2017b). Among the literature, most studies are brought in a centralized environment (Asmild, Paradi, & Pastor, Citation2009; Lozano & Villa, Citation2004). For example, Fang and Zhang (Citation2008) allocated variable resources to DMUs by maximizing both the total efficiency from centralized decision-making environment and the individual efficiency for each DMU. Lotfi, Noora, Jahanshahloo, Gerami, and Mozaffari (Citation2010) and Lotfi, Nematollahi, Behzadi, Mirbolouki, and Moghaddas (Citation2012) addressed the centralized resource allocation problem using enhanced Russell models. Given a capital budget constraint, Lozano, Villa, and Canca (Citation2011) proposed a series of centralized DEA models for individual and collective output target setting, input reallocation and additional input acquisitions. Fang (Citation2013) proposes a generalized DEA model that integrated the Lozano and Villa (Citation2004) method and the Asmild et al. (Citation2009) model as a special case to address the resource allocation problem. Pachkova (Citation2009) introduced transfer costs of resources into the resource allocation problem, which is realized by a price matrix. Lozano (Citation2014) proposed a SBM model for fixed cost and common revenue allocation in a centralized environment. Fang (Citation2016) proposed a centralized resource allocation approach based on revenue efficiency, and the allocation plan was determined by maximizing the total output revenue. Ding, Chen, Wu, and Wei (Citation2018) addressed the centralized fixed cost allocation problem by considering technology heterogeneity for different DMUs. An, Chen, Xiong, Wu, and Liang (Citation2017) studied the intermediate output setting problem by considering fairness concern in a two-stage system.
There are also some studies that use parametric DEA approaches for resource allocation problems. For these studies, the efficiency frontier is supposed to have a specific hyperbolic shape. Avellar, Milioni, and Rabello (Citation2007) made the first attempt to allocate a new fixed input across DMUs by considering a spherical frontier. Interestingly, Avellar et al. (Citation2007) obtained a straightforward formula to calculate the resource amount for each DMU, and all DMUs will be finally efficient. Then Avellar, Milioni, Rabello, and Simão (Citation2010) extended the same approach to another case where an already existing input resource will be reallocated across a set of DMUs. Milioni, de Avellar, Rabello, and De Freitas (Citation2011b) further extended the Avellar et al. (Citation2007) approach from input resource allocation to output target setting, and the authors studied both new fixed output setting and existing output resetting. Guedes, Milioni, de Avellar, and Silva (Citation2012) proposed a new adjusted spherical frontier DEA model for input allocation, which has an important feature called coherence, implying that the generated allocation plan will be relatively stable and will not change with a small data modification. Milioni, de Avellar, and Gomest al. (2011a) proposed another parametric DEA model where the efficiency frontier has an ellipsoidal shape. Silva, Milioni, and Teixeira (Citation2018) generalized the previous parametric DEA approaches for fairly allocating a new and fixed output under a centralized environment. Their new model can not only incorporate value judgments, but also be useful under increasing, constant, and decreasing returns to scale (RTS) properties. As Li, Zhu, and Liang (Citation2019b) commented that the parametric DEA approaches can solve the resource allocation problem very easily, but the key focus is that whether it is acceptable to predefine a hyperbolic frontier or not.
Except for the above studies, some studies integrated the resource allocation and target setting into one problem. For example, Athanassopoulos (Citation1995) applied goal programming and DEA to integrate target setting and resource allocation in multilevel planning problems. They extended the traditional efficiency-based orientation of DEA model to generate resource allocation and target setting scheme. Bi, Ding, Luo, and Liang (Citation2011) studied the resource allocation and target setting for parallel production systems, and the authors tried to maximize the efficiency scores for all DMUs as well as the worst DMU under a set of common weights. Li et al. (Citation2017b) addressed the resource allocation and target setting problem on the basis of two principles of efficiency invariance and common weights. In general the authors would give two possible allocation plans, with one emphasizing on efficiency invariance and the other on common weights.
Fixed cost is also a special resource that has attracted lots of research attention (Beasley, Citation2003; Cook & Kress, Citation1999). The first DEA-based fixed cost allocation research was proposed by Cook and Kress (Citation1999), where two basic principles, efficiency-invariance and input Pareto optimality, were suggested. The efficiency-invariance principle is significant since the fixed allocation should not be utilized by any DMU to improve its performance. On the contrary, Beasley (Citation2003) claimed that all DMUs will find the allocation plan be acceptable as it can realize an efficiency of one as compared with peer DMUs. Further, Beasley (Citation2003) proposed a nonlinear problem to maximize the average efficiency score across all DMUs. Li et al. (Citation2013) and Si et al. (Citation2013) proved that all DMUs can be simultaneously efficient by considering the allocated cost as a new independent input and maximize the efficiency score as possible. Li et al. (Citation2019b) proposed a novel non-egoistic principle for allocating a total fixed cost in a decentralized environment, which suggests that each DMU should propose its non-egoistic allocation proposal by allocating the maximal cost to itself. Li, Zhu, and Chen (Citation2019) studied the fixed cost allocation problem by taking the internal two-stage network into account, and all DMUs’ operation sizes are used to generated the final allocation plan such that it is consistent with the current input consumptions and output productions from a size point of view.
Note in particular that some game-DEA approaches were also proposed for the resource allocation problem. Nakabayashi and Tone (Citation2006) studied a phenomenon called the “egoist’s dilemma,” and proposed a series of games to allocate cost and benefit. Du, Cook, Liang, and Zhu (Citation2014) considered all DMUs as players, and suggested a game cross-efficiency iterative procedure to allocate fixed cost and input resource. The allocation plan will be obtained until all DMUs have the maximal cross-efficiency score (as the authors themselves indicated that the score will be one). Li, Zhu, and Liang (Citation2018d) developed a game-DEA cross efficiency approach for allocating a total fixed cost across a set of competing DMUs, in which the final allocation plan is derived from the fair Shapley values and associated common weights. Li, Li, Emrouznejad, Liang, and Xie (2019c) also integrated DEA and cooperative game theory to allocate a total fixed cost. Both Li et al. (Citation2018d, Citation2019c) provide us good lesson and reference, while this article will consider a reduction allocation problem and integrate undesirable outputs with desirable outputs in the cooperative game DEA allocation approach.
This article will also address a kind of resource allocation problem, but the target is on the carbon emission abatement quota. Such a problem not only involves undesirable outputs, but also is an output reduction allocation problem. In addition, this article will use an integrated cooperative game DEA approach to generate the carbon emission abatement quota allocation scheme. More importantly, this article adopts a decentralized perspective for the carbon emission abatement quota allocation problem, which is different from existing literature with mainly centralized perspectives.
2.3. Environmental performance and carbon emission abatement research
The last research stream focuses on the study of environmental performance and carbon emission abatement, which has received substantial research attention recently (Feng et al., Citation2015; Yu et al., Citation2014; Zhou & Ang, Citation2008; Zhou, Ang, & Poh, Citation2008). Herein we focus only on DEA-based studies for reference. The traditional DEA methodology assumes that outputs have to be maximized and inputs have to be minimized (Scheel, Citation2001), whereas when we address the environmental performance there always exist undesirable outputs (Chung et al., Citation1997), which is desired to be minimized. Through modelling undesirable outputs, lots of articles have addressed the environmental performance. Reinhard, Lovell, and Thijssen (Citation2000) used both stochastic frontier approach and DEA approaches to estimate the environmental efficiency scores for Dutch dairy farms. Korhonen and Luptacik (Citation2004) measured technical efficiency (the relation of desirable outputs to inputs) and ecological efficiency (the relation of desirable outputs to undesirable outputs), and then combined the two efficiencies to assess the eco-efficiency analysis of 24 power plants in a European country. Bian and Yang (Citation2010) extended the Shannon-DEA procedure to obtain a comprehensive efficiency measure that simultaneously appraises DMUs’ resource and environment performance. Further, the authors applied their approach to address the resource and environment efficiency evaluation problem of 30 Chinese provinces. Zhou, Ang, and Poh (Citation2006), Zhou, Poh, and Ang (Citation2007), and Zhou et al. (Citation2008) proposed a series of environmental DEA technologies to measure environmental performance. For example, Zhou et al. (Citation2006) proposed two slacks-based efficiency measures for environmental performance, with one being a composite index with a higher discriminating power, and the other being used to estimate the impacts of environmental regulations. Zhou et al. (Citation2008) proposed a non-radial DEA approach for environmental performance evaluation, which involves a non-radial DEA-based model for multilateral environmental performance comparisons and a non-radial Malmquist environmental performance index for modeling the change of environmental performance over time. Song, Fisher, Wang, and Cui (Citation2018) addressed the environmental performance evaluation in big data context. Sueyoshi and Yuan (Citation2015) evaluated the regional environmental performance by incorporating PM2.5 and PM10 as undesirable outputs, and results show that the Chinese government should distribute more resources to northwestern cities. Wu, Zhu, Yin, and Song (Citation2017) used an improved DEA approach for evaluating the Chinese regional total-factor energy and environmental efficiency, in which the authors considered the total-factor energy and environmental efficiency as a joint production framework involving both non-energy inputs and energy inputs, as well as desirable outputs and undesirable outputs.
To improve environmental performance and relieve the impacts of global warming, many countries and international organizations have conducted efforts to reduce its carbon emission levels, and the studies in the literature are also abundant. Sun et al. (Citation2014) proposed two DEA models to allocate the carbon emissions among several paper mills, with one from the centralized perspective and another from the individual perspective. Feng et al. (Citation2015) proposed a two-step procedure to obtain a comprehensive CEA allocation. For the first step, the author proposed improved DEA-based centralized allocation models under VRS and CRS assumptions, and then they used two compensation schemes to generate the centralized allocation schemes within the second step. Wu et al. (Citation2016) proposed a DEA-based closest target technique to set target and allocate the CEA amount among 20 APEC economies. In 2009, the Chinese government announced to cut its carbon emission intensity by 40%–45% from the 2005 level, Yi, Zou, Guo, Wang, and Wei (Citation2011), Wei et al. (Citation2012), Wang et al. (Citation2013), Yu et al. (Citation2014), and Zhang and Hao (Citation2015) proposed a series of provincial allocation mechanism to realize the reduction commitment. Yi et al. (Citation2011) considered the per capita GDP, accumulated fossil fuel related CO2 emissions and energy consumption per unit of industrial added value as indicators of emission reduction capacity, responsibility and potential, respectively, and further allocated the national CO2 intensity reduction target to different provinces according to its different indicator values. Wei et al. (Citation2012) applied an extended SBM model to estimate the CO2 reduction potential and marginal abatement costs for Chinese 29 provinces, and further proposed an abatement capacity index using weighted equity and efficiency indexes to realize the regional allocation of carbon dioxide abatement in China. Wang et al. (Citation2013) used an improved zero sum gains DEA optimization model to generate an efficient emission allowance allocation scheme on provincial level for China by 2020. Yu et al. (Citation2014) addressed the provincial allocation of carbon emission reduction targets in China based on particle swarm optimization algorithm, fuzzy c-means clustering algorithm, and Shapley decomposition approach. Then Yu et al. (Citation2014) clustered all provinces into four classes based on relevant carbon emission factors and concluded that more carbon emission reduction amount would be allocated to provinces with large total emissions and high emission intensity. Emrouznejad, Yang, and Amin (Citation2019) studied the same problem of this article, while they used an inverse DEA approach and neglected the competitive and cooperative relationships among different sub-level industries and provinces.
If the total reduction amount is set to zero, the CEA allocation problem would be reduced to a carbon emission reallocation problem. Lozano et al. (Citation2009) proposed a three-phase approach to allocate the emission permit, namely, maximizing aggregated desirable outputs, minimizing undesirable total emissions and minimizing the consumption of input resources. Gomes and Lins (Citation2008) reformulated a zero sum gains (ZSG) DEA model to reallocate CO2 emissions. Further, Wang et al. (Citation2013) and Chiu et al. (Citation2015) used ZSG-DEA models to allocate CO2 emissions permits in some regions. Miao, Geng, and Sheng (Citation2016) used a non-radial ZSG-DEA model to allocate CO2 emissions into different provinces in China. Readers can refer to Zhou and Wang (Citation2016) for an overview of carbon dioxide emission allocation studies.
Additionally, some game DEA approaches are proposed to address the CEA allocation problem. Wu et al. (Citation2013) proposed a bargaining DEA approach to generate the reduction scheme. In their article, all DMUs compete with each other to minimize its reduction in carbon emission permits, while the central authority maximizes the overall efficiency. In addition, the undesirable output (i.e. carbon emissions) in that article was considered as an input. Filar and Gaertner (Citation1997) used the Shapley value solution of cooperative game theory to allocate carbon quotas among four regions. Yu et al. (Citation2014) and Zhang et al. (Citation2014) applied also the Shapley value concept when they addressed regional allocation of carbon emissions quota in China, but these studies took the Shapley value as a supplementary tool rather than the main method, and didn’t base on the cooperative game theory.
This article bases itself upon a realistic and real problem of industrial and provincial allocation of national carbon emission abatement quota in China. We will study the industrial allocation scheme as well as regional allocation scheme, which is different from existing literature with only provincial allocation. We will propose an integrated cooperative game DEA approach by taking the game relationship among sub-level industries and provinces into account and is supposed to obtain fair and stable allocation results.
3. Problem description and mathematical notation
3.1. Problem background
In June 2015, in the climate conference in France, Chinese Premier Li Keqiang announced China’s latest voluntary reduction commitment: the CO2 emissions will reach the peak at about 2030 and seek to reach it as early as possible. China aims to cut its greenhouse gas emission intensity by 60%–65% (per unit of gross domestic product (GDP)) from the 2005 level. In manufacturing industries, the Gross Industrial Output Value (GIOV) plays the same role as GDP for the country. Thus we can propose CO2 reduction goal as CO2 emission/GIOV decreases 60% to 65% based on the level of 2005. The indicators of CO2 emission/GIOV in China from 2004 to 2012 are listed in the following (CO2 emission is in the unit of thousand tons, Gross industrial output value is in the unit of billion Yuan).
Table 1. The CO2 emission/GIOV in China from 2004 to 2012.
It should be noted that, in order to ensure the comparability, we transform the value of GIOV to constant price in 2010 using the Consumer Price Index (CPI) of China, as shown in the last column of . The CPI data is derived from OECD statistics (2010). Therefore in this article we set the goal to decrease 60% to 65% of the level of CO2 emission/GIOV in 2012 based on that in 2005. Thus CO2 emission/GIOV in 2012 should be in the range of [0.4073, 0.4655]. However the real ratio of CO2 emission/GIOV reaches 0.5109. If Chinese government achieves the goal of the CO2 emission in 2012, the CO2 emission in 2012 should be [3296467.6860, 3767391.6410] in the unit of thousand tons. However, the real amount of CO2 emission in manufacturing industries in China is 4134711.6380 (thousand tons). Thus the CO2 emission reduction gap should be [367319.9970–838243.9520] in the unit of thousand tons, and this is the national allocation target that will be addressed in this article.
Based on the above government goal, we use a two-layer dataset to allocate the CO2 emission quota into different sub-level industries and then further allocate them into different provinces. The first layer is to allocate the national reduction quota to different sub-level manufacturing industries, say
where
denotes different sub-level manufacturing industries such that
The second layer is to further allocate the reduction quota for each industry
into different provinces, say
where
denotes different provinces. Finally, it holds that
The problem studied in this article is how to allocate the total national government goal into different sub-level industries and then further different provinces in an equitable manner. The motivation of this article is the decentralized perspective and game relationship among different sub-level industries and different provinces. Therefore, we try to propose an integrated cooperative game DEA approach for this task.
3.2. Mathematical notations
For a better understanding of this article and subsequent mathematical problems, here we give a comprehensive summary of all mathematical notations in .
Table 2. Notation summary.
4. Mathematical model
4.1 Preliminary
For a mathematical modelling purpose, we follow a common framework in DEA literature to consider a set of n homogeneous and comparable peer DMUs, with each consuming m inputs to produce s outputs. Denote the input and output variables for as
and
respectively. The production possible set (PPS) with VRS assumption and free disposability of inputs and outputs can be expressed as formula (1).
(1)
(1)
where
is the intensity variable used for constructing the efficiency frontier, and the constraint
implies the VRS assumption. Based on the PPS in formula (1), the following model proposed by Banker et al. (Citation1984) can be used to estimate the relative efficiency score of
(2)
(2)
Model (2) estimates the maximal proportional output expansion yet remaining the input consumption. If it is impossible to proportionally increase outputs, then the optimal objective function of model (2) would be one (namely, ) and the evaluated DMU would be identified as DEA-efficient. Otherwise,
is inefficient for cases where
Note in particular that model (2) will reduce to the first DEA model, known as Charnes-Banker-Rhodes model (Charnes et al., Citation1978), if we withdraw the constraint
and impose only non-negative requirementss on intensity variables.
It is notable that model (2) considers only traditional outputs, which means that outputs are maximized as possible (Scheel, Citation2001), while undesirable outputs like waste or pollution are also generated frequently in the production process (Färe, Grosskopf, Lovell, & Pasurka, Citation1989; Seiford & Zhu, Citation2002). With the consideration of undesirable output for
a core task is identifying methods to handle undesirable outputs (Song et al., Citation2018). The existing research can be mainly divided into two groups in terms of disposability assumptions (Chen & Delmas, Citation2012; Li, Li, Zhao, & Zhu, Citation2018h; Song, An, Zhang, Wang, & Wu, Citation2012). The first group considers that the undesirable outputs are joint weakly or strongly disposable with desirable outputs, hence it adopts weak or strong disposability assumption (Seiford & Zhu, Citation2002; Zhou, Ang, & Wang, Citation2012). The second category thinks that the undesirable outputs can be reduced by reducing output production or increasing input consumption, which implies natural and managerial disposability assumption (Li, Zhu, & Zhuang, Citation2018e; Sueyoshi & Goto, Citation2012a, Citation2012b). With deep consideration for our application in this article, we will use the most common used weak disposability assumption. To this end, the PPS assuming free disposability of inputs and desirable outputs and weak disposability of undesirable outputs can be written as below (Kuosmanen, Citation2005; Kuosmanen & Podinovski, Citation2009).
(3)
(3)
As compared with the traditional PPS in formula (1), in formula (3) both desirable outputs and undesirable outputs of are weighted by the non-disposed intensity variable
whereas the inputs of
are weighted by the sum of the disposed intensity variable
and non-disposed intensity variable
In addition, the VRS assumption is ensured by summing the total disposed intensity variable
and non-disposed intensity variable
to one, namely,
Based on the PPS in formula (3), we can propose a directional distance function (DDF) model with weak disposability assumption to calculate maximal proportional desirable output expansion and undesirable output reduction simultaneously. When is under consideration, the above idea is formulated as model (4).
(4)
(4)
In model (4), the direction vector is set as In addition,
is a measure of inefficiency on both desirable output expansion and undesirable output reduction, thus an optimal efficiency score can be calculated as
where
is the optimal solution of
and derived from model (4). It is clear that
is no more than one and no less than zero, thus the optimal efficiency score
ranges from zero to unity.
The following model (5) is a dual of model (4).
(5)
(5)
Here
and
are dual variables derived from model (4), and are also unknown decision variables in model (5). Note in particular that this article focuses on the carbon emission which is a kind of undesirable output, thus it is required that at least
or
otherwise the undesirable output will make no sense if it holds
and
simultaneously. Without loss of generality, we assume that
and
and another case (
and
) can be studied in a similar way. Each dual variable measures the level of efficiency increment due to a unit increase on according input-output bundle. According to the dual theory, it holds
for all
and the efficiency score can also be computed as
4.2. Performance evaluation with flexible CEA allocation plan
Now consider that the central government would cut its total carbon dioxide emissions by R. Then the problem comes out of how to reduce the undesirable output from peer DMUs in a fair way (Wu et al., Citation2013). Suppose that each will be reduced an amount of
from its current carbon emissions level
such hat
(6)
(6)
The above EquationEquation (6)(6)
(6) guarantees that the individual reduced amounts
precisely sum to the total carbon emissions abatement quota R.
To address the performance evaluation with flexible CEA allocation plan, the feasibility of CEA allocation plan should be investigated in advance. To guarantee that the reduced amounts is feasible such that the reduced operating units fall within the PPS which is constructed by observed DMUs and defined in Formula (3), it must hold that
for any
namely,
(7)
(7)
Here and
are unknown values and free. Note in particular that by inserting
on desirable outputs, we are able to estimate the feasible undesirable output reduction level through changing desirable outputs within given PPS. This idea fits with the observation in practice that reducing undesirable outputs is usually associated with affecting the desirable outputs.
It is clear that the minimum reduction amount of is zero, which means that all DMUs must reduce its carbon emission amount or it cannot increase its carbon emission amount anymore. Further, the maximum emission reduction level of
donated as
can be computed by model (8). Additionally, by setting
we can estimate the feasible undesirable output reduction level yet remaining unreduced desirable outputs. If
is free we will estimate the feasible undesirable output reduction level by sacrificing desirable outputs.
(8)
(8)
Therefore, the feasible reduction amount of any
would be placed within the interval
such that
Without loss of generality, we assume that the total reduction quota R can be fully covered by the sum of all maximum emission reductions, that is,
otherwise the carbon dioxide emissions abatement goal R is considered as infeasible within the current PPS and the central government should adjust its carbon dioxide emissions abatement goal. In addition, we have Theorem 1.
Theorem 1.
Proof.
See Appendix A.
The above Theorem 1 is an intuitive result. The underlying logic behind Theorem 1 is that any DMU can completely reduce its undesirable outputs at the cost of removing its desirable outputs. In other words, all DMUs have potentials to reduce its undesirable outputs level within the PPS. Therefore, in this article we consider all DMUs as carbon emission abatement targets.
With consideration of the carbon emission abatement allocation plan model (5) is rewritten as model (9) to calculate the possible efficiency score of
(9)
(9)
However, model (9) is a nonlinear programming, therefore we can transform it into a linear programming problem as given in model (10).
(10)
(10)
Solving model (10) once for each determines an optimal efficiency score with flexible carbon emission abatement allocation schemes. Suppose that the optimal solution of model (10) is
when
is evaluated, then the possible efficiency is calculated as
which is associated with a carbon emission abatement allocation scheme
Based on model (10), some useful and valuable conclusions are developed.
Theorem 2.
The optimal objective function of model (10) is always zero.
Proof.
See Appendix B.
Theorem 2 implies that can be identified as DEA efficient through determining a flexible carbon emission abatement allocation scheme and selecting a set of optimal relative weights. Put it differently, by incorporating the carbon emission abatement allocation plan into efficiency evaluation it is possible for any DMU to separately maximize its efficiency score to one and realize the efficient status through laying itself on the efficiency frontier of the PPS defined by the observed DMUs. This provides also a possibility to propose an efficient allocation scheme of the total carbon emission abatement quota. To this end, we first provide Theorem 3 as below.
Theorem 3.
All DMUs can be simultaneously efficient with a certain carbon emission abatement allocation scheme under a set of common weights.
Proof.
See Appendix C.
Theorem 2 suggests that a certain DMU can be efficient through incorporating flexible carbon emission abatement allocation plans, while Theorem 3 steps further that there exist carbon emission abatement allocation schemes that can make all DMUs simultaneously efficient under a set of common weights. Based on this observation, we can have an efficient allocation set which contains all carbon emission abatement allocation schemes that can make all DMUs simultaneously efficient. The insight behind this finding is that any DMU has enough incentives to accept such efficient allocation schemes as it will benefit from the allocation process to improve its efficiency assessment result. It is also similar with the efficiency maximization pursuance of Beasley (Citation2003) who argued that “each DMU can clearly see that… it is a fair and equitable one–it enables them to achieve maximum efficiency in comparison to their peers using exactly the same weights.” The efficient allocation set is given by Corollary 1.
Corollary 1.
The efficient carbon emission abatement allocation scheme can be denoted as following System (11) under a set of common weights:
(11)
(11)
Proof.
See Appendix D.
It is clear that there are variables in System (11), but only
equations. Therefore, there exist flexibilities to determine a unique carbon emission abatement allocation scheme. Based on the efficient carbon emission abatement allocation scheme presented in System (11), the following model (12) is developed to calculate the maximal/minimal carbon emission abatement level of each
(12)
(12)
Notably, we add an additional constraint in model (12), which is used to guarantee that the total desirable outputs are unreduced yet reducing the undesirable outputs. After all, a certain carbon emission abatement allocation scheme is unacceptable if it sacrifices desirable outputs, and a real instance is the withdrawal of United States from the 2015 Paris Agreement (Chakraborty, Citation2017). It is clear that the maximal carbon emission abatement level from
is
otherwise not all DMUs can be simultaneously efficient with the carbon emission abatement allocation scheme. Similarly, it must ensure that the carbon emission abatement level of
is at least
Model (12) not only shows the efficient carbon emission abatement interval of DMUs, but also shows a phenomenon like egoist’s dilemma (Nakabayashi & Tone, Citation2006), implying that
Then the problem comes out of how to generate a unique carbon emissions abatement scheme using game-theoretical models.
4.3. An integrated cooperative game DEA approach
Here in this subsection we develop an integrated cooperative game DEA approach for the carbon emission abatement quota allocation problem. To this end, we first construct a coalition of n DMUs. Then the input-output vector of coalition
can be denoted as
and
where for
it holds
and
is a non-negative vector with each component
being zero or one. The coalition vector
indicates the establishment of coalitions of n DMUs. For example,
is the original
represents the coalition of
and
and
represents the grand coalition of all DMUs.
For any coalition we can formulate model (13) to calculate its collective max/min carbon emission abatement level.
(13)
(13)
Based on the optimal solution and objective function of model (13), we give a characteristic function of coalition as follows:
Definition 1.
For any subset the characteristic function is calculated as
The first term represents the sum of individual maximum carbon emission abatement amount of DMUs in coalition K, while the second term
represents the maximum collective carbon emission abatement level of coalition K. It is clear that the formula
measures the improvement potentials by establishing the coalition K. The characteristic function promises an assurance level. Traditionally, we assigns zero to empty set,
Further, we have
where the latter equation is the result of full cover of the total carbon emission abatement quota. Theorem 4 shows the super-additive property of the characteristic function, which promises the potential gains from cooperation and the feasibility to allocate the total carbon dioxide emission abatement quota from the perspective of cooperative game framework.
Theorem 4.
The characteristic function satisfies super-additive, that is, for any two coalitions
and
, it holds
Proof.
See Appendix E.
The super-additive property implies that all DMUs would like to participate into the grand coalition and it is possible to persuade DMUs into an agreement to generate a carbon emission abatement allocation scheme. The next problem is how to solve the game and accordingly generate the carbon emission abatement allocation scheme.
4.4. Nucleolus-based solution and computation procedure
There are many solution concepts for the cooperative game, such as kernel, core, nucleolus, stable set, bargaining set, Shapley value, τ-value, etc. (Lozano, Citation2012; Nakabayashi & Tone, Citation2006). The decision maker should select the game solution depending on the context in which the problem is located. In this article, we take the nucleolus-based solution as an example to show how to obtain the game-based allocation plan. In addition, since the nucleolus does more favor to those vulnerable DMUs/coalitions, it implies a pessimistic attitude and corresponds to the defining way of the characteristic function. Besides, there is always one and only one unique nucleolus. Therefore, in this subsection we will discuss the nucleolus solution and its computation procedure.
For the sake of calculating the nucleolus solution and according allocation scheme, let us consider a pre-imputation or a carbon emission abatement quota allocation vector satisfies the following three rationalities (Nakabayashi & Tone, Citation2006):
Individual rationality:
Coalition rationality:
Collective rationality:
In cooperative game theory, the pre-imputation vector represents an allocation scheme of the total carbon dioxide emission abatement quota R. The individual rationality ensures the non-negative improvements from the worst results for each DMU, and the coalition rationality guarantees the non-negative improvements from the worst results for all coalitions, and the last collective rationality promises a full cover of the total reduction quota R. As suggested by Lozano (Citation2012) that, the coalition rationality can also guarantee the stability of the imputation, since the aggregated gains assigned to its members is not less than the coalition minimal gains, i.e. the characteristic function. Further, a stable imputation leaves no incentives for any DMUs to break the grand coalition and form a sub-coalition.
For calculating the nucleolus, an importation concept based on the pre-imputation vector is given as below:
Definition 2.
For the cooperative game the excess value of coalition
on the pre-imputation vector
is calculated as
The excess value measures the “unsatisfactory degree” or “unhappiness” relative to the guarantee level, i.e. the characteristic function. The nucleolus solution to the cooperative game is defined by Schmeidler (Citation1969) as the optimal imputation that can minimize the excess value for all coalitions by lexicographical order. By sorting all excess values of coalitions in non-descending order, a vector can be defined as
where
Then, the nucleolus solution can be interpreted as below:
(14)
(14)
where the pre-imputation vector
is the set of all feasible distribution for the cooperative game (N, V). The nucleolus
is the one that lexicographically minimizes the excess values for all coalitions.
To calculate the nucleolus of the cooperative game (N, V), a min–max model based on the general concept framework of Maschler, Peleg, and Shapley (Citation1979) is developed as below.
(15)
(15)
Let then model (15) is transformed into a linear program in model (16).
(16)
(16)
4.4.1. A practical computation procedure of nucleolus
Normally, the computation of the nucleolus is done by computing the characteristic function for each coalition and following the iterative procedure of Fromen (Citation1997). However, when the number of coalitions is big, it is impractical to compute the characteristic function for each coalition and then a constraint generation mechanism suggested by Hallefjord et al. (Citation1995) would be of vital significance. Therefore, this subsection would propose a practical computation procedure based on the work of Hallefjord et al. (Citation1995).
First of all, we limit the first constraint of model (16) to a subset where for simplification
can be the n singleton coalitions, namely,
It is clear that we can easily calculate the characteristic function
Then we solve model (16) in a simplified version, which is formulated as model (17).
(17)
(17)
Solving model (17) determines a series of optimal solutions denoted as Note that the nucleolus is rather hard to compute in general cases and it is easy to compute it incorrectly due to multiple optimal solutions of model (16) and model (17) and the absence of relevance of duality. Following the approach of Guajardo and Jörnsten (Citation2015), we formulate the dual form of model (17), which is given in model (18).
(18)
(18)
Solving model (18) determines a solution which will be corresponding with the optimal objective function of model (17), namely,
According to the duality theory, a positive value of the optimal dual variable implies the establishment of equality of inequality constraint in the primary problem. That is to say, if
then it holds exactly
for
If there exists
which implies that model (17) might have multiple optimal solutions, then we will continue to repeatedly solve model (17) and model (18) to obtain a unique solution, denoted as
At this time, it holds
for all
belonging to
Acknowledging that
contains the n singleton coalitions, hence we have
Further, we are able to identify the most unsatisfied coalition among all nonempty subset of N, that is,
By simplification, it is
Reconsidering formula (13) which contains the basic idea of computing
the above problem can be formulated as model (19) in a similar way of Hallefjord et al. (Citation1995).
(19)
(19)
In above model (19), is the
component of the non-negative coalition vector
with
being one if
is a member of the coalition and being zero if not a member of that coalition. M is a large enough positive value ensuring that
will be zero if
and
will be a positive value if
The first five constraints are used to ensure the efficient allocation scheme and unreduced desirable outputs. The sixth constraint guarantees that the most unsatisfied coalition is a real nonempty subset of N. Finally, the seventh and eighth constraints can ensures that
will be either zero or
which reflects the calculation of
in model (13). The optimal solution of model (19) can be used to generate a new constraint which will be added to model (17). Suppose that model (19) has an optimal solution
then the constraint
is added to the simplified model (17), and model (19) is resolved. The above idea is formulated as model (20).
(20)
(20)
Model (20) and model (19) will be solved repeatedly until the termination condition, is held. Under this circumstance, the constraint
in original model (16) is satisfied for all nonempty coalitions of DMUs,
Note in particular that an additional constraint
would be also added in the computation procedure to prevent the coalition
from later iteration process. In addition, the constraints of model (16) are all satisfied, and the optimal objective function of model (16) can be calculated through a practical computation procedure. This procedure is helpful for a lexicographic optimization of model (16), and the unique nucleolus solution corresponds to the final carbon emission abatement quota allocation scheme.
4.5. An illustrative application
To illustrate the usefulness of the proposed cooperative game DEA approach, in this subsection we provide a small case. In , there are five DMUs with two inputs (x1 and x2), one undesirable output (y) and one undesirable output (b).
Table 3. A simple example.
By solving model (4) once for each DMU, we can find three efficient DMUs (DMU1, DMU2, and DMU4) and two inefficient DMUs (DMU3 and DMU5), and the efficiency scores are listed in the second column of .
Table 4. Preliminary results.
The current total undesirable output is 42, and for simplification we consider an undesirable output reduction goal of 15 across five DMU, namely, R = 15. In addition, through solving model (10) for each individual DMU we can calculate the possible post-abatement-allocation efficiency from each DMU’s decentralized perspective, as given in the third column of . It can be learned from that it is possible for any DMU to reach the highest efficiency score of unity by taking the undesirable output reduction into account. This finding is also shown by Theorem 2. Further, all DMUs can be simultaneously efficient by considering undesirable output reduction goal, but there exist huge flexibilities in the undesirable output reduction plans. For a first validation of this flexibility, we can look at each DMU’s minimal and maximal reduction amount () derived from model (12) and given in the last two columns of . It is clear that each DMU can completely reduce its undesirable output level yet ensuring all DMUs are efficient and the total desirable outputs are unreduced. In addition, the total maximal reduction amount across five DMUs are larger than the total reduction goal as 42 > 15. On the contrary, each DMU might be reduced a relatively small undesirable output amount and also making all DMUs efficient, and the sum of minimal reduction amount across five DMUs are smaller than the total reduction goal as 0 < 15. Such a phenomenon is called as egoist’s dilemma (Nakabayashi & Tone, Citation2006), and game-based approaches are useful to generate a unique and fair undesirable output reduction plan.
To use the integrated cooperative game DEA approach, we first solve model (16) for n singleton coalitions, namely model (17). Before that we calculate the maximal reduction amount (as shown in the last column of ) and the characteristic function
for n singleton coalitions,
As shown in , solving model (17) for the first round determines an optimal objective function of and an imputation
Table 5. The constraint generation process for the minimal excess value.
Note in particular that solving model (18) determines five positive dual variables (
and
), implying that the previous optimal solution of model (17) is unique (we omit to report the results of dual formulas in later section for simplification). Further, based on the optimal solution of model (17) we solve model (19) to find the most unsatisfied coalition {1, 2, 3, 5} with an optimal objective function
Therefore, two constraints
and
will be generated and added. In the second iteration, we solve model (20) to compute the solution corresponding to the current minimized excess value. As a result we obtain an optimal objective function of
and a solution
Making use of this objective function and solution
model (19) yields that another coalition {1, 2, 5} must be taken into account as it reached the largest unsatisfied value
The above iterative process will obtain an optimal objective function of and a solution
in the sixth round. At this time the most unsatisfied coalition {1, 3, 4} is identified. In addition, the optimal objective function of model (19) reaches 0.0000, implying that we have found the minimal excess value and the constraint generation process for the minimal excess value terminates.
We then continue to identify the allocation scheme corresponding to the nucleolus. For these identified coalitions in it holds equalities Take coalition {1, 3, 4} for example, it holds
For coalition {2, 4, 5} it holds
Solving those equalities simultaneously determines a unique solution (2.8333, 2.3333, 2.8333, 3.6667, 3.3333), and that solution is the nucleolus-based allocation scheme. Interestingly, DMUs with less undesirable outputs will be allocated with a smaller abatement amount.
5. Empirical study in Chinese manufacturing industries
In this section, we will apply the integrated cooperative game DEA approach to address a real-world problem, that is, allocating the carbon emission abatement quota in Chinese manufacturing industries. As discussed in previous Section 3, the CO2 emission reduction gap should be [367319.9970, 838243.9520] in the unit of thousand tons. Since it is difficult to allocate an interval quota, without loss of generality we consider the average value, as the carbon emissions abatement quota in this research.
5.1. Data and preliminary analysis
In this subsection, a sub-level industrial dataset in 2012 is considered. There are 31 sub-industries with three inputs (total assets in billion Yuan, x1; annual average employment personnel in thousand person, x2; and total energy consumption in thousand tons of standard coal equivalent, x3), one desirable output (gross output value of industry in billion Yuan, y) and one undesirable output (CO2 emission in thousand tons, u), as given in (The codes for two-digit Chinese manufacturing industries can be found in Appendix F).
Table 6. Dataset for 31 sub-level manufacturing industries.
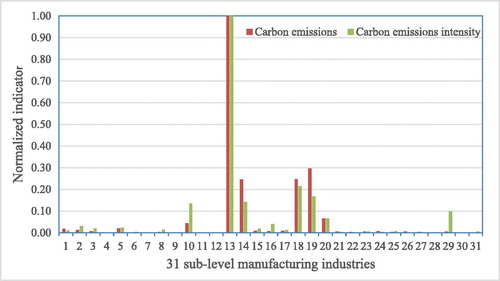
First of all, we give some preliminary analysis for 31 sub-level manufacturing industries. For an overview of carbon emissions and intensity, we normalize the carbon emissions and carbon emissions intensity indicators. To this end, the normalized carbon emissions of a certain sub-level manufacturing industry is calculated as (real carbon emissions – B)/(A – B), where A is the maximal carbon emissions and B is the minimal emissions across 31 sub-level manufacturing industries. The normalized carbon emissions intensity indicators can be calculated in a similar way and shows the normalized carbon emissions and carbon emission intensity for 31 sub-level manufacturing industries. It can be learned from that most carbon emissions are mainly derived from six sub-level manufacturing industries (DMU10, Manufacture of Paper and Paper Products; DMU13, Processing of Petroleum, Coking and Processing of Nuclear Fuel; DMU14, Manufacture of Raw Chemical Materials and Chemical Products; DMU18, Manufacture of Non-metallic Mineral Products; DMU19, Smelting and Pressing of Ferrous Metals; DMU20, Smelting and Pressing of Non-ferrous Metals), of which the carbon emissions are relatively larger than other industries. Most seriously, DMU13 (Processing of Petroleum, Coking and Processing of Nuclear Fuel), which has the largest carbon emissions among 31 sub-level manufacturing industries, even accounts for 48.5998% of the total carbon emissions in Chinese manufacturing industries. Therefore, for the sake of reducing the carbon emissions in China and realizing the national carbon emissions abatement commitment special attention should be paid to these sub-level manufacturing industries. In addition, we can learn from that most sub-level manufacturing industries with large carbon emissions are also with high carbon emissions intensity. Three significant exceptions are DMU10 (Manufacture of Paper and Paper Products), DMU16 (Manufacture of Chemical Fibres) and DMU29 (Other Manufacture), which have a normalized carbon emissions intensity indicator much larger than its normalized carbon emissions indicator.
Figure 1. Normalized carbon emissions and carbon emission intensity.
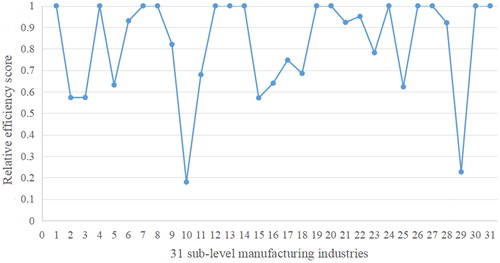
Then we can use model (4) to assess the relative efficiency of 31 sub-level manufacturing industries, as given in . It is clear that 14 sub-level manufacturing industries are efficient in the sense that they cannot proportionally expand their gross output value of industry and shrink the carbon emissions. Furthermore, two sub-level manufacturing industries (DMU10, Manufacture of Paper and Paper Products; DMU29, Other Manufacture) have the least two relative efficiency scores, which is consistent with the previous result that the two manufactures have its carbon emissions intensity indicator much larger than corresponding carbon emissions indicator.
Figure 2. Relative efficiency of 31 sub-level manufacturing industries.
5.2. Sub-industrial allocation
Using the mathematical models in Section 4 and following a similar computation process in Section 4.5, we can calculate the nucleolus-based allocation of the national carbon emissions abatement quota across 31 sub-level manufacturing industries. In particular, we impose a reduction upper in this section by considering the reduction difficulty. The results of CO2 abatement quota allocation for 31 sub-level manufacturing industries are given in (the computation process is not presented here for its large-scale).
Table 7. CO2 abatement quota allocation for 31 sub-level manufacturing industries.
For the first sight of , it can be learned that only some sub-level manufacturing industries will be allocated with carbon abatement responsibility, while fourteen sub-level manufacturing industries (DMU4, DMU5, DMU6, DMU7, DMU8, DMU9, DMU11, DMU12, DMU22, DMU23, DMU24, DMU26, DMU30, and DMU31) don’t have to reduce its carbon emission level. Further, DMU13 (Processing of petroleum, coking and processing of nuclear fuel) and DMU19 (Smelting and pressing of ferrous metals) were allocated with the most carbon emissions abatement responsibility, reaching 113,323.2930 (thousand tons) and 18.8000% of the total carbon emissions abatement quota. In addition, five DMUs attract our attention deeply for its large shares in the whole sample, namely, DMU13 (Processing of petroleum, coking and processing of nuclear fuel), DMU14 (Manufacture of raw chemical materials and chemical product), DMU18 (Manufacture of non-metallic mineral products), DMU19 (Smelting and pressing of ferrous metals) and DMU20 (Smelting and pressing of non-ferrous metals). These five sub-industries produced only 32.2291% of the total GIOV in 2012 but 91.4781% of the total CO2 emissions, and account for 90.6964% of the total carbon emission abatement quota. The key to control the carbon emissions and to realize the national reduction commitment is to manage these five sub-industries, so to speak. Once the carbon emissions abatement is well done in these five sub-industries, the national carbon emissions abatement task will be easily implemented.
To investigate the relationship between current carbon emissions and allocated carbon emissions abatement quota, lists the CO2 emissions percentage (CO2 emissions/total CO2 emissions), reduction percentage (the allocated quota/CO2 emissions), and abatement quota allocation percentage (allocated quota/total abatement quota) and corresponding descending rankings for 17 sub-level manufacturing industries that are allocated with a positive carbon emission abatement amount.
Table 8. Relationship associated with the allocation results.
From , we can learn that the sub-industries with higher CO2 emission percentage are most likely to be allocated larger proportions of the total CO2 emissions abatement quota. Actually, most sub-industries are ranked at the same place or anteroposterior position as they process the CO2 emissions percentage (DMU3, DMU13, DMU14, DMU15, DMU18, DMU19, DMU20, DMU25, DMU28, and DMU29). Acknowledging that the units with larger carbon emissions naturally show stronger carbon reduction capacity or higher carbon reduction potentials, it is reasonable to allocate larger shares of the total carbon emissions abatement quota to these units. This result is also consistent with Yu et al. (Citation2014) and Zhang et al. (Citation2014).
However, the reduction percentage (the allocated quota/CO2 emissions) varies from one industry to another industry, with the maximal and minimal reduction percentage being 100.0000% (Manufacture of Rubber and Plastics Products, DMU17; Manufacture of Metal Products, DMU21; Manufacture of Measuring Instruments and Machinery, DMU28) and 5.5532% (DMU13, Processing of Petroleum, Coking and Processing of Nuclear Fuel), respectively. Note in addition that the reduction goal (602,781.9745) is 14.5786% of the total CO2 emissions (4,134,711.6380) in Chinese manufacturing industries, 13 out of 17 sub-industries have shown a CO2 reduction percentage exceeds the national average reduction rate. Through a correlation test we find that the reduction percentage is a little weakly negatively correlated with the percentage of current CO2 emission and correlated to the percentage of allocated carbon abatement quota, as the correlation coefficients (–0.3454 and –0.1590) are located in the interval [–0.4, –0.2] and [–0.2, 0], respectively. On the contrary, the correlation coefficient between the current CO2 emission percentage and the percentage of allocated carbon abatement quota reaches 0.7093, implying a relatively high relevance. Based on above observations, it might be concluded that the game-based carbon emissions abatement quota allocation mechanism is implicitly similar with the proportional sharing method, and we have a carbon emissions abatement quota allocation plan that is highly consistent with each unit’s carbon emissions proportion.
5.3. Provincial allocation
In this subsection, we further allocate the reduction quota for each sub-industry that is obtained in Section 5.2 into different provinces. The summary statistics of 31 provinces for 31 sub-industries is given in . For the provincial allocation, we take each province as a DMU and provinces with the same sub-industry as a sample.
Table 9. Summary statistics of 31 provinces for 31 sub-industries.
By repeatedly solving the cooperative game DEA approaches proposed previously, we obtain the allocation results listed in . In such a way, we allocate the national carbon emissions abatement quota into a two-layer framework. For details, the Manufacture of Non-metallic Mineral Products (I18) in Guangdong province, Processing of Petroleum, Coking and Processing of Nuclear Fuel (I13) in Shandong province and Smelting and Pressing of Ferrous Metals (I19) in Liaoning province are top three provinces that receive the most carbon emissions abatement quota across 31sub-level manufacturing industries in 31 provinces, reaching 74,471.5030, 49,499.2709 and 37,107.5793 (in thousand tons), respectively. In addition, these three regions of different industries are allocated more than 5% of the total carbon emission abatement quota. Also, the Manufacture of Raw Chemical Materials and Chemical Products (I14) in Sichuan province is another region that accounts for more than 5% of the total carbon emission abatement quota, reaching 35,739.9897. On the other hand, Tibet has no need to reduce its CO2 emissions in many sub-level industries. This phenomenon can be mainly caused by the undeveloped economy, as Tibet is a backward province where there aren’t most sub-industries and corresponding CO2 emissions.
Table 10. Results of regional CEA allocation scheme (unit: thousand tons).
Table 11. Results of regional CEA allocation scheme (unit: thousand tons).
Table 12. Results of regional CEA allocation scheme (unit: thousand tons).
To sum the allocated reduction amounts in various sub-industries, we can also obtain the reduction responsibility for each province, as given in . Guangdong, Shandong, Sichuan, Liaoning, and Zhejiang rank the top five provinces that are allocated the most CO2 reduction quota, and Tibet, Hainan, Qinghai, Beijing, and Fujian rank another least five provinces that are allocated the smallest CO2 reduction quota among 31 provinces. The carbon emissions abatement quota allocated to Guangdong is 131,473.9251 (thousand tons), which accounts 21.8112% of the national abatement commitment. Shandong is another province that is responsible for more than ten percentage of the national abatement commitment, with 76,669.5284 (thousand tons) for 12.7193%. In addition, the carbon emissions abatement quota allocated to the top five provinces are 329,808.8273 (thousand tons), which accounts for 54.7144% of the total national carbon emissions abatement goal, and the percentage reaches 83.2386% and 91.1493% when it covers the top 10 and top 13 provinces, respectively. This result shows that the corresponding provinces are key focus to realize the national carbon emissions abatement commitment and allocate the total carbon emissions abatement quota.
Table 13. CO2 abatement quota allocated to provinces (10 thousand tons).
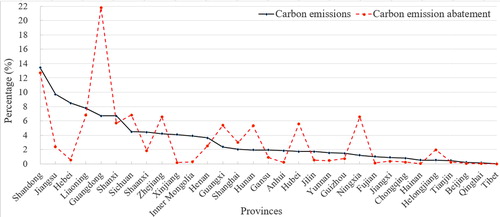
Additionally, we present the tendency of carbon emissions percentage and corresponding allocated carbon emissions abatement quota percentage among all provinces. It can be learned from that although there will be some variations between the carbon emissions percentage and corresponding allocated carbon emissions abatement quota, the main tendency is a little similar. We present the carbon emissions percentage in descending order in , and the percentage of allocated carbon emission abatement quota shows also a downward tendency. In fact the correlation coefficient between the carbon emissions percentage and corresponding allocated carbon emissions abatement quota percentage is 0.5444, implying a positive association. This result demonstrates again that larger shares of the total carbon emissions abatement quota are more likely to be allocated to units with larger carbon emissions percentages.
Figure 3. Percentage of carbon emissions and abatement quota for 31 provinces.
5.4. Discussion
In this subsection, we will discuss (1) briefly the impact on the results of using alternative solution concepts for the cooperative game, and (2) some practical implications and indications of how these allocated carbon emission abatement targets might be used in practice.
5.4.1. Impacts of alternative game solutions
Note that this article uses only the nucleolus solution and there exists alternative solution concepts for the cooperative game. Although it is a little difficult to calculate all kinds of solutions for the carbon emission abatement quota allocation problem, we can present a brief discussion on the impacts of alternative solution concepts, for instances, Nash bargaining solution, core (least core, weak least core, and proportional least core) and Shapley value.
Nash bargaining solution is an imputation that maximizes the satisfaction degree of all DMUs. Acknowledging that the excess value in this article is a measure of dissatisfaction degree, the Nash bargaining solution based allocation plan would minimize the excess values for n individual DMUs. That is to say, the Nash bargaining solution based allocation plan just focuses on n singleton coalitions instead of all nonempty coalitions of n DMUs, and it might be considered as a simplified version of nucleolus based allocation plan (it likes model (17)). Besides, the nucleolus based allocation plan minimizes the excess values by lexicographical order, while the Nash bargaining solution based allocation plan adopts a product of individual utilities due to technical device (Osborne & Rubinstein, Citation1994).
The core solution is an imputation that also minimizes the excess values for all nonempty coalitions of DMUs, and the core solution can be divided into least core, weak least core, and proportional least core according to which parameter is added to the characteristic function in computing the excess values. It is clear that the core based allocation plan just focuses on the most unsatisfied coalition (i.e. the least excess value), neglecting the second unsatisfied coalition, third unsatisfied coalition, and so on. It is acknowledged that any cooperative game will always have a unique nucleolus and the nucleolus must be one of least cores if the game has nonempty cores. Put it differently, the core based allocation plan just realizes the first least excess value, and it would be changed into the nucleolus based allocation plan if it minimizes the excess values to the most by lexicographical order.
The Shapley value is an imputation that represents the average contribution of DMUs to the guarantee level, namely, characteristic function, thus the Shapley value based allocation plan involves fair concern and would be much fairer given DMUs’ input-output measures. The Shapley value based allocation plan is a good choice for carbon emission abatement quota allocation in Chinese manufacturing industries, but its computation depends on the characteristic function for each coalition, which is impractical when the number of coalitions is very big (in this article the number of nonempty coalitions is 231–1).
All in all, using alternative solution concepts for the cooperative game would generate very similar allocation plans, which might be strongly positive correlated with each other (Li, Citation2008). The Nash bargaining solution based allocation plan is much closer to traditional proportional sharing method, while the nucleolus based allocation plan favors much for vulnerable groups, and the cores based allocation plan would waver between the Nash bargaining solution based allocation plan and the nucleolus based allocation plan.
5.4.2. Practical implications and indications
Note in particular that the previous results are obtained based on the implicit assumption that any inefficient DMU can move to the efficient frontier by adjusting its GIOV and carbon emissions. However, it is not the case in the real world as a certain DMU cannot change its production bundle and production structure remarkably, and rapid change would confront huge resistance. The carbon emission abatement may cause unemployment and reduction in energy consumption in the short term, but it is no doubt that the technological change has a solid effect on the carbon dioxide emissions in the long run (Grimaud & Rouge, Citation2008; Smulders & Di Maria, Citation2012). Moreover, technology change is supposed as the most essential factor for reduce the carbon dioxide emissions (Li et al., Citation2017a; Li & Qu, Citation2012), thus much attention should be paid to technology development and adoption and progress for the sake of implementing these carbon abatement allocation targets in practice.
Some efforts can be taken to promote the technology change and further implement these reduction targets under low-carbon technology progress in the long run. First of all, the Chinese government should develop and improve the mechanism of low carbon technology progress, which will promote the development of low carbon technology. The key point is to continue to implement energy-saving emission reduction technology special action plan, and solve the key and common difficulties of low-carbon technology. It is clear that the R&D investment should be increased. Then, the Chinese government should take a tendentious policy to invest in low-carbon technology and innovation across different industries and regions. The western and central areas must learn the best practice and low-carbon technology from eastern area, and speed up its technological progress. At the same time, industries with high carbon intensity must learn the best practice and low-carbon technology from peers. Last, the Chinese government can promote the optimization and upgrading of industrial structure, which means to decrease and even limit the heavy polluting industries. In the long run, the Chinese government is supposed to develop a new industrialization pattern with minimal energy consumption and pollution emission, which can support both the economy and public through achievable and sustainable development goals.
Some direct measures can be also useful for implementing these carbon abatement allocation targets in the short term. For instance, all levels of the Chinese government can actively optimize its energy consumption structure across regions and industries, accelerate the speed in closing down backward production facilities (Wu, Lv, Sun, & Ji, Citation2015). It is also very useful to pay much attention to labor efficiency, as the labor efficiency is significantly connected with the substitution of labor for energy and improving the labor efficiency will accelerate the substitution of labor for energy, which will further enhance industrial production efficiency and reduce environment pollution. In addition, the carbon trade market can be of strategic importance. The carbon trade market makes it possible for these determined carbon abatement allocation targets be re-adjusted considering certain local situations.
6. Conclusions and perspectives
This article focuses on a real problem on how to allocate the national carbon emission abatement quota in Chinese manufacturing industries. It adopts a decentralized perspective to address the carbon emission abatement quota allocation problem, which is different from most studies in the literature that solve the studied problem from a centralized view and seek after the collective objective. To this end, this article integrates data envelopment analysis and game theory to propose a cooperative game DEA approach, considering the cooperation and competition relationship among units simultaneously. In addition, a practical computation procedure based on constraint generation mechanism is developed to calculate the nucleolus solution and the nucleolus-based solution is taken as the final carbon emission abatement quota allocation scheme. In the empirical study, we present a two-layer way to decompose the national carbon emission abatement quota into different sub-industries and further into different provinces. The results show that five sub-industries (Processing of petroleum, coking and processing of nuclear fuel; Smelting and pressing of ferrous metals; Manufacture of non-metallic mineral products; Manufacture of raw chemical materials and chemical product; Smelting and pressing of non-ferrous metals) and two provinces (Guangdong and Shandong) will be allocated more than 10% of the total national carbon emissions abatement goal.
The carbon dioxide emission abatement quota allocation is supposed to be the key issue for China to respond to global warming. This article has suggested a feasible and rational method to allocate the carbon emission abatement quota into different industries and provinces. However, the carbon emission abatement allocation still needs much more work in the future. On one hand, the difference among the industries and provinces is not well considered. The Chinese government has made a lot of policies to guide the industrial development and regional development, which is supposed to separate these industries and provinces apart. On the other hand, a significant feature of this current article is that it presents a two-layer allocation framework, where the total carbon emission abatement quota is first allocated to different sub-industries and further to different provinces within sub-industries. This practice is similar with a network perspective. It is acknowledged that a network DEA approach would provide new insights in allocation results (Li et al., Citation2019; Yu, Chen, & Hsiao, Citation2016), and accordingly making the allocation mechanism more reasonable and the allocation results more acceptable. However, the game would be more complex under network DEA environment and the computation would be also much more complex, so future work can try to extend the proposed approach to situations considering internal network structures. Besides, the political implications for this game DEA approach are not so explicit, future research can also work on this aspect deeply.
Acknowledgements
The authors thank the Editor of Journal of the Operational Research Society and three anonymous reviewers for their kind work and valuable comments, they have done a significant work for us to improve this article. The authors also acknowledge Dr. Xiaoyu Han for her assistance on numerical calculation.
Disclosure statement
No potential conflict of interest was reported by the authors.
Endnotes
Additional information
Funding
Notes
Related Research Data
References
- An, Q., Chen, H., Xiong, B., Wu, J., & Liang, L. (2017). Target intermediate products setting in a two-stage system with fairness concern. Omega, 73, 49–59. doi:10.1016/j.omega.2016.12.005
- An, Q., Meng, F., Ang, S., & Chen, X. (2018). A new approach for fair efficiency decomposition in two-stage structure system. Operational Research, 18(1), 257–272. doi:10.1007/s12351-016-0262-9
- Andersen, P., & Petersen, N. C. (1993). A procedure for ranking efficient units in data envelopment analysis. Management Science, 39(10), 1261–1264. doi:10.1287/mnsc.39.10.1261
- Asmild, M., Paradi, J. C., & Pastor, J. T. (2009). Centralized resource allocation BCC models. Omega, 37(1), 40–49. doi:10.1016/j.omega.2006.07.006
- Athanassopoulos, A. D. (1995). Goal programming & data envelopment analysis (GoDEA) for target-based multi-level planning: Allocating central grants to the Greek local authorities. European Journal of Operational Research, 87(3), 535–550. doi:10.1016/0377-2217(95)00228-6
- Arabi, B., Munisamy, S., & Emrouznejad, A. (2015). A new slacks-based measure of Malmquist–Luenberger index in the presence of undesirable outputs. Omega, 51, 29–37. doi:10.1016/j.omega.2014.08.006
- Avellar, J. G., Milioni, A. Z., & Rabello, T. N. (2007). Spherical frontier DEA model based on a constant sum of inputs. Journal of the Operational Research Society, 58(9), 1246–1251. doi:10.1057/palgrave.jors.2602260
- Avellar, J. V. G. D., Milioni, A. Z., Rabello, T. N., & Simão, H. P. (2010). On the redistribution of existing inputs using the spherical frontier DEA model. Pesquisa Operacional, 30(1), 1–14. doi:10.1590/S0101-74382010000100001
- Banker, R. D. (1980). A game theoretic approach to measuring efficiency. European Journal of Operational Research, 5(4), 262–266. doi:10.1016/0377-2217(80)90058-2
- Banker, R. D., Charnes, A., & Cooper, W. W. (1984). Some models for estimating technical and scale inefficiencies in data envelopment analysis. Management Science, 30(9), 1078–1092. doi:10.1287/mnsc.30.9.1078
- Banker, R. D., Charnes, A., Cooper, W. W., & Clarke, R. (1989). Constrained game formulations and interpretations for data envelopment analysis. European Journal of Operational Research, 40(3), 299–308. doi:10.1016/0377-2217(89)90422-0
- Beasley, J. E. (2003). Allocating fixed costs and resources via data envelopment analysis. European Journal of Operational Research, 147(1), 198–216. doi:10.1016/S0377-2217(02)00244-8
- Bi, G., Ding, J., Luo, Y., & Liang, L. (2011). Resource allocation and target setting for parallel production system based on DEA. Applied Mathematical Modelling, 35(9), 4270–4280. doi:10.1016/j.apm.2011.02.048
- Bian, Y., & Yang, F. (2010). Resource and environment efficiency analysis of provinces in China: A DEA approach based on Shannon’s entropy. Energy Policy, 38(4), 1909–1917. doi:10.1016/j.enpol.2009.11.071
- Chakraborty, B. (2017). Paris agreement on climate change: US withdraws as Trump calls it ‘unfair’. Fox News. https://www.foxnews.com/politics/paris-agreement-on-climate-change-us-withdraws-as-trump-calls-it-unfair
- Charnes, A., Cooper, W. W., & Rhodes, E. (1978). Measuring the efficiency of decision making units. European Journal of Operational Research, 2(6), 429–444. doi:10.1016/0377-2217(78)90138-8
- Chen, C. M., & Delmas, M. A. (2012). Measuring eco-inefficiency: A new frontier approach. Operations Research, 60(5), 1064–1079. doi:10.1287/opre.1120.1094
- Chen, Y., Liang, L., & Yang, F. (2006). A DEA game model approach to supply chain efficiency. Annals of Operations Research, 145(1), 5–13. doi:10.1007/s10479-006-0022-y
- Chiu, Y. H., Lin, J. C., Su, W. N., & Liu, J. K. (2015). An efficiency evaluation of the EU’s allocation of carbon emission allowances. Energy Sources, Part B: Economics, Planning, and Policy, 10(2), 192–200. doi:10.1080/15567249.2010.527900
- Cook, W. D., & Kress, M. (1999). Characterizing an equitable allocation of shared costs: A DEA approach. European Journal of Operational Research, 119(3), 652–661. doi:10.1016/S0377-2217(98)00337-3
- Chung, Y. H., Färe, R., & Grosskopf, S. (1997). Productivity and undesirable outputs: A directional distance function approach. Journal of Environmental Management, 51(3), 229–240. doi:10.1006/jema.1997.0146
- Ding, T., Chen, Y., Wu, H., & Wei, Y. (2018). Centralized fixed cost and resource allocation considering technology heterogeneity: A DEA approach. Annals of Operations Research, 268(1–2), 497–511. doi:10.1007/s10479-017-2414-6
- Du, J., Cook, W. D., Liang, L., & Zhu, J. (2014). Fixed cost and resource allocation based on DEA cross-efficiency. European Journal of Operational Research, 235(1), 206–214. doi:10.1016/j.ejor.2013.10.002
- Du, J., Liang, L., Chen, Y., Cook, W. D., & Zhu, J. (2011). A bargaining game model for measuring performance of two-stage network structures. European Journal of Operational Research, 210(2), 390–397. doi:10.1016/j.ejor.2010.08.025
- Emrouznejad, A. (2014). Advances in data envelopment analysis. Annals of Operations Research, 214(1), 1–4. doi:10.1007/s10479-014-1535-4
- Emrouznejad, A., & Yang, G. (2018). A survey and analysis of the first 40 years of scholarly literature in DEA: 1978-2016. Socio-Economic Planning Sciences, 61(1), 4–5. doi:10.1016/j.seps.2017.01.008
- Emrouznejad, A., Yang, G. L., & Amin, G. R. (2019). A novel inverse DEA model with application to allocate the CO2 emissions quota to different regions in Chinese manufacturing industries. Journal of the Operational Research Society, 70(7), 1079–1090. doi:10.1080/01605682.2018.1489344
- Fang, L. (2013). A generalized DEA model for centralized resource allocation. European Journal of Operational Research, 228(2), 405–412. doi:10.1016/j.ejor.2013.01.049
- Fang, L. (2016). Centralized resource allocation DEA models based on revenue efficiency under limited information. Journal of the Operational Research Society, 67(7), 945–952. doi:10.1057/jors.2015.117
- Fang, L., & Zhang, C. Q. (2008). Resource allocation based on the DEA model. Journal of the Operational Research Society, 59(8), 1136–1141. doi:10.1057/palgrave.jors.2602435
- Färe, R., & Grosskopf, S. (1996). Productivity and intermediate products: A frontier approach. Economics Letters, 50(1), 65–70. doi:10.1016/0165-1765(95)00729-6
- Färe, R., Grosskopf, S., Lovell, C. K., & Pasurka, C. (1989). Multilateral productivity comparisons when some outputs are undesirable: A nonparametric approach. Review of Economics and Statistics, 71(1), 90–98. doi:10.2307/1928055
- Feng, C., Chu, F., Ding, J., Bi, G., & Liang, L. (2015). Carbon emissions abatement (CEA) allocation and compensation schemes based on DEA. Omega, 53, 78–89. doi:10.1016/j.omega.2014.12.005
- Filar, J. A., & Gaertner, P. S. (1997). A regional allocation of world CO2 emission reductions. Mathematics and Computers in Simulation, 43(3–6), 269–275. doi:10.1016/S0378-4754(97)00009-8
- Fromen, B. (1997). Reducing the number of linear programs needed for solving the nucleolus problem of n-person game theory. European Journal of Operational Research, 98(3), 626–636. doi:10.1016/0377-2217(95)00341-X
- Gomes, E. G., & Lins, M. E. (2008). Modelling undesirable outputs with zero sum gains data envelopment analysis models. Journal of the Operational Research Society, 59(5), 616–623. doi:10.1057/palgrave.jors.2602384
- Grimaud, A., & Rouge, L. (2008). Environment, directed technical change and economic policy. Environmental and Resource Economics, 41(4), 439–463. doi:10.1007/s10640-008-9201-4
- Guajardo, M., & Jörnsten, K. (2015). Common mistakes in computing the nucleolus. European Journal of Operational Research, 241(3), 931–935. doi:10.1016/j.ejor.2014.10.037
- Guedes, E. C. C., Milioni, A. Z., de Avellar, J. V. G., & Silva, R. C. (2012). Adjusted spherical frontier model: Allocating input via parametric DEA. Journal of the Operational Research Society, 63(3), 406–417. doi:10.1057/jors.2011.42
- Guo, R., Cao, X., Yang, X., Li, Y., Jiang, D., & Li, F. (2010). The strategy of energy-related carbon emission reduction in Shanghai. Energy Policy, 38(1), 633–638. doi:10.1016/j.enpol.2009.06.074
- Hallefjord, Å., Helming, R., & Jørnsten, K. (1995). Computing the nucleolus when the characteristic function is given implicitly: A constraint generation approach. International Journal of Game Theory, 24(4), 357–372. doi:10.1007/BF01243038
- IPCC. (2007). Climate change 2007: The physical science basis. Agenda, 6(07), 333.
- Kao, C., & Liu, S. T. (2018). Cross efficiency measurement and decomposition in two basic network systems. Omega, 83, 70–79. doi:10.1016/j.omega.2018.02.004
- Korhonen, P. J., & Luptacik, M. (2004). Eco-efficiency analysis of power plants: An extension of data envelopment analysis. European Journal of Operational Research, 154(2), 437–446. doi:10.1016/S0377-2217(03)00180-2
- Korhonen, P., & Syrjänen, M. (2004). Resource allocation based on efficiency analysis. Management Science, 50(8), 1134–1144. doi:10.1287/mnsc.1040.0244
- Kuosmanen, T. (2005). Weak disposability in nonparametric production analysis with undesirable outputs. American Journal of Agricultural Economics, 87(4), 1077–1082. doi:10.1111/j.1467-8276.2005.00788.x
- Kuosmanen, T., & Podinovski, V. (2009). Weak disposability in nonparametric production analysis: reply to Färe and Grosskopf. American Journal of Agricultural Economics, 91(2), 539–545. doi:10.1111/j.1467-8276.2008.01238.x
- Li, A., Zhang, A., Zhou, Y., & Yao, X. (2017a). Decomposition analysis of factors affecting carbon dioxide emissions across provinces in China. Journal of Cleaner Production, 141, 1428–1444. doi:10.1016/j.jclepro.2016.09.206
- Li, Y. (2008). Research on the fixed cost allocation based on DEA (doctoral dissertation). University of Science and Technology of China, Hefei, Anhui, China.
- Li, F., Liang, L., Li, Y., & Emrouznejad, A. (2018a). An alternative approach to decompose the potential gains from mergers. Journal of the Operational Research Society, 69(11), 1793–1802. doi:10.1080/01605682.2017.1409867
- Li, Y., Yang, M., Chen, Y., Dai, Q., & Liang, L. (2013). Allocating a fixed cost based on data envelopment analysis and satisfaction degree. Omega, 41(1), 55–60. doi:10.1016/j.omega.2011.02.008
- Li, F., Song, J., Dolgui, A., & Liang, L. (2017b). Using common weights and efficiency invariance principles for resource allocation and target setting. International Journal of Production Research, 55(17), 4982–4997. doi:10.1080/00207543.2017.1287450
- Li, F., Zhu, Q., & Chen, Z. (2019). Allocating a fixed cost across the decision making units with two-stage network structures. Omega, 83, 139–154. doi:10.1016/j.omega.2018.02.009
- Li, F., Zhu, Q., Chen, Z., & Xue, H. (2018b). A balanced data envelopment analysis cross-efficiency evaluation approach. Expert Systems with Applications, 106, 154–168. doi:10.1016/j.eswa.2018.04.009
- Li, F., Zhu, Q., & Liang, L. (2019b). A new data envelopment analysis based approach for fixed cost allocation. Annals of Operations Research, 274(1–2), 347–372. doi:10.1007/s10479-018-2819-x
- Li, F., Zhu, Q., & Liang, L. (2018d). Allocating a fixed cost based on a DEA-game cross efficiency approach. Expert Systems with Applications, 96, 186–207. doi:10.1016/j.eswa.2017.12.002
- Li, F., Zhu, Q., & Zhuang, J. (2018e). Analysis of fire protection efficiency in the United States: A two-stage DEA-based approach. Or Spectrum, 40(1), 23–68. doi:10.1007/s00291-017-0490-2
- Li, K., & Qu, R. (2012). The effect of technological change on China's carbon dioxide emission: An empirical analysis based on the vector error correction model. China Soft Science, 6, 51–58.
- Li, Y., Li, F., Emrouznejad, A., Liang, L., & Xie, Q. (2019c). Allocating the fixed cost: An approach based on data envelopment analysis and cooperative game. Annals of Operations Research, 274(1–2), 373–394. doi:10.1007/s10479-018-2860-9
- Li, Y., Shi, X., Emrouznejad, A., Xie, J., & Liang, L. (2018g). Environmental performance evaluation of Chinese industrial systems: A network SBM approach. Journal of Operations Research Society, 69(6), 825–839. doi:10.1057/s41274-017-0257-9
- Li, X., Li, F., Zhao, N., & Zhu, Q. (2018h). Measuring environmental sustainability performance of freight transportation seaports in China: A data envelopment analysis approach based on the closest targets. Expert Systems. doi:10.1111/exsy.12334
- Liang, L., Wu, J., Cook, W. D., & Zhu, J. (2008a). The DEA game cross-efficiency model and its Nash equilibrium. Operations Research, 56(5), 1278–1288. doi:10.1287/opre.1070.0487
- Liang, L., Cook, W. D., & Zhu, J. (2008b). DEA models for two‐stage processes: Game approach and efficiency decomposition. Naval Research Logistics (NRL), 55(7), 643–653. doi:10.1002/nav.20308
- Lotfi, F. H., Nematollahi, N., Behzadi, M. H., Mirbolouki, M., & Moghaddas, Z. (2012). Centralized resource allocation with stochastic data. Journal of Computational and Applied Mathematics, 236(7), 1783–1788. doi:10.1016/j.cam.2011.10.009
- Lotfi, F. H., Noora, A. A., Jahanshahloo, G. R., Gerami, J., & Mozaffari, M. R. (2010). Centralized resource allocation for enhanced Russell models. Journal of Computational and Applied Mathematics, 235(1), 1–10. doi:10.1016/j.cam.2010.05.029
- Lozano, S. (2012). Information sharing in DEA: A cooperative game theory approach. European Journal of Operational Research, 222(3), 558–565. doi:10.1016/j.ejor.2012.05.014
- Lozano, S. (2014). Nonradial approach to allocating fixed-costs and common revenue using centralized DEA. International Journal of Information Technology & Decision Making, 13( 1), 29–46. doi:10.1142/S0219622014500023
- Lozano, S., & Villa, G. (2004). Centralized resource allocation using data envelopment analysis. Journal of Productivity Analysis, 22(1/2), 143–161. doi:10.1023/B:PROD.0000034748.22820.33
- Lozano, S., Villa, G., & Brännlund, R. (2009). Centralised reallocation of emission permits using DEA. European Journal of Operational Research, 193(3), 752–760. doi:10.1016/j.ejor.2007.07.029
- Lozano, S., Villa, G., & Canca, D. (2011). Application of centralised DEA approach to capital budgeting in Spanish ports. Computers & Industrial Engineering, 60(3), 455–465. doi:10.1016/j.cie.2010.07.029
- Maschler, M., Peleg, B., & Shapley, L. S. (1979). Geometric properties of the kernel, nucleolus, and related solution concepts. Mathematics of Operations Research, 4(4), 303–338. doi:10.1287/moor.4.4.303
- Miao, Z., Geng, Y., & Sheng, J. (2016). Efficient allocation of CO2 emissions in China: A zero sum gains data envelopment model. Journal of Cleaner Production, 112, 4144–4150. doi:10.1016/j.jclepro.2015.07.035
- Milioni, A. Z., de Avellar, J. V. G., Gomes, E. G., & Soares de Mello, J. C. C. B. (2011a). An ellipsoidal frontier model: Allocating input via parametric DEA. European Journal of Operational Research, 209(2), 113–121. doi:10.1016/j.ejor.2010.08.008
- Milioni, A. Z., de Avellar, J. V. G., Rabello, T. N., & De Freitas, G. M. (2011b). Hyperbolic frontier model: A parametric DEA approach for the distribution of a total fixed output. Journal of the Operational Research Society, 62(6), 1029–1037. doi:10.1057/jors.2010.24
- Nakabayashi, K., & Tone, K. (2006). Egoist's dilemma: A DEA game. Omega, 34(2), 135–148. doi:10.1016/j.omega.2004.08.003
- Omrani, H., Beiragh, R. G., & Kaleibari, S. S. (2015). Performance assessment of Iranian electricity distribution companies by an integrated cooperative game data envelopment analysis principal component analysis approach. International Journal of Electrical Power & Energy Systems, 64, 617–625. doi:10.1016/j.ijepes.2014.07.045
- Omrani, H., Shafaat, K., & Alizadeh, A. (2019). Integrated data envelopment analysis and cooperative game for evaluating energy efficiency of transportation sector: A case of Iran. Annals of Operations Research, 274(1–2), 471–499. doi:10.1007/s10479-018-2803-5
- Osborne, M. J., & Rubinstein, A. (1994). A course in game theory. Cambridge, MA: MIT Press.
- Pachkova, E. (2009). Restricted reallocation of resources. European Journal of Operational Research, 196(3), 1049–1057. doi:10.1016/j.ejor.2008.04.027
- Reinhard, S., Lovell, C. K., & Thijssen, G. J. (2000). Environmental efficiency with multiple environmentally detrimental variables; estimated with SFA and DEA. European Journal of Operational Research, 121(2), 287–303. doi:10.1016/S0377-2217(99)00218-0
- Scheel, H. (2001). Undesirable outputs in efficiency valuations. European Journal of Operational Research, 132(2), 400–410. doi:10.1016/S0377-2217(00)00160-0
- Schmeidler, D. (1969). The nucleolus of a characteristic function game. SIAM Journal on Applied Mathematics, 17(6), 1163–1170. doi:10.1137/0117107
- Seiford, L. M., & Zhu, J. (2002). Modeling undesirable factors in efficiency evaluation. European Journal of Operational Research, 142(1), 16–20. doi:10.1016/S0377-2217(01)00293-4
- Sexton, T. R., Silkman, R. H., & Hogan, A. J. (1986). Data envelopment analysis: Critique and extensions. New Directions for Program Evaluation, 1986(32), 73–105. doi:10.1002/ev.1441
- Si, X., Liang, L., Jia, G., Yang, L., Wu, H., & Li, Y. (2013). Proportional sharing and DEA in allocating the fixed cost. Applied Mathematics and Computation, 219(12), 6580–6590. doi:10.1016/j.amc.2012.12.085
- Silva, R. C., Milioni, A. Z., & Teixeira, J. E. (2018). The general hyperbolic frontier model: Establishing fair output levels via parametric DEA. Journal of the Operational Research Society, 69(6), 946–958. doi:10.1057/s41274-017-0278-4
- Smulders, S., & Di Maria, C. (2012). The cost of environmental policy under induced technical change. CESifo Working Paper Series No. 3886. Available at SSRN: https://ssrn.com/abstract=2112952.
- Song, M. L., Fisher, R., Wang, J. L., & Cui, L. B. (2018). Environmental performance evaluation with big data: Theories and methods. Annals of Operations Research, 270(1–2), 459–472. doi:10.1007/s10479-016-2158-8
- Song, M., An, Q., Zhang, W., Wang, Z., & Wu, J. (2012). Environmental efficiency evaluation based on data envelopment analysis: A review. Renewable and Sustainable Energy Reviews, 16(7), 4465–4469. doi:10.1016/j.rser.2012.04.052
- Soytas, U., & Sari, R. (2009). Energy consumption, economic growth, and carbon emissions: Challenges faced by an EU candidate member. Ecological Economics, 68(6), 1667–1675. doi:10.1016/j.ecolecon.2007.06.014
- Sueyoshi, T., & Goto, M. (2012a). DEA environmental assessment of coal fired power plants: Methodological comparison between radial and non-radial models. Energy Economics, 34(6), 1854–1863. doi:10.1016/j.eneco.2012.07.008
- Sueyoshi, T., & Goto, M. (2012b). Weak and strong disposability vs. natural and managerial disposability in DEA environmental assessment: Comparison between Japanese electric power industry and manufacturing industries. Energy Economics, 34(3), 686–699. doi:10.1016/j.eneco.2011.10.018
- Sueyoshi, T., & Yuan, Y. (2015). China's regional sustainability and diversified resource allocation: DEA environmental assessment on economic development and air pollution. Energy Economics, 49, 239–256. doi:10.1016/j.eneco.2015.01.024
- Sun, J., Wu, J., Liang, L., Zhong, R. Y., & Huang, G. Q. (2014). Allocation of emission permits using DEA: Centralised and individual points of view. International Journal of Production Research, 52(2), 419–435. doi:10.1080/00207543.2013.829592
- Tone, K. (2001). A slacks-based measure of efficiency in data envelopment analysis. European Journal of Operational Research, 130(3), 498–509. doi:10.1016/S0377-2217(99)00407-5
- Tone, K., & Tsutsui, M. (2009). Network DEA: A slacks-based measure approach. European Journal of Operational Research, 197(1), 243–252. doi:10.1016/j.ejor.2008.05.027
- Wang, K., Zhang, X., Wei, Y. M., & Yu, S. (2013). Regional allocation of CO2 emissions allowance over provinces in China by 2020. Energy Policy, 54, 214–229. doi:10.1016/j.enpol.2012.11.030
- Wei, C., Ni, J., & Du, L. (2012). Regional allocation of carbon dioxide abatement in China. China Economic Review, 23(3), 552–565. doi:10.1016/j.chieco.2011.06.002
- Wu, H., Du, S., Liang, L., & Zhou, Y. (2013). A DEA-based approach for fair reduction and reallocation of emission permits. Mathematical and Computer Modelling, 58(5–6), 1095–1101. doi:10.1016/j.mcm.2012.03.008
- Wu, J., Liang, L., Yang, F., & Yan, H. (2009). Bargaining game model in the evaluation of decision making units. Expert Systems with Applications, 36(3), 4357–4362. doi:10.1016/j.eswa.2008.05.001
- Wu, J., Liang, L., & Yang, F. (2009). Determination of the weights for the ultimate cross efficiency using Shapley value in cooperative game. Expert Systems with Applications, 36(1), 872–876. doi:10.1016/j.eswa.2007.10.006
- Wu, J., & Liang, L. (2012). A multiple criteria ranking method based on game cross-evaluation approach. Annals of Operations Research, 197(1), 191–200. doi:10.1007/s10479-010-0817-8
- Wu, J., Chu, J. F., & Liang, L. (2016). Target setting and allocation of carbon emissions abatement based on DEA and closest target: An application to 20 APEC economies. Natural Hazards, 84(S1), 279–296. doi:10.1007/s11069-015-1973-6
- Wu, J., Lv, L., Sun, J., & Ji, X. (2015). A comprehensive analysis of China's regional energy saving and emission reduction efficiency: From production and treatment perspectives. Energy Policy, 84, 166–176. doi:10.1016/j.enpol.2015.05.005
- Wu, J., Zhu, Q., Yin, P., & Song, M. (2017). Measuring energy and environmental performance for regions in China by using DEA-based Malmquist indices. Operational Research, 17(3), 715–735. doi:10.1007/s12351-015-0203-z
- Yi, W. J., Zou, L. L., Guo, J., Wang, K., & Wei, Y. M. (2011). How can China reach its CO2 intensity reduction targets by 2020? A regional allocation based on equity and development. Energy Policy, 39(5), 2407–2415. doi:10.1016/j.enpol.2011.01.063
- Yu, M. M., Chen, L. H., & Hsiao, B. (2016). A fixed cost allocation based on the two-stage network data envelopment approach. Journal of Business Research, 69(5), 1817–1822. doi:10.1016/j.jbusres.2015.10.062
- Yu, S., Wei, Y. M., & Wang, K. (2014). Provincial allocation of carbon emission reduction targets in China: An approach based on improved fuzzy cluster and Shapley value decomposition. Energy Policy, 66, 630–644. doi:10.1016/j.enpol.2013.11.025
- Zhang, Y. J., & Hao, J. F. (2015). The allocation of carbon emissions intensity reduction target by 2020 among provinces in China. Natural Hazards, 79(2), 921–937. doi:10.1007/s11069-015-1883-7
- Zhang, Y. J., Wang, A. D., & Da, Y. B. (2014). Regional allocation of carbon emission quotas in China: Evidence from the Shapley value method. Energy Policy, 74, 454–464. doi:10.1016/j.enpol.2014.08.006
- Zhou, P., & Ang, B. W. (2008). Linear programming models for measuring economy-wide energy efficiency performance. Energy Policy, 36(8), 2911–2916. doi:10.1016/j.enpol.2008.03.041
- Zhou, P., Ang, B. W., & Poh, K. L. (2006). Slacks-based efficiency measures for modeling environmental performance. Ecological Economics, 60(1), 111–118. doi:10.1016/j.ecolecon.2005.12.001
- Zhou, P., Ang, B. W., & Poh, K. L. (2008). Measuring environmental performance under different environmental DEA technologies. Energy Economics, 30(1), 1–14. doi:10.1016/j.eneco.2006.05.001
- Zhou, P., Ang, B. W., & Wang, H. (2012). Energy and CO2 emission performance in electricity generation: A non-radial directional distance function approach. European Journal of Operational Research, 221(3), 625–635. doi:10.1016/j.ejor.2012.04.022
- Zhou, P., Poh, K. L., & Ang, B. W. (2007). A non-radial DEA approach to measuring environmental performance. European Journal of Operational Research, 178(1), 1–9. doi:10.1016/j.ejor.2006.04.038
- Zhou, P., & Wang, M. (2016). Carbon dioxide emissions allocation: A review. Ecological Economics, 125, 47–59. doi:10.1016/j.ecolecon.2016.03.001
Appendix
Appendix A
Theorem 1.
Proof.
It is easy to know that thus we just need to show that
can reach
Consider a solution
when
is under consideration in model (8),
and
It is clear that
is a feasible solution of model (8), as it can satisfy all constraints such that
(A1)
(A1)
(A2)
(A2)
(A3)
(A3)
(A4)
(A4)
Therefore, the optimal objective function of model (8) is no less than that with the solution namely,
implying that when
is under consideration the objective function model (8) has reached
Note in addition that the considered is chosen randomly, therefore, it can be concluded that for any
it holds
This completes the proof of Theorem 1.
Appendix B
Theorem 2.
The optimal objective function of model (10) is always zero.
Proof.
First, acknowledging that the objective function of model (10) is no less than zero, which is demonstrated by the fact that the first constraint is held.
Then we show that the objective function of model (10) can reach zero. To this end, let and
Then we consider a solution
where
and
Then
is a feasible solution to model (10), as it satisfies all conditions of model (10) such that
(B1)
(B1)
(B2)
(B2)
(B3)
(B3)
(B4)
(B4)
(B5)
(B5)
(B6)
(B6)
(B7)
(B7)
(B8)
(B8)
Additionally, it is easy to verify that and
Therefore, the optimal objective function of model (10) is no less than the objective function with solution
namely,
So, it demonstrates that the objective function of model (10) can reach zero.
Based on above discussion, it is clear that the objective function of model (10) would be zero. Note in addition that the subscript s is labeled randomly among all desirable outputs, so we can conclude that the optimal objective function of model (10) is always zero. This completes the proof of Theorem 2.
Appendix C
Theorem 3.
All DMUs can be simultaneously efficient with a certain carbon emission abatement allocation scheme under a set of common weights.
Proof.
Return to the proof process of Theorem 2 and the considered solution it is demonstrated by Theorem 2 that the efficiency score of
is unity, as
(B1)
(B1)
Also, using and
the constraints of model (10) can be satisfied for any
under consideration. In addition, it is also possible to determine the efficiency score of other
to be one, as
(B2)
(B2)
To sum up, it is concluded that the solution can make all DMUs simultaneously efficient. This completes the proof that all DMUs can be simultaneously efficient with a certain carbon emission abatement allocation scheme under a set of common weights.
Appendix D
Corollary 1.
The efficient carbon emission abatement allocation scheme can be denoted as following System (11) under a set of common weights:
(11)
(11)
Proof.
According to Theorem 2 and Theorem 3 we can learn that all DMUs can be simultaneously efficient with a certain carbon emissions abatement allocation scheme under a set of common weights, implying
(D1)
(D1)
Therefore, it must be
(D2)
(D2)
Note in particular that and
then by substituting
and
into (D2), we have
(D3)
(D3)
Then divide EquationEquation (D3)(D3)
(D3) by
we have
where
Together with the full allocation requirement non-negative weight requirement
and
and feasible reduction requirement
we have the following formula (D4).
(D4)
(D4)
(D4) can be changed into a linear formula as given in the following (D5).
(D5)
(D5)
(D5) is the same as System (11), where a carbon emission abatement allocation scheme
can make all DMUs simultaneously efficient under a set of common weights
Therefore, this completes the proof of Corollary 1.
Appendix E
Theorem 4.
The characteristic function satisfies super-additive, that is, for any two coalitions
and
, it holds
Proof.
Reconsider model (13) we can easily verify that
Therefore, we have
It completes the proof of super-additive property.□
Appendix F
Table F1. The codes for two-digit Chinese manufacturing industries