
 ?Mathematical formulae have been encoded as MathML and are displayed in this HTML version using MathJax in order to improve their display. Uncheck the box to turn MathJax off. This feature requires Javascript. Click on a formula to zoom.
Abstract
Role playing games have been widely used to develop and validate an agent-based model by observing players’ behaviour. Our study focuses on proposing a novel approach to use role-playing games in the development and validation of an agent-based model. Our innovations include matching the game’s parameters and player composition to reality, incorporating the design of experiments into the data collection, and incorporating operational validation steps into the process. We demonstrate the benefits of our approach by a case study of a dairy supply chain. Our analysis illustrates that the data obtained from the role playing game are valuable for the validation of agent-based models at the micro-level (process and knowledge representation) and, subsequently, improve the validity of the model at the macro-level.
1. Introduction
Operational Research (OR) has long been applied to analyse policies and aid decision making in supply chains such as those in the agriculture and food sectors (Kutcher & Norton, Citation1982). The application of OR started with mathematical modelling but, recently, OR practitioners have begun to incorporate real actors’ behaviours and the associated real-world complexities in their models. However, these behaviours and complexities are still considered as challenging for future OR research (Royston, Citation2013). Real actors’ behaviours include, but are not limited to, how they frame their situation, their bounded rationality and the use of intuitive decision making. These challenges have led to the increasing importance of behavioural OR research (Hämäläinen et al., Citation2013). Agent-based modelling (ABM) has been identified as one of the methodologies that has the potential to overcome these behavioural challenges (Royston, Citation2013). In essence, ABM is a computer simulation approach that models a number of heterogeneous decision-makers (“agents”) who interact using prescribed decision rules that reflect real actors’ behaviours (Farmer & Foley, Citation2009). However, eliciting real actors’ behaviours and developing more representative or valid models of human behaviour remain clear research opportunities in ABM (Macal, Citation2016) and are the motivation for our study.
Researchers have shown that engaging stakeholders in the modelling lifecycle is beneficial for a simulation project (Tako & Kotiadis, Citation2015). Such engagement provides better insights regarding how stakeholders view and structure their problems, and how they make trade-off decisions when faced with a variety of options. These insights are particularly valuable for modelling human behaviour. Furthermore, this engagement with stakeholders makes policy development more inclusive, which is important because a local community may have knowledge or wisdom that is unknown to and not considered by policymakers and modellers. Hence, engaging with a greater range of stakeholders is necessary for future OR practice (Higgins et al., Citation2010).
The benefits of a role-playing game (RPG) in facilitating this engagement have been discussed widely by ABM researchers (Janssen & Ostrom, Citation2006; D. T. Robinson et al., Citation2007; Smajgl et al., Citation2011; Voinov et al., Citation2016). According to Ligtenberg et al. (Citation2010) there are two ways of using RPGs for ABM validation. Firstly, the RPG is used iteratively to define the agents, identify agents’ decision rules and create the best possible model for a specific situation (mode 1). Secondly, the RPG is used to validate an ABM model that has been established (mode 2). This is done by implementing the same micro level behaviours in both the ABM model and the RPG. If the RPG results are qualitatively similar to the ABM model outputs (macro level validation), then the micro-level behaviour in the ABM model is considered valid.
This paper proposes a third way of using the RPG in ABM (mode 3) in which the RPG is used to quantitatively validate the ABM model at the micro level. In this approach, we combine a design of experiments method with the RPG to enable quantitative validation the behaviour of agents in the ABM model (i.e., micro validation). We evaluate our approach using the case of a dairy supply chain in West Java, Indonesia (Utomo et al., Citation2020).
We begin our paper with a review of the use of RPGs in ABM research in Section 2. We describe our methodology in Section 3 and the dairy supply chain case study in Section 4. In Section 5, we explain our process for RPG data collection. Subsequently, in Section 6, we explain how we validated the agent’s decision rules using information gathered through the RPG and the design of experiments method. We discuss the benefits of RPG-based data collection in developing an ABM model in Section 7 and demonstrate how the validated decision rules can increase the operational validity of the model. Finally, we present our conclusions in Section 8.
2. Literature review
We begin by discussing the challenges in ABM data collection, especially for eliciting agents’ behaviours and model validation. Subsequently, we review the role of RPGs in ABM model development and validation. Our discussion encompasses how RPGs have been deployed in earlier ABM studies and how the results were analysed. Finally, we summarise our conclusions drawn from this review.
2.1. Data collection for agent-based model development and validation
Development and validation of an ABM model is particularly challenging when compared to other simulation methodologies (Macal, Citation2016; Onggo & Karatas, Citation2016; Takadama et al., Citation2008). According to Onggo and Karatas (Citation2016), these challenges are: (i) the difficulty in extracting information from real stakeholders in order to represent their behaviours and interactions; (ii) the need to validate at both the micro-level (agent) and the macro-level (system) and the associated difficulty in tracing relationships across these levels (i.e., the interaction between macro level and micro level behaviours); (iii) the unavailability of high fidelity data, particularly that related to human behaviours, to empirically develop and validate a model; (iv) for social systems, the need to take account of qualitative factors such as trust and perception; and (v) the non-linearity caused by path-dependent behaviour (i.e., the same stimuli may generate a different action depending on what has happened earlier).
The challenges in collecting and using real world data are also apparent in other simulation methods (Barlas et al., Citation2015; Onggo & Hill, Citation2014; Perera & Liyanage, Citation2000) and surveys indicate that up to 40% of the research time in a simulation study is spent on data collection (Onggo et al., Citation2013; Perera & Liyanage, Citation2000; Trybula, Citation1994). Numerous data collection methods have been proposed to address the need for more effective data collection in simulation (Barlas et al., Citation2015; Onggo & Hill, Citation2014; Perera & Liyanage, Citation2000; Skoogh & Johansson, Citation2008). In the context of ABM, questionnaire surveys, scenario-based questionnaires, case studies, stylized facts, participant observation, role-playing games, field and laboratory experiments, interviews, expert knowledge, censuses and historical data have all been used (An, Citation2012; Janssen & Ostrom, Citation2006; D. T. Robinson et al., Citation2007; Smajgl et al., Citation2011; Utomo et al., Citation2018; Utomo et al., Citation2020; Yang & Gilbert, Citation2008). For example, and of particular relevance to our case study, Utomo et al. (Citation2018) noted that using secondary and census data are the most popular data collection strategies in the field of agri-food supply chains (e.g., Happe et al., Citation2006, Citation2011; Zimmermann et al., Citation2015). However, although these types of aggregated data are useful for model initialisation, they are not especially helpful in eliciting and validating the agents’ decision rules within an ABM model.
Utomo et al. (Citation2018) noted that the use of RPGs is becoming increasingly popular. The RPG is a collaborative game, monitored by an arbitrator, in which the players engage in a mythical adventure (i.e., they assume fictional characters) (Cook et al., Citation2017). In the context of OR, board games (e.g., the beer distribution game (Sterman, Citation1989) and STRATAGEM (Sterman & Meadows, Citation1985)) and table top exercises (e.g., Fish Banks (Meadows et al., Citation1989) and Anti Bio-Terrorism Table Top Exercise (Deguchi et al., Citation2011)) are popular approaches for RPGs. The RPG can be played manually or aided by computer. Among these RPGs, the beer distribution game is probably the most well-known in the business and management field. In this game, the participants are assigned roles as retailer, wholesaler, distributor, and manufacturer (Sterman, Citation1989; Van Ackere et al., Citation1993). All of the RPGs mentioned earlier have been played by many people who range from undergraduate students to senior managers in multinational companies and other real-world stakeholders (Sterman & Meadows, Citation1985; Van Ackere et al., Citation1993). It should be noted that even though the RPG players might be real stakeholders, they still assume fictional characters or roles. For example, the managers are not managing their own company when they play the beer distribution game.
RPGs can be used as a method to elicit information about the stakeholders’ perceptions and their decision rules by allowing researchers to observe how the players make decisions under various scenarios or policy interventions (D. T. Robinson et al. (Citation2007). Voinov et al. (Citation2016) argue that participatory methods, such as RPGs, may help researchers to understand how real stakeholders process information and make judgments and, also, understand the biases in these judgements. In general, if a study aims to model a specific case then the RPG players can be selected from relevant stakeholders in the case study site (e.g., d'Aquino & Bah, Citation2014). However, if the objective of the study is to test a theory, then the players can be selected from the general public so that comparison between groups can be observed (e.g., Meijer et al., Citation2006).
Guyot and Honiden (Citation2006) argue that a combination of ABM and RPGs can be used in at least three ways: (i) to train the stakeholders to make a decision in a difficult or extreme situation; (ii) to facilitate collective learning and negotiation among the stakeholders; and (iii) to validate and improve the design of a model by observing the stakeholders’ behaviour, which is the focus of our study.
2.2. The role of RPG in ABM development and validation
Moss (Citation2008) classified the process to develop an ABM model as a spectrum with theory-driven models at one extreme and evidence-driven models (or empirical data-driven models) at the other end. The theory-driven examples include models in which the development began by assuming specific theories are used by agents when making their decisions (e.g., utility theory, theory of planned behaviour, transaction cost theory). Pure evidence-driven models are developed based on empirical data without any explicit theoretical starting point. As can be seen , RPGs have been used in theory-driven ABM (i.e., RPG is used to validate a theory-driven ABM) and evidence-driven ABM (i.e., RPG is used for model development).
Table 1. Summary of the literature survey.
With regard to the model validity, ABM models require both micro-validation and macro-validation (Macal, Citation2016; Onggo & Karatas, Citation2016; Takadama et al., Citation2008). Micro-validation confirms the agents’ decision rules in the model while macro-validation evaluates whether the behaviours emerging from the interactions between agents in the model correspond with the observed system level behaviour in the real world. Ligtenberg et al. (Citation2010) offered a more fine-grained classification of ABM validity, presented in .
Table 2. Levels of ABM validity adapted from Ligtenberg et al. (Citation2010) that is mapped to the previous validity classification.
Furthermore, Ligtenberg et al. (Citation2010) suggest that RPG can be used in two modes in ABM, namely:
Mode 1: The RPG is used to iteratively identify the rules used by the stakeholders and adjust the agents’ decision rules in the model and this iterative adjustment might incrementally improve the ABM model validity over time. Ligtenberg et al. (Citation2010) consider that approaches such as companion modelling (Barreteau et al., Citation2001) and the agent-based participatory approach (Guyot & Honiden, Citation2006) would fit into this category. In this mode, an agent’s decision rule is considered valid if it is agreed by the players as a common practice, or if the rule is repeated by several players independently (Salvini et al., Citation2016). This evaluation is made qualitatively via observation during the RPG (e.g., d'Aquino and Bah (Citation2014), discussion during debriefing (e.g., Castella et al. (Citation2005) and post-game interviews (e.g., Papazian et al. (Citation2017). The outcome of this analysis is normally a rule-based decision model (D. T. Robinson et al., Citation2007).
Mode 2: This mode aims to gain insights regarding the representativeness of agents’ behaviours in comparison to the behaviours observed during the RPG and the validation is made by comparing the ABM model outputs with the RPG’s results. In this mode, an agent’s decision rule is considered plausible if the RPG results can reproduce the ABM outputs. The comparison between the ABM outputs and the RPG results can done qualitatively (Ligtenberg et al., Citation2010) or quantitatively by analysing the direction of changes using sensitivity analysis (Tykhonov et al., Citation2008) or by using descriptive statistics (Amadou et al., Citation2018).
illustrates that Mode 1 is more prevalent in earlier research studies. The decision rule elicitation in Mode 1 is prone to biases that arise out of group processes in which the less prominent group members tend to align their opinion to the group leader or to the majority (Kunsch et al., Citation2009). It is also prone to confirmation bias arising from researchers developing their own personal understanding and viewpoints about the system (Voinov & Bousquet, Citation2010). This bias may lead to the observer-expectancy effect in which the researcher unintentionally influences the RPG players during the debriefing or post-game interview. Consequently, in our research, we intend to supplement the approach taken for Mode 1 by the use of a quantitative method to mitigate for the biases that may arise. It should be noted that the use of quantitative analysis to elicit and validate decision rules using RPG data is rarely done (Salvini et al., Citation2016) while Joffre et al. (Citation2015) suggest that these quantitative analyses were limited to descriptive statistics approaches.
In Mode 2, to validate a decision rule used in an ABM model, we implement the same rule in the RPG. If the RPG result is similar to that of the model, then the rule in the ABM is valid. However, different models may yield the same emergent patterns (Gilbert, Citation2004). In other words, a correspondence between what emerges in the RPG and what emerges from the ABM model does not necessarily mean that the agents use the same decision rules as the RPG players. Consequently, our study supplements the Mode 2 approach by addressing the need to compare quantitatively the agents’ decision rules to statistical models of the players’ actions during the game. This quantitative comparison can be achieved by adopting a design of experiments approach to the RPGs and will enable not only the validation of decision rule but also the identification of parameters that are not significant. For example, if a decision rule in a model uses two parameters (i.e., a decision tree with two levels) and one of them is not significant then the valid decision rule only uses only one parameter (i.e., a decision tree with one level). Hence, if the decision rule is not valid, we can identify the valid one.
Finally, illustrates a lack of research studies that addresses the macro (system representation) validity of the final model. Many of these studies featuring in aim to model a proposed new system or policy and, understandably, the data needed for comparison with the ABM outputs are not available. When macro-validation is present in the earlier research, it is carried out theoretically (e.g., Tykhonov et al., Citation2008) or by using descriptive statistics (e.g., Castella et al., Citation2005). We intend to complement these earlier studies by demonstrating how the macro-validity of an ABM model, already micro-validated using the RPG, can be evaluated using operational validity concepts (i.e., evaluating the matching between simulation outputs and historical real-world data (Sargent, Citation2013)). Subsequently, we can evaluate the benefits of the micro-validated decision rules for improving the operational validity of the final model.
2.3. Process to design and deploy RPGs in ABM studies
This section discusses (i) how the RPG is usually designed; (ii) how the RPG data collection is done; (iii) how the data is analysed; and (iv) how the decision rules and the model are validated.
For Mode 1 of ABM development and validation using RPGs, Barreteau et al. (Citation2001) and Guyot and Honiden (Citation2006) have proposed a general scheme to design and deploy the RPG. This scheme is summarised as follows:
Collect information, knowledge and hypotheses relevant to the target system. This step is done by conducting a case study in the real world (e.g., d'Aquino & Bah, Citation2014; Salvini et al., Citation2016; Worrapimphong et al., Citation2010).
Develop the conceptual model of the target system. The conceptual model is a non-software specific description of the computer simulation model that will be developed (S. Robinson, Citation2008a). The process for developing the conceptual model itself can also involve the stakeholders (e.g., D'aquino et al., Citation2003).
Implement the conceptual model. The researcher can then choose to use the conceptual model to first develop the RPG and then use the result to develop the ABM model (e.g., d'Aquino & Bah, Citation2014; Salvini et al., Citation2016), or vice versa (e.g., Amadou et al., Citation2018; Castella et al., Citation2005; Citation2005; Joffre et al., Citation2015).
Use the RPG for data collection by engaging with the stakeholders. As mentioned in Section 2.1 the RPG players are usually selected from the relevant stakeholders in the case study site.
Analyse and use the RPG data. Owing to the richness of interactions between players during the game, the quality of information obtained during the RPG relies heavily on researcher skill (D. T. Robinson et al., Citation2007). As mentioned in Section 2.2, this usually done through observation, discussion during debriefing, and post-game interviews. The data are then usually analysed qualitatively and a rule-based decision model is produced.
Validate and subsequently improve the ABM model design.
For mode 2 of ABM validation using RPG the scheme proposed by Tykhonov et al. (Citation2008) and Ligtenberg et al. (Citation2010) can be summarised as follows:
Develop a baseline ABM model. Both studies are more theory driven. Tykhonov et al. (Citation2008) base their model on the transaction cost concept, while Ligtenberg et al. (Citation2010) base their model on a regional dialogue approach.
Convert the baseline ABM model into the RPG. The baseline model is then converted into the RPG, in which the players are given tasks equivalent to the agents in the ABM model.
Use the RPG for data collection. Because to a certain degree the objective is to test theories, the RPG in these two studies can be played by a more diverse range of players, such as students. The data collected during the RPG is then fed into the ABM.
Compare the RPG results with the ABM model. The simulation is run using scenarios equivalent to the RPG. If the players’ decision rules are correctly represented in the model, then the ABM results should also equivalent to the RPG results.
The method we propose embodies elements that comprise a supplemented combination of the two modes and we provide a more detailed description of this method in Section 3.
2.4. Conclusions from the literature review
Firstly, in this section we have discussed the challenges of the data collection process to develop and validate ABM models and noted that RPGs have potential to address these challenges. We have also shown that RPGs can use board games in their designs. Secondly, RPGs have been used to develop and validate both theory-driven and evidence-driven ABM models. Thirdly, we have summarised how the RPG have been deployed for ABM development and validation in the previous studies. We have highlighted the prevalent of qualitative analysis on RPG data, and the potential biases that might arise in the previous approaches. We also note the lack of macro-validation efforts in the previous studies.
To complement the previous approaches, we propose a new mode in the use of RPG for quantitative ABM model micro-validation. In this proposed mode, an agent’s decision rules are considered valid if the parameters used in the decision rule are statistically significant based on the data generated by the RPG. We also attest the benefits of the micro-validated decision rules for improving the ABM model macro validity using operational validity concepts.
3. Methodology
This section discusses the methodology we employed in our study and our research phases are illustrated in the flowchart presented in .
Figure 1. Research method flowchart.
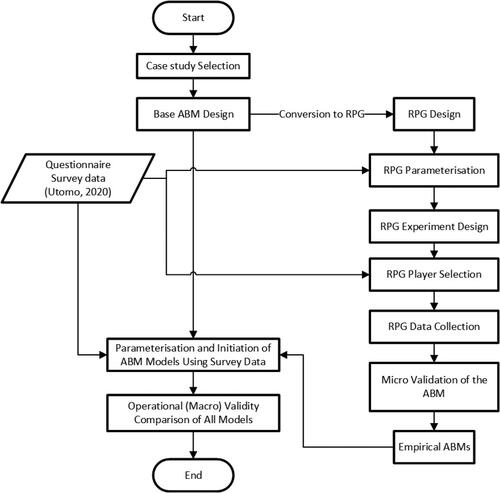
In common with earlier ABM studies, we began by gathering information, knowledge and hypotheses relevant to the target system from the previous literature (theory-driven). We then developed a conceptual model that is described in a more detail in Section 4.1.
In common with Mode 2, we used our conceptual model to develop a base model and then converted it into the RPG. The conversion process is explained in Section 4.3.1–4.3.4. In this process, we designed the objects and schedule used in the game to represent the objects and algorithm in the base model. However, to make the RPG more realistic, we added the additional step of matching the RPG’s parameters with the real-world data, which is rarely included in earlier studies in either Mode 1 or Mode 2. The justification for this additional step is provided by Cowlrick et al. (Citation2011) and Rungtusanatham et al. (Citation2011) who argue that human players tend to exhibit their realistic behaviours when they are facing scenarios that mirror reality. The real data that we used to parameterise our RPG was taken from Utomo et al. (Citation2020).
The potential biases relating to group processes and observer-expectancy were mitigated for by planning in advance the experiment, the type of data to be collected and the analysis. For this purpose, we incorporated a design of experiments approach. This additional step enables us to develop statistical models of the players’ decision rules and complement the normal debriefing and post-game interview used later to elicit the stakeholder’s decision rules.
Prior to using the RPG, we needed to determine the players who would be involved. Even though our base ABM model is theory-driven, the aim of our RPG is to elicit and micro-validate the real stakeholders’ behaviours. Therefore, we chose to use the relevant stakeholders in the case study site, in common with Mode 1. We also tried to match the composition of the stakeholders to that existing in reality. Again, this step aims to increase the likelihood that the players faced similar situations to those they experience in their daily life. This step is rarely done in earlier studies and in our study we applied a clustering technique to the empirical dataset provided by Utomo et al. (Citation2020).
We then used the RPG data to validate the base model at both the micro- and macro-level. With regard to the micro-validation, the design of experiment allowed us to also perform a quantitative analysis (i.e., a statistical modelling) of the RPG data in our study. We then compared whether these statistical models support the agents’ decision rules in the ABM model. If they do then the agents’ decision rules are considered valid.
In addition to the micro-validity, we also evaluated the operational validity of our final model that used decision rules micro-validated using the RPG in order to compare it with the base model. In this evaluation process, all models were compared using the same input data and random seed to eliminate any biases arising from the randomisation process. This process aimed to evaluate whether the micro-validated decision rules are beneficial in improving the macro-validity of the final model, which is a notable omission in previous studies owing to the unavailability of the historical data.
4. The dairy supply chain case study
4.1. Case study description
In this case study, we modelled a dairy supply chain in West Java, Indonesia, using ABM. The model aimed to estimate the size of cow population, cattle population, and milk production. Hence, we are modelling an existing system. The key agents in this model are the farmers, the cooperative and the physical environment. In this supply chain, the milk produced by the farmers is collected and transported to the milk processors by farmers’ cooperatives. The role of a farmers’ cooperative is important because the cost of transporting milk is prohibitively expensive for most farmers who are smallholders with low production levels. Owing to population pressures, the land they own is relatively small and, usually, is only sufficient to build a pen for their cattle. For reasons of security, the pens are usually located next to the farmers’ houses in the middle of residential areas. It is difficult for the farmers to herd their cattle through the residential area, so the farmers need to gather the forage from outside of their village and transported back using carts or motorcycles. In this sense, forage is a common resource for all these farmers.
We summarise our case study in using the conceptual modelling framework proposed by S. Robinson (Citation2008b).
Table 3. conceptual model developed for the case study.
4.2. Description of the base agent-based model
In the longer term, we were interested in proposing policy interventions that support the small-holder farmers so our final model aimed to be a realistic representation of the current situation and it focused on the behaviours of the farmers. We developed a base model using theory-driven approach. In this model the agents’ behaviours are derived from the literature and complemented with experts’ opinion, as presented in . The full model description is provided in Appendix A.
Figure 2. Flowchart of the base ABM of dairy supply chain in West Java Indonesia, accompanied with the main literature used to develop each module. (Please note that procedures using the term “cattle” apply to both male and female animals, while those that use the term “cow” only apply to a female animal.).
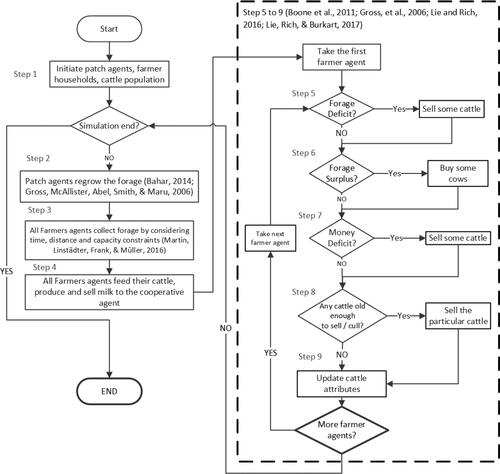
As seen in , the five farmers’ behaviours included in the model were:
Forage collection: when collecting forage, we assumed that farmers prioritize the location with the highest forage level (Martin et al., Citation2016) and the closest to their house.
Trading partner: we assumed that farmers do not buy cows from other farmers but from an external agent (Boone et al., Citation2011).
Cow selling: we assumed that farmers sell their cows when experiencing forage deficit (Gross et al., Citation2006). The number of cows being sold is proportional to the level of forage deficit.
Selling priority: we assumed that farmers would sell the oldest animal first because older cows tend to have more live weight and are less productive (expert opinion).
Cow buying: we assumed that farmers consider buying cows when they have forage surplus and sufficient money (Gross et al., Citation2006). The number of cows bought is equal to the additional cows that can be fed using the excess forage.
These behaviours would be validated using the RPG data. Subsequently, the benefit of the validated decision rules in improving the operational validity of the final model would be evaluated.
4.3. The design of the RPG data collection instrument
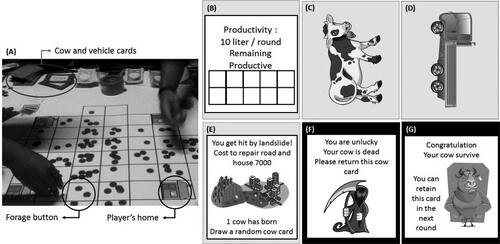
Similar to the beer distribution game, we designed our RPG as a turn-based board game (illustrated in ). This design was selected because of its familiarity for the farmers, compared with a computer game, and it prevented the disruptions associated with an unreliable electricity supply. In the subsequent subsections we explain each element of the RPG, and the process to parameterise them. As we mentioned previously, we aim to match the RPG parameters with the reality to increase the likelihood of the RPG players revealing their real behaviour. This is one of the innovations of this study.
Figure 3. (a) The RPG game board, (b) the back side of cow card, (c) the front side of cow card, (d) the vehicle card, (e) the event card, (f) the mortality card for the dead cow, and (g) the mortality card for the surviving cow.
4.3.1. The players and their attributes
The objective of our RPG was to confirm or refute the behaviours of the farmer agents and the players in the game represent the farmers. The number of players was limited to four to ensure the researchers were not overloaded. The players’ decisions are influenced by a range of attributes. For attributes that can change ownership in the real world (e.g., cows and forage), we designed RPG items that can be physically moved easily during the game. In our case, we used buttons to represent forage, cards to represent cows and vehicles, a small notebook to record milk production, and toy money to represent cash.
For attributes whose ownership does not normally change in the real world (e.g., the milk productivity of one cow cannot be transferred to another cow), we used items that cannot be moved during the game. For example, the milk productivity and productive lifetime of a cow are represented using information printed on the rear of the cow card. The milk productivity represents the amount of milk that is produced by the given cow in a round while the cow’s productive lifetime represents how many rounds it can produce milk for (). In this game, we assumed that a farmer’s house cannot change ownership and is used as a permanent base for the players. Each house is represented as a home cell ().
4.3.2. The environment
The case study site area is approximately 30,000 hectares. This area is represented by 48 cells on the game board (), each representing 6.25 km2 area. This resolution was chosen because, according to domain experts, the farmers travel for at least 2.5 km per day to collect forage.
4.3.3. External events
We used cards to represent external events that may happen in the real world and may influence how decisions are made. These external events are (i) cattle reproduction; (ii) the income from selling male cattle; (iii) the expenses that must be paid by the farmer household; and (iv) the cow mortality. For example, when a player receives the card illustrated in , the player receives one cow and at the same time must pay Rp.7000 for house repairs.
4.3.4. RPG schedule
The RPG schedule was designed to reflect the real farmers’ routine activities and had been face validated by the domain experts. This aligns with Mode 2 in Ligtenberg et al. (Citation2010). At the beginning of a round in the RPG, all players are given a chance to collect forage buttons from the game board by moving to a cell where the forage buttons are located (please refer to step 3 in ). In reality, a farmer has up to eight hours per day to collect forage and is affected by external factors such as weather conditions, illness and vehicle breakdown. To accommodate these uncertainties, the maximum number of moves a player can make is determined by rolling a dice. Any unused moves cannot be carried forward to the next round. The move is always started from the player’s home. If the player decides to take forage buttons from a certain cell, then the player must return and start the next move from his home. The number of forage buttons that can be taken is constrained by the number of vehicles owned by the player. To remove bias, the player's turn in each round is shuffled by using permutations.
The players must then allocate the forage buttons to their cows (one forage button for each cow card) (, step 4). Excess forage buttons can be carried forward to the next round. If a player owns fewer forage buttons than cow cards, then the player can negotiate with other players to obtain more forage buttons or sell some of his cow cards (, step 5). If the cow card is sold to another player, then the buyer must allocate a forage button to the newly bought cow card. Players are free to determine their negotiation strategies and price when trading forage buttons and cow cards. For example, the seller may choose to reveal their cow’s productivity (this information is on the rear of the cow card and only visible to the cow’s owner).
Players add up the total of their milk production and sell it to the cooperative to earn money (only the cow cards that have been allocated a forage button can produce milk). The role of the cooperative was played by a member of the research team. The remaining productive lifetime on each cow card is then decreased by one by ticking one of the productive lifetime boxes () (, step 9). At this stage, for each cow card without a forage button, the owner must draw a card from the mortality card deck. The mortality cards determine whether the cow will survive to the next round ().
All players then draw one event card and follow the instructions written on the drawn card () (, step 7). The drawn card must be returned to the deck after the player has read it to keep the probability of each event constant during the game. This deck is also reshuffled at the beginning of each round.
All players are then given an opportunity to sell or buy cow and/or vehicle cards (, step 6). They can trade these cards with other players or the market (played by a member of the research team). A player is free to decide his negotiation strategies and price. When a player decides to buy a new cow from the market, a new cow card is drawn randomly from the cow card deck.
Finally, the round ends by adding forage buttons to the game board to represent forage regrowth. The cycle continues until the game is stopped by the facilitator. At the end of the game, the monetary value of all players’ assets is calculated. These assets include money, cow cards and vehicle cards. The player with the highest asset value wins the game (, step 2).
4.3.5. RPG initial conditions and parameters
We were interested in observing the players’ general strategies that they use in any given situation rather than replicating the players’ real-world attributes in the game. This approach is common in RPGs (Castella et al., Citation2005) so, at the beginning of the game, each player, regardless of their real-world wealth, receives the same two vehicle cards and four cow cards. This assumption is also important to ensure that the game adheres to the RPG definition (i.e., the players should play fictional characters and not managing their own farm). shows the remaining RPG parameters that were estimated using empirical data.
Table 4. Summary of RPG’s parameters.
4.3.6. Design of experiments
As mentioned earlier in our literature review, typically, RPG researchers collect and analyse qualitative data only. By adding the design of experiments step, we supplemented the qualitative analysis (e.g., observed behaviours) with quantitative analysis. Design of experiments enable us to develop statistical models of the RPG players’ decision rules that later, would be compared to the agents’ decision rules in the ABM model. This is the second innovation of this study.
In our case, we wanted to measure the effect of forage availability and cow mortality on the observed behaviour during the RPG sessions. Thus, we designed our experiments based on these two factors. We used three levels of forage availability and cow mortality (giving us a total of nine experiments). This allowed us to build a logistic regression model of one of the observed behaviours, as described in Section 6.
5. RPG data collection
5.1. Pilot RPG test
We conducted a pilot test involving lecturers and students from the animal husbandry department of a local university and an experienced farmer. The objectives were: (i) to ensure that the RPG was representative and easily understandable for the players; (ii) to ensure that the experiment sets being used had sufficient contrast so that the players may exhibit different behaviours; and (iii) to identify improvement to the RPG design.
Changes based on the feedback from the pilot include adjusting the terminologies in the RPG scripts to match the terminologies commonly used by the local farmers, using toy money instead of a notebook to reduce the mental burden in recording each transaction (and make the game more fun), and changing the instruction written on the event cards into a short story about the event that is familiar to the farmers (to make the RPG more realistic).
From the pilot test, we estimated the time required for each experiment. Owing to the time constraint for data collection, we selected five out of the nine experiments mentioned in Section 4.3.6 (experiments 1–5 in ). One experiment (experiment 6) was added to increase the contrast among the experiment sets.
To demonstrate how we used design of experiment to enable quantitative validation of a decision rule, we select the cow selling decision. In the base model, the decision rule is based on two parameters: forage availability and the probability of cow’s mortality. Hence, we use them as treatments in the design experiment shown in . We use three levels for each treatment. For the forage availability featuring in , the total forage production in the case study site ranges between the equivalent 27 to 49 buttons. We determined the levels of forage availability by selecting values that are within or close to this range, and that enabled us to distribute the forage buttons symmetrically on the game board. Being able to distribute the forage buttons symmetrically was necessary to keep the game fair for all players. Therefore, we selected 24 (close to the lowest value), 36 (close to the median value) and 48 (close to the highest value) as the levels of forage availability. For the probability of cow mortality, the levels were determined based on the pilot test result. The consideration was whether or not the players’ behaviours are sensitive to the different levels presented during the RPG experiments.
Table 5. The final RPG experiment sets.
5.2. Players selection
To select the players, we sent a questionnaire to farmers in 19 villages in West Java and received 153 valid responses. The questionnaire asked about the characteristics of the farmers (e.g., demography, socio-economic status, farming experience). We applied the agglomerative hierarchical and K-means clustering techniques to group the respondents into clusters based on their characteristics. Both clustering methods consistently showed that farmers could be grouped into the three clusters shown in .
Figure 4. Clustering analysis result.
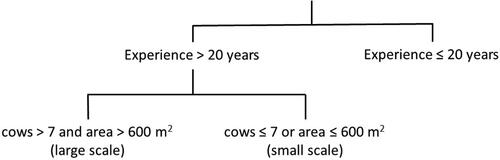
The first cluster was formed by three farmers (2% of the sample) who own large farming businesses (i.e., owns seven or more cows, and more than 600 m2 of land) with more than 20 years of farming experience. The second cluster was formed by 20 experienced farmers whose farming businesses are small (13% of the sample). The majority of farmers (85% of the sample) formed the final cluster. These farmers are less experienced and run small-scale farms.
We invited players from the three clusters to mimic the proportion in the sample as closely as possible. As we have mentioned earlier, this step aims to make the game more realistic and increase the likelihood that the players demonstrate their real behaviour. In addition, this step is also important to ensure that the statistical models derived from the RPG data are representative of the real farmer population. There were very few farmers in cluster 1 (3 people) and all of them were invited to participate in the RPG. describes the composition of players in each RPG experiment.
Table 6. Player composition in the RPG experiments.
5.3. RPG experiment and observation
The RPG experiments were held in the evening to allow all players to complete their daily tasks. Evening time is usually reserved for socializing or holding meetings in the villages. Hence, the players could concentrate fully on the game. All players formally consented to the recording of their actions via the observation table and video recorder.
In the experiment, every two players were accompanied by one researcher who helped them in understanding the RPG rules and assisted them in organising the cards and money they own. The research team could not intervene with the players’ decision-making. Two other researchers took the facilitator and observer roles, as well as recorded every decision made by the players. Hence, the requirement to have the presence of an arbitrator the RPG was satisfied.
The RPG began with an explanation of the purpose of the games, the equipment, rules and game schedules. Before the actual RPG sessions, the players played two trial rounds to familiarise themselves with the RPG. One experiment lasted for 10 rounds or until a one-hour time limit was reached. Every player’s decision was considered as a decision situation and recorded as one data point. This unit of analysis is similar to other experimental gaming studies (e.g., Moffat & Medhurst, Citation2009).
The RPG experiment was concluded with a debriefing session that began by discussing how well the players understood the RPG process. They were then asked to assess the similarity between the RPG and the reality and indicate whether they had ever encountered similar situations in their real experience. The observed decisions were then confirmed to the players. They were asked to describe the decision rules they used. By having anchors based on the observation, we reduced the reliance on the players’ narration and potential biases.
We then asked whether those decision rules had been used in reality. If not, we asked about the conditions that would drive them to actually use those rules. Finally, we elicited their perceptions toward the RPG and possible improvements. Bearing in mind that they have participated in previous data collection exercises (e.g., the government’s agricultural census), we also asked them to compare the usefulness of RPG to other data collection techniques.
6. Data analysis and findings
We cross-referred the decision rules we recorded during the RPG and debriefing with the video recording to ensure that validity of decision rules (i.e., ensure that what the players say during the debriefing, the researchers’ observations and the video recording were consistent). As a result, we excluded several of the data points for reasons such as inconsistency between what a player says and what the player does in the video. In total, 151 data points were retained for analysis. The findings related to the base ABM model’s decision rules mentioned in Section 4.2 are discussed below. We begin with the cow selling decision to demonstrate the use of the design of experiments. The remainder of the validation is based on a descriptive statistical analysis of the players’ actions during the RPG. The table featuring the full RPG result is presented in Appendix B.
6.1. Cow selling
The experiment design allowed us to assess the influence of forage availability and cow mortality on selling decision. We split the forage availability factor into two parameters. The first is the maximum number of forage buttons available on the game board and the second is the deficit of forage button experienced by a player, when he/she decides to sell his/her cow. We developed a logistic regression model to estimate the probability of selling (EquationEquation 1(1)
(1) ). The model is significant with a relatively good fit (significance < 5%, Nagelkerke pseudo R2 = 53.7%). It shows that the probability of a player to sell his/her cow increases as the likelihood for a cow to die increases. In this equation the forage availability parameters are excluded from Equationequation 1
(1)
(1) because they are statistically insignificant (see Appendix C). This also confirms the observation during RPG that the players prefer not to buy cows from other players.
(1)
(1)
During the debriefing, the players explained that farmers tend to keep their cows even when experiencing forage deficit provided that the local veterinarian considers their cows to be healthy during his/her weekly visit. In this RPG, the veterinarian’s assessment is represented by the cow mortality scenario being used. This shows that their main concern is the health of their cows which was different from the hypothesized selling decision rule. Therefore, we use the new decision rule with one parameter (Equationequation 1(1)
(1) ) in the final model. This result demonstrates the benefit of validating an ABM model at both process and knowledge representation levels.
6.2. Forage collection
Players make the forage collection decision when they decide on how to collect the forage. The results showed that the hypothesized decision rule is observed in 45% of the instances (note that this does not mean 45% of players use this rule). The result also revealed two other variants:
The players choose a cell in which the number of forage buttons is greater than or equal to their transport capacity (not necessary the cell with the highest number of forage buttons) and the nearest to their home (52% of the instances).
The players choose the nearest cell regardless of the number of forage buttons on it (3% of the instances).
All three decision rules show the preference for a location close to home. This is because farmers want to minimize their travelling time and this was confirmed during the debriefing. However, the debriefing revealed another local cultural reason. A location that is far from home is likely to be too close to other farmers’ homes and, in the Indonesian context, collecting forage in this location is considered to be disrespectful and can trigger conflict because forage is a common resource. Hence, a policy intervention that assumes farmers make the decision purely based on cost minimisation may result in unintended consequences such as inter-farmer conflict. This illustrates the value of RPG in uncovering the motives behind a decision.
6.3. Trading partner
The data shows that all cow card transactions were made with the cattle trader instead of with other players, which confirmed the assumption in the model. The debriefing uncovered the underlying reason behind this decision rule. When a farmer is trying to sell a cow to another farmer, the prospective buyer tends to doubt the quality of the cow because, from experience, a farmer is unlikely to sell a highly productive cow. It is also easy to temporarily increase a cow’s milk productivity by stopping milking the cow for several days prior to the transaction. To avoid this, the buyer needs to spend several days observing the productivity of the cow which may be impractical. This is another example where RPG can uncover the motive behind a decision.
6.4. Cow selling priority
The result shows that in 83% of the instances, the players chose to sell the cow with the lowest remaining productive lifetime. This confirmed the hypothesized decision rule. The remaining observed behaviour during the RPG can be explained by the players’ strategy to win the game by selling their cows towards the end of the game. Hence, it does not reflect their real-world practice and excluded from further analysis.
6.5. Cow buying
The result showed that, in 86% of the instances, players buy cows when they have enough money and excess forage, confirming the agents’ decision rule in the base ABM model. However, the RPG also uncovered two other variants:
Even when experiencing a forage deficit, some players buy cows to replace those who die if they have enough money (10% of the instances).
When they have extra forage but not enough money, they still buy cows by borrowing some money from another player (4% of the instances).
The debriefing further revealed two reasons why players buy new cows, namely, to increase the number of cows (83% of the instances) or to upgrade the quality of their cows (17% of the instances). During the debriefing, the players told us that the decision to upgrade is to increase their profitability as what they do in the real world.
Throughout this section we have demonstrated the benefit of our RPG design to micro-validate the decision rules in the base ABM. From this analysis the micro-validity trading partner selection and selling priority decisions are sufficiently high. Hence, we can retain these decision rules in our final ABM. However, this analysis also shows that the forage collection, cow selling and cow buying decisions in the base ABM do not fully reflect what the farmers do. Hence, we use the information obtained during the RPG to develop new (empirical) forage collection, cow selling and cow buying decision rules. In Section 7.2 we will evaluate whether these new decision rules can also improve the macro-validity of the ABM.
7. Discussion
7.1. RPG as a data collection instrument
The players felt that the RPG gave them more freedom to express their feelings and behaviours. For example, when participating in a survey, they felt that sometimes interpreting questions and options in a questionnaire can be quite cumbersome, especially if the questionnaire uses different terminology to that which they are accustomed to in their daily life. Furthermore, during interviews, they found it difficult to explain their perceptions in a way that could be properly understood by the interviewer. According to them, playing the RPG was fun and less boring and less intimidating than responding to surveys or interviews. More importantly, most players found this RPG to be compelling. Based on the players’ appraisal, the RPG represents 70–80% of their real experiences and this suggests a relatively high level of validity for the RPG as a data collection instrument.
7.2. RPG’S impact on model validity
The impacts of the RPG on model micro-validity is achieved through its ability to elicit decision rules empirically from the players. We have demonstrated these benefits in Section 6. In our case, the players confirmed that what they experienced in the game was very similar to their real experiences. For the cow selling decision, the micro-validity can even be evaluated quantitatively by using a logistic regression model. In addition to validating the process, we can also validate the knowledge used by the players to make their decision. For example, in this study we can eliminate the forage availability parameter from the cow selling decision because it is not a significant parameter in the statistical model. The players also confirmed that they never considered this parameter in reality. This is one of the benefits of adopting the design of experiments approach in RPG data collection.
The remainder of this section focus on evaluating the benefit of our RPG data collection to improve the macro-validity of the ABM model of an existing system. In our case study, the ABM aims to produce estimates of cattle population, cow population and milk production ().
Table 7. Cattle population, cow population and average daily milk production in Pangalengan West Java 2010–2012 (KPBS, Citation2016).
We compared the macro-validity of the base model (M0 – model with hypothesized decision rules) with the empirical models (M1–M3). Each empirical model replaced one hypothesized decision rule with the micro-validated decision rules obtained from the RPG (forage decision in M1, selling decision in M2 and buying decision in M3). The mean error estimation was used to measure the magnitude of model output deviations from the real data. This was done by measuring the mean difference between model outputs at the end of each simulation year and the real data (i.e., where
and i = 2010 … 2012). shows the average (
), standard deviation (
), and the two-tailed significance of the t-test at 95% confidence level (sig. column).
Table 8. The macro-validation of the ABM.
A significance value higher than 5% indicates that we fail to reject the null hypothesis that the simulation output reflects the real data (i.e., a valid model) and a lower value indicates that the model output is closer to the real data. The result shows that incorporating the elicited selling decision rule improves the macro-validity of the base model (i.e., from being valid in two outputs to all three outputs). This illustrates that the RPG validation exercise is beneficial to increase both micro and macro validity of our ABM model.
7.3. Methodological insights
One of the challenges in simulation methodology is how to engage stakeholders who have no understanding of simulation modelling (Tako & Kotiadis, Citation2015; Taylor et al., Citation2009). Our study confirms that our RPG approach can help the participants to describe more easily how they behave in reality. According to the players, unlike in interviews or surveys, in the RPG they have no difficulty in understanding the questions being asked and the constructs being used. If designed properly, they can relate the situations they face in the games to those of their daily life. This provides OR researchers with a rich opportunity to obtain more insights from the stakeholders by triangulating the data from the observed behaviour, post-game interviews and debriefing.
Another general benefit of a RPG is to reduce memory loss bias. Memory loss bias often makes retrospective self-reports unreliable except for very salient events (Janssen & Ostrom, Citation2006). A RPG requires the players to solve a current and representative decision problem in each round rather than recall a previous event to answer an interview or survey question or to explain their behaviour in a way that is understandable for the researcher. Consequently, engaging stakeholders to play a RPG can reduce the biases from memory loss. In our case, the RPG was designed to maintain the correspondence between the game and the reality, which made the relationship between the RPG and reality more vivid for the players. This has improved their ability to explain how they make decisions in the real world.
Our innovation complements the previous approaches in ABM development and validation using RPG. We compare the agents’ decision rules with statistical models of RPG players action during the game, instead of using qualitative analysis to iteratively adjust agents’ decision rules (mode 1) or comparing the ABM outputs to the RPG results (mode 2). This innovation is implemented in our RPG method by:
RPG parameterisation using real world data and incorporating cluster analysis to select relevant stakeholders. These are done to maintain the correspondence between the RPG and the real world. As we have mentioned in our literature review, we believe that it is more likely for the players to exhibit their realistic behaviours when the situations they are facing mirror the reality. Players’ perceptions towards our RPG in Section 7.1 clearly reflect that this objective has been achieved. Hence these steps are valuable when designing RPG data collection for developing an ABM.
Inclusion of the design of experiments in the RPG data collection process. In our study we incorporated design of experiments in our RPG data collection process. This step reduced the reliance on researcher skills when analysing information obtained from RPG data collection. It enabled us to use quantitative analysis when comparing the agents’ decision rules to the RPG players actions during the game, and as we have demonstrated this by using a logistic regression analysis. It has allowed us to micro-validate the agents’ decision rule at process and knowledge representation levels. It also minimised researcher subjectivity when interpreting the data, and hence minimised biases arising from the group process and confirmation bias. Another benefit of this step is that it enabled us to obtain both equation-based and rule-based decision rules.
Evaluation of the improvement in an agent-based model’s operational validity by including RPG-derived decision rules. Another innovation is that we iteratively evaluated the improvement in the model’s operational validity produced by each RPG decision rule. As we mentioned in our literature review, the evaluation of operational validity is rarely done in ABM studies that use RPGs. In this study we demonstrate that a RPG is beneficial in eliciting decision rules that can improve the operational validity of an ABM model. In addition to improving confidence in the final model, this step provides us with feedback that can be used to understand our RPG data better. For example, shows that the elicited forage collection decision systematically over-estimated the three outputs. This is because the players know the number of forage buttons in all cells. In reality, the farmers can only visually assess the amount of forage they can obtain from a particular location while they are travelling on the ground. The systematic over-estimation indicated that the elicited forage collection rule is more efficient and produces positive impacts on all model outputs. This can happen if farmers have an aerial view of the forage. Hence, technologies such as drones can be considered for this purpose. Clearly, aerial monitoring cannot give an accurate estimate regarding the forage availability, but it can help the farmers to make a visual assessment and plan their trips accordingly.
8. Conclusion
The main objective of our study was to propose a novel way to use RPG in developing and validating an ABM and evaluate the benefits of this new design. Our study provides novelty and a contribution, in that: (i) by incorporating the design of experiments as a part of our primary data collection, we demonstrate a process to quantitatively validate the agent’s decision rules in an agent-based model using RPG; (ii) we demonstrate that it is possible to develop both rule-based and equation-based decision rules from the RPG data; (iii) we demonstrate that our design allows micro-validation of agents’ decision rule at process and knowledge representation level; (iv) we quantitatively show that RPG data collection is beneficial in producing a model with higher operational validity; and (v) we identify and discuss the benefits of RPGs when developing an ABM.
The case study was chosen because it is conceptually similar to other studies in the agri-food supply chain domain, which reinforces its value in demonstrating the benefits of the innovations that we propose. Building upon these innovations, we plan to evaluate the wider applicability of our methods using case studies with significantly different characteristics in other domains.
Disclosure statement
No potential conflict of interest was reported by the author.
References
- Amadou, M. L., Villamor, G. B., & Kyei-Baffour, N. (2018). Simulating agricultural land-use adaptation decisions to climate change: An empirical agent-based modelling in northern Ghana. Agricultural Systems, 166, 196–209. https://doi.org/10.1016/j.agsy.2017.10.015
- An, L. (2012). Modeling human decisions in coupled human and natural systems: Review of agent-based models. Ecological Modelling, 229, 25–36. https://doi.org/10.1016/j.ecolmodel.2011.07.010
- Bahar, S. (2014). Produktivitas hijauan pakan untuk produksi sapi potong di Sulawesi Selatan. JITV, 19.
- Barlas, P., Heavey, C., & Dagkakis, G. (2015). An open source tool for automated input data in simulation. International Journal of Simulation Modelling, 14(4), 596–608. https://doi.org/10.2507/IJSIMM14(4)3.306
- Barreteau, O., Bousquet, F., & Attonaty, J.-M. (2001). Role-playing games for opening the black box of multi-agent systems: Method and lessons of its application to Senegal River Valley irrigated systems. Journal of Artificial Societies and Social Simulation, 4(2), 5.
- Boone, R. B., Galvin, K. A., BurnSilver, S. B., Thornton, P. K., Ojima, D. S., & Jawson, J. R. (2011). Using coupled simulation models to link pastoral decision making and ecosystem services. Ecology and Society, 16(2), 6. https://doi.org/10.5751/ES-04035-160206
- Campo, P. C., Mendoza, G. A., Guizol, P., Villanueva, T. R., & Bousquet, F. (2009). Exploring management strategies for community-based forests using multi-agent systems: A case study in Palawan. Journal of Environmental Management, 90(11), 3607–3615.
- Castella, J.-C., Boissau, S., Trung, T. N., & Quang, D. D. (2005). Agrarian transition and lowland–upland interactions in mountain areas in northern Vietnam: Application of a multi-agent simulation model. Agricultural Systems, 86(3), 312–332. https://doi.org/10.1016/j.agsy.2004.11.001
- Castella, J.-C., Trung, T. N., & Boissau, S. (2005). Participatory simulation of land-use changes in the northern mountains of Vietnam: The combined use of an agent-based model, a role-playing game, and a geographic information system. Ecology and Society, 10(1), 27. https://doi.org/10.5751/ES-01328-100127
- Chaturvedi, A., Armstrong, B., & Chaturvedi, R. (2014). Securing the food supply chain: Understanding complex interdependence through agent-based simulation. Health and Technology, 4(2), 159–169.
- Cook, M. P., Gremo, M., & Morgan, R. (2017). Playing around with literature: Tabletop role-playing games in middle grades ELA. Voices from the Middle, 25(2), 62–69.
- Cowlrick, I., Hedner, T., Wolf, R., Olausson, M., & Klofsten, M. (2011). Decision‐making in the pharmaceutical industry: Analysis of entrepreneurial risk and attitude using uncertain information. R&D Management, 41(4), 321–336. https://doi.org/10.1111/j.1467-9310.2011.00649.x
- d'Aquino, P., & Bah, A. (2014). Multi-level participatory design of land use policies in African drylands: A method to embed adaptability skills of drylands societies in a policy framework. Journal of Environmental Management, 132, 207–219. https://doi.org/10.1016/j.jenvman.2013.11.011
- D'aquino, P., Le Page, C., Bousquet, F., & Bah, A. (2003). Using self-designed role-playing games and a multi-agent system to empower a local decision-making process for land use management: The SelfCormas experiment in Senegal. Journal of Artificial Societies and Social Simulation, 6(3).
- Deguchi, H., Saito, T., Ichikawa, M., Tanuma, H. (2011). Simulated tabletop exercise for risk management-anti bio-terrorism scenario simulated tabletop exercise. Developments in Business Simulation and Experiential Learning: Proceedings of the Annual ABSEL Conference.
- Farmer, J. D., & Foley, D. (2009). The economy needs agent-based modelling. Nature, 460(7256), 685–686.
- Gilbert, N. (2004). Agent-based social simulation: Dealing with complexity. The Complex Systems Network of Excellence, 9(25), 1–14.
- Gross, J., McAllister, R. R., Abel, N., Smith, D. S., & Maru, Y. (2006). Australian rangelands as complex adaptive systems: A conceptual model and preliminary results. Environmental Modelling & Software, 21(9), 1264–1272. https://doi.org/10.1016/j.envsoft.2005.04.024
- Guyot, P., & Honiden, S. (2006). Agent-based participatory simulations: Merging multi-agent systems and role-playing games. Journal of Artificial Societies and Social Simulation, 9(4).
- Hämäläinen, R. P., Luoma, J., & Saarinen, E. (2013). On the importance of behavioral operational research: The case of understanding and communicating about dynamic systems. European Journal of Operational Research, 228(3), 623–634. https://doi.org/10.1016/j.ejor.2013.02.001
- Happe, K., Hutchings, N., Dalgaard, T., & Kellerman, K. (2011). Modelling the interactions between regional farming structure, nitrogen losses and environmental regulation. Agricultural Systems, 104(3), 281–291. https://doi.org/10.1016/j.agsy.2010.09.008
- Happe, K., Kellermann, K., & Balmann, A. (2006). Agent-based analysis of agricultural policies: An illustration of the agricultural policy simulator AgriPoliS, its adaptation and behavior. Ecology and Society, 11(1), 49. https://doi.org/10.5751/ES-01741-110149
- Higgins, A., Miller, C., Archer, A., Ton, T., Fletcher, C., & McAllister, R. (2010). Challenges of operations research practice in agricultural value chains. Journal of the Operational Research Society, 61(6), 964–973. https://doi.org/10.1057/jors.2009.57
- Janssen, M., & Ostrom, E. (2006). Empirically based, agent-based models. Ecology and Society, 11(2), 37. https://doi.org/10.5751/ES-01861-110237
- Joffre, O. M., Bosma, R. H., Ligtenberg, A., Tri, V. P. D., Ha, T. T. P., & Bregt, A. K. (2015). Combining participatory approaches and an agent-based model for better planning shrimp aquaculture. Agricultural Systems, 141, 149–159. https://doi.org/10.1016/j.agsy.2015.10.006
- KPBS. (2016). Data Populasi dan Penghasilan Anggota KPBS. [Data set].
- Kunsch, P. L., Kavathatzopoulos, I., & Rauschmayer, F. (2009). Modelling complex ethical decision problems with operations research. Omega, 37(6), 1100–1108. https://doi.org/10.1016/j.omega.2008.11.006
- Kutcher, G. P., & Norton, R. D. (1982). Operations research methods in agricultural policy analysis. European Journal of Operational Research, 10(4), 333–345. https://doi.org/10.1016/0377-2217(82)90084-4
- Ligtenberg, A., van Lammeren, R. J. A., Bregt, A. K., & Beulens, A. J. M. (2010). Validation of an agent-based model for spatial planning: A role-playing approach. Computers, Environment and Urban Systems, 34(5), 424–434. https://doi.org/10.1016/j.compenvurbsys.2010.04.005
- Macal, C. M. (2016). Everything you need to know about agent-based modelling and simulation. Journal of Simulation, 10(2), 144–156. https://doi.org/10.1057/jos.2016.7
- Martin, R., Linstädter, A., Frank, K., & Müller, B. (2016). Livelihood security in face of drought – Assessing the vulnerability of pastoral households. Environmental Modelling & Software, 75, 414–423. https://doi.org/10.1016/j.envsoft.2014.10.012
- Meadows, D., Fiddaman, T., & Shannon, D. (1989). Fish banks. Institute for Policy and Social Science Research. University of New Hampshire.
- Meijer, S., Hofstede, G. J., Beers, G., & Omta, S. (2006). Trust and Tracing game: Learning about transactions and embeddedness in a trade network. Production Planning & Control, 17(6), 569–583. https://doi.org/10.1080/09537280600866629
- Moffat, J., & Medhurst, J. (2009). Modelling of human decision-making in simulation models of conflict using experimental gaming. European Journal of Operational Research, 196(3), 1147–1157. https://doi.org/10.1016/j.ejor.2008.05.003
- Moss, S. (2008). Alternative approaches to the empirical validation of agent-based models. Journal of Artificial Societies and Social Simulation, 11(1), 5.
- Onggo, B. S., & Hill, J. (2014). Data identification and data collection methods in simulation: A case study at ORH Ltd. Journal of Simulation, 8(3), 195–205. https://doi.org/10.1057/jos.2013.28
- Onggo, B. S., & Karatas, M. (2016). Test-driven simulation modelling: A case study using agent-based maritime search-operation simulation. European Journal of Operational Research, 254(2), 517–531. https://doi.org/10.1016/j.ejor.2016.03.050
- Onggo, B. S., Hill, J., & Brooks, R. J. (2013). A pilot survey on data identification and collection in simulation projects [Paper presentation]. European Simulation and Modeling Conference.
- Papazian, H., Bousquet, F., Antona, M., & d'Aquino, P. (2017). A stakeholder-oriented framework to consider the plurality of land policy integration in Sahel. Ecological Economics, 132(13), 155–168. https://doi.org/10.1016/j.ecolecon.2016.10.020
- Perera, T., & Liyanage, K. (2000). Methodology for rapid identification and collection of input data in the simulation of manufacturing systems. Simulation Practice and Theory, 7(7), 645–656. https://doi.org/10.1016/S0928-4869(99)00020-8
- Quang, D. V., Schreinemachers, P., & Berger, T. (2014). Ex-ante assessment of soil conservation methods in the uplands of Vietnam: An agent-based modeling approach. Agricultural Systems, 123, 108–119. https://doi.org/10.1016/j.agsy.2013.10.002
- Rasch, S., Heckelei, T., Oomen, R., & Naumann, C. (2016). Cooperation and collapse in a communal livestock production SES model – A case from South Africa. Environmental Modelling & Software, 75, 402–413. https://doi.org/10.1016/j.envsoft.2014.12.008
- Robinson, S. (2008a). Conceptual modelling for simulation Part I: Definition and requirements. Journal of the Operational Research Society, 59(3), 278–290. https://doi.org/10.1057/palgrave.jors.2602368
- Robinson, S. (2008b). Conceptual modelling for simulation Part II: A framework for conceptual modelling. Journal of the Operational Research Society, 59(3), 291–304. https://doi.org/10.1057/palgrave.jors.2602369
- Robinson, D. T., Brown, D. G., Parker, D. C., Schreinemachers, P., Janssen, M. A., Huigen, M., Wittmer, H., Gotts, N., Promburom, P., Irwin, E., Berger, T., Gatzweiler, F., & Barnaud, C. (2007). Comparison of empirical methods for building agent-based models in land use science. Journal of Land Use Science, 2(1), 31–55. https://doi.org/10.1080/17474230701201349
- Royston, G. (2013). Operational research for the real world: Big questions from a small island. Journal of the Operational Research Society, 64(6), 793–804. https://doi.org/10.1057/jors.2012.188
- Rungtusanatham, M., Wallin, C., & Eckerd, S. (2011). The vignette in a scenario‐based role‐playing experiment. Journal of Supply Chain Management, 47(3), 9–16. https://doi.org/10.1111/j.1745-493X.2011.03232.x
- Salvini, G., Ligtenberg, A., Van Paassen, A., Bregt, A., Avitabile, V., & Herold, M. (2016). REDD + and climate smart agriculture in landscapes: A case study in Vietnam using companion modelling. Journal of Environmental Management, 172, 58–70.
- Sargent, R. G. (2013). Verification and validation of simulation models. Journal of Simulation, 7(1), 12–24.
- Skoogh, A., & Johansson, B. (2008). A methodology for input data management in discrete event simulation projects [Paper presentation] 2008. Winter Simulation Conference.
- Smajgl, A., Brown, D. G., Valbuena, D., & Huigen, M. G. (2011). Empirical characterisation of agent behaviours in socio-ecological systems. Environmental Modelling & Software, 26(7), 837–844. https://doi.org/10.1016/j.envsoft.2011.02.011
- Sterman, J. D. (1989). Modeling managerial behavior: Misperceptions of feedback in a dynamic decision making experiment. Management Science, 35(3), 321–339. https://doi.org/10.1287/mnsc.35.3.321
- Sterman, J. D., & Meadows, D. (1985). STRATAGEM-2: A microcomputer simulation game of the Kondratiev Cycle. Simulation & Games, 16(2), 174–202. https://doi.org/10.1177/0037550085162006
- Takadama, K., Kawai, T., & Koyama, Y. (2008). Micro-and macro-level validation in agent-based simulation: Reproduction of human-like behaviors and thinking in a sequential bargaining game. Journal of Artificial Societies and Social Simulation, 11(2), 9.
- Tako, A. A., & Kotiadis, K. (2015). PartiSim: A multi-methodology framework to support facilitated simulation modelling in healthcare. European Journal of Operational Research, 244(2), 555–564. https://doi.org/10.1016/j.ejor.2015.01.046
- Taylor, S. J., Eldabi, T., Riley, G., Paul, R. J., & Pidd, M. (2009). Simulation modelling is 50! Do we need a reality check? Journal of the Operational Research Society, 60(sup1), S69–S82. https://doi.org/10.1057/jors.2008.196
- Trybula, W. (1994). Building simulation models without data [Paper presentation].Proceedings of IEEE International Conference on Systems, Man and Cybernetics. https://doi.org/10.1109/ICSMC.1994.399838
- Tykhonov, D., Jonker, C. M., Meijer, S., & Verwaart, D. (2008). Agent-based simulation of the trust and tracing game for supply chains and networks. Journal of Artificial Societies and Social Simulation, 11(3), 1–30.
- Utomo, D. S., Onggo, B. S., & Eldridge, S. (2018). Applications of agent-based modelling and simulation in the agri-food supply chains. European Journal of Operational Research, 269(3), 794–805. https://doi.org/10.1016/j.ejor.2017.10.041
- Utomo, D. S., Onggo, B. S. S., Eldridge, S., Daud, A. R., & Tejaningsih, S. (2020). Eliciting agents’ behaviour using scenario-based questionnaire in agent-based dairy supply chain simulation. Journal of Simulation, 1–15. https://doi.org/10.1080/17477778.2020.1753251
- Van Ackere, A., Larsen, E. R., & Morecroft, J. D. W. (1993). Systems thinking and business process redesign: An application to the beer game. European Management Journal, 11(4), 412–423. https://doi.org/10.1016/0263-2373(93)90005-3
- Voinov, A., & Bousquet, F. (2010). Modelling with stakeholders. Environmental Modelling & Software, 25(11), 1268–1281. https://doi.org/10.1016/j.envsoft.2010.03.007
- Voinov, A., Kolagani, N., McCall, M. K., Glynn, P. D., Kragt, M. E., Ostermann, F. O., Pierce, S. A., & Ramu, P. (2016). Modelling with stakeholders–next generation. Environmental Modelling & Software, 77, 196–220. https://doi.org/10.1016/j.envsoft.2015.11.016
- Worrapimphong, K., Gajaseni, N., Le Page, C., & Bousquet, F. (2010). A companion modeling approach applied to fishery management. Environmental Modelling & Software, 25(11), 1334–1344. https://doi.org/10.1016/j.envsoft.2010.03.012
- Yang, L., & Gilbert, N. (2008). Getting away from numbers: Using qualitative observation for agent-based modeling. Advances in Complex Systems, 11(02), 175–185. https://doi.org/10.1142/S0219525908001556
- Zimmermann, A., Möhring, A., Mack, G., Ferjani, A., & Mann, S. (2015). Pathways to truth: Comparing different upscaling options for an agent-based sector model. Journal of Artificial Societies and Social Simulation, 18(4), 11. https://doi.org/10.18564/jasss.2862
Appendices
Appendix A:
Full model description
The model aims to replicate the dynamics of milk production, cow population and cattle population in the case study area. Those variables are important for policy makers as indicated by the annual reporting of industry statistics. To produce these outputs, the model uses several inputs such as the initial number of farmer households, number of family labour, cattle ownership, and cow productivity. The values of these parameters are identified using the survey described in the paper.
There are three types of agent in the model, namely: a number of farmer households, a cooperative and forage patches. The farmer household’s role is to produce and supply milk to the cooperative. The cooperative sets the milk price based on the milk quality and then sells the milk to the milk processing industry. The farmers interact with the patches whose main function is to provide forage for their cows. The conditions in the case study area are representative for the typical supply chain in Indonesia though the arrangement of the agents in the system may vary. The simulation operates on daily time step, although some processes occur on a monthly and annual schedule.
A.1 The patch agent
There are 306 patches in the model; each represents an area of one kilometre square. We define three types of patch: used patch, unused patch and forage patch. Used patches represent the land area that has been occupied by building, houses, roads, etc. Unused patches represent empty land areas that can be used to build new cattle pens but not to grow forage. Forage patches represent land areas that are overgrown with forage.
Every day the patches produce forage. EquationEquation A.1(1)
(1) describes the amount of forage production (kg per km2 per day).
(A.1)
(A.1)
represents the maximum amount of forage (kg) per kilometre square area. There are various forage grass species in the case study area and the actual composition is unknown. However, Bahar (Citation2014) estimates the forage productivity of various grass composition that can grow in a one kilometre square area in Indonesia is between 270 and 734 tonnes per km2. Hence, in each run, the maximum amount of forage that can grow on a patch is randomized within this range using a uniform distribution.
is the initial forage level at day t and
is the amount of forage taken by the farmers on day t. G represents the forage growth rate with an average value of 1.1% per day (Bahar, Citation2014).
A.2 The farmer household agent
A farmer household agent consists of several family members who work together to rear cattle. Each farmer household has several attributes. Some of the farmer’s attributes are modelled as variables (e.g., money, number of cattle, pen area and type of transportation mode). Other farmer attributes are modelled as lists (e.g., family members’ age, cattle gender, cattle age, the percentage of fodder fulfilment, services per conception and maximum milk production). Each element in the services per conception and maximum milk production list represents the fertility and the maximum milk that can be produced by each cow respectively. The elements in these lists only have a non-zero value for the cows.
In line with the previous studies, we assume that the farmers accumulate their assets (i.e., money and cattle) over time (Gross et al., Citation2006). Farmers’ income comes from milk and cattle selling and they use their money to pay monthly living expenses. According to our experts, rearing dairy cattle is very time consuming so very few farmers have sources of income other than producing and selling milk. Therefore, we assume that farmers do not produce crops or have off-farm jobs. In common with earlier studies, we assume that farmers increase their assets by using strategies to collect forage, sell milk, sell cattle, buy cattle and expand pen area (Gross et al., Citation2006).
A.2.1 The forage collection process
Every day farmers collect forage to feed their cattle. They scan forage patches around their house. The number of working hours and the speed of the transportation mode at their disposal limit the maximum distance they can travel. Each farmer household typically has 8 h per day to collect forage during the period between the cooperative’s milk collections (i.e., 7 am and 3 pm). In the case study area, the farmers collect forage on foot or by motorcycle or truck. In common with Martin et al. (Citation2016), we assume that farmers prioritize the location with the highest forage level when choosing the location to collect forage. If there is more than one location with the highest forage level then farmers prioritize forage collection from the closest location to their house.
Having decided the location to collect forage, the agents move to the designated patch. Their travel time is subtracted from their remaining working hours. The amount of forage they can collect from the given patch is constrained by the patch’s forage level, the amount of family labour, their remaining working hours and their transport capacity. Actual measurements regarding these variables were not available so we asked our expert to suggest reasonable approximations based on his experience. The expert suggested that each family labourer could harvest 40 kg of forage per hour. Furthermore, the expert suggested that they could carry 40 kg of forage per person per trip if they transported the forage on their back or using a cart, 60 kg of forage per trip if they used motorcycle and 600 kg of forage per trip if they used a truck.
A.2.2 The cattle feeding process
Farmer agents use the forage to feed their cattle. The cattle require 40 kg of fodder each per day that comprises forage and additional fodder. The expert suggested that, to stay healthy, the cattle require 30 kg of forage each per day. For the cows, the forage fulfilment also affects the quantity of the milk they produce.
A.2.3 Milk production procedure
Farmers’ cows that have been pregnant can produce milk. The first pregnancy usually occurs after the cow’s age reaches two years. The quantity of milk produced is determined by several factors (i.e., age, genetics and forage) as described in Equationequation A.2(A.2)
(A.2) .
(A.2)
(A.2)
denotes the quantity of milk produced by cow i in a day. The
variable represents how long the given cow has been pregnant. The farmers usually stop milking a cow that has been pregnant for 7 months and restart the milking process after it gives birth. Hence, the milk production during this period is zero.
denotes the maximum milk production and reflects the genetic attributes of the given cow.
represents the percentage of milk that is produced by the given cow. It is a function of the number of pregnancies (
) as a proxy for age. The expert suggested that a cow achieved its maximum milk production after the second pregnancy (
) and the milk production then decreased in the subsequent pregnancies. Actual measurements to establish this function were not available but the expert suggested that it would be reasonable to assume that the milk production was decreasing linearly. We also assume that the milk production is proportional to
which represents the average forage fulfilment (between 0 and 1) of cow i. The average forage fulfilment of 1 means that the given cow always obtains sufficient forage throughout its lifetime.
In addition to the quantity, we also consider the milk quality in our simulation. This variable determines the milk price per litre received from the cooperative. The expert suggested that the proportion of forage in the total fodder determined the milk quality. We assume that the quality of milk increases linearly with the increase in the proportion of forage. When the proportion is 75% or higher, the quality of milk reaches its maximum (i.e., 100%).
A.2.4 Hypothesized cattle selling and buying processes
Decisions regarding how many cattle should be retained are the most important decision made by the farmer agents because it would affect the amount of forage required, cattle weight, mortality and the amount of additional fodder used (Gross et al., Citation2006). In our simulation, three separate processes determine how the farmers buy or sell their cattle. In the first process, the decision to sell or buy cattle is triggered by the forage availability (Gross et al., Citation2006). In the second process, this decision is triggered by the cattle’s age (Rasch et al., Citation2016). Finally, in the last process, it is triggered by the farmer’s financial condition (Boone et al., Citation2011).
In common with earlier studies (e.g., Gross et al., Citation2006), for the first process, we assume that the forage availability is a trigger for the farmers to sell or buy cattle. When the forage is less available (e.g., during a drought), they sell some of their cattle and, conversely, buy new cattle (particularly cows) when the forage becomes more available. We assume that the farmers sell or buy their cattle to an external agent outside the system and not to other farmers in common with earlier studies (Boone et al., Citation2011).
When the average forage collected is not sufficient to feed all of their cattle, they will start to sell their cattle. According to the experts, the farmers will prioritize the sale of the bulls first because they do not generate regular income. They will start to consider selling their cows only when they do not have any more bulls. When selling the cows, farmer agents compare the potential income they can get by feeding less forage but retaining all of their cows (Equationequation A.3(A.3)
(A.3) ) with the potential income they can get by feeding sufficient forage but selling some of their cows (Equationequation A.4
(A.4)
(A.4) ).
(A.3)
(A.3)
(A.4)
(A.4)
ncow denotes the number of cows currently owned by a farmer.
represents the average forage obtained by the farmer and
represents the maximum number of cows the farmer can retain for the given forage availability.
and
represent the average milk production per cow, the average milk price per litre and the additional fodder price, respectively. In Equationequation A.3
(A.3)
(A.3) , the farmer has more cows to produce milk but suffers a production penalty owing to the lack of forage and must pay more for additional fodder. In Equationequation A.4
(A.4)
(A.4) , the farmer has fewer cows, but each cow can produce more milk and the agent does not need to buy additional fodder. If
then the farmer will decide to sell the cows and vice versa.
When selling cattle, we assumed that the farmers will prioritise the sale of the oldest cattle first as described in earlier studies (e.g., Boone et al., Citation2011). For the bulls, an older bull usually has more live weight (Quang et al., Citation2014) and is more valuable. Older cows have more live weight, but older cows are usually considered less productive.
On the other hand, if the farmers can collect more forage than is needed then they start to consider buying more cows. The number of new cows a farmer is willing to buy is proportional to the additional cows that can be fed using the excess forage. For example, if the forage excess is enough to feed one more cow then the farmer agent will consider buying one additional cow. The constraints in the buying decisions are the pen capacity and the farmer’s money. If the farmer agent owns sufficient pen capacity for its current cows and the new cows, then it just needs to have sufficient money to buy the cows. However, if the farmer agent does not have sufficient pen capacity then it must have sufficient money to buy the cows and to increase the pen capacity. The farmer agent’s ability to increase pen capacity is also limited by the land availability on the patch where it is living. The fertility and productivity of newly bought cows are assumed to be random.
In the second process, the selling decision is based on the cattle’s age. In general, the bulls are sold at two years old. According to experts, farmers believe that the bulls have reached their optimum live weight at this age. Meanwhile, the cows are culled when they reach the age of 10 years. At that age, it is believed that the milk productivity of the given cow has become too low.
In the third process, the cattle selling decision is triggered by the farmer’s financial condition. Each month, the farmer agent calculates its living expenses and estimates the amount of money it will have at the end of the month. The living expense value is calculated by multiplying the number of the farmer agent’s family members and the standard cost of living in the area. If the estimated income is less than the living expense value, then the farmer agent starts to consider selling its cattle. As in the first process, the farmers are assumed to sell the bulls first. In this process, we also assume that the farmers select the cattle to sell based on their age. This selling process is repeated until the farmer agent’s money deficit is covered.
In all of those three processes, we identify the maximum amount of money that can be earned by farmers from selling their cattle using the survey data. The actual price received by the farmer agent is assumed to be proportional to the age of cattle being sold. On the other hand, the price that must be paid by the farmers to buy a new cow is assumed to be constant and the value is determined using the survey data.
It should be noted that the buying and selling decision rules described here are hypothesized (i.e., not elicited from farmers). The elicited buying and selling decision rules are described in the paper.
A.2.5 Cow reproduction
Prior studies incorporate a fixed time schedule (e.g., annually) or growth rate (e.g., increase the population by 10% every year) for cow reproduction (e.g., Martin et al., Citation2016). In our study, we considered a heterogeneous cow fertility factor. In the cow reproduction process, the farmers artificially inseminate those cows who are two years old or older and not pregnant at the beginning of each simulation month. The successfulness of the artificial insemination process depends on the cow's fertility, which is represented by the services per conception variable. If the artificial insemination fails, then this process would be repeated in the subsequent month.
If the artificial insemination process is successful, then the pregnancy process lasts for nine months. The cow then gives birth to either a male or a female calf, each with 50% probability. If the cow gives birth to a female calf, then the new-born calf inherits the milk productivity and fertility of its mother.
A.2.6 The retirement and succession of farmer households
There are two main factors affecting retirement and succession of farmer household agent (i.e., age and financial condition). At the end of each simulation year, all farmer household members who are older than the productive age are removed from the farmer household family member list and the amount of family labour decreases. A farmer household agent can also acquire a new family member with a probability of 1.2% (the average population growth in Indonesia). A farmer household agent is deleted from the simulation if it does not have any family member left or if it runs out of money and cattle.
Owing to the population growth, the farmland that was once located in the rural area is currently surrounded by residential areas. The non-farmers tolerate the existence of a farmer household who continues dairy farming because they are native to the area while the non-farmers are mainly newcomers. The cooperative’s database also shows that all of its members are multi- generation farmer families. However, conflict with non-farmers could spark easily if a newcomer tries to start dairy farming. This conflict is usually triggered by pollution caused by manure production and potential water contamination. When a farmer household decides to stop dairy farming, their land will usually be sold and converted into residential area settlement or another business. Our simulation aims to replicate the reality in the case study area so the probability of a new farmer agent entering the system is set to be equal to zero. However, a sensitivity analysis can be run on this probability value if the survey data indicated that the emergence of new farmers was quite possible.
A.3 The cooperative agent
The cooperative agent collects and grades milk from all farmer household agents. We assume that the cooperative determines the milk-buying price as a linear function of milk quality, ranging from Rp 3350 to Rp 5200 per litre (Rp is Indonesian currency). Based on the discussion with the experts, the cooperative sells the milk to the milk processing industry at a fixed price. The actual buying price from the milk processing industry is unknown but the experts estimated that it was approximately Rp 5500 per litre. The experts agreed that the cooperative’s daily operational costs can be assumed to be fixed regardless the total volume of milk they handle. Hence, it is more profitable if they can operate at full capacity.
Appendix B:
Full RPG results
Forage Transaction
1: Lend forage
−1: borrow forage
2: Sell forage
−2:buy forage
3: Giving away
Cow Transaction
1: Transaction with the market
2: Transaction with other player
Foraging Strategy
1:Optimising transport
2:Highest forage density
3:Random move
4:Nearest location
5:Farthest location