
 ?Mathematical formulae have been encoded as MathML and are displayed in this HTML version using MathJax in order to improve their display. Uncheck the box to turn MathJax off. This feature requires Javascript. Click on a formula to zoom.
Abstract
Throughout its history, Operational Research has evolved to include methods, models and algorithms that have been applied to a wide range of contexts. This encyclopedic article consists of two main sections: methods and applications. The first summarises the up-to-date knowledge and provides an overview of the state-of-the-art methods and key developments in the various subdomains of the field. The second offers a wide-ranging list of areas where Operational Research has been applied. The article is meant to be read in a nonlinear fashion and used as a point of reference by a diverse pool of readers: academics, researchers, students, and practitioners. The entries within the methods and applications sections are presented in alphabetical order. The authors dedicate this paper to the 2023 Turkey/Syria earthquake victims. We sincerely hope that advances in OR will play a role towards minimising the pain and suffering caused by this and future catastrophes.
Operations research is neither a method nor a technique; it is or is becoming a science and as such is defined by a combination of the phenomena it studies. Ackoff (Citation1956)
1. IntroductionFootnote1
The year 2024 marks the 75th anniversary of the Journal of the Operational Research Society, formerly known as Operational Research Quarterly. It is the oldest Operational Research (OR) journal worldwide. On this occasion, my colleague Fotios Petropoulos from University of Bath proposed to the editors of the journal to edit an encyclopedic article on the state of the art in OR. Together, we identified the main methodological and application areas to be covered, based on topics included in the major OR journals and conferences. We also identified potential authors who responded enthusiastically and whom we thank wholeheartedly for their contributions.
Modern OR originated in the United Kingdom during World War II as a need to support the operations of early radar-detecting systems and was later applied to other operations (McCloskey, Citation1987). However, one could argue that it precedes this period in history since it is partly rooted in several mathematical fields such as probability theory and statistics, calculus, and linear algebra, developed much earlier. For example, the Fourier-Motzkin elimination method (Fourier, Citation1826a, Citation1826b) constitutes the main basis of linear programming. Queueing theory, which plays a central role in telecommunications and computing, already existed as a distinct field of study since the early 20th century (Erlang, Citation1909), and other concepts, such as the economic order quantity (Harris, Citation1913) were developed more than one century ago. Interestingly, while many recent advances in OR are rooted in theoretical or algorithmic concepts, we are now witnessing a return to the practical roots of OR through the development of new disciplines such as business analytics.
After the war ended, several industrial applications of OR arose, particularly in the manufacturing and mining sectors which were then going through a renaissance. The transportation sector is without doubt the field that has most benefited from OR, mostly since the 1960s. The aviation, rail, and e-commerce industries could simply not operate at their current scale without the support of massive data analysis and sophisticated optimisation techniques. The application of OR to maritime transportation is more recent, but it is fast gaining in importance. Other areas that are less visible, such as telecommunications, also deeply depend on OR. The success of OR in these fields is partly explained by their network structures which make them amenable to systematic analysis and treatment through mathematical optimisation techniques. In the same vein, OR also plays a major role in various branches of logistics and project management, such as facility location, forecasting, inventory planning, scheduling, and supply chain management.
The public sector and service industries also benefit greatly from OR. Healthcare is the first area that comes to mind because of its very large scale and complexity. Decision making in healthcare is more decentralised than in transportation and manufacturing, for example, and the human issues involved in this sector add a layer of complexity. OR methodologies have also been applied to diverse areas such as education, sports management, natural resources, environment and sustainability, political districting, safety and security, energy, finance and insurance, revenue management, auctions and bidding, and disaster relief, most of which are covered in this article.
Among OR methodologies, mathematical programming occupies a central place. The simplex method for linear programming, conceived by Dantzig in 1947 but apparently first published later (Dantzig, Citation1951), is arguably the single most significant development in this area. Over time, linear programming has branched out into several fields such as nonlinear programming, mixed integer programming, network optimisation, combinatorial optimisation, and stochastic programming. The techniques most frequently employed for the exact solution of mathematical programs are based on branch-and-bound, branch-and-cut, branch-and-price (column generation), and dynamic programming. Game theory and data envelopment analysis are firmly rooted in mathematical programming. Control theory is also part of continuous mathematical optimisation and relies heavily on differential equations.
Complexity theory is fundamental in optimisation. Most problems arising in combinatorial optimisation are -hard and typically require the application of heuristics for their solution. Much progress has been made in the past 40 years or so in the development of metaheuristics based on local search, genetic search, and various hybridisation schemes. Many problems in fields such as vehicle routing, location analysis, cutting and packing, set covering, and set partitioning can now be solved to near optimality for realistic sizes by means of modern heuristics. A recent trend is the use of open-source software which not only helps disseminate research results, but also contributes to ensuring their accuracy, reproducibility and adoption.
Several modelling paradigms such as systems thinking and systems dynamics approach problems from a high-level perspective, examining the inter-relationships between multiple elements. Complex systems can often be analysed through simulation, which is also commonly used to assess the performance of heuristics. Decision analysis provides a useful framework for structuring and solving complex problems involving soft and hard criteria, behavioural OR, stochasticity, and dynamism. Recently, issues related to ethics and fairness have come to play an increasing role in decision making.
Because the various topics of this review paper are listed in alphabetical order, the subsection on “Artificial intelligence, machine learning and data science” comes first, but this topic constitutes one of the latest developments in the field. It holds great potential for the future and is likely to reshape parts of the OR discipline. Already, machine learning-based heuristics are competitive for the solution of some hard problems.
This paper begins with a quote from Russell L. Ackoff who has been a pioneer of OR. In 1979, he published in this journal two articles (Ackoff, Citation1979a, Citation1979b) that presented a rather pessimistic view of our discipline. The author complained about the lack of communications between academics and practitioners, and about the fact that some OR curricula in universities did not sufficiently prepare students for practice, which is still true to some extent. One of his two articles is entitled “The Future of Operational Research is Past”, which may be perceived as an overreaction to this diagnosis. In my view, the present article provides clear evidence to the contrary. Soon after the publication of the two Ackoff papers, we witnessed the development of micro-computing, the Internet and the World Wide Web. It has become much easier for researchers in our community to access information, software and computing facilities, and for practitioners to access and use our research results. We are now fortunate to have access to sophisticated open-source software, data bases, bibliographic sources, editing and visualisation tools, and communication facilities. Our field is richer than it has ever been, both in terms of theory and applications. It is constantly evolving in interaction with other disciplines, and it is clearly alive and well and has a promising future.
2. Methods
2.1. Artificial intelligence, machine learning, and data scienceFootnote2
Machine learning (ML) comprises techniques for modelling predictive tasks, i.e., tasks that involve the prediction of an unknown quantity from other observed quantities. Ideas of learning in an artificial system and the term machine learning were first discussed in the 1950s (Samuel, Citation1959) and their development and popularity have seen enormous growth over the last two decades in part due to the availability of large-scale datasets and increased computational resources to model them.
Mitchell (Citation1997) provides this concrete definition of machine learning “A computer program is said to learn from experience E with respect to some class of tasks T, and performance measure P, if its performance at tasks in T, as measured by P, improves with experience E”. The program is a model or a function and its experience E is the type of data it has access to. There are three types of experiences supervised, unsupervised, and reinforcement learning. The performance measure (P) allows for model evaluation and comparison including model selection.
Supervised learning is an experience where a model aims at predicting one or more unobserved target (dependent) variables given observed ibackprout (independent) variables. In other words, a supervised model is a function that map inputs to outputs. The process of solving a supervised problem involves first learning a model, that is adjusting its parameters using a training dataset with both input and target variables. The training set is drawn IID (independently and identically distributed) from an underlying distribution over inputs and targets. Once trained, the model can provide target predictions for new unseen samples from the same distribution. The most common tasks in supervised learning are regression (real dependent variable) and classification (categorical dependent variable). Evaluating a supervised system is usually performed using held-out data referred to as the test data while held-out validation data is used for model development and selection using procedures such as k-fold cross-validation.
Supervised models can be dichotomised into linear and nonlinear models. Linear models perform a linear mapping from inputs to outputs (e.g., linear regression). Machine learning mostly investigates nonlinear supervised models including deep neural network (DNN) models (Goodfellow et al., Citation2016). DNNs are composed of a succession of parametrised nonlinear transformations called layers and each layer contains a set of transformations called neurons. Layers successively transform an input datum into a target. The parameters of the layers are adjusted to iteratively obtain better predictions using a procedure called backpropagation, a form of gradient descent (Goodfellow et al., Citation2016, §6.5). DNNs are state-of-the-art methods for many large-scale non-structured datasets across domains (see also §3.19). DNNs can be adapted to different sizes of inputs and targets as well as variable types. They can also be specialised for specific types of data. Recurrent neural networks (RNNs) are auto-regressive models for sequential data (Rumelhart et al., Citation1986). The sequential data are tokenised and an RNN transforms each token sequentially along with a transformation of the previous tokens. Convolutional neural networks (CNNs) are specialised networks for modelling data that is arranged on a grid (e.g., an image Lecun, Citation1989). Their layers contain a convolution operation between an input and a parameterised filter followed by a nonlinear transformation, and a pooling operation. Each layer processes data locally and so requires fewer parameters compared to vanilla DNNs. As a result, CNNs can model higher-dimensional data. Graphical neural networks (GNNs) are specialised architectures for modelling graph data (e.g., a social network; Scarselli et al., Citation2009). In GNNs, the data are transformed by following the topology of the graph. Last, attention layers dynamically combine their inputs (tokens) based on their values. Transformer models use successions of attention and feed-forward layers to model sequential input and output data (Vaswani et al., Citation2017). Transformers are more efficient to train than RNNs and can be trained on internet-scale data given enormous computational power. The availability of such broad datasets especially in the text and image domains has given rise to a class of very-large-scale models (also referred to as foundation models) that display an ability to adapt to and obtain high performance across a diversity of downstream supervised tasks (Bommasani et al., Citation2021)
Last, attention is a mechanism that considers data to be unordered and uses transformations dynamically. Transformers are models based on attention. They provide more efficient training than RNNs for very large-scale datasets (Vaswani et al., Citation2017).
Neural networks currently outperform other methods when learning from unstructured data (e.g., images and text). For tabular data, data that is naturally encoded in a table and that has heterogeneous features (Grinsztajn et al., Citation2022), best-performing methods use ideas first proposed in tree-based classifiers, bagging, and boosting. They include random forests (Breiman, Citation2001), XGBoost (Chen & Guestrin, Citation2016) which both scale to large-scale datasets as well as kernel methods including support vector machines (SVMs see, e.g., Schlkopf et al., Citation2018) and probabilistic Gaussian Processes (GPs see, e.g., Rasmussen & Williams, Citation2005). These methods are used across regression and classification tasks.
In unsupervised learning, the second type of experience, the data consist of independent variables (features or covariates) alone. The aim of unsupervised learning is to model the structure of the data to better understand their properties. As a result, evaluating an unsupervised model is often task and application-dependant (Murphy, Citation2022, §1.3.4). The prototypical unsupervised-learning task is clustering. It involves learning a function that groups similar data together according to a similarity measure and desiderata often expressed as an objective function. Several standard algorithms divided into hierarchical and non-hierarchical methods exist. The former uses the similarity between all pairs of data and finds a hierarchy of clustering solutions with a different number of clusters using either a bottom-up or top-down approach. Agglomerative clustering is a standard hierarchical approach. Non-hierarchical methods tend to be more computationally efficient in terms of dataset size. For example, K-means clustering is a well-known non-hierarchical method that finds a single solution using K clusters (MacQueen, Citation1967). Other unsupervised learning tasks include dimensionality reduction for example for visualisation or to prepare data for further analysis. Density modelling is another unsupervised task where a probabilistic model learns to assign a probability to each datum (Murphy, Citation2022, §1.3). Probabilistic models can be used to learn the hidden structure in large quantities of data (e.g., Hoffman et al., Citation2013). Further, probabilistic models are also used to generate high-dimensional data (e.g., images of human faces or English text) with high fidelity (Karras et al., Citation2021) and often referred in this context as generative models. Large Language Models are examples of such generative models (Bommasani et al., Citation2021).
Reinforcement learning (RL) is the third type of experience. RL models collect their own data by executing actions in their environment to maximise their reward. RL is a sequential decision-making task and is formalised using Markov decision processes (MDPs) (Sutton & Barto, Citation2018, §3.8). An MDP encodes a set of states, available actions, distribution over next states given current states and action, a reward function, and a discount factor. Partially observable MDPs (or POMDPs) extend the formalism to environments where the exact current state is unknown (Kaelbling et al., Citation1998). In RL, an agent’s objective is to learn a policy, a distribution over actions for each state in an environment. Tasks are defined by rewards attached to different states. Exact and approximate methods exist for solving RL problems. Whereas exact solutions are appropriate for smaller tabular problems only, deep neural networks are widely used for solving larger-scale problems that require approximate solutions yielding a set of techniques known as deep reinforcement learning (Mnih et al., Citation2015). An RL agent can also learn to imitate an expert either by learning a mapping from states/observations to actions as in supervised learning (a technique known as imitation learning; for a survey, see Hussein et al., Citation2017) or by trying to learn the expert’s reward function (inverse reinforcement learning Russell, Citation1998).
In addition to learning models for solving prediction tasks using one of the three experiences above, machine learning also studies methods for enabling the reuse of information learned from one or multiple datasets and environments to other similar ones. Representation learning studies how to learn such reusable information and it can use both supervised and unsupervised experiences (Murphy, Citation2023, §32). When using a deep learning model, a representation is obtained after one or more layer transformations of the data. Representation learning is used in a variety of situations including for transfer learning tasks, where a trained model is reused to solve a different supervised task (for a survey, see Zhuang et al., Citation2021).
In the last decade, machine learning models have achieved high performance on a variety of tasks including perceptual ones (e.g., recognising objects in images and words from speech) as well as natural language processing ones thereby becoming a core component of artificial intelligence (AI) methods. The goal of AI methods is to develop intelligent systems. Some of these advances shine a bright light on the ethical aspects of machine learning techniques and are active areas of study (see, e.g., Dignum, Citation2019; Barocas et al., Citation2019). Another area of active study is explainability (Phillips et al., Citation2021). Some of the most effective ML tools make predictions and recommendations that are hard to explain to users (for example when neural networks are employed). Clearly, lack of explainability slows down ML use in those contexts where decisions made due to those predictions and recommendations are life changing and involve a human in the loop, healthcare (applying a treatment), finance (refusing a mortgage), or justice (granting parole) to mention a few. So, explainability is currently one of the most crucial challenges for ML and AI and, at the same time, a tremendous opportunity for their wider applicability.
Further, advances in machine learning alongside statistics, data management, and data processing, as well as the wider availability of datasets from a variety of domains have led to the popularisation and development of data science (DS), a discipline whose goal is to extract insights and knowledge from these data. DS uses statistics and machine-learning techniques for inference and prediction, but it also aims at enabling and systematising the analysis of large quantities of data. As such, it includes components of data management, visualisation, as well as the design of (efficient) data processing algorithms (Grus, Citation2019).
2.1.1. Resources
Murphy (Citation2022) provides a thorough introduction to the field following a probabilistic approach and its sequel (Murphy, Citation2023) introduces advanced topics. Goodfellow et al. (Citation2016) provide a self-contained introduction to the field of deep learning (the field evolves rapidly and more advanced topics are covered through recent papers and in Murphy, Citation2023). Open-source software packages in Python and other languages are essential. They include data-wrangling libraries such as pandas (McKinney, Citation2010) and plotting ones such as matplotlib (Hunter, Citation2007). The library scikit-learn (Pedregosa et al., Citation2011) in Python offers an extensive API that includes data processing, a toolbox of standard supervised and unsupervised models, and evaluation routines. For deep learning, PyToch (Paszke et al., Citation2019) and TensorFlow (Abadi et al., Citation2015) are the standard.
2.1.2. Learning for combinatorial optimisation
The impressive success of machine learning in the last decade made it natural to explore its use in many scientific disciplines, such as drug discovery and material sciences. Combinatorial optimisation (CO; §2.4) is no exception to this trend and we have witnessed an intense exploration (or, better, revival) of the use of machine learning for CO. Two lines of work have strongly emerged. On the one side, ML has been used to learn crucial decisions within CO algorithms and solvers. This includes imitating an algorithmic expert that is computationally expensive like in the case of strong branching for branch and bound, the single application that has attracted the largest amount of interest (Lodi & Zarpellon, Citation2017; Gasse et al., Citation2019). The interested reader is referred to two recent surveys (Bengio et al., Citation2021; Cappart et al., Citation2021), the latter highlighting the relevance of GNNs for effective CO representation. On the other side, ML has been used end to end, i.e., for solving CO problems directly or leveraging ML to devise hybrid methods for CO. The area is surveyed in Kotary et al. (Citation2021).
2.2. Behavioural ORFootnote3
Behavioural OR (BOR) is concerned with the study of human behaviour in OR-supported settings. Specifically, BOR examines how the behaviour of individuals affects, or is affected by, an OR-supported interventionFootnote4. The individuals of interest are those who, acting in isolation or as part of a team, design, implement and engage with OR in practice. These individuals include OR practitioners playing specific intervention roles (e.g., modellers, facilitators, consultants), and other individuals with varying interests and stakes in the intervention (e.g., users, clients, domain experts, sponsors).
A concern with the behavioural aspects of the OR profession can be traced back to past debates in the 1960s, 1970s and 1980s (Churchman, Citation1970; Dutton & Walton, Citation1964; Jackson et al., Citation1989). Although these debates dwindled down in subsequent years, the emergence of BOR as a field of study represents a return to these earlier concerns (Franco & Hämäläinen, Citation2016; Hämäläinen et al., Citation2013). What motivates this resurgence is the recognition that the successful deployment of OR in practice relies heavily on our understanding of human behaviour. For example, overconfidence, competing interests, and the willingness to expend effort in searching, sharing, and processing information are three behavioural issues that can negatively affect the success of OR activities. Attention to behavioural issues has been central in disciplines such as economics, psychology and sociology for decades, and BOR studies draw heavily from these reference disciplines (Franco et al., Citation2021).
It is important to distinguish between the specific focus of BOR and the broader focus of behavioural modelling. The creation of models that capture human behaviour has a long tradition within OR, but it is not necessarily concerned with the study of human behaviour in OR-supported settings. For example, in the last 20 years operational researchers have produced an increasing number of robust analytical models that describe behaviour in, and predict its impact on, operations management settings (Cui & Wu, Citation2018; Donohue et al., Citation2020; Loch & Wu, Citation2007). Operational researchers also have produced simulation models that capture human behaviour within a system with different levels of complexity. For example, systems dynamics models incorporate high-level variables representing average behaviour (Morecroft, Citation2015; Sterman, Citation2000, §2.22), and discrete event simulation models capture human processes controlled by simple behavioural rules (Brailsford & Schmidt, Citation2003; Robinson, Citation2014, §2.19). More complex agent-based simulation models represent behaviour as emergent from the interactions of agents with particular behavioural attributes (Sonnessa et al., Citation2017; Utomo et al., Citation2018, §2.19). Overall, behavioural modelling within the OR field is concerned with examining human behaviour in a system of interest in order to improve that systemFootnote5. In contrast, BOR takes an OR-supported intervention as the core system of interest where human behaviour is examined. The ultimate goal of BOR is to generate an improved understanding of the behavioural dimension of OR practice, and use this understanding to design and implement better OR-supported interventions.
Another important distinction worth stating is that between BOR and Soft OR. At first glance, this distinction may seem unnecessary as BOR is a field of study within OR, while Soft OR refers to a specific family of problem structuring approaches (§2.20). Soft OR approaches have been developed to help groups reach agreements on problem structure and, often, appropriate responses to a problem of concern (Franco & Rouwette, Citation2022; Rosenhead & Mingers, Citation2001). However, while Soft OR intervention design and implementation typically require the consideration of behavioural issues, this is not the same as choosing human behaviour in a Soft OR intervention context as the unit of analysis. Of course, a study with such a focus would certainly fall within the BOR remit (e.g., Tavella et al., Citation2021). But note that BOR is also concerned with the study of human behaviour in other OR-supported settings, such as those involving the use of ‘hard’ and ‘mixed-method’ OR approaches.
Studies of behaviour in OR-supported settings assume implicitly or explicitly that human behaviour is either influenced by cognitive and external factors, or is in itself an influencing factor (Franco et al., Citation2021). In the first case, observed individual and collective action is taken to be guided by cognitive structures (e.g., personality traits, cognitive styles) manifested during OR-related activity – behaviour is influenced. In contrast, the second case assumes that individuals and collectives are responsible for determining how OR-related activity will unfold – behaviour is influencing. This raises the practical possibility that the same OR methodology, technique, or model could be used in distinctive ways by various individuals or groups according to their cognitive orientations, goals and interests (Franco, Citation2013). Whilst behaviour in practice is likely to lie somewhere between the influenced and influencing assumptions, BOR studies tend to foreground one of the extremes as the focus, while backgrounding the other.
BOR studies can adopt three different research methodologies to examine behaviour: variance, process, and modelling. A variance methodology uses variables that represent the important aspects or attributes of the OR-supported activity being examined. Variance explanations of behavioural-related phenomena take the form of causal statements captured in a theoretically-informed research model that incorporates these variables (e.g., A causes B, which causes C). The research model is then tested with data generated by the activity, and the research findings are assessed in terms of their generality (Poole, Citation2004). Adopting a variance research methodology typically requires the implementation of experimental, quasi-experimental, or survey research designsFootnote6. This involves careful selection of independent variables, which might be either manipulated or left untreated, and of dependent variables that act as surrogates for specific behaviours. Once information about all variables is collected, data is quantitatively analysed using a wide range of variance-based methods (e.g., analysis of variance, regression, structural equation modelling).
Behavioural studies that use a variance research methodology can produce a good picture of the generative mechanisms underpinning behavioural processes if they test hypotheses about those mechanisms. For example, variance studies in BOR have examined the impact of individual differences in cognitive motivation and cognitive style on the conduct of OR-supported activity (Fasolo & Bana e Costa, Citation2014; Franco et al., Citation2016b; Lu et al., Citation2001). There is also a long tradition of testing the behavioural effects of reconfiguring different aspects of OR-supported activity such as varying model or information displays (Bell & O’Keefe, Citation1995; Gettinger et al., Citation2013), and preference elicitation procedures (Cavallo et al., Citation2019; Hämäläinen & Lahtinen, Citation2016; Pöyhönen et al., Citation2001; von Nitzsch & Weber, Citation1993).
A process methodology is used to examine OR-supported activity as a series of events that bring about or lead to some behaviour-related outcome. Specifically, it considers as the unit of analysis an evolving individual or group whose behaviour is led by, or leading, the occurrence of events (Poole, Citation2004). Process explanations take the form of theoretical narratives that account for how event dynamics lead to a final outcome (Poole, Citation2007). These narratives are often derived from observation, but it is also possible to use an established narrative (e.g., a theory) to guide observation that further specifies the narrative.
Diverse and eclectic research designs are used to implement a process research methodology. Central to these designs is the task of identifying or reconstructing the process through the analysis of events taking place over time. For example, there is an important stream of BOR studies that examines the process of building models by experts and novices (Tako, Citation2015; Tako & Robinson, Citation2010; Waisel et al., Citation2008; Willemain, Citation1995; Willemain & Powell, Citation2007). There is also an increasing interest to use process methodologies to take a closer look at actual behaviour in OR-supported settings both, before, during and after OR-related activity is undertaken (Franco & Greiffenhagen, Citation2018; Käki et al., Citation2019; Velez-Castiblanco et al., Citation2016; White et al., Citation2016).
The variance and process approaches may seem opposite to each other, but instead they should be seen as complementary (Franco et al., Citation2021; Van de Ven & Poole, Citation2005). BOR studies using a variance research methodology can explore and test the mechanisms that drive process explanations of behaviour, while BOR studies adopting a process research methodology can explore and test the narratives that ground variance explanations of behaviour. One way of combining a variance and process approach within a single BOR study is by adopting modelling as a research methodology. A modelling approach would create models that capture the mechanisms that generate a process of interest such as, for example, trust on an OR-derived solution, and the model can be run to generate the characteristics of that process. Model parameters and structure can then be varied systematically to enable variance-based comparisons of trust levels. Furthermore, the trajectory of trust levels over time can be used to gain insights into the nature of the trust development process. As already mentioned, there is a long behavioural modelling tradition within OR but, as far as we know, its potential as a research methodology tool to specifically examine behaviour in OR-supported settings is yet to be realised.
In sum, the variance, process and modelling methodologies offer rich possibilities for the study of human behaviour in OR-supported settings. Which is best for a particular study will depend on the types of question being addressed by BOR researchers, their assumptions about human behaviour, and the data they have access to. Ultimately, a thorough understanding of behaviour in OR-supported settings is likely to require all three research methodologies.
For a detailed review of BOR studies the reader is referred to Franco et al. (Citation2021). A review of behavioural studies in the context of OR in health has been written by Kunc et al. (Citation2020). There are also two collections edited by Kunc et al. (Citation2016) and White et al. (Citation2020). The European Journal of Operational Research published a feature cluster on BOR edited by Franco and Hämäläinen (Citation2016a). Finally, BOR-related news and events can be found on the sites of the European Working Group on Behavioural ORFootnote7, and the UK BOR Special Interest GroupFootnote8.
2.3. Business analyticsFootnote9
Business Analytics has its origins in practice, rather than theory, as illustrated by some of the earliest publications on the subject (e.g., Kohavi et al., Citation2002). Senior executives began to realise the importance of analytics in the first decade of the new millennium because of the ready availability of large amounts of data, the maturity of business performance management, the emergence of self-service analytics and business intelligence, and the declining cost of computing power, data storage and bandwidth (Acito & Khatri, Citation2014).
Davenport and Harris (Citation2007) gave examples of companies becoming ‘analytical competitors’ by using analytics to support distinctive organisational capabilities. To achieve this level of maturity, it was argued that analytics needs to become a strategic competency. In the 1990s, Fildes and Ranyard (Citation1997) reported on the closure or dispersal of Operational Research groups. Davenport et al. (Citation2010) reflected a reversal of that trend, by focusing on how analytical talent can be organised as an internal resource. They suggested that there are four categories of people to be considered when finding, developing and managing analysts: champions, professionals, semi-professionals and amateurs. In 2012/13, the Institute for Management Science and Operations Research (INFORMS) introduced the Certified Analytics Professional program and examination. This covers the broad spectrum of skills required of analytics professionals, including business problem framing, analytics problem framing, data (handling), methodology selection, model building, deployment and lifecycle management (INFORMS, Citation2022).
The development of talent is just one of the prerequisites for Business Analytics to create value. Vidgen et al. (Citation2017) recommended ‘coevolutionary change’, aligning their analytics strategy with their strategies for Information and Communications Technology, human resources and the whole business. This helps to ensure that the necessary data assets are available, the right culture is developed to build data and analytics skills, and that there is alignment with the business strategy for value creation. Hindle and Vidgen (Citation2018) proposed a Business Analytics Methodology based on four activities, namely problem situation structuring, business model mapping, business analytics leverage and analytics implementation. They advocated a soft OR approach, Soft Systems Methodology (Checkland & Poulter, Citation2006), to support structuring and mapping activities.
Many definitions of Business Analytics have been proposed; for a review of early definitions, see Holsapple et al. (Citation2014). According to Davenport (Citation2013), “By analytics we mean the extensive use of data, statistical and quantitative analysis, explanatory and predictive models, and fact-based management to drive decisions and actions” (p. 7). Mortenson et al. (Citation2015) suggested that analytics is at the intersection of quantitative methods, technologies and decision making. Rose (Citation2016) considered analytics as the union of Data Science (which is data centric) and Operational Research (which is problem centric). Power et al. (Citation2018) proposed the following definition: “Business Analytics is a systematic thinking process that applies qualitative, quantitative and statistical computational tools and methods to analyse data, gain insights, inform and support decision-making”. Delen and Ram (Citation2018) pointed out that, although analytics includes analysis, it also involves synthesis and subsequent implementation. These broad perspectives, emphasising synthesis as well as analysis, and qualitative as well as quantitative approaches, are consistent with earlier writings on the use of a broad range of methods in Management Science (e.g., Mingers & Brocklesby, Citation1997; Pidd, Citation2009).
Business Analytics can be viewed from different orientations. From a methodological viewpoint, the subject covers descriptive, predictive and prescriptive methods (Lustig et al., Citation2010). These three categories are sometimes extended to four, with a distinction being drawn between ‘descriptive’ and ’diagnostic’ analytics, following the Gartner analytics ascendancy model (Maoz, Citation2013). Lepenioti et al. (Citation2020) argue that it is preferable to maintain the threefold categorisation to ensure consistency, with each category addressing both ‘What?’ and ‘Why’ questions. (Descriptive: ‘What happened?’, ‘Why did it happen?’; Predictive: ‘What will happen?’, ‘Why will it happen?’; Prescriptive: ‘What should I do to make it happen?’, ‘Why should I make it happen?’). For detailed literature reviews on descriptive, predictive and prescriptive analytics, the reader is directed to Duan and Xiong (Citation2015), Lu et al. (Citation2017), and Lepenioti et al. (Citation2020), respectively.
From a technological viewpoint, Business Analytics is facilitated by the integration of transactional data with big data streaming from social media platforms and the Internet of Things into a unified analytics system (Shi & Wang, Citation2018). These authors suggest that this integration can be achieved in two stages, starting with integration of traditional Enterprise Resource Planning (ERP) and big data, and proceeding to integration of big-data ERP with Business Analytics. Ruivo et al. (Citation2020) reported that analytics ranked second in extended ERP capabilities (behind collaboration) according to the views of 20 experts engaged in a Delphi study. Romero and Abad (Citation2022) suggested that cloud-based big data analytics software will not provide competitive advantage to firms that have not installed a large ERP system, although it will ensure that they do not lag further behind their sector-leading competitors.
From an ethical viewpoint, Business Analytics faces a number of challenges. Davenport et al. (Citation2010) recognised that issues of data privacy can be difficult to address, especially if an organisation operates in a wide range of territories or industries. Ram Mohan Rao et al. (Citation2018) summarised major privacy threats in data analytics, namely surveillance, disclosure, discrimination, and personal embarrassment and abuse, and reviewed privacy preservation methods, including randomisation and cryptographic techniques. A further ethical issue is that AI algorithms are likely to replicate and reinforce existing social biases (O’Neil, Citation2016). Such algorithmic bias is said to occur when the outputs of an algorithm benefit or disadvantage certain individuals or groups more than others without a justified reason. Kordzadeh and Ghasemaghaei (Citation2022) reviewed the literature on algorithmic bias and showed that most studies had examined the issue from a conceptual standpoint, with only a limited number of empirical studies. Similarly, Vidgen et al. (Citation2020) reviewed papers on ethics in Business Analytics and found that most were at the level of guiding principles and frameworks, with little of direct applicability for the practitioner. Their case study demonstrated how ethical principles (utility, rights, justice, common good and virtue) can be embedded in analytics development. For further discussions on ethics and OR, the reader is referred to Ormerod and Ulrich (Citation2013), Le Menestrel and Van Wassenhove (Citation2004), and Mingers (Citation2011a) but also §3.8.
Analytics maturity models have been developed to describe, explain and evaluate the development of analytics in an organisation. Król and Zdonek (Citation2020) reviewed 11 maturity models and assessed them in terms of the number of assessment dimensions, scoring mechanism, number of maturity levels, and the public availability of the methodology. They found that the most common assessment dimensions were technical infrastructure, analytics culture and human resources, including staff’s analytics competencies. Lismont et al. (Citation2017) undertook a survey of companies, based on the DELTA maturity model (Davenport et al., Citation2010) of data, enterprise, leadership, targets and analysts. They identified four analytics maturity levels from their survey. The most advanced companies tended to use a wider variety of analytics techniques and applications, to organise analytics more holistically, and to have a more mature data governance policy.
A crucial empirical question is whether Business Analytics adds value to an organisation. An early study on the effect of Business Analytics on supply chain performance was conducted by Trkman et al. (Citation2010). They examined over 300 companies, showing a statistically significant relationship between self-assessed analytical capabilities and performance. Oesterreich et al. (Citation2022) conducted a meta-analysis of 125 firm-level studies, spanning ten years of research in 26 countries. They found evidence of Business Analytics having a positive impact on operational, financial and market performance. They also found that human resources, management capabilities and organisational culture were major determinants of value creation, whereas technological factors were less important.
2.4. Combinatorial optimisationFootnote10
A Combinatorial Optimisation (CO) problem consists of searching for the optimal element in a finite collection of elements. More formally, given a set of elements and a family of its subsets, each defining a feasible solution and having an associated value, a CO problem is to find a subset having the minimum (or, alternatively, the maximum) value. The subsets may be proper, like, e.g., in the knapsack problem, or represented by permutations, like, e.g., in the assignment problem (see below). Typically, the feasible solutions are not explicitly listed, but are described in a concise manner (like a set of equalities and inequalities, or a graph structure) and their number is huge, so scanning all feasible solutions to select the optimal one is intractable. A CO problem can usually be modelled as an Integer Program (IP, see also §2.15) with linear or nonlinear objective function and constraints, in which the variables can take a finite number of integer values.
Consider for example the problem of assigning n tasks to n agents, by knowing the time that each agent needs to complete each task, with the objective of finding a solution that minimises the overall time needed to complete all tasks (Assignment Problem, AP). The solution could obviously be found by enumerating all permutations of the integers and selecting the best one. However, this number is so huge that such approach is ruled out even for small-size problem instances: for n = 30, we have
and the fastest supercomputer on hearth would need millions of years to scan all solutions. The challenge is thus to find more efficient methods. For example, one of the most famous CO algorithms (the Hungarian algorithm) can solve assignment problem instances with millions of variables in few seconds on a standard PC.
The algorithm mentioned above can be implemented so as to solve any AP instance in a time of order n3, i.e., in a time bounded by a polynomial function of the input size. Unfortunately, only for relatively few CO problems we know algorithms with such property, while for most of them (-hard problems) the best known algorithms can take, in the worst case, a time that grows exponentially in the size of the instance. In addition, Complexity theory (see also §2.5) suggests that the existence of polynomial-time algorithms for such problems is unlikely. On the other hand, CO problems arise in many industrial sectors (manufacturing, crew scheduling, telecommunication, distribution, to mention a few) and hence there is the prominent and practical need to obtain good quality solutions, especially to large-size instances, in reasonable times.
2.4.1. Origins
Many problems arising on graphs and networks (see §2.12) belong to CO (the AP discussed above can be described as that of finding a minimum weight perfect matching in a bipartite graph), and hence the origins of CO date back to the eighteen century. In the following, we narrow our focus to modern CO (see Schrijver, Citation2005). Its roots can be found in the first decades of the past century, when Central European mathematicians developed seminal studies on matching problems (König, Citation1916), paths Menger (Citation1927), and Shortest Spanning Trees (SST) (Jarník, Citation1930; Borůvka, Citation1926, results independently rediscovered by Prim, Citation1957 and Kruskal, Citation1957). The Fifties produced major results on the AP (Kuhn, Citation1955; Citation1956, on the basis of the results by König, Citation1916 and Egerváry, Citation1931, also see Martello, Citation2010), the Travelling Salesman Problem (Dantzig et al., Citation1954), and Network Flows (Ford & Fulkerson, Citation1962), as well as fundamental studies on basic methodologies: dynamic programming (DP; Bellman, Citation1957, see §2.9), cutting planes (Gomory, Citation1958, see §2.15), and branch-and-bound (Land & Doig, Citation1960).
2.4.2. Problems and complexity
The most important CO problems, for which we know there are polynomial algorithms, are the basic graph-theory problems mentioned in the previous section. Other important problems, which are relevant both from the theoretical point of view and from that of real-world applications, are instead -hard. The main
-hard CO problems arise in the following areas.
Scheduling. Given a set of tasks which must be processed on a set of processors, a scheduling problem asks to find a processing schedule that satisfies prescribed conditions and minimises (or maximises) an objective function, frequently related to the time needed to complete all tasks. This huge area, that includes literally hundreds of problems and variants (mostly -hard), is also discussed in §3.27.
Travelling Salesman Problem (TSP). Given a weighted (directed or undirected) graph, the problem is to find a circuit that visits each vertex exactly once (Hamiltonian tour) and has minimum total weight. This is one of the most intensively studied problems of CO, and is treated in detail in §2.12.
Vehicle Routing Problems (VRP). A VRP is a generalisation of the TSP which consists of finding a set of routes for a fleet of vehicles, based at one or more depots, to deliver goods to a given set of customers by satisfying a set of conditions and minimising the overall transportation cost.
Facility Location. These problems require to find the best placement of facilities on the basis of geographical demands, installation costs, and transportation costs, so as to satisfy a set of conditions and to minimise the total cost (see §3.13 for a detailed treatment).
Steiner Trees. Given a weighted graph and a subset S of vertices, it is requested to find an SST connecting all vertices in S (possibly containing additional vertices). These problems, which generalise both the shortest path problem and the SST, are treated in detail in §2.12.
Set Covering. Given a set of elements and a collection of its subsets, each having a cost, we want to find the least cost sub-collection whose union includes (covers) all the elements.
Maximum Clique (MC). A clique is a complete subgraph of a graph (i.e., it is defined by a subset of vertices all adjacent to each other). Given a graph, the MC problem is to find a clique of maximum cardinality (or, if the graph is weighted, a clique of maximum weight). We refer the reader to §2.12 for a detailed analysis.
Cutting and Packing (C&P). Given a set of “small” items, and a set of “large” containers, a problem in this area asks for an optimal arrangement of the items into the containers. Items and containers can be in one dimension (Knapsack Problems (KP), Bin Packing problems) or in more - usually two or three – dimensions (C&P). See §3.3 for more details.
Quadratic Variants of CO problems. A currently hot research area concerns CO problems whose “normal” linear objective function is replaced by a quadratic one. This greatly increases difficulty: in most cases problems which, in their linear formulation, can be solved in polynomial time (e.g., the AP) or in pseudo-polynomial time (e.g., the KP) become strongly -hard.
2.4.3. Exact methods for  -hard problems
For heuristic and approximation algorithms, we refer the reader to §2.13 and §2.5. With the exception of DP methods (§2.9), most exact algorithms for -hard CO problems, as well as most commonly used ILP solvers, are based on implicit enumeration. In the worst case, they can require the evaluation of all feasible solutions, and hence computing times growing exponentially with the problem size. The most common methods can be classified as
Branch-and-Bound (B&B);
Branch-and-Cut (B&C);
Branch-and-Price (B&P).
We will describe B&B, the other methods (and their combinations, as B&C-and-Price) being its extensions described in §2.15.
We consider a maximisation CO problem having an IP model with inequality constraints of ‘’ type. For a problem P, having feasible solution set F(P), z(P) denotes its optimal solution value, and ub(P) an upper bound on z(P). The main ingredients of B&B are branching scheme and upper bound computation.
Branching scheme. The solution is obtained as follows:
subdivide P into m subproblems, each having the same objective function as P and a feasible solution set contained in F(P), such that the union of their feasible solution sets is F(P). The optimal solution of P is thus given by the optimal solution of the subproblem having the maximum objective function value;
iteratively, if a subproblem cannot be immediately solved, subdivide it into additional subproblems.
The resulting method can be represented through a branch-decision tree, where the root node corresponds to P and each node corresponds to a subproblem.
A node of the tree can be eliminated if the feasible solution set of the corresponding subproblem is empty, or its upper bound is not greater than the value of the best feasible solution to P found so far.
Upper bound computation. A valid upper bound ub(P) can be computed as the optimal solution value of a Relaxation of the IP model of P, defined by:
a feasible solutions set containing F(P);
an objective function whose value is not smaller than that of P for any solution in F(P).
A relaxation is “good” if the resulting upper bound ub(P) is “close” to z(P) (i.e., if the gap between the two values, is “small”), and the relaxed problem is “easy” to solve, i.e., its optimal solution can be obtained with a computational effort much smaller than that required to solve P.
2.4.4. Relaxations
The most common relaxation methods are:
Constraint elimination: a subset of constraints is removed from the IP model of P, so that the resulting problem is easy to to solve. The most widely used case is the linear relaxation;
Linear relaxation: when the model is an Integer Linear Problem (ILP), removing the constraints that impose integrality of the variables leads to a Linear Program (LP), which is polynomially solvable, commonly used in ILP solvers (see §2.15);
Surrogate relaxation: a subset
Lagrangian relaxation: a subset
The relaxations can be strengthened by adding one or more valid inequalities (cuts) to the IP model of P, such that they are redundant for the IP model, but can become active when the IP model is relaxed (see §2.15).
2.4.5. Further readings
We refer the reader to the following selection of references for more details on the topics covered in this section. Well known, pre-1990 books are those by Garfinkel and Nemhauser (Citation1972, IP), Christofides (Citation1975, algorithmic graph theory), Garey and Johnson (Citation1979, complexity), Burkard and Derigs (Citation1980, AP), Lawler et al. (Citation1985, TSP), and the CO specific volumes by Lawler (Citation1976), Christofides et al. (Citation1979), Papadimitriou and Steiglitz (Citation1982), Martello et al. (Citation1987), and Nemhauser and Wolsey (Citation1988). We list more recent contributions in the order in which the topics were introduced:
CO: Cook et al. (Citation1998), Schrijver (Citation2003);
AP: Burkard et al. (Citation2012) for linear and quadratic AP, Cela (Citation2013) for quadratic AP;
Network Flows: Ahuja et al. (Citation1993);
Scheduling: Błażewicz et al. (Citation2001, Citation2007), Pinedo (Citation2012);
TSP: Gutin and Punnen (Citation2006), Applegate, et al. (Citation2007), Cook (Citation2011);
VRP: Golden et al. (Citation2008), Toth and Vigo (Citation2014);
Facility Location: Mirchandani and Francis (Citation1990), Laporte et al. (Citation2015);
Steiner trees: Hwang et al. (Citation1992), Prömel and Steger (Citation2012). Also see the recent survey by Ljubić (Citation2021);
Cutting and packing: Martello and Toth (Citation1990), Kellerer et al. (Citation2004). Also see the recent survey by Cacchiani et al. (Citation2022a, Citation2022b).
2.5. Computational complexityFootnote11
Operational Research develops models and solution methods for problems arising from practical decision making scenarios. Often, these solution methods are algorithms. The difficulty of a problem can be assessed empirically by evaluating the running times of corresponding algorithms, which requires careful implementations and meaningful test data. Moreover, this can be time-consuming and yields insights that depend on the skills of the programmer and are limited to the available test instances. Computational complexity represents an alternative approach that allows for a more general assessment of a problem’s difficulty that is independent of specific problem instances or solution algorithms.
2.5.1. Problem encoding and running times of algorithms
In complexity theory, the running time of an algorithm is expressed in terms of the size of the input, i.e., the amount of data necessary to encode an instance of the problem. Since computers store data in the form of binary digits (bits), the standard binary encoding represents all data of a problem instance in the form of binary numbers. The number of required bits (the encoding length) of an integer is roughly given by the binary logarithm of its absolute value. As an example, consider the binary encoding of instances of the well-known 0-1 knapsack problem (KP). An instance of KP consists of n items – each with a non-negative, integer weight and profit – and a positive, integer knapsack capacity c. We can assume that all n item weights are bounded by the capacity c and denote the value of the largest item profit by Then, the encoding length of a KP instance is bounded by
Rational numbers can be straightforwardly represented by their (integer) numerator and denominator, but their presence in the input might already influence a problem’s computational complexity (Wojtczak, Citation2018). Irrational numbers cannot be encoded in binary without rounding them appropriately, which means that a different kind of complexity theory is required when general real numbers are part of the input (see Blum et al., Citation1998, for details). Hence, the following exposition is restricted to the case of integer inputs, where the encoding length of an instance can be bounded by the number of integers needed to represent it multiplied with the binary logarithm of the largest among their absolute values (see the bound for KP instances provided above as an example).
To allow universal running time analyses of algorithms that are independent of specific computer architectures, asymptotic running time bounds described using the so-called -notation (Cormen et al., Citation2009) are used. Informally, every polynomial in n with largest exponent k is in
All terms with exponents smaller than k and the constant coefficient of nk are ignored. One is then often interested in polynomial-time algorithms whose running time is in
for some constant k, where
denotes the encoding length of instance I. A less preferred outcome would be a pseudopolynomial-time algorithm, where the running time is only required to be polynomial in the number of integers in the input and the largest among their absolute values (or, equivalently, in the exponentially larger encoding length of the input when using unary encoding, where the encoding length of an integer is roughly its absolute value).
2.5.2. The complexity classes and
Most application scenarios encountered in Operational Research finally lead to an optimisation problem (often a combinatorial problem – see §2.4), where a feasible solution is sought that minimises or maximises a given objective function. Every optimisation problem immediately yields an associated decision problem, asking a yes-no question. For example, a minimisation problem consisting of a set of feasible solutions and an objective function f can be written as
For a given target value v, the associated decision problem then asks: Does there exist a feasible solution
such that
? Solving an optimisation problem to optimality trivially answers the associated decision problem for any given v. On the other hand, every algorithm for the decision problem can be used to solve the underlying optimisation problem. Given upper and lower bounds, the optimal solution value can be identified in polynomial time by performing binary search between these bounds using the decision problem to answer the query in every iteration of the binary search (assuming that the range of objective function values and the encoding lengths of the bounds are polynomially bounded).
Motivated by the above, the computational complexity of an optimisation problem follows from the complexity of its associated decision problem. Here, the most relevant complexity classes in Operational Research are probably and
which are often used to draw the line between “easy” and “hard” problems in this context. Formally, the class
(“polynomial”) consists of all decision problems for which a polynomial-time solution algorithm exists on a deterministic Turing machine (or, equivalently, in any other “reasonable” deterministic model of computation), while the class
(“nondeterministic polynomial”) consists of all decision problems for which the same holds on a nondeterministic Turing machine. Equivalently,
is the class of all decision problems such that, for any yes instance I, there exists a certificate with encoding length polynomial in
and a deterministic algorithm that, given the certificate, can verify in polynomial time that the instance is indeed a yes instance. Since the most natural certificate is often a (sufficiently good) solution of the problem,
can informally be defined as the class of decision problems for which solutions can be verified in polynomial time. For example, when considering the travelling salesman problem (TSP) on a given edge-weighted graph, the associated decision problem asks whether or not there exists a tour (Hamiltonian cycle) of at most a given length v. While no polynomial-time algorithm for this decision problem is known to date, the problem can easily be seen to be in
since the natural certificate to provide for a yes instance is simply a tour with length at most v, whose feasibility and length can be easily verified in polynomial time.
Observe that these definitions directly imply that Most researchers believe that
or, equivalently, that there are problems in
that do not admit polynomial-time solution algorithms. However, formally proving that
(or that
) is still one of the most famous open problems in theoretical computer science to date.
This so-called versus
problem can be equivalently expressed using the well-known notion of
-completeness (see, e.g., Garey & Johnson, Citation1979). Intuitively,
-complete problems are the hardest problems in
in the sense that, if one of these problems admits a polynomial-time solution algorithm, then so does every problem in
(and, thus, we would obtain
). A decision problem (not necessarily in
) with this property is also called
-hard. This means that a problem is
-complete if and only if it is both
-hard and contained in
The first problem shown to be
-complete in Cook’s famous theorem (Cook, Citation1971) is the (Boolean) satisfiability problem (SAT). Shortly after, Karp (Citation1972a) gave a list of 21 fundamental problems that are
-complete. While Cook’s proof that SAT is
-complete required considerable effort, proving that further problems are
-complete became significantly easier with this knowledge and hundreds – if not thousands – of problems were shown to be
-complete.
A decision problem is -complete if and only if Equation(1)
(1)
(1) it is contained in
and Equation(2)
(2)
(2) some
-complete problem (and, therefore, all problems in
) can be reduced to it via a polynomial-time reduction. Such a polynomial-time reduction works as follows: For any instance of the known
-complete problem (e.g., SAT or TSP), one has to construct an instance of the investigated problem in polynomial time such that the two instances are equivalent, i.e., the constructed instance is a yes instance if and only if the given instance is a yes instance. Note that the requirement that the instance must be constructed in polynomial time (and, therefore, have encoding length polynomial in the encoding length of the original instance) is crucial. A common error in reductions is that the encoding length of the constructed instance depends polynomially on the size of numerical values in the given instance (instead of their encoding length).
The importance of the encoding can be illustrated by the 0-1 knapsack problem (KP), which is -hard if binary encoding is used, but can be solved in polynomial time (via dynamic programming) if unary encoding is used (so
-hardness of the unary-encoded version would imply that
). Problems like this, i.e., problems whose binary-encoded version is
-hard, but whose unary-encoded version can be solved in polynomial time, are called weakly
-hard, while problems (such as SAT) that remain
-hard also under unary encoding are called strongly
-hard. The existence of a pseudopolynomial-time algorithm is possible for weakly
-hard problems, but not for strongly
-hard problems (unless
).
2.5.3. Approximation algorithms
While some realistic-size instances of -hard problems might still be solvable in reasonable time, this is not the case for all instances. In general, one can deal with
-hardness by relaxing the requirement of finding an optimal solution and instead settling for a “good-enough” solution. This leads to heuristics, whose aim is producing good-enough solutions in reasonable time (see §2.13 for details) and approximation algorithms (Vazirani, Citation2001; Williamson & Shmoys, Citation2011; Ausiello et al., Citation1999). Given
an
-approximation algorithm for an optimisation problem is a polynomial-time algorithm that, for each instance of the problem, produces a solution whose objective value is at most a factor
worse than the optimal objective value. The factor
which can be a constant or a function of the instance size, is then called the approximation ratio or performance guarantee of the approximation algorithm. While it is standard to use
for minimisation problems, there is no clear consensus in the literature as to whether
or
should be used for maximisation problems. For example, the simple extended greedy algorithm for the knapsack problem produces a solution with at least half of the optimal objective value on each instance, i.e., it is a 1/2- or a 2-approximation algorithm.
While inapproximability results can be shown for some -hard problems (see Hochbaum, Citation1997, ch. 10), others allow for approximation algorithms with approximation ratios arbitrarily close to one, i.e., they admit a polynomial-time approximation scheme (PTAS). A PTAS is a family of algorithms that contains a
-approximation algorithm for every
If the running time is additionally polynomial in
the PTAS is called a fully polynomial-time approximation scheme (FPTAS). If all objective function values are integers, every FPTAS can be turned into a pseudopolynomial-time exact algorithm, so strongly
-hard problems do not admit an FPTAS (unless
). Conversely, pseudopolynomial-time algorithms, in particular dynamic programming algorithms, often serve as a starting point for designing an FPTAS (Woeginger, Citation2000; Pruhs & Woeginger, Citation2007).
2.5.4. Further complexity classes
Theoretical computer science developed a wide range of complexity classes far beyond the vs.
dichotomy. Considering algorithms requiring polynomial space, i.e., for which the encoding length of the data stored at any time during the algorithm’s execution is polynomial in the encoding length of the input (but no bound on the running time is required), gives rise to the class PSPACE. It is widely believed that
but even whether
holds is not known.
In the theoretical analysis of bilevel optimisation problems (see, e.g., Labbé & Violin, Citation2016) the complexity class plays an important role (see Woeginger, Citation2021). Here, a yes instance I is characterised by the existence of a certificate of encoding length polynomial in
such that a certain polynomial-time-verifiable property holds true for all elements of a given set
As an example, consider the 2-quantified (Boolean) satisfiability problem. Here, an instance consists of two sets X and Y of Boolean variables and a Boolean formula over
The question then is whether there exists a truth assignment of the variables in X such that the formula evaluates to true for all possible truth assignments of the variables in Y. This definition immediately sets the stage for a bilevel problem, where the decision x of the upper level (the leader) should guarantee a certain outcome for every possible decision y at the lower level (the follower). It is widely believed that
although
-hardness does not rule out the existence of a PTAS (Caprara et al., Citation2014). Under this assumption,
-hardness does, however, rule out the existence of a compact ILP-formulation, which can be a valuable finding for bilevel optimisation problems.
For some -hard problems, one can construct algorithms with running time
for an arbitrary computable function f, where the parameter k describes a property of the instance I. Such problems are called fixed-parameter tractable. For example, the satisfiability problem SAT is fixed-parameter tractable with respect to the parameter k that represents the tree-width of the primal graph of the SAT instance. In this graph, the vertices are the variables and two vertices are joined by an edge if the associated variables occur together in at least one clause, see Szeider (Citation2003). This parametric point of view is captured in the W-hierarchy of complexity classes – see Niedermeier (Citation2006) and the seminal book by Downey and Fellows (Citation1999).
2.6. Control theoryFootnote12
Control theory deals with designing a control signal so that the state or output variables of the system meet certain criteria. It is a broad umbrella term that covers a variety of theories and techniques. Control theory has been widely applied in the studies of economics (Tustin, Citation1953; Grubbström, Citation1967), operations management (Simon, Citation1952; Vassian, Citation1955, also see (Sarimveis et al., Citation2008) for a recent review), and finance (Sethi & Thompson, Citation1970). Here, we do not intend to provide an exhaustive or comprehensive review. Instead, we try to structurally organise the concepts and techniques commonly applied in operations research, which means that technical details will be omitted. We direct interested readers to a number of textbooks in the reference list, and an excellent review by Åström and Kumar (Citation2014) for those interested in the development of control theory.
The major distinction between control theory and other optimisation theories is that the control variable to be designed is normally a time-varying, dynamic function. The control signal can either be dependent on the state variables (which is referred to as feedback control or closed-loop control) or independent (feedforward control or open-loop control). The design of control signals and control policies (defined as the function between the state of the system and the control, also known as “control laws” or “decision rules”) is based on the structure of the system to be controlled (sometimes called the “plant” in the control engineering literature). Thus, the type of the dynamical system often define the type of control problem. In continuous systems, the time variable is defined on the real axis, suitable to describe continuous processes such as fluid processing and finance. In discrete systems, time is defined as integers, suitable in cases such as production and inventory control, where the production quantity is released every day. Linear systems are comprised of linear (or affine) state equations, while nonlinear systems contain nonlinear elements. Nonlinear systems are more difficult to analyse and control, and may lead to complex system behaviours such as bifurcation, chaos and fractals (Strogatz, Citation2018). But there are linearisation strategies which approximate the nonlinear system locally as linear systems (Slotine et al., Citation1991). Based on whether random input is present, the dynamical system can be categorised into deterministic and stochastic.
There are two fundamental methods in the analysis of the system and control. The first relies on time-frequency transformations (Laplace transform for continuous systems and z-transform for discrete systems). A transfer function in the frequency domain can be used to represent and analyse the system (Towill, Citation1970). This method saves computational effort; however, it can only deal with linear system models and each transfer function only describes the relation between a single input and a single output (SISO). The second method directly tackles the state equations in the time domain and describes the movement of system state in the state space. It is suitable for nonlinear systems and multi-input-multi-output (MIMO) systems. With the advancement of computing technology, the computational burden faced by the time-based method becomes less significant. The literature refers to the frequency-based method as classic control theory (Ogata et al., Citation2010) and the time-based method as modern control theory.
The system under the effect of the control policy must be examined with respect to its properties and dynamic performance. Stability is a property of the dynamical system, that the system can return to its steady state after receiving a finite external disturbance. Stability is a fundamental precondition that almost all control designs must meet, with few exceptions such as clocks and metronomes, where a periodic or cyclic response is desired. The stability criterion is straightforward to derive for linear systems, where both frequency-based (e.g., Routh-Hurwitz stabibility criteria and Jury’s inners approach, Jury & Paynter, Citation1975) and time-based (e.g., the eigenvalue approach) methods exist. However, stability analysis for nonlinear systems is more challenging (Bacciotti & Rosier, Citation2005). Other important properties of the control system include controllability, defined as the ability to move the system to preferred state using only the control signal; and observability, defined as the ability to infer the system state using the observable output signals (Gilbert, Citation1963).
In addition to these intrinsic properties, the system can also be evaluated by the system’s response to some characteristic input functions. The step function (sometimes referred to as the Heaviside function) takes the value of zero before the reference time point, and one thereafter. The impulse function (the Dirac function) takes the value of infinity at the reference time point and zero otherwise. These two input functions usually represent an abrupt change in the external environment. The sinusoidal function can be used to describe the periodic and seasonal externalities. The Bode plot describes the amplitude and phase shift between the sinusoidal input and output. For stochastic environments, the white noise is used to mimic random disturbances. It is a random signal that follows an identical and independent Gaussian distribution and has a constant power spectrum. The noise bandwidth of the system determines the ratio between output and input variances when the input is iid. The value of the noice bandwidth can be derived from either the transfer function or the state space representation. This concept is used in analysing the amplification phenomena in supply chains (see §3.24).
In practise, the system state and even the system structure may be unknown. Therefore, statistical techniques, known as state estimation and system identification, have been developed. State estimation uses observable output data to estimate the unobservable system states. A popular technique for this purpose is the Kalman filter (Kalman, Citation1960), essentially an adaptive estimator that can be applied not only in linear, time-invariant cases (LTI, where the system is linear and does not change over time), but also non-linear and time-variant cases. For example, it has been applied to estimate the demand process from the observed sales data (Aviv, Citation2003). System identification attempts to “guess” the structure of the system from the input and output.
Along with the development of control theory, various control strategies have been proposed. They are designed to fit the structure of the system, the objective of the control, and most importantly, to offer a paradigm to design the control policy. In what follows, we provide a brief summary of control strategies. Linear control strategies can be represented linearly (in the form of transfer function). They offer great analytical tractability and satisfactory performance, especially when the open-loop system is also linear. Two widely adopted policies in this family are proportional-integral-derivative (PID) control and full-state feedback (FSF) control. In PID control, an error signal between the output and the reference input (e.g., a Heaviside function) is computed. The control signal is a linear combination of the error, the integral, and the derivative of the error. These three components can appear separately. The proportional control has been applied in mechanical and managerial mechanisms such as the centrifugal governor and production planning (Chen & Disney, Citation2007). The full-state feedback control defines the control signal as a linear combination of the full system state vector, where the coefficient vector (the “gain”) shares the same dimensionality as the state vector. By tuning the gain, the poles of the closed-loop system (the eigenvalue of the transition matrix or the roots of the characteristic equation) will change their position in the complex plane, adjusting the system performance. The full-state feedback policy can also be applied in production and inventory control (Gaalman, Citation2006).
In contrast to the linear strategies, the nonlinear control strategies are defined as policies where the control signal cannot be represented by a linear function of the system state (Slotine et al., Citation1991). These policies are primarily used when the open loop system is also nonlinear. One such policy is sliding mode control, where the control signal is a switching function of the state, dependent on some switching rules. The system is then maintained near a hypersurface of the state space (sliding), where the dynamic behaviour of the system is desired. It should be ensured that the hypersurface is reachable from any initial state and that the system state can be maintained on the hypersurface by the policy. In practise, bang-bang control is adopted frequently as a special case of sliding mode control, where the control signal can take only two possible values. The rocket engines and domestic thermostats are examples of such (with on and off states).
Optimal control aims at finding the control signal or control policy that allows an objective function to reach its extreme point (Sethi & Thompson, Citation2009; Bertsekas, Citation2012a). The objective function could be dependent on the state, output and/or control. Many control policies mentioned above, e.g., full-state feedback control and sliding mode control, have been proved to be the optimal control of some control problems. Optimal control in the special sense is based on Pontryagin’s Maximum (or equivalently Minimum) Principle and mainly deals with the design of the open-loop control signal. When equipped with the Hamilton-Jacobi-Bellman (HJB) theory, it can be used to design optimal feedback control policies. Optimal control is closely connected with dynamic programming, which will be reviewed in §[dynamic programming]. The optimal control technique has been widely applied in operations management (e.g., Kumar & Swaminathan, Citation2003).
When random external disturbances are present, the stochastic control techniques are necessary (Åström, Citation2012). In these situations, objective functions are usually statistical functions of the state or the output, such as the absolute mean or variance. The most well-studied stochastic control problem is the Linear Quadratic Gaussian (LQG) problem, where the system is linear, the objective function is of quadratic form, and the noise signal follows a Gaussian distribution. The optimal control policy in this case is a linear one. Many supply chain management problems can be modelled in LQG form (Lee et al., Citation1997). For more complex problems involving nonlinearity or an unspecified system structure, the model predictive control (MPC) approach can be used (Camacho & Bordons, Citation2013). This approach transforms the infinite-horizon problem into a finite-horizon problem by focusing only on T periods in the future, deriving the control signal for these T periods, and adopting the most recent control. In the next period, the prediction is updated, and this process is repeated. MPC is not an optimal control method due to the finite-horizon approximation, yet it works very well in practise (Doganis et al., Citation2008). To deal with parametrical uncertainties in the disturbance, robust control provides guaranteed performance (Zhou & Doyle, Citation1998). The well-known control (H infinity) is one of such examples. It minimises the largest singular value of the transition matrix function, which in SISO systems equates to the peak value of the frequency response curve. This minimax strategy ensures that any frequency component in the input will not be amplified too much. Finally, if the system parameters vary over time, adaptive control allows the control policy to update according to the estimated parameters (Åström & Wittenmark, Citation2013). The difference between adaptive and robust control is that the policy is dynamic in the former and static in the latter.
Recent development of control theory can be seen in the controlling of complex, large scale and network system; the use of artificial intelligence in control engineering; and the application of control theory in areas of physics, biology and economics.
2.7. Data envelopment analysisFootnote13
Data Envelopment Analysis (DEA) is a non-parametric frontier analysis methodology mainly used to assess the relative efficiency of a set of homogeneous operating units (termed Decision Making Units, DMUs). DMUs are assumed to consume inputs (i.e., resources) to produce outputs (e.g., goods and services). The production function that indicates the amount of outputs that can be produced from a given input vector is unknown. DEA does not make any assumption about the functional form of that dependency. Instead, DEA uses the observed data to infer the Production Possibility Set (PPS), also called the DEA technology, which contains all the operating points that are deemed feasible. This is achieved on the basis of a few assumptions (like envelopment of the observations, free disposability of inputs and outputs, convexity and returns to scale) and invoking the Minimum Extrapolation Principle. The resulting PPS contains all linear combinations of the observations along with all the operating points that they dominate. This leads to Linear Programming models whose main decision variables are the intensity variables used to compute the target operating point (projection). This target operating point must dominate the DMU being projected and represents maximal improvements (i.e., input reduction and output increase) with respect to the latter. Hence, the computed target belongs to the efficient frontier (which is the non-dominated subset of the PPS) and the efficiency score is a decreasing function of the distance from the DMU to the computed efficient target. There are different ways of measuring this distance, which, ultimately, depends on the potential input and output improvements (i.e., slacks) computed by DEA. Before diving into the DEA methodology note that, as Cook et al. (Citation2014) point out, although DEA has a strong link with production theory in economics, it is often used to benchmark the performance of manufacturing and service operations. In such benchmarking exercises, the efficient DMUs, as defined by DEA, may not necessarily form a “production frontier”, but rather a “best-practice frontier”. Thus, the purpose of the performance measurement exercise affects the classification of the different variables considered into inputs or outputs.
2.7.1. Efficiency assessment and target setting DEA models
The seminal DEA models by Charnes et al. (Citation1978) and Banker et al. (Citation1984) were oriented (i.e., gave priority to reducing the inputs or to increasing the outputs) and looked for a uniform (i.e., radial) improvement in all the input or output dimensions. The projection can also be estimated using a given direction, giving rise to Directional Distance Function (DDF) DEA models (Wang et al., Citation2019a). However, most DEA approaches are non-radial and non-oriented (e.g., Fukuyama & Weber, Citation2009). Actually, because DEA aims at simultaneously improving inputs and outputs, it is inherently a multiobjective optimisation approach. Hence, taking into account the preferences of a decision maker, any Pareto optimal point can be selected as efficient target (Soltani & Lozano, Citation2020).
Most DEA models compute targets that can be sometimes far away from the observed DMU. This increases the difficult and effort required to achieve the target. Hence, DEA models that compute closest efficient targets have been developed (Aparicio et al., Citation2007). An alternative is to compute stepwise efficiency improvement approaches that may eventually achieve ambitious efficient targets but after several gradual improvement steps (Lozano & Villa, Citation2005).
DEA models for handling non-discretionary variables (Banker & Morey, Citation1986), undesirable outputs (Kuosmanen, Citation2005), integer variables (Kazemi Matin & Kuosmanen, Citation2009), ratio variables (Olesen et al., Citation2022), negative data (Sharp et al., Citation2007), and fuzzy data (Arana-Jiménez et al., Citation2022) have also been proposed. Each of the above “complications” requires specific adaptations of the methodology and being capable of taking them into account is a proof of the power and flexibility of DEA.
The DEA models based on the PPS concept are labelled as envelopment formulations. There are also dual multiplier formulations in which the decision variables are not the intensity variables used to compute the target inputs and outputs but the corresponding input and output shadow prices. Multiplier formulations let each DMU choose these input and output weights so that its efficiency is maximised. This freedom often leads to DMUs choosing idiosyncratic or unreasonable weights. Imposing Assurance Regions (AR) and other types of weight restrictions has been proposed (Allen et al., Citation1997) as well as measuring the efficiency of the DMUs as the average of the cross-efficiency scores computed with the input and output weights chosen by the different DMUs (Doyle & Green, Citation1994; Chen & Wang, Citation2022). Another alternative that has been proposed is using a Common Set of Weights (CSW) instead of letting each DMU choose its own (Salahi et al., Citation2021).
In addition to computing efficiency scores, DEA can be used to rank the DMU. The problem here is that in conventional DEA all the DMUs labelled as efficient are tied and cannot be ranked. In addition to the CSW or cross-efficiency approaches mentioned above, there are other DEA-based full ranking methods, like the super-efficiency approach (Tone, Citation2002). Alternatively, instead of fully ranking the DMUs, ranking intervals and dominance relations can be established (Salo & Punkka, Citation2011).
2.7.2. Dynamic and network DEA models
DEA views DMUs as input-output black boxes. However, it is often the case that DMUs have an internal structure with different stages or processes (sometimes labelled subDMUs). Many different Network DEA (NDEA) models have been developed to address these scenarios (Tone & Tsutsui,, Citation2009). The key features of NDEA models are that each process has its own technology and that, except in the case of parallel processes, there exist intermediate product flows between the processes. Some NDEA models can compute an efficiency score for each process and relate the overall efficiency score to the scores of the individual processes (Kao, Citation2016). It must be noted that the NDEA configuration most studied and most commonly used in practice involves two stages in series (see, e.g., Cook, et al., Citation2010; Halkos et al., Citation2014).
Multi-period and dynamic scenarios can be modelled in a manner similar to NDEA simply by considering each time period as a subDMU. The difference between multi-period approaches (Kao & Liu, Citation2014) and Dynamic DEA (Tone & Tsutsui, Citation2010) is that in the latter there are flows between consecutive periods (i.e., carryovers). Dynamic NDEA (DNDEA) models, in which there are carryovers between periods as well as intermediate product flows between the processes, have also been developed (Tone & Tsutsui, Citation2014).
2.7.3. Centralised DEA models
DEA generally projects each DMU separately onto the efficient frontier. There are situations in which the DMUs belong to the same organisation and there is a Central Decision Maker (CDM) that is interested in the overall system performance and therefore in projecting all the DMUs simultaneously. This type of Centralised DEA (CDEA) models are commonly used for resource allocation (Lozano & Villa, Citation2004) and for centralised production planning (Lozano, Citation2014). Also, an approach to measure the centralised efficiency of the individual DMUs in CDEA scenarios has been proposed (Davtalab-Olyaie et al., Citation2023).
DEA models for allocating a fixed input or common revenue (Li et al., Citation2021) or for fixed-sum-outputs (FSO; Zhu et al., Citation2017) also share with CDEA the need to project all the DMUs simultaneously to take into account their interrelationships. These models, same as CDEA, can use an envelopment or a multiplier formulation. While the key feature of the former is that all DMUs are projected simultaneously, that of the latter is that, same as in CSW, a single set of input and output weights is considered.
2.7.4. DEA and total factor productivity (TFP) growth
DEA can be used to compute the Malmquist Productivity Index (MPI) by projecting the DMU in two consecutive periods onto the efficient frontier of each period and computing the geometric mean of the change in the corresponding radial efficiency scores between the two periods (Färe et al., Citation1992). The Malmquist-Luenberger Productivity Indicator (MLPI) is analogous but it employs the arithmetic average and an additive decomposition of DDF efficiency scores (Chambers et al., Citation1996). In both cases, the TFP growth of each DMU can be decomposed into an efficiency change and a technological change component. Other alternative decompositions of the MPI and MLPI have been developed (Epure et al., Citation2011).
Other approaches compute a global MPI (Pastor & Lovell, Citation2005; Kao & Liu, Citation2014). These have the circularity property, missing in the adjacent-periods MPI. Changes in prices can be also incorporated to compute and decompose a global cost MPI (Tohidi et al., Citation2012). MPI variants that take into account the projections of all the observations or of different groups of observations as well as approaches to compute and decompose the aggregate productivity growth index of a whole industry and input-specific productivity growth indexes have also been proposed (Aparicio et al., Citation2017; Kapelko et al., Citation2015).
2.7.5. Metafrontier analysis
In scenarios where the DMUs are heterogeneous and belong to different groups, not necessarily disjoint, the DMUs can be projected onto its group frontier as well as onto the metafrontier that results from enveloping all the group frontiers. Measuring the difference between the corresponding efficiency scores can be used to estimate the distance between both frontiers and hence the corresponding technology gap of each group. Although the group technologies are generally convex, the metatechnology is generally non-convex (Afsharian & Podinovski, Citation2018).
The metafrontier approach can be used in DNDEA (See et al., Citation2021) and CDEA (Gan & Lee, Citation2022) contexts. Also, using metafrontier concepts with each group of observations corresponding to a different time period, meta-MPI and meta-MLPI can be computed and appropriately decomposed (Portela & Thanassoulis, Citation2010).
2.7.6. Other DEA approaches
There are other interesting DEA approaches that have not been covered above, like congestion (Ren et al., Citation2021), window analysis (Peykani et al., Citation2021), etc. Moreover, the field, although mature, is still expanding, with promising new developments, like Efficiency Analysis Trees (EAT) (Esteve et al., Citation2020), Support Vector Frontiers (SVF) (Valero-Carreras et al., Citation2022), or big data DEA (Dellnitz, Citation2022). This is not to mention the large and increasing number of DEA applications (see §3.6, §3.7, and §3.19). For further learning on DEA the interested reader is referred to existing textbooks (Cooper et al., Citation2007), handbooks (Cooper, et al., Citation2011; Cook & Zhu, Citation2014; Zhu, Citation2015) and review papers (Kao, Citation2014; Contreras, Citation2020; Peykani, et al., Citation2020).
2.8. Decision analysisFootnote14
The term decision analysis was introduced by Howard (Citation1966) as “a logical procedure for the balancing of the factors that influence a decision”, pointing out that “the procedure incorporates uncertainties, values and preferences in a basic structure that models the decision”. According to Keeney (Citation1982) decision analysis is a “formalisation of common sense for decision problems which are too complex for informal use of common sense” and, in more technical form “a philosophy, articulated by a set of logical axioms, and a methodology and collection of procedures, based upon those axioms, for responsibly analysing the complexities inherent in decision problems”. In a slighty different perspective, Roy (Citation1993) proposed the concept of decision aiding as “the activity of one who, in ways we call scientific, helps to obtain elements of answers to questions asked by actors involved in a decision-making process, elements helping to clarify this decision in order to provide actors with the most favourable conditions possible for that type of behaviour which will increase coherence between the evolution of the process, on the one hand, and the goals and/or systems of values within which these actors operate on the other”.
For Howard (Citation1966) “the essence of the procedure is the construction of a structural model of the decision in a form suitable for computation and manipulation”. For Keeney (Citation1982) “the foundations of decision analysis are provided by a set of axioms … which provide principles for analysing decision problems”. Moreover, “the philosophical implications of the axioms are that all decisions require subjective judgements and that the likelihoods of various consequences and their desirability should be separately estimated using probabilities and utilities, respectively”. In this perspective, the key components of a decision problem are the set of alternatives to be taken into consideration; the set of consequences describing outcomes of alternatives, possibly in terms of a plurality of attributes or criteria; if the consequences are uncertain, the beliefs about their possible realisations expressed in terms of a probability distribution; the preferences of the decision maker. The objective of the decision analysis is to construct a value function representing the preferences of the decision maker by assigning each alternative an evaluation of its desirability. In case of uncertainty of the consequences, the value function is expressed in terms of expected value with respect to the probability of the consequences. The basic methodology to induce the value function is based on the pioneering work of von Neumann and Morgenstern (Citation1944) that showed that a small set of axioms imply that the “utility” of an outcome x is defined as the probability of getting the most-preferred outcome and otherwise the least-preferred outcome that would be indifferent to receiving outcome x with certainty. For Roy (Citation1993), the decision aiding procedure should be developed in a constructive approach in which “concepts, models, procedures and results are here seen as suitable tools for developing convictions and allowing them to evolve, as well as for communicating with reference to the bases of these convictions”. In this perspective the “object is not to know or to approximate the best possible decision but to develop a corpus of conditions and means on which we can base our decisions in favour of what we believe to be most suitable”.
Decision Analysis is mainly based on concepts and tools related to the subjective probability of Ramsey (Citation1931) and de Finetti (Citation1937), the theory of expected utility of von Neumann and Morgenstern (Citation1944) and subjective expected utility of Savage (Citation1954), the Multiple Attribute Utility Theory (MAUT) of Keeney and Raiffa (Citation1976) and the psychology of judgement and decision-making of Tversky and Kahneman (Citation1974). The general idea is to try to evaluate each alternative by assigning a value based on the utilities of the outcomes obtained in each state of the nature multiplied by their probabilities. Delayed consequences may be discounted according to the time at which they are obtained. Each outcome may be evaluated by considering value trade-offs among multiple attributes. Decision analysis techniques include Utility Function Elicitation techniques, Probability Elicitation protocols, Net Present Value, Decision Trees, Influence Diagrams, and Monte Carlo simulation-based decision analysis (Clemen, Citation1996); Value-Focused Thinking (Keeney, Citation1996a); Portfolio Decision Analysis (Salo et al., Citation2011), Bayesian Networks (Pearl, Citation1988), and multi-stage decision optimization techniques such as dynamic rogramming and reinforcement learning.
Considering the distinction between normative, descriptive and prescriptive approaches (Bell et al., Citation1988), the general perspective of the decision analysis is prescriptive rather than normative or descriptive (Edwards et al., Citation2007). Descriptive analysis concerns the representation and prediction of observed decisions and normative analysis concerns the decisions that ideally coherent and rational individuals should take. Instead, prescriptive analysis tries to propose methods and techniques that will help real people make better decisions with lower regret and greater coherence of values and behaviors. In this context, decision analysis takes a prescriptive approach that, focusing on the few basic axioms underlying subjective expected utility, adopts “pragmatically” the aspiration to the rationality of the normative approach, trying to correct all the heuristics and biases discovered and investigated by descriptive analysis (Tversky & Kahneman, Citation1974). The decision aiding approach (Roy, Citation1993) takes a different perspective that, criticising the idea that there is an objectively optimal decision to be discovered or at least approximated, aims to provide a recommendation consisting in a set of convictions constructed in the course of a decision process based on multiple interactions between the analyst and the decision maker. The decision aiding approach leads directly to a multi-criteria perspective (Belton & Stewart, Citation2002; Greco et al., Citation2016) taking explicitly into consideration the multiple attributes or criteria (e.g., related to finance, resources, time, and environmental impacts) to be considered in the decision problem at hand. This avoids the risk of a fictitious, not reasoned and arbitrary conversion of evaluations on different criteria to a common unit, facilitating the discussion on the respective role of each criterion (Roy, Citation2005, Citation1996). To compare alternatives in a multicriteria decision procedure four main approaches can be adopted:
aggregating criteria assigning a single value to each alternative: this is the case of above mentioned MAUT, as well as of some of the most well known multicriteria methods such as SMART (Edwards & Barron, Citation1994), and UTA (Jacquet-Lagreze & Siskos, Citation1982); a specific mention deserves in this context the AHP approach (Saaty, Citation1977), that is probably the most adopted (although controversial; see, e.g., Dyer, Citation1990) multicriteria method. It is based on the comparison of “importance” of criteria and of evaluation of alternatives with respect to considered criteria by means of a nine point qualitative scale; another specific class in this family are the distance-based methods which, following the main principle of TOPSIS (Hwang & Yoon, Citation1981), the first and most famous of these methods, evaluate each alternative on the basis of their distance from the positive ideal solution and the negative ideal solution (the fictitious alternatives that have the best and the worst evaluation on each criterion, respectively); two other well-known methods in this class are VIKOR (Opricovic & Tzeng, Citation2004) and TODIM (Gomes & Lima, Citation1991).
aggregating criteria by means of one or more synthesising preference relations: the most well known methods based on this approach are the ELECTRE methods (Figueira et al., Citation2013, Citation2016), that build a crisp or valued preference relation called outranking for which an alternative a is at least as good as another alternative b if a a is not worse than b for a majority of important criteria (concordance) and there is no criterion for which the advantage of b over a is so large that it prevents the possibility to declare a at least as good as b (non-discordance);
aggregating criteria through “if
aggregating criteria through an interactive multiobjective optimisation (Branke et al., Citation2008): with this approach one can handle decision problems in which a set of objectives have to be optimised under given constraints (see Sawaragi et al., Citation1985; Steuer, Citation1985; Miettinen, Citation1999; Ehrgott, Citation2005). In this context, the concept of Pareto efficient solution is fundamental: it is a solution for which one cannot improve one objective without deteriorating some others. Several algorithms have been proposed for Pareto set generation and among them let us remember the weighted sum method, the lexicographic method, the achievement secularising function, the epsilon constraint method (for surveys see Marler & Arora, Citation2004, or Chapters 18 and 19 in Greco et al., Citation2016). Dealing with a multiobjective optimisation problem, it is important to discover the set of Pareto efficient solutions most preferred by the decision maker. Recently, beyond many exact methods, some heuristic methods have been proposed for these problems, such as some hybridisation between evolutionary multiobjective optimisation algorithms aiming to approximate the whole set of Pareto efficient solutions (Deb, Citation2001) and some multicriteria preference elicitation methods to guide the optimisation algorithm toward the most interesting set of Pareto efficient solutions (see, e.g., Phelps & Köksalan, Citation2003; Branke et al., Citation2016).
2.9. Dynamic programmingFootnote15
Dynamic programming (DP) was the brainchild of Richard Bellman (Bellman, Citation1953), who wrote “DP is a mathematical theory devoted to the study of multistage processes”. Indeed, in the seven decades since his seminal work, the uses of DP have grown substantially thanks to its algorithmic nature in solving sequential decision-making problems, where the preceding actions and their realisation (in terms of consequences) will impact on the course of futures. Examples of such problems include multiperiod inventory management, or asset allocation (portfolio management) over a given time horizon. The central idea of DP is to break down the original multistage problem into a number of tail sub-problems by stages. For each stage, the tail sub-problem is a truncated version of the original problem starting from this stage. These tail sub-problems are then recursively solved one by one from the last stage backwards to the first one, at which point the original problem is solved. The solution of such a procedure is guaranteed to be optimal when the problem concerned satisfies a sufficient condition, i.e., the Principle of Optimality (Bellman, Citation1953; Puterman, Citation2014), which states “an optimal policy has the property that whatever the initial state and initial decision are, the remaining decisions must constitute an optimal policy with regard to the state resulting from the first decision” (Bellman, Citation1953). Throughout this section, we focus our attention on discrete time systems. For continuous time dynamic systems, the readers are referred to the Hamilton-Jacobi-Bellman equations in optimal control (see, for example, Bertsekas, Citation2012a).
In particular, for a finite time horizon problem, the decisions are made over a number of stages or decision epochs, denoted by At each decision epoch, after observing the current system state x
(comprised of one or more information variables that characterise how the system progresses), an action a
is taken that leads to an immediate reward (cost) of
where w
is the random disturbance at time t with a known probability distribution. The system then evolves to state
at the next decision epoch, following the transition function
with the transition probability
After the last decision is made at epoch T – 1, the system evolves to x
in the terminal stage with the salvage value
The objective of the problem is to find a policy
or a sequence of actions
prescribed by
that maximises (minimises) the total expected reward (cost) across the entire time horizon. Note that for the expected total reward optimisation criterion (or additive reward functions) the Principle of Optimality is always satisfied (Puterman, Citation2014). To avoid the technical subtleties, in what follows we focus on discrete state space S and action space A, and assume the random disturbance at an epoch is independent of those in the previous epochs. Define the dimension of the state space S as the number of the information variables in the state. The mathematically inclined readers are referred to Puterman (Citation2014) for discussions on more general situations. Before proceeding, it is worth mentioning that when the random disturbance w
takes only a single value, the problem reduces to a deterministic problem. Perhaps the two most well known deterministic sequential decision-making problems solvable by DP are the Shortest Path problem (Dreyfus, Citation1969) and the Knapsack problem (Kellerer et al., Citation2004).
Under the Principle of Optimality, the above-mentioned problem can be solved by backward induction. Denote by the value function, or the optimal expected value-to-go from state x
at epoch t until the end of the time horizon. The value function (for maximisation problems) satisfies the following optimality equations (or Bellman Equations, see e.g., Puterman, Citation2014),
(1)
(1)
with the boundary condition
By recursively solving the optimality equations from the last stage backwards to time zero, we obtain the optimal value functions and, at the same time, an optimal policy. For this method to work, however, at each stage one has to solve the value function for all states before proceeding to the previous stage. For problems with high dimensional state variables, the solution via this method is simply not practical due to the prohibitive amount of computational time and memory required. The recent development on DP research has been essentially trying to overcome this so called curse of dimensionality (Powell, Citation2011), which is discussed in the last paragraph of this section.
Many sequential decision-making problems in practice do not have a natural termination stage, leading to a rich body of literature studying infinite horizon problems, for which the total expected reward becomes unbounded as the time horizon tends to infinity. To this end, two alternative criteria have been widely used in the literature (Puterman, Citation2014; Bertsekas, Citation2012a). The first one applies a discount factor between 0 and 1, say to the future reward, which can be understood as the depreciation of monetary values over time. The total discounted reward is well defined as it is bounded by the sum of a decreasing infinite geometric sequence. In situations where discounting is not appropriate, a meaningful criterion is to consider the long run average reward, or the reward rate per stage. Assuming a stationary system (in which the transition function/probability, the reward function, and random disturbance do not change over time), the Bellman Equations for the total discounted reward criterion take the following form:
(2)
(2)
where the value function V(x) is the optimal discounted value-to-go from state x over an infinite time horizon. Note that there are no more boundary conditions. There is no more dependency on time either under the assumption of stationary systems, which is often satisfied in practice (Bertsekas, Citation2012a). When such an assumption is not satisfied, a periodic or cyclic DP can be developed (Li et al., Citation2022a). For brevity we do not include the Bellman equations for the long run average reward criterion but direct the readers to Bertsekas (Citation2012a) and Puterman (Citation2014).
There are mainly three solution algorithms (Tijms, Citation1994; Puterman, Citation2014) for infinite horizon problems. The most widely used and understood algorithm is value iteration, or successive approximations as it was called in the early days. Starting from an arbitrary bounded value function vector (e.g., ), this method iteratively updates value functions via the recursive equation below until the successive gaps between iterations k + 1 and k are within a predefined threshold.
(3)
(3)
An alternative algorithm is policy iteration, which starts with an arbitrary policy and then iteratively improves it until no further improvements are possible. Each iteration includes two steps: firstly the expected value-to-go under the current policy is evaluated via a system of equations similar to Equation(2)(2)
(2) but for the actions prescribed by the policy; after that a policy improvement step is undertaken to find an improved action for each state that leads to a better value-to-go (Puterman, Citation2014). In the last algorithm, the system of Bellman EquationEquation (2)
(2)
(2) are reformulated into a vary large scale linear program, which has one decision variable for each state and one constraint for each state-action pair. Regardless of the solution algorithms, just as in finite horizon problems, the curse of dimensionality remains the biggest hurdle for the implementation of DP.
Various approximation methods have been proposed to improve the scalability of DP, leading to an important and thriving research field called Approximate Dynamic Programming (ADP). According to Bertsekas (Citation2012a), most of the ADP approaches fall into either the value space or policy space. We concentrate on the approaches in the value space (see also §2.21) while we direct readers to Bertsekas (Citation2012a) for the policy space counterparts. The basic idea of the value space approaches is to develop efficient methods to approximate the value functions or the expected value-to-go for a given policy. The most studied methods approximate the value functions via a linear or nonlinear combination of a set of handcrafted feature vectors (functions of the state) weighted by a set of parameters, which are calibrated by a suitable method (Bertsekas, Citation2012b; Ding et al., Citation2008). Feature vectors are not always available, in which case Neural Networks have been used to construct feature vectors automatically (Powell, Citation2011; Bertsekas, Citation2012a; He et al., Citation2018). Decomposition is also a popular method, which decomposes the original problem into a number of sub-problems each of which has a much smaller state space and can be solved efficiently by the exact algorithms mentioned above. The assembly of the value functions of these sub-problems provides an approximation to the original value functions (Kunnumkal & Topaloglu, Citation2010; Li & Pang, Citation2017). A distinct decomposition approach is Whittle’s Restless Bandit framework (Whittle, Citation1988; Glazebrook et al., Citation2014; Li et al., Citation2020), which decomposes the original problem via Lagrangian relaxation, calculates a state dependent index value for each sub-problem and uses these index values directly to derive policies for the original problem. Another method in the value space approximates the value functions of a specific policy via Monte Carlo simulation (Chang et al., Citation2007; Bertsekas, Citation2012b), which are then used to find an improved policy. An alternative method is called Q-Learning (Sutton & Barto, Citation2018), which approximates the Q-factor for each state-action pair. The Q-factor for (x, a) is the expected value-to-go by taking action a at state x and then following either a given policy or the optimal policy thereafter. Due to the large number of combinations of state-action pairs, Q-Learning is more suitable for problems with a small state space (Bertsekas, Citation2012b). For an in-depth account on ADP we refer to two seminal books of Powell (Citation2011) and Bertsekas (Citation2012b).
2.10. ForecastingFootnote16
Forecasting is concerned with the prediction of unknown/future values of one or multiple variables of interest. If the values of these variables are collected over time, especially/in particular at regular intervals, the corresponding problem is referred to as time-series forecasting. The outputs of forecasting models include point estimates as well as expressions of uncertainty of such estimates in terms of probabilistic forecasts, prediction intervals, or path forecasts. Forecasting is applied in a wide range of applications. In this subsection, we offer an overview of established forecasting approaches that are useful in social settings (Makridakis et al., Citation2020a), such as forecasts produced to support decision making in operations and supply chain management (§3.12; §3.24, finance (§3.9), energy (§3.19), and other domains.
Exponential smoothing is one of the most popular families of models for univariate time-series forecasting. The underlying principle of exponential smoothing models is that, at every step, the forecast is updated such that the most recent information is taken into account by exponentially discounting information from previous periods. The estimates for the exponential smoothing parameters are based on in-sample fits. The first and simplest exponential smoothing method, simple (or single) exponential smoothing, was developed by Brown (Citation1956). This method was able to handle level-only data (no trend nor seasonal patterns). Soon after, it was extended to handle trended and seasonal data (Holt, Citation2004; Winters, Citation1960). Forty years later, Hyndman et al. (Citation2002) introduced a fully fledged family of exponential smoothing models that are represented in a state-space framework. Usually, three states are considered: level, trend, and seasonality. The way that these three states interact to produce the final forecast determines the types of trend and seasonality (such as additive or multiplicative). Exponential smoothing models are fast to compute and perform well in a wide range of data (Makridakis et al., Citation2020b), rendering them ideal benchmarks for forecasting applications. Detailed reviews of exponential smoothing models are offered by Gardner (Citation2006) and Hyndman et al. (Citation2008).
Autoregressive integrated moving average (ARIMA) is another very popular family of univariate forecasting models (for a seminal work on ARIMA, see Box & Jenkins, Citation1976). In ARIMA, the data are first rendered stationary through transformations and differencing. The stationary data are then fitted in linear regression models (see also the next paragraph on regression models) in which the predictors are either past values of the data (autoregressive terms) or past errors (moving average terms). ARIMA models are theoretically appealing as they can depict a wide range of data generation processes. While manually identifying an optimal ARIMA model can be sometimes challenging, nowadays automated approaches exist (see, for example, Hyndman & Khandakar, Citation2008; Franses et al., Citation2014)
When the variable of interest is known to be affected by other factors (also called “exogenous variables”), then causal modelling can be applied. In its simplest form, causal models can be linear or nonlinear regression models that regress the values of the dependent variable on the values of the independent variable(s). Apart from the ordinary least squares regression models, other types of regression models exist, such as the ordinal, logistic, Poisson, negative binomial regression models as well as the Generalised Linear Models (GLMs). The dependent variable (variable of interest) is usually continuous, however specific regression models exist for ordinal or binary dependent variables, such as the ordinal logistic regression model.” But of course there are also regression approaches for count data, like Poisson regression or negative binomial regression (Hilbe’s textbook of the same name is my go-to reference on this), or more generally Generalized Linear Models (GLMs). I would assume these to be more relevant to OR than binary or ordinal logistic regressions.
A common rule for using regression models for forecasting purposes is that the values of the independent variables are either known or can be predicted, as is very common in energy forecasting; see Weron (Citation2014) and §3.19. Transformations of the dependent or independent variables are sometimes necessary so that assumptions regarding normality of errors and constancy of the error variance are satisfied (Lago et al., Citation2021). Another common issue in regression models is that of multicollinearity between independent variables. Linear regression models can also be used to produce time-series forecasts when no exogenous variables are available. In these cases, we can construct predictors for trend and seasonality and use these predictors as independent variables to model the time-series patterns. Finally, it is also worth mentioning that ARIMA models can be extended to ARIMAX models that can include the effects of exogenous variables, just like autoregressive (AR) models can be extended to ARX.
Instead of forecasting each time series separately, several approaches exist in order to forecast time series data as a collection. Multivariate models (also known as structural models) are designed to model cross-sectional data, producing forecasts for many variables of interest at the same time. Such forecasts take into account interactions between all series. A common example is the vector autoregressive (VAR) models (Sims, Citation1980; Hasbrouck, Citation1995). Another very popular cross-sectional approach is hierarchical forecasting (Athanasopoulos et al., Citation2020). Hierarchical forecasting deals with time-series data that are naturally arranged in hierarchical structures (for example, product or geographical hierarchies). Forecasts for each node of the hierarchy are first produced independently using standard univariate forecasting approaches (such as exponential smoothing or ARIMA); then, forecasts across the hierarchy are reconciled to achieve coherency (Wickramasuriya et al., Citation2019; Hollyman et al., Citation2021). Hierarchical forecasts offer better accuracy and are directly relevant for decision makers at multiple levels of an organisation. A different form of forecasting using multiple series, which is widely applied in machine-learning methods, is called cross-learning. This approach implies learning (usually through features; Montero-Manso et al., Citation2020; Wang et al., Citation2022c) from other series to be able to predict the variable of interest. Compared to other cross-sectional approaches, cross-learning requires access to a set of “reference” data which, though, do not have to be concurrent to the target data.
Given the plethora of available modelling options, we need ways to help us decide on the best approach for the target data. Two popular approaches for model selection are information criteria and cross-validation. Information criteria select the best model amongst a pool of candidate models based on how well the in-sample forecasts fit the actual data (model fit), penalising at the same time for model complexity (Occam’s razor). Information criteria are fast to compute and widely applied, mostly due to their implementations in open-source forecasting packages (Hyndman & Khandakar, Citation2008). Cross-validation is based on the comparison of the out-of-sample performance between different models. To achieve this, the available data are split into “training” and “validation” data. The validation follows a rolling-origin process, where the forecasts of the candidate models are compared for multiple forecast origins (Tashman, Citation2000; Bergmeir & Benítez, Citation2012). A more recent approach to forecast selection is based on the concept of representativeness (Petropoulos & Siemsen, Citation2022). Out-of-sample forecasts with higher representativeness to the past data patterns are preferred to ones with lower representativeness. Regardless of how one selects between forecasts and models, the values of the selection criteria can also be used to combine forecasts (Kolassa, Citation2011). In fact, multiple studies have shown that combining forecasts, using equal or unequal weights, can significantly boost the forecasting performance of individual models (Bates & Granger, Citation1969; Nowotarski et al., Citation2016; Wang et al., Citation2022d). Claeskens et al. (Citation2016) offer a possible explanation on why the performance of forecast combinations is better than that of the individual forecasts.
Apart from statistical, algorithmic and computational approaches, the forecasting process can also be infused by judgement (see, also, §2.2 and §2.20). It is not unusual for forecasts to be directly produced in a judgemental way, without the support of any systematic approaches. Research suggests that such forecasts suffer from several biases (Lawrence et al., Citation2006). However, managers may sometimes have a unique appreciation of the situation, one that the hard data cannot communicate through models. In such cases, systematic approaches to elicit expert knowledge include the Delphi method (Rowe & Wright, Citation1999), structured analogies (Green & Armstrong, Citation2007), prediction markets (Wolfers & Zitzewitz, Citation2004), and interaction groups (Van de Ven & Delbeco, Citation1971); see also Graefe and Armstrong (Citation2011) and Nikolopoulos et al. (Citation2015) for a comparison between these approaches. Apart from producing forecasts directly, judgement may also be used to adjust the formal/statistical forecasts. Judgemental interventions and their efficacy have been well-studied in the literature (see, for example: Fildes et al., Citation2009; Petropoulos et al., Citation2016; Fildes et al., Citation2019). The main takeaways are: (i) negative adjustments are generally more beneficial than positive ones; (ii) larger adjustments should be preferred to smaller ones; and (iii) the use of feedback and support will limit and improve the role of such judgemental adjustments. Finally, managerial judgement may be applied in other stages of the forecasting process, such as judgementally selecting between statistical models (Petropoulos et al., Citation2018; De Baets & Harvey, Citation2020) or setting their (hyper)parameters.
Forecasts produced in previous periods need to be evaluated once the corresponding actual values become available. Through feedback, forecast evaluation allows analysts to improve the forecasting process and, thus, forecasting performance. The main rule of forecast evaluation is that performance should be measured on data that were not used to fit the models or produce the forecasts. Solely measuring the in-sample performance will inevitably lead to over-fitting and the use of complex forecasting models. There exist a wide array of evaluation metrics. Some of them are suitable for measuring the accuracy or bias of the point forecasts, while others focus on how well the uncertainty around the forecasts is estimated. In the former category, popular metrics are the mean absolute error (MAE), the root mean squared error (RMSE), the mean absolute percentage error (MAPE, which is very popular in practice) and the mean absolute scaled error (MASE, which is theoretically more elegant and popular in academia). It should be noted that Kolassa (Citation2020) showed that different error metrics are minimised by different (point) forecasts and that it makes little sense to evaluate one point forecast using multiple KPIs. For detailed overviews of forecasting metrics for point forecasts and their proper use, the reader is referred to Hyndman and Koehler (Citation2006), Davydenko and Fildes (Citation2013), and Koutsandreas et al. (Citation2022). In the latter category, a popular metric is the interval score (IS), which is a proper scoring rule and considers both the calibration and the sharpness of the prediction intervals, as well as the pinball score, the continuous ranked probability score (CRPS), and the energy score. Gneiting and Raftery (Citation2007) offer a review of (strictly) proper scoring rules. Finally, we should mention that nowadays it is common to go beyond strict forecasting performance and measure the performance of the forecasts on the utility (Hong et al., Citation2020; Yardley & Petropoulos, Citation2021).
For a detailed encyclopedic overview of the forecasting field, both in terms of theory and practice, we refer the reader to the work of Petropoulos et al. (Citation2022); a live version of this encyclopedia is available at https://forecasting-encyclopedia.com. Hyndman and Athanasopoulos (Citation2021) and Ord et al. (Citation2017) have written comprehensive textbooks on forecasting and its applications. Notable open-source packages with implementations of the most popular forecasting models include the forecast (Hyndman et al., Citation2022) and smooth (Svetunkov, Citation2022) packages for R statistical software.
2.11. Game theoryFootnote17
Game theory is a branch of mathematics that studies strategic interactions between decision makers, called players. Strategic interactions means that a player’s payoff depends not only on her own decision (action or choice), but also on the decisions made by the other players. The book by von Neumann and Morgenstern (Citation1944) is often considered the starting date of game theory, though some of its roots can be traced back to much earlier. Games can be classified along a series of features. In a static game, each player acts only once, whereas in a dynamic game, interactions are repeated over time. In a one-person game, the decision maker plays against a nonstrategic (or dummy) player, often referred to as “nature”, whose action is the outcome of a probabilistic event with a fixed (known) distribution. Two-player games focus on one-on-one interactions. Duopolistic competition and management-union negotiations are situations that can be modelled as two-person games. Extending the model to players is conceptually easy but may be computationally challenging because each player needs to determine all the possible sequences of actions and reactions for all players. When the number of interacting players is very large, e.g., an economy with many small agents, the analysis shifts from individual-level decisions to understanding the group’s behavioural dynamics. An illustration of this is traffic congestion: when an agent attempts to minimise her travel time on a route from A to B, her travel speed depends on the traffic density on that route. What matters is the number of drivers, not their identity. Population and evolutionary games (Hofbauer & Sigmund, Citation1998; Cressman, Citation2003; Sandholm, Citation2010) and mean-field games, (Huang et al., Citation2003, Citation2006, Citation2007; Lasry & Lions, Citation2006a, Citation2006b, Citation2007; Gomes & Saúde, Citation2014) are branches of game theory that study situations with large numbers of players.
A game can be defined in three forms, namely, in strategic, extensive, or in coalitional form. To formulate a one-shot game in strategic form, we have to specify (i) the set of players and, for each player, (ii) the set of actions, and (iii) a payoff function measuring the desirability of the game’s possible outcomes, which depends on the actions chosen by all players. The set of actions can be finite, e.g., to bid on a contract or not, or continuous, e.g., the amount bid. If the players intervene more than once in the game, then we should additionally define (iv) the order of play, (v) the information acquired by the players over time (stages), and (vi) whether or not nature is involved in the game.
In a one-shot game, an action (move) and a strategy mean the same thing. In games where players intervene more than once, the two concepts no longer coincide. A strategy is then a decision rule that associates a player’s action with the information available to her at the time she selects her move. So an action, e.g., spending advertising dollars, is a result of the strategy. The word strategy comes from Greek (strategia) and has a military sense. An army general’s main task is to design a plan that takes into account (adapts to) all possible contingencies. This is precisely the meaning of strategy in game theory. Whether in war, business or politics, it is never wise to allow yourself to be surprised by the enemy. This does not imply that a winning strategy always exists. Sometimes we must be content with a draw or even a reasonable loss.
One-shot games are a useful representation of strategic interactions when the past and the future are irrelevant to the analysis. However, if today’s decisions also affect future outcomes and are dependent on past moves, then a dynamic game is needed. In a repeated game, the agents play the same game in each round, that is, the set of actions and the payoff structures are the same in all stages (Mertens et al., Citation2015). The number of stages can be finite or infinite, and this distinction matters in terms of achievable outcomes. In a stochastic game, the transition between states depends on the players’ actions (Shapley, Citation1953; Mertens & Neyman, Citation1981; Jaśkiewicz & Nowak, Citation2018a, Citation2018b). In a multistage game, the players share the control of a discrete-time dynamic system (state equations) observed over stages (Başar & Olsder, Citation1999; Engwerda, Citation2005; Krawczyk & Petkov, Citation2018). Their choice of control levels, e.g., investments in production capacity or advertising, affects the evolution of the state variables (e.g., production capacity, reputation of the firm), as well as current payoffs. Differential games are continuous-time counterparts of multistage games (Isaacs, Citation1975; Başar et al., Citation2018).
Information plays an important role in any decision process. In a game, the information structure refers to what the players know about the game and its history when they choose an action. A player has complete information if she knows who the players are, which set of actions is available to each one, what each player’s information structure is, and what the players’ possible outcomes can be. Otherwise, the player has incomplete information. If, for instance, competing firms do not know their rivals’ production costs, then the game is an incomplete-information game. The game can also have perfect or imperfect information. Roughly speaking, in a game of perfect information, each player knows the other players’ moves when she chooses her own action, as in, e.g., chess or a manufacturer-retailer game where the upstream player first announces a product’s wholesale price, and then the downstream player reacts by selecting the retail price. The archetype of an imperfect-information game is the prisoner’s dilemma, where (in the original story) the players have to simultaneously choose between confessing or denying a crime. A Cournot oligopoly, where each firm chooses its own production level without knowing its competitors’ choices, is another instance of an imperfect-information game.
The outcome of a game depends on the players’ behaviour. In a noncooperative game, e.g., R&D competition to develop a vaccine, each player optimises her own payoff, whereas in a cooperative game, the players seek a collectively optimal solution. For instance, the members of a supply chain could agree to coordinate their strategies to maximise the chain’s total profit. The fundamental solution concept in a noncooperative game is the Nash equilibrium (Nash, Citation1950b, Citation1951). Let be the set of players, S
the set of strategies of player
and let her payoff function be given by
where
Assuming the players are maximisers, the strategy profile
is a Nash equilibrium if
for all
and all
At an equilibrium, no player has an interest in deviating unilaterally to any other admissible strategy. Put differently, if all other players stick to their equilibrium values, then player i does not regret implementing her equilibrium value too, which is obtained by best-replying to the choice of the others. That is,
A Nash equilibrium does not always exist, and there may be multiple equilibria, raising the question of which one to select (Selten, Citation1975). Existence and uniqueness conditions for Nash equilibrium typically rely on fixed-point theorems. If the game is one of incomplete information, then the solution concept is a Bayesian Nash equilibrium (Harsanyi, Citation1967, Citation1968a, Citation1968b). Another noncooperative equilibrium solution concept, which predates the Nash equilibrium, is the Stackelberg equilibrium, introduced in a two-player framework by von Stackelberg (Citation1934). There is a hierarchy in decision-making between the two players: the leader first announces her action, and next the follower makes a decision that takes the leader’s action as given. Before announcing her action, the leader would of course anticipate the follower’s response and selects the action that gives her the most favourable outcome. The framework has been extended to several followers and leaders (Sherali, Citation1984).
In a cooperative game, the players coordinate their strategies in view of optimising a collective outcome, e.g., a weighted sum of their payoffs, and must agree on how to share the dividend of their cooperation (Moulin, Citation1988; Owen, Citation1995). Different solution concepts have been proposed, each based on some desirable properties, typically stated as axioms, such as fairness, uniqueness of allocation, and stability of cooperation. The most-used solutions in applications are the core (Gillies, Citation1953), and the Shapley value (Shapley, Citation1953). In any solution, the set of acceptable allocations only includes those that are individually rational. Individual rationality means that a player will agree to cooperate only if she can get a better outcome in the cooperative agreement than she would by acting alone. In a dynamic cooperative game, the agreement must specify, at the outset, the decisions that must be implemented by each player throughout the planning horizon. One concern in such games is the durability of the agreement over time. Clearly, it is rational for a player to leave the agreement at an intermediate time if she can achieve a better outcome. The literature on dynamic games has followed two streams in its quest to sustain cooperation over time, namely, building cooperative equilibria or defining time-consistent solutions. Through the implementation of some (punishing) strategies, the first stream seeks to make the cooperative solution an equilibrium of an associated noncooperative game. If this is achieved, then the result will be at once collectively optimal and stable, as no player will find it optimal to deviate unilaterally from the equilibrium. See Osborne and Rubinstein (Citation1994) for repeated games, Dutta (Citation1995) and Parilina and Zaccour (Citation2015) for different types of stochastic games; and Haurie and Tolwinski (Citation1985), Tolwinski and Leitmann (Citation1986), and Haurie and Pohjola (Citation1987) for multistage and differential games. The second stream looks for time-consistent solutions, which are achieved by allocating the cooperative payoffs over time in such a way that, along the cooperative state trajectory, no player will find it optimal to switch to her noncooperative strategies. The idea was initiated in Petrosjan (Citation1977) and has since been further developed (see Yeung & Petrosyan, Citation2018; Petrosyan & Zaccour, Citation2018).
Game theory has found applications in biology, economics, engineering, management, Operational Research, and political and social sciences.
2.12. Graphs and networksFootnote18
Graphs and networks are used to represent interactions, connections or relationships between objects. In network optimisation problems, numerical attributes representing features such as costs, weights or capacities are assigned to objects (also called vertices) or to connections between them. If connections are directed, we refer to them as arcs, otherwise we call them edges. Given an input graph with n vertices and m arcs (or edges), the goal is to find a subgraph that exhibits desired properties (described by a given set of constraints) and that optimises the given objective function (usually measured as the sum of edge or vertex “weights” of the solution’s subgraph). In the following, we focus on some of the most fundamental and most studied problems in network optimisation.
The shortest path problem in arc-weighted graphs, for example, seeks to find a least costly path from the given source vertex s to the given target t. When the arc costs are non-negative, one can use the algorithm of Dijkstra (Citation1959), the efficient implementation of which uses Fibonacci heaps and runs in time. For graphs with possible negative arc costs, in
time the Bellman-Ford algorithm either finds the shortest path from s to all other vertices, or it proves that such a path does not exist due to the presence of a negative cost cycle reachable from s. The shortest path algorithms are explained in many textbooks, see e.g., Cormen, et al. (Citation2022); Kleinberg and Tardos (Citation2006); Schrijver (Citation2003); Williamson (Citation2019).
In the maximum flow problem (MF), in a given network with arc capacities, we want to send as much flow as possible from the given source s to the given sink t without violating the arc capacities. The problem was motivated by the conflict between East and West during the Cold War (Schrijver, Citation2002). Ford and Fulkerson (Citation1957) develop the first exact algorithm that searches for augmenting paths in the residual network. Their fundamental result, known as the max-flow/min-cut theorem states that the maximum flow passing from the source to the sink is equal to the total capacity of the arcs in a minimum cut, i.e., the network that indicates how much more flow is allowed in each arc., which is a subset of arcs of the smallest total capacity, the removal of which disconnects the source from the sink. The same result using the duality theory of LPs is given in Dantzig and Fulkerson (Citation1955). The famous results from graph theory such as Menger’s theorem, König-Egeváry theorem, or Hall’s theorem, follow from the max-flow/min-cut theorem (Ford & Fulkerson, Citation1962). The method of Ford and Fulkerson (Citation1957) is pseudo-polynomial when arc capacities are integral, however it may fail to find the optimal solution and need not terminate if some of the arc capacities are irrational (Ford & Fulkerson, Citation1962). An algorithm that overcomes this issue was independently discovered in the 1970s by Edmonds and Karp (Citation1972) and Dinic (Citation1970), see also Dinitz (Citation2006). Augmenting the flow along shortest paths (that is, along the paths with fewest edges) guarantees a polynomial-time complexity. Instead of augmenting the flow along a single augmenting path as in Edmonds and Karp (Citation1972), the algorithm of Dinic (Citation1970) finds all shortest augmenting paths in a single phase. Another stream of MF algorithms exploits the preflow idea of Karzanov (Citation1974) in which the vertices are overloaded with the excess flow (i.e., more incoming flow than the outgoing flow is allowed). Subsequent improvements are obtained in the following years. An important breakthrough is achieved by Goldberg & Tarjan with the introduction of push-relabel algorithms (Goldberg & Tarjan, Citation1988). A pseudoflow algorithm for the maximum flow is introduced by Hochbaum (Citation2008) and it is later improved in Hochbaum and Orlin (Citation2013). The recent implementation by Goldberg et al. (Citation2015) is competitive with the Boykov and Kolmogorov (Citation2004) method and the pseudoflow approach. Further historical details and a more complete list of references can be found in Ahuja, et al. (Citation1993); Dinitz (Citation2006); Goldberg and Tarjan (Citation2014); Williamson (Citation2019). Currently, the best strongly polynomial bounds are obtained by Orlin (Citation2013) and King et al. (Citation1994). However, new and improved MF algorithms continue to be discovered. The most recent trends use the idea of electrical flows for obtaining faster (exact or approximate) algorithms, see, e.g., Chapter 8 of Williamson (Citation2019).
In the minimum cost flow problem (MCF), for each arc of the graph, a cost is incurred per unit of flow that traverses it. The goal is to send units of a good that reside at one or more supply vertices to some other demand vertices, without violating the given arc capacities at minimum possible cost. Edmonds and Karp (Citation1972) introduce the scaling technique for the MCF. The technique is later improved by Orlin (Citation1993). The algorithms of Vygen (Citation2002) and Orlin (Citation1993) have the best-known strongly polynomial complexity bounds for the MCF. Kovács (Citation2015) provides a comprehensive literature overview and gives an experimental evaluation of MCF algorithms based on network-simplex, scaling or cycle-cancelling techniques. The MCF is treated in detail in many textbooks, Ahuja et al (Citation1993); Korte and Vygen (Citation2008); Williamson (Citation2019). One of the important results is the integrality of flow property: if all demands/supplies and arc capacities are integers, then there exists an optimal MCF solution with integer flow on each arc. The result follows from the totally unimodular property of the constraint matrix when the MCF is modelled as a linear program.
In the minimum cut problem (MC), one searches for a proper subset of vertices S of a given arc-capacitated graph, such that the total capacity of arcs leaving S is minimised. For directed graphs, the algorithm of Hao and Orlin (Citation1994) is based on MF calculations between chosen pairs/subsets of vertices and exploits the push-relabel ideas. For undirected graphs, the Gomory–Hu tree, which is a weighted tree that represents the minimum s-t cuts for every s-t pair in the graph, is introduced in Gomory and Hu (Citation1961). This tree is constructed after n – 1 MF computations, and a simpler procedure has been later given by Gusfield (Citation1990). The algorithm of Padberg and Rinaldi (Citation1990a) improves the ideas of Gomory and Hu (Citation1961) and is widely used within branch-and-cut schemes for solving the travelling salesperson problem (TSP) and related problems. The maximum adjacency ordering together with Fibonacci heaps is used in Nagamochi et al. (Citation1994). Randomised approaches can be found in Karger and Stein (Citation1996); Karger (Citation2000). The method of Karger (Citation2000) is de-randomised by Li (Citation2021). Practical performance of some of these algorithms is evaluated in Chekuri et al. (Citation1997); Jünger et al. (Citation2000). For additional and more recent references, see the book by Williamson (Citation2019).
The problems mentioned so far all belong to the class however most of the network optimisation problems that are relevant for practical applications are
-hard. We highlight two of them that serve as drivers for discovering new algorithms and methodologies that can be easily adapted to other difficult optimisation problems.
Given an undirected graph with non-negative edge costs, the Steiner tree problem in graphs (STP) asks for finding a subtree that interconnects a given set of vertices (referred to as terminals) at minimum cost. Two special cases can be solved in polynomial time: when all vertices are terminals (the minimum spanning tree problem), or when there are only two terminals (the shortest path problem). In general, however, the decision version of the STP is -complete (Karp, Citation1972b). Older surveys covering developments of first MIP formulations, Lagrangian relaxations, branch-and-bound methods and heuristics can be found in Maculan (Citation1987); Winter (Citation1987). The research on the STP was marked by polyhedral studies in the 1990s (Goemans, Citation1994; Chopra & Rao, Citation1994). Exact solution methods for the STP are based on a sophisticated combination of: reduction techniques (Gamrath et al., Citation2017; Rehfeldt & Koch, Citation2021), dual and primal heuristics (Pajor et al., Citation2018) embedded within branch-and-cut or branch-and-bound frameworks, see (Polzin, Citation2003; Vahdati Daneshmand, Citation2003; Polzin & Vahdati Daneshmand, Citation2009; Gamrath et al., Citation2017; Fischetti et al., Citation2017a). Currently best approximation ratio for the STP is 1.39 (Goemans et al., Citation2012). A comprehensive survey of the results obtained in the last three decades is given by Ljubić (Citation2021). State-of-the-art computational techniques for the STP are due to Rehfeldt (Citation2021).
The Travelling salesperson problem (TSP) aims at finding the answer to the following question: If a travelling salesperson wishes to visit all n cities from a given list exactly once, and then return to the home city, what is the cheapest route they need to take? For the history of the problem, see Applegate et al. (Citation2011) and the book by Cook (Citation2011). Since 1954, when Dantzig et al. (Citation1954) found a provably optimal solution for a 49-city problem instance, many important improvements in the development of exact methods have been achievedFootnote19. Facet-defining inequalities are investigated in Padberg and Rinaldi (Citation1990b); Jünger et al. (Citation1995). MIP formulations, including the famous subtour-elimination constraints model by Dantzig et al. (Citation1954), are compared in Padberg and Sung (Citation1991). Branch-and-cut methods are developed in Applegate et al. (Citation2011); Jünger et al. (Citation1995); Padberg and Rinaldi (Citation1991). For the most recent overview on approximation algorithms for the TSP see Traub (Citation2020). Helsgaun (Citation2000)Footnote20 provides an efficient implementation of the k-opt heuristic of Lin and Kernighan (Citation1973). Cook et al. (Citation2021) extend the algorithm of Helsgaun (Citation2000) to deal with additional constraints in routing applications and win the Amazon Last Mile Routing Challenge in 2021. The TSP solver ConcordeFootnote21 (Applegate et al., Citation2011) incorporates best algorithmic ideas from the past 60 years of research on the topic. By combining techniques of Helsgaun (Citation2000) and Applegate et al. (Citation2011), instances with millions of vertices can be solved to within 1% of optimality, see e.g., TSP solutions on graphs with up to 1.33 billion of verticesFootnote22.
2.13. HeuristicsFootnote23
Etymologically meaning to find/discover, heuristics make use of previous experience and intuition to solve a problem. A heuristic algorithm is designed to solve a problem in a shorter time than exact methods, by using different techniques ranging from simple greedy rules to complex structures, which could be dependent on the problem characteristics; however it does not guarantee to find the optimal solution (§2.4; §2.9). Heuristics have been used in the operational research area extensively with respect to the applications (see, for example, §3.12, §3.14, §3.15, and §3.32). In this subsection, we review the methods employed in the development of heuristics.
Classifications and strategies provided in the literature guide us for the methods employed in heuristics. Below we provide a thorough classification and explain briefly the basic methods used under each class.
Induction, being the simplest method to be applied with an analogy to the mathematical induction, is to solve the original complex problem by extending the results and insights obtained from small and simpler versions of the problem (Silver et al., Citation1980; Silver, Citation2004; Laguna & Martí Citation2013).
Restriction methods primarily focus on explicitly eliminating some parts of the solution space so that the problem will be solved given a restricted set of solutions (Silver et al., Citation1980; Zanakis et al., Citation1989; Silver, Citation2004; Laguna & Martí Citation2013). One way of doing this is to identify common attributes of the optimal solution and search among the solutions having these attributes only (Glover, Citation1977). Another restriction can be applied by eliminating infeasible solutions considering a combination of decision variables which dictates incompatible values. Beam Search (Morton & Pentico, Citation1993) is a good example of this class of heuristics which works with a truncated tree structure using strategies similar to a branch-and-bound algorithm (§2.4). The trimming of the tree is utilised by a parameter called beam width to indicate how many nodes to have at every level of the tree.
Heuristics using decomposition/partitioning method employ different approaches to divide the problem into smaller and tractable parts, solve these parts separately and combine their solutions to give the solution to the original problem (Foulds, Citation1983; Zanakis et al., Citation1989; Silver, Citation2004; Laguna & Martí Citation2013). The methods used to divide and then combine the solutions are usually dictated by the nature of the problem. For example, Hierarchical Planning proposed by Hax and Meal (Citation1973) considers the organisational level breakdown and the output of one decomposed problem becomes the input for the other. Rolling horizon also falls under this category (Stadtler, Citation2003). A problem with a sequence of decisions that span a long planning horizon is solved by dividing the planning horizon into smaller planning intervals. The problem with these small planning intervals is solved continually by fixing the decisions for the first time period and moving into the next time period to solve the next problem. Another approach takes the characteristics of the input data into account and divides the problem such that each part includes only tractable amount of data. For example, data showing clusters of geographically close customers is suitable for this type of partitioning. The decomposed problems are solved independently, and their solutions are combined with a certain rule. Divide and Conquer algorithm heuristically clusters vertices on a given graph, generates a smaller graph for each cluster and solves the original problem for each cluster independently (Akhmedov et al., Citation2016). Decomposition can be made based on an element of the problem, for example solving a logistics problem after dividing it into parts per vehicle. Other decomposition approaches benefit from the structure of the mathematical model developed for the problem. Examples of this sort are Lagrangian Relaxation (Fisher, Citation1981), in which complicating constraints are lifted to the objective function with a penalty, and Benders Decomposition (Benders, Citation1962; Rahmaniani et al., Citation2017), in which once complicating variables are fixed, the remaining problem can be divided into problems to be solved independently.
Approximation methods focus on the mathematical models and utilise different strategies to make the problem tractable which results in a reduced size of the problem (Silver et al., Citation1980; Silver, Citation2004). One strategy widely used is the aggregation over variables or stages. Another common strategy is to modify the variables, the objective function or the constraints of the mathematical model in different ways, such as converting discrete variables into continuous variables, using a linear objective function instead of the non-linear objective function,, linearising nonlinear constraints, and either eliminating or weakening some of the constraints (Glover, Citation1977). Kernel Search (Angelelli et al., Citation2010), which combines relaxation with decomposition over the decision variables, demonstrates that a heuristic may use more than one class of methods in its design.
Constructive heuristics start from an empty solution and build a complete solution by adding an element of the problem following a rule at every step, such as the nearest neighbour algorithm (Bellmore & Nemhauser, Citation1968) for the travelling salesman problem. Usually constructive heuristics are of greedy nature by making the decision for local optimum in every step. These algorithms can be enhanced by adding a look-ahead mechanism that is by estimating the future effects of a decision rather than just the current effect to avoid pitfalls of being greedy.
Improvement heuristics start with a complete solution and improve it by modifying one or more elements of the solution in every iteration until a predetermined stopping condition is achieved. Improvement heuristics in their simplest form utilise a local search which is defined over a neighbourhood structure to express how the moves are performed from one iteration to the next. k-opt is an example of this sort which replaces k elements of a solution with another set of k elements in every step if it is beneficial (Lin & Kernighan, Citation1973). The parameter k determines the size of the local search and implicitly applies the restriction method discussed above. A neighbourhood is defined by a set of solutions which are reachable form the current solution. A local search is performed by moving from the current solution to another solution in the neighbourhood of it (next solution). Selection of the next solution is done by accepting either the one among random choices that improves the objective function value first (random descent if it is a minimisation problem) or the one resulting in the best objective function, i.e., the local optimum, with respect to that neighbourhood (steepest descent for a minimisation problem). This simple structure focuses on the local information (exploitation of the accumulated search experience) and is known as intensification (Glover, Citation1990). While it will be useful if the structure of the problem is appropriate, it may result in not good enough solutions otherwise. Hence, the improvement heuristic will benefit if it can explore other parts of the solution space, which is known as diversification (Glover, Citation1990). Two immediate strategies to be employed are either to start the search from different initial solutions and choose among the final solutions obtained (multi-start algorithms) or to allow moving to worse solutions if this direction will provide a better path for the future selections (hill-climbing strategy for a minimisation problem).
Even though metaheuristics (Glover, Citation1986) are improvement methods, since they advance notably, considering them as a separate class is worthwhile. Metaheuristics utilise a local search together with intensification and diversification mechanisms and aim at eliminating the problem-dependent and domain-specific nature of other heuristics. Simulated Annealing (Kirkpatrick et al., Citation1983) is one of the most popular metaheuristics which uses a single solution in its local search with a random descent and utilises hill-climbing strategy for diversification. Tabu Search (Glover, Citation1986) is an example of deterministic metaheuristic working with a single solution throughout the search. It explicitly uses history of search in both intensification and diversification mechanisms. Genetic Algorithm (Holland, Citation1975) is another popular metaheuristic comprising of random components for intensification and diversification but working with a set of solutions during the search. Variable Neighbourhood Search (Hansen & Mladenović Citation1999) is an excellent example of a design in which diversification is provided by systematically changing neighbourhood structures.
Matheuristics are heuristic approaches that exploit exact approaches (and their complementary strengths) without guaranteeing to find the optimal solutions. While matheuristics are designed with different strategies, we summarise the most widely used three strategies.
Those matheuristics which are originally exact approaches yet are implemented heuristically are overlapping with what is described under restriction and decomposition/partitioning methods in this subsection. Apart from those overlapping works, in the context of dynamic programming, the corridor method constructs neighbourhoods as corridors around the state trajectory of the incumbent solution (Sniedovich & Viß Citation2006). Defined (preferably large) neighbourhoods can be searched with exact approaches. Dynasearch algorithm uses dynamic programming to search an exponential size neighbourhood stemming from compound moves in polynomial time (Congram et al., Citation2002).
Another group of matheuristics benefits from multiple exact models collectively within a heuristic mechanism. Tarhan and Oğuz (Citation2022) decompose the scheduling planning horizon into a set of buckets, solve a time-indexed model to generate a restricted model for each bucket and solve the restricted models sequentially to construct a complete feasible solution. Della Croce et al. (Citation2014) solve a restricted time-indexed model and a model with positional variables iteratively to search the neighbourhood of the incumbent solution. Solyalı and Süral (Citation2022) propose a matheuristic algorithm by sequentially solving different mixed integer linear programs.
Third strategy is to incorporate exact models into different components of the heuristics. This approach may have several variations. First version includes those matheuristics having a constant interaction between heuristics and mathematical programming models. Manerba and Mansini (Citation2014) use the Variable Neighbourhood Search to decide which variables to fix in their fix-and-optimise algorithm. Archetti et al. (Citation2015) use different integer programming models in both the intensification and the diversification phases of their Tabu Search algorithm to improve the objective function value and/or restore feasibility. Adouani et al. (Citation2022) apply exact and heuristic approaches respectively to change the value of so-called upper and lower level variables in the neighbourhood search. Other variations include matheuristics that sequentially call heuristics and the models; e.g., exact approaches following heuristics for post-optimisation (Pillac et al., Citation2013), exact approaches generating the initial solutions from heuristics (Macrina et al., Citation2019), exact approaches supporting heuristics at their both beginning and end to provide an initial solution and to improve the final solution, respectively (Archetti et al., Citation2017).
We refer the reader for a detailed overview of heuristics to the works of Müller-Merbach (Citation1981) and Silver (Citation2004), of metaheuristics to the work of Blum and Roli (Citation2003), and of matheuristics to the work of Boschetti and Maniezzo (Citation2022). The most recent book by Martí et al. (Citation2018) on heuristics is another invaluable resource. Finally, the progress of metaheuristics is discussed by Swan et al. (Citation2022). This work provides a critical analysis of the current state of metaheuristics by focusing on cultural and technical barriers.
For the future studies in the area of heuristics, new techniques and powerful mechanisms could be derived from practical problems to address complex systems of today’s world. Another contribution can be to explore and integrate applications of artificial intelligence to deal with large scale data. Matheuristics are especially often applied for single-objective problems and accordingly, their implementation for multi-objective optimisation is a promising future research direction. For practical purposes, such as to be used within commercial solvers, it is also worthwhile to develop generic matheuristic frameworks that can address specific classes of optimisation problems. Parallel computing (i.e., parallel solution of mathematical models) and integration with machine learning (to, for example, manage the interaction with mathematical models and heuristics) are some other invaluable research directions for matheuristics.
2.14. Linear programmingFootnote24
Linear programming (LP) offers a framework for modelling the problem of extremising a linear economic function under a set of linear inequality constraints. Solving such models can be approached algebraically as well as geometrically: finding an extreme point of a polyhedron at which a given economic function is maximised or minimised. Since its inception in 1947 by Dantzig, the simplex method has been the standard algorithm for solving linear programs. A precursor, unbeknownst then to Dantzig, was a set of ideas exposed by Fourier in 1826 and 1827, and partly rediscovered by Motzkin in 1936, hence the now famous Fourier-Motzkin elimination method (Dantzig, Citation1963, p. 84–85; Schrijver, Citation1998, p. 155–157) that solves a set of linear inequalities by sequentially eliminating variables, at the cost though of exponentially increasing the number of constraints.
But since the 1930s, several researchers had been making a headway. Working independently from one another, they had grappled with specific problems: balancing the distribution of revenue (output) with the distribution of outlays (input) in the economic activity of a whole country (Leontief, Citation1936); general economic equilibrium (von Neumann, Citation1945); production planning (Kantorovich, Citation1960); transportation planning (Hitchcock, Citation1941; Kantorovitch, Citation1958; Koopmans, Citation1949); deployment planning and logistics (Dantzig, Citation1991). Dantzig (Citation1982) said he had been “fascinated” by Leontief’s interindustry input-output model and wanted to generalise it by considering many alternative activities. He also credits von Neumann with the duality theory of linear programming, which parallels the work the latter did with Morgenstern on the theory of games.
A linear program can always be expressed (in standard form) as {minimise cx, subject to }, where x is an n-vector of decision variables, A is an m by n constraint matrix that somehow weighs the variables, b is an m-vector that puts limits on the possible values of x, and cx is an economic function, called the objective function, that measures the quality of a given solution x. It is customary to assume, without loss of generality, that matrix A is of rank m and that m is smaller than n (see, e.g., Papadimitriou & Steiglitz, Citation1982). Since
one can minimise a “cost” as well maximise a “profit”. Linear programs come in pairs: {minimise cx, subject to
} and {maximise yb, subject to
}. The former is called the primal, the latter is the dual. The duality theorem of linear programming has been proved to be equivalent to Farkas’s lemma that was published in 1902 (see, e.g., Dantzig, Citation1963). This implies that finding an optimal solution to a linear program is equivalent to finding a feasible solution to a system made of the primal and dual constraints with the additional inequality
With the introduction of duality, we now have three algorithms for solving LPs: the (primal) simplex method that maintains (primal) feasibility throughout and tries to achieve optimality; the dual simplex method that maintains dual feasibility and moves toward primal feasibility; and the primal-dual algorithm that starts with a feasible solution to the dual and keeps improving it by solving an associated restricted primal. The primal-dual algorithm is the favoured simplex tool for solving most network flow problems, for instance, the famous algorithm of Ford and Fulkerson (Citation1962) for maximum flow. The dual simplex method together with column generation may come in handy when the number of constraints is huge in comparison with the number of variables (Desaulniers et al., Citation2006).
A set of linear inequalities defines a convex polyhedron P. Therefore, since the objective function is linear, there are only three possibilities: no feasible solution (if and only if P is empty); exactly one optimal solution, located at some extreme point of P; infinitely many optimal solutions, located at the points of a face of P of dimension 1 or more, including its extreme points. The simplex method moves sequentially along the edges of P from one extreme point to another. Algebraically, it moves from one set of m linearly independent columns, called a basis, to another. Each basis induces a basic solution defined by setting to zero all the n – m variables that do not correspond to its columns. A basic solution is feasible if all its components are non-negative. The move from one basis to another goes as follows: one column is dropped and replaced by a new one. This exchange, called a pivot, follows a set of rules for choosing the column that enters the basis and the one that exits. It is such that, barring degeneracy, the objective function decreases strictly in value at each pivot.
Degeneracy is rooted in the fact that an extreme point of P may correspond to several bases. The algebraic expression of this defectiveness is a basic feasible solution with more than n – m zero components. This occurs when the number of hyperplanes intersecting at an extreme point is greater than the minimum necessary to define it. (Think of the tip of a pyramid that has a square base.) Pivoting in the presence of degeneracy may cause the simplex method to cycle. Several schemes have been devised to avoid cycling by carefully choosing the entering and leaving columns. Bland’s rule, considered as both simple and elegant, has been widely adopted (Bland, Citation1977). As for finding an initial solution, if the problem is feasible, this can be done by introducing artificial non-negative variables that one then tries to drive down to zero.
Evidence shows that the simplex method is very fast in practice (see Shamir, Citation1987), but Klee and Minty (Citation1972) designed an LP for which it must visit each one of the or so extreme points, which proved that it is not “good” in the sense of Edmonds (Citation1965b). A “good algorithm” having been defined as one for which the worst-case complexity is polynomial with respect to the dimension of any instance, an important open question became “Is LP in
?”. Khachiyan answered by the affirmative in 1979 when he adapted to the specific case of linear programming a known approach in convex optimisation that had been contributed to by several Soviet mathematicians (see Gács & Lovász, Citation1981; Bland et al., Citation1981; Chvátal, Citation1983). The argument goes as follows: given an LP, start with an ellipsoid that is big enough to contain the set S of feasible solutions if it is not empty. At each iteration, check whether the centre of the ellipsoid is a solution. If it is not, there is a hyperplane H separating it from S. Cut the ellipsoid in half by the hyperplane parallel to H that goes through the centre. Then determine the smallest ellipsoid that contains the half-ellipsoid where one is trying to locate S, and repeat. Stop either with a solution (located at a centre) or with an ellipsoid that is too small to contain S. This is an important theoretical result (see Grötschel et al., Citation1981), but with very little practical use as far as solving actual LPs goes.
The same cannot be said, however, of the interior point algorithm introduced by Karmarkar (Citation1984), in which the moves happen strictly inside the set of feasible solutions instead of taking place on the envelope. Indeed, Karmarkar’s algorithm is polynomial and often competitive with the simplex method. It assumes a canonical form for linear programming in which the variables are constrained to and
it further assumes, without loss of generality, that the point
is feasible and that the minimum value of the objective function cx is zero. As it seeks to stay away from the envelope of the solution polyhedron, the algorithm builds a sequence of strictly feasible solutions, i.e., that have strictly positive components, and makes a repetitive use of e / n. The gist of the algorithm is the following: given a strictly feasible solution xk , one can define a simple bijective scaling function f that maps S onto itself so that xk is mapped onto e / n, away from the envelope, and so that f has the following property: if, for any variable x, f(x) is strictly feasible in the “new” space, then so too is x in the initial space. In the “new” space, the gradient of the transformed objective function is projected on the null space of the transformed matrix A augmented of a row of 1s, to account for S. If p denotes that projection, one then moves in the direction of – p, i.e., in the direction of the steepest descent, while feasibility is maintained. The algorithm stops at a point
before reaching the envelope of the feasible region. That point is transformed to
by
and this is repeated with a new scaling bijection (see Strang, Citation1987; Goldfarb & Todd, Citation1989; Fang & Puthenpura, Citation1993; Winston & Venkataramanan, Citation2003). Important links between Karmarkar’s algorithm and the ellipsoid method have been pointed out (Todd, Citation1988; Ye, Citation1987).
Integer Linear Programming (ILP), i.e., linear programs in which the variables are restricted to being integer-valued, is arguably the most challenging and beautiful expression of LP. Unfortunately, whereas LP is in ILP is not, unless
(Karp, Citation1972a). However, there are classes of LPs for which, if there exists a solution at all, an integer solution is guaranteed without having to make it a requirement. This is the case, e.g., of most network flow models. And there are classes of ILPs for which any extreme point of the polyhedron of integer solutions can be obtained by “shaving off” non-integer extreme points of the outer polyhedron of real-valued solutions with hyperplanes the number of which is bounded by a polynomial in the dimension of the instance (Edmonds, Citation1965a, Citation1965b; Grötschel et al., Citation1981, Citation1988; Cook et al., Citation1998). Furthermore, tackling
-complete problems has benefited greatly from this approach (see, e.g., Dantzig et al., Citation1954; Applegate et al., Citation2007).
2.15. Mixed-integer programmingFootnote25
Mixed-integer programming (MIP) is an -hard generalisation of linear programming (LP; §2.14), in which some or all of the variables are required to take whole-number values. Way back in the late 1950s, it was already realised that a wide variety of important practical problems could be modelled as MIPs (Dantzig, Citation1960; Markowitz & Manne, Citation1957). Of course, at the time, there were no good algorithms, or indeed computers, to enable one to solve MIPs from real-life applications. Since then, however, dramatic progress has been made in theory, algorithms and software. Indeed, it is now possible to solve many real-life MIPs to proven optimality (or at least near-optimality) on a laptop. In this subsection, we review the main developments in this area. For more details, we refer the reader to the textbooks by Chen et al. (Citation2011) and Conforti et al. (Citation2014).
In 1958, Gomory (Citation1958) developed the first finitely-convergent exact algorithm for pure IPs (i.e., MIPs in which all variables are restricted to whole-number values). His method was based on cutting planes, i.e., additional linear constraints which cut off fractional LP solutions. Shortly after, Land and Doig (Citation1960) invented the branch-and-bound method, in which a sequence of LP relaxations is embedded within a tree structure. A few years later, Balas (Citation1965) devised a simpler branch-and-bound algorithm, for pure 0-1 LPs, which did not rely on LPs at all.
In the 1960s and 1970s, researchers invested considerable effort into deriving “deep” cutting planes. This led to the discovery of Gomory mixed-integer cuts (Gomory, Citation1960), corner polyhedra (Gomory, Citation1969), intersection cuts (Balas, Citation1971), Chvátal-Gomory cuts (Chvátal, Citation1973), disjunctive cuts (Balas, Citation1979; Owen, Citation1973), and cuts derived from a study of the so-called knapsack polytope (Balas, Citation1975; Wolsey, Citation1975). These topics are still being studied to this day (see, e.g., Conforti et al., Citation2014; Cornuéjols, Citation2008).
In 1980, Balas and Martin (Citation1980) developed a general-purpose heuristic for 0-1 LPs, called “pivot-and-complement”. This initiated a line of work on so-called “primal heuristics”, which also continues to this day. We will mention this again below.
A major step forward occurred in 1983, with the publication of an award-winning paper by Crowder et al. (Citation1983). Basically, they did the following before running branch-and-bound: (i) “pre-process” the formulation in order to make the LP relaxation stronger, (ii) automatically generate knapsack cuts to further improve the relaxation, (iii) run a simple primal heuristic in order to obtain a feasible integer solution early on, and (iv) permanently fix some variables to 0 or 1 based on reduced-cost arguments. In this way, they were able to solve ten real-life 0-1 LPs that had previously been regarded as unsolvable. The largest of these instances had 2756 variables and 756 constraints, a phenomenal achievement at the time. The approach of Crowder et al. (Citation1983) is now called “cut-and-branch”.
Around the same time, there were several major theoretical advances, such as the proof of the “polynomial equivalence of separation and optimisation” (Grötschel et al., Citation1981) and the development of a polynomial-time algorithm for pure IPs with a fixed number of variables (Lenstra, Citation1983). For details, we recommend Schrijver (Citation1986).
Coming back to a more practical perspective, several improvements were made to the basic cut-and-branch scheme in the 1980s and 1990s. For brevity, we just mention some highlights. Several authors proposed more powerful pre-processing procedures (e.g., Dietrich et al., Citation1993; Hoffman & Padberg, Citation1991; Savelsbergh, Citation1994). Gu et al. (Citation1998) developed more effective algorithms for generating knapsack cuts. Researchers also began to study cutting planes for mixed 0-1 LPs (e.g., Padberg et al., Citation1984; Van Roy & Wolsey, Citation1986), which eventually led to effective cut-and-branch algorithms for such problems (e.g., Van Roy & Wolsey, Citation1987).
The next milestone was the invention of branch-and-cut by Padberg and Rinaldi (Citation1987). In branch-and-cut, one has the option of generating cutting planes at any node of the branch-and-bound tree, rather than only at the root node (as in cut-and-branch). Although this is a fairly simple idea, Padberg and Rinaldi added several ingredients to turn it into a highly effective tool. For example, (i) care is taken to ensure that cutting planes generated at one node of the tree remain valid at all other nodes, (ii) whenever a cutting plane is generated, it is stored in a so-called “cut pool”, (iii) when visiting a new node of the tree, one can check the cut pool to see if it contains any useful cuts, (iv) one uses a heuristic rule to decide when to stop cutting and start branching at any given node.
Several developments in the 1990s are also worth mentioning. First, there were some interesting works on methods to construct “hierarchies” of relaxations for 0-1 and mixed 0-1 LPs (e.g., Balas et al., Citation1993; Lovász & Schrijver, Citation1991; Sherali & Adams, Citation1990). The method in Balas et al. (Citation1993), called lift-and-project, turned out to be useful when embedded within a branch-and-cut algorithm for mixed 0-1 LPs (Balas et al., Citation1996a). Shortly after that, Balas et al. (Citation1996b) obtained good results using Gomory mixed-integer cuts instead. This last result was a big surprise: up to then, researchers had thought that Gomory cuts were of theoretical interest only.
By the end of the 1990s, researchers were routinely solving real-life MIPs with thousands of variables and hundreds of constraints to proven optimality. Of course, MIP in general is -hard, so one could not expect to solve all instances so quickly. Indeed, Cornuéjols and Dawande (Citation1999) found a family of 0-1 LPs, called “market split” problems, which proved to be especially challenging for branch-and-cut. This led to the development of a new class of specific algorithms called basis reduction methods, see, e.g., Aardal et al. (Citation2000).
In the period 2000-2010, there was a flurry of impressive works concerned with primal heuristics for MIP. For brevity, we mention just a few examples. Fischetti and Lodi (Citation2003) devised a method called local branching, which is essentially a form of neighbourhood search in which the neighbourhoods – being of exponential size – are searched by solving auxiliary MIPs. Shortly after, Danna et al. (Citation2005) presented relaxation-induced neighbourhood search or RINS, which solves a series of small MIPs to search for integer solutions that are “close” to the solution of the LP relaxation. Both local branching and RINS are improving heuristics, i.e., the neighbourhoods are defined with respect to a reference feasible solution to be improved. Remarkably, they solve auxiliary MIPs by simply calling a MIP solver in a black-box fashion (with work limits), thus witnessing the maturity of the field. In the same year of RINS, Fischetti et al. (Citation2005) introduced the feasibility pump, which is highly effective for MIPs where even finding a feasible solution is challenging.
The development of the branch-and-cut technology has been so impressive that many of the above-mentioned developments have been incorporated in software packages. This includes major commercial packages, such as CPLEX, Gurobi and FICO Xpress, and non-commercial ones that are free to academics, such as SCIP. We remark that this continual development in algorithms and software has been greatly enhanced by the creation and constant maintenance of MIPLIB, a library of MIP instances on which all new methods are now routinely tested (see Bixby et al., Citation1992; Gleixner et al., Citation2021).
We end this section by briefly mentioning three other areas of constant development. First, there has been great progress on decomposition approaches to MIPs that have special structure, with branch-and-price being a particularly effective method (e.g., Desaulniers et al., Citation2006). Second, there is also by now a substantial literature on stochastic MIPs (e.g., Küçükyavuz & Sen, Citation2017). Third, considerable effort has been made to extend the MIP algorithmic technology to cope with nonlinearities, leading to the blossoming field of mixed-integer nonlinear programming or MINLP (e.g., Lee & Leyffer, Citation2012). Particularly effective algorithms and software packages are now available for convex MINLP (e.g., Kronqvist et al., Citation2019), and one of its important special cases, mixed-integer second order cone programming (e.g., Benson & Sağlam, Citation2013).
2.16. Nonlinear programmingFootnote26
Nonlinear programming is a generalisation of linear programming (§2.14), in which the objective function or the constraints can be given by general nonlinear functions. Mathematically, a nonlinear programming problem is represented as
Here, denotes the feasible region, where,
and
denotes the objective function.
In comparison with linear programming, nonlinear programming problems have much more expressive power. As such, nonlinear programming problems naturally arise in almost every setting, ranging from investment planning to machine learning; from engineering to medicine; and from energy to sustainability (§3.14; §3.5; §3.19; §3.9; §3.11; §3.13).
In this subsection, we will give a brief overview of theory and algorithms. While we will not cover the modelling aspect, we will mention some classes of optimisation problems with desirable properties, which should imply that using an optimisation model from such classes would significantly increase the likelihood of solving it.
The difficulty of the generic optimization problem (P) is largely determined by the properties of the objective function and of the functions
that define the feasible region
Generally speaking, increasingly more restrictive assumptions on f and on
give rise to increasingly more structured optimisation problems with stronger and more desirable properties. For instance, the special case in which each of f and
is a linear function, referred to as linear programming (§2.14), is arguably the most structured class of optimization problems with very appealing theoretical properties, which lay the groundwork for several effective solution methods such as the simplex method (see, e.g., Dantzig, Citation1990) and interior-point methods (Karmarkar, Citation1984; Wright, Citation1997; Ye, Citation1997). In contrast, general nonlinear programming problems usually enjoy fewer desirable properties.
The class of convex optimisation problems is comprised of optimisation problems in which each of and
is a convex function, which implies that
is a convex set, and includes linear programming as a special case. Any optimisation problem that does not belong to this class is a nonconvex optimisation problem. On the other hand, (P) is called an unconstrained optimisation problem if
and a constrained optimisation problem otherwise.
A useful notion in nonlinear programming is that of local optimality. A point is said to be a local minimiser of (P) if there exists an open ball
of positive radius centred at
such that
is a minimiser of f over the potentially smaller feasible region
In contrast,
is a global minimiser of (P) if
is a minimiser of f over the entire feasible region
Note that a global minimiser is also a local minimiser.
We next briefly give an overview of optimality conditions for each aforementioned class of optimisation problems. We start with unconstrained optimisation problems in the one-dimensional setting (i.e., n = 1). If is a local minimiser of (P), then f should be neither decreasing nor increasing at
Assuming that f is a continuously differentiable function, we therefore obtain
This geometric interpretation carries over to the higher-dimensional setting (i.e.,
) by simply viewing a mutivariate function as a collection of one-dimensional functions along feasible directions at each
i.e., directions along which one can move starting from
and still remain in the feasible region. In the unconstrained case, every direction
is a feasible direction at every
Using the result from the one-dimensional case, if
is a local minimiser of (P), then the partial derivatives of f with respect to each variable should be zero, or equivalently, that
where
is the gradient of f. Such a point is called a stationary point.
For the special case of convex unconstrained optimisation problems, the convexity of the objective function implies that the aforementioned necessary conditions are also sufficient, i.e., a point is a local minimiser if and only if it is a stationary point. Furthermore, for convex functions, every local minimiser is, in fact, a global minimiser. Therefore, we obtain the equivalence between global minimisers and stationary points. On the other hand, for a nonconvex optimisation problem, there may be stationary points that may not correspond to a local minimiser of (P) (e.g., if
then
is a stationary point but not a local minimiser). As illustrated by this example, the complete characterisation of global optimality does not carry over from convex optimisation to nonconvex optimisation, even in the unconstrained setting.
For constrained optimisation problems, we first consider the convex optimisation case. By the convexity of the feasible region for any
the set of all feasible directions is given by
where
Arguing similarly to the unconstrained case and using the convexity of f, a point
is a global minimiser of (P) if and only if f does not decrease along any feasible direction, i.e., if and only if
for all
Therefore, as in the unconstrained case, we once again have the equivalence between local and global minimisers.
Next, consider a nonconvex constrained optimisation problem. If the feasible region is a convex set but f is a nonconvex function, a similar argument as in the convex case gives rise to the following necessary condition: If
is a local minimiser of (P), then
for all
As in the unconstrained case, simple examples show that this condition is no longer sufficient for local optimality. If, on the other hand,
is a nonconvex set, then we instead rely on a more general notion of tangent directions to the feasible region
at
Therefore, if
is a local minimiser, then
for every tangent direction
to the feasible region
at
In general, the set of such tangent directions may not be easy to characterise. Under certain additional assumptions about the geometry of the feasible region
referred to as constraint qualifications (Bazaraa et al., Citation2005, Chapter 5), explicit necessary optimality conditions can be derived.
Having reviewed optimality conditions, we finally give a brief overview of methods for solving optimisation problems. Nonlinear optimisation algorithms are generally iterative in nature, i.e., they generate a sequence of points that satisfies certain properties. For instance, the sequence may either converge to a local or global minimiser of an optimisation problem, or may simply have a limit point that satisfies the necessary conditions for local optimality. As illustrated by the discussion on optimality conditions, one can establish considerably weaker properties for nonconvex optimisation problems in comparison with convex optimisation problems. In fact, most classes of nonconvex optimisation problems are provably difficult in a formal complexity sense, even when restricted to minimising a quadratic function over a polyhedron (Murty & Kabadi, Citation1987; Pardalos & Vavasis, Citation1991). As such, it would not be reasonable to expect an algorithm to solve every optimisation problem to global optimality in a reasonable amount of time.
Therefore, different performance metrics are employed for assessing algorithms for different classes of optimisation problems. While, for convex optimisation problems, one usually expects a “good” algorithm to compute a global optimal solution, an algorithm for a nonconvex optimisation problem could be deemed “effective” if it always converges to a local (rather than a global) optimal solution.
In the unconstrained case, given an iterate the main idea is to identify a feasible direction
along which the objective function will decrease. Such a direction
called a descent direction, would necessarily satisfy
Then, a step size in this direction is determined according to certain criteria that would guarantee a decrease in the objective function. Therefore, this family if algorithms is referred to as gradient descent methods and includes steepest descent as a special case (i.e., the case where
). Under mild assumptions, this class of algorithms converges to a stationary point of f. Recall that such a point is a global minimiser if f is a convex function. Other methods in this class are Newton methods, conjugate gradient methods, and quasi-Newton methods, each of which generates iterates that converge to a stationary point under appropriate assumptions.
Considering the constrained case, while general convex optimisation problems do not retain all desirable properties of the simpler class of linear programming problems, they still have a sufficiently rich structure that pave the way for provably efficient solution algorithms. In fact, every convex optimisation problem, in theory, can be solved to global optimality by the ellipsoid method (Yudin & Nemirovskii, Citation1976; Shor, Citation1977) or by interior-point methods in polynomial time (Nesterov & Nemirovskii, Citation1994). Furthermore, a variety of highly effective commercial and non-commercial solvers are available for solving several classes of convex optimisation problems such as linear programming, second-order cone programming, and semidefinite programming that frequently arises in applications (see, e.g., https://neos-server.org/neos/solvers/index.html).
For the nonconvex constrained case, one approach is based on approximating a constrained optimisation problem by a sequence of unconstrained optimisation problems by either using a penalty function, based on penalising violation of constraints (penalty methods), or using a barrier function, based on preventing the violation of constraints by keeping the iterates strictly in the relative interior of the feasible region (barrier methods). Other methods include Augmented Lagrangian methods, based on combining Lagrangian relaxation with penalty methods, and Sequential Quadratic Programming methods, based on approximating the optimisation problem by a quadratic programming problem.
Finally, various real-life applications in machine learning and data science give rise to very large-scale problems that are beyond the capability of current solvers and computing platforms. For such problems, there exist a variety of heuristic optimisation methods that can be employed to find a good solution in a reasonable amount of time (§2.13). However, in contrast with exact methods, such methods usually do not provide any guarantees on the quality of the solution.
Nonlinear optimisation is a very active area of research. The reader is referred to excellent textbooks for further information (e.g., Fiacco & McCormick, Citation1968; Mangasarian, Citation1994; Bazaraa et al., Citation2005; Nocedal & Wright, Citation2006; Bertsekas, Citation2016; Luenberger & Ye, Citation2016).
2.17. QueueingFootnote27
Queueing systems arise in many real life applications including production, service systems, finance, logistics and transportation. As mentioned in Stidham (Citation2002), many queueing models have been studied even before the introduction of Operational Research in the 1950s. We provide a brief overview of methodologies used in queueing systems analysis. We start with exact methods and then continue with approximations and asymptotic analysis.
The classical analysis of queueing systems involved modelling the single stage Markovian queues as birth-death processes and computing their steady state performances using Markov chain theory. These earlier theoretical contributions were initially summarised in Feller’s two volume books Feller (Citation1957a, Citation1957b), then in classical textbooks such as Cooper (Citation1972), Gross and Harris (Citation1974) and Kleinrock’s two volumes Kleinrock (Citation1975a, Citation1975b), and more recently in Gautam (Citation2012), Harchol-Balter (Citation2013), and many other books. Takács (Citation1962) focused on using transforms and generating functions for steady state and transient behaviour of queueing systems. In the early days, transforms and generating functions were considered to be exact expressions but one had to invert these generating functions in order to obtain the actual performance measures which is in general difficult. Marcel Neuts was the first one who approached this inversion problem algorithmically. In his 1981 book, Neuts (Citation1981) focused on queues that generalise the G/M/1 structure, whereas in his second book, Neuts (Citation1989) generalised the structure of the M/G/1 queue. The main idea in these books is to approximate the non-exponential distributions with a phase type distribution (convolution and mixture of exponentials) which yields a continuous time Markov chain model for the original system that could be analysed, at least numerically. This line of research resulted in many contributions on the so-called matrix-geometric methods (see also Latouche & Ramaswami, Citation1999). Arguably the most well known result in queueing theory is Little’s law ( or its generalisation
) which provides a relationship between the mean steady state number of customers and the mean sojourn time in a system. For a thorough survey of the Little’s result and its extensions, the reader is referred to Whitt (Citation1991). There are numerous proofs of Little’s law but El-Taha and Stidham (Citation1999) provide an elegant sample path proof. On the other hand, Bertsimas and Nakazato (Citation1995) relate the steady-state distribution of the number in the system (or in the queue) to the steady state distribution of the time spent in the system (or in the queue) in a queueing system under FIFO (First In First Out).
While there has been a lot of interest in stationary queues, Massey’s, Citation1981 dissertation Massey (Citation1981) drew attention to the analysis of non-stationary queues (i.e., queues with time dependent arrival and service processes). Massey’s dissertation started with the analysis of M(t)/M(t)/1 queue and then extended to other non-stationary Markovian systems. Many subsequent papers, such as Massey and Whitt (Citation1998), focused on queueing models with time-dependent arrival rates, especially infinite-server “offered-load” models which describe the load that would be on the system if there were no limit to the available resources. The main idea of these papers is to provide algorithms (approximations) to solve the Poisson equation. On the other hand, Bertsimas and Mourtzinou (Citation1997) derived a set of transient distributional laws that relate the number of customers in the system (queue) at time t to the system (waiting) time of a customer that arrived to the system (queue) at time t.
Networks of queues have been of interest to researchers since 1950s. Jackson (Citation1957) was the first one to observe that joint steady state distribution of the number of customers at the nodes of a network of Markovian queues with single server (at each node) is the product of individual distribution of M/M/1 queues. Jackson (Citation1963) generalised this result to networks of queues with multiple servers at the nodes. Gordon and Newell (Citation1967) discovered that the stationary distribution again has a product form in closed Markovian networks but in this case a normalisation constant is required. Baskett et al. (Citation1975) proved that the product form is insensitive to the service time distribution if the service discipline satisfies certain assumptions. This and other insensitivity results in networks were also considered by Kelly (Citation1979) and Serfozo (Citation1999) which also has results on other networks such as those with blocking and rerouting. Daduna (Citation2001) focused on obtaining explicit expressions for the steady behaviour of discrete time queueing networks and gave a moderately positive answer to the question of whether there can be a product form calculus in discrete time. In recent years, a number of models involving different compatibilities between jobs and servers in queueing systems, or between agents and resources in matching systems, have been studied, and, under Markovian assumptions and appropriate stability conditions, the stationary distributions were again shown to have product forms (see Gardner & Righter, Citation2020, and the references therein). Baccelli et al. (Citation1992) modelled a class of networks using the so-called (max,+) linear systems. In their pioneering work, using (max,+) algebra techniques, Baccelli and Schmidt (Citation1996) derived Taylor series expansions for the mean waiting times in Poisson driven queueing networks that belong to the class of (max,+) linear systems. Even though these expansions are sometimes referred to as light traffic approximations, in some cases all coefficients of the series expansion can be computed yielding an exact expression. These results were generalised to transient performance measures by Baccelli et al. (Citation1997) and joint characteristics by Ayhan and Baccelli (Citation2001).
Exact analysis of general queueing systems is often challenging, making the characterisation of performance measures difficult. Thus, asymptotic analyses are commonly carried out via various approximation methods. We next provide an overview of such methods.
Many of the earlier works on the asymptotic analysis of queueing systems focused on heavy traffic and many server approximations for single stage queues. In his pioneering work, Kingman (Citation1961, Citation1962, Citation1965) have asymptotically characterised the waiting time distribution for the single server queue with general interarrival and service time distributions under heavy traffic conditions (i.e., when the traffic intensity ). Several others have developed heavy traffic approximations for the G/G/s queue, where a sequence of systems with fixed number of servers and traffic intensities
approaching one are considered (see, for example, Köllerström, Citation1974). In these approximations, the sequence of normalised (i.e., scaled) queue length processes converge to a reflected Brownian motion with negative drift (see Whitt, Citation2002), and the associated sequence of scaled stationary queue-length distributions (i.e., the stationary distribution of the limiting diffusion process) converges to an exponential distribution. We refer the reader to Harrison (Citation1985) for a detailed technical treatment of heavy traffic limits and diffusion approximations. Asymptotic analysis was also considered for multi-class and multi-stage queueing networks. Defining the stability region of these networks using fluid limit analysis was considered in Chen (Citation1995); Dai (Citation1995); Dai and Meyn (Citation1995). Many of the works that considered heavy traffic analysis of multi-class queueing networks focus on achieving the so-called state space collapse. Bramson (Citation1998) demonstrated the state space collapse for first-in first-out queueing networks of Kelly type and head-of-the-line proportional processor sharing queueing networks. His framework has been used to prove state space collapse results in several other works including Stolyar (Citation2004) and Mandelbaum and Stolyar (Citation2004). For a more comprehensive review of heavy traffic analysis of multi-class queueing networks, we refer the reader to Chen and Yao (Citation2001).
Many-server approximations were also considered for asymptotic analyses of queueing systems. In these approximations, the traffic intensity can be kept constant while letting the arrival rate and the number of servers go to infinity. Iglehart (Citation1965) showed that the resulting sequence of normalised queue length processes converges to an Ornstein-Uhlenbeck process in the many server setting when the service time distributions are exponential. Later on, Whitt (Citation1982) generalised this result for systems with non-exponential service times. For a more comprehensive overview of results in this area, see Whitt (Citation2002). In their seminal work, Halfin and Whitt (Citation1981) defined the so called Halfin-Whitt regime for the GI/M/s queue where the traffic intensities converge to one from below, the number of servers and arrival rates tend to infinity, but steady-state probability that all servers are busy remains fixed. They showed that under the appropriate scaling, the queue length processes converge to a diffusion process. In the past decades, many other asymptotic results have been obtained for many server queues in the Halfin-Whitt regime. Reed (Citation2009) studied the G/GI/s queue and obtained fluid and diffusion limit results for the queue length process. We refer the reader to van Leeuwaarden et al. (Citation2019) for a further review of the various asymptotic results obtained in the Halfin-Whitt regime.
Although heavy traffic approximations for queues have been popular in recent decades, light traffic (as the traffic intensity ) and interpolation approximations have also been developed. Bloomfield and Cox (Citation1972) developed light traffic approximations for a single server queue. Burman and Smith (Citation1983) developed approximations for the expected delay in M/G/s queue both for heavy and light traffic, and showed that as traffic intensity goes to zero, probability of delay depends only on mean service time distributions. Daley and Rolski (Citation1992) used light traffic approximations to study the limiting properties of the waiting time in many-server queues. Light traffic approximations have also been used to study the limiting processes in queueing networks (see, for example, Simon, Citation1992).
As mentioned earlier, approximation methods were commonly used in the asymptotic analysis of time-varying (i.e., non-stationary) queues. Mandelbaum et al. (Citation1999) developed a fluid approximation for the queue length process in time-varying multiserver queue with abandonments and retrials. Pang and Whitt (Citation2010) have developed heavy traffic approximations for infinite server queues with time-varying arrivals. The reader is referred to Whitt (Citation2018) for a recent review of the literature on non-stationary queues.
Due to the interest in communication/telecommunication systems, in late 1990s and early 2000s, there was a lot of research on queues with heavy tailed interarrival and/or service times. Intuitively, heavy tailed distributions decay slower than an exponential distribution (see Resnick, Citation2007, for a thorough discussion). Boxma and Cohen (Citation2000) provided an overview of results for single service queues with heavy tailed interarrival and/or service time distributions. Baccelli et al. (Citation1999) and Ayhan et al. (Citation2004) showed that the asymptotics of response time was dominated by the station with the heavy tailed service time in a class of open and closed networks, respectively. Foss and Korshunov (Citation2012) developed upper and lower bounds on the tail distribution of the stationary waiting time in the GI/GI/s queue with heavy tailed service times.
2.18. Risk analysisFootnote28
Risk analysis is a discipline that seeks to inform people about what might happen and how to reduce the probability and severity of undesired outcomes. It draws on decision analysis, game theory, and other areas of Operational Research but is distinguished from them by the questions it asks, the frameworks it provides for answering them, and the uses to which its answers are put (Aven, Citation2020; Greenberg et al., Citation2020). Where decision analysis focuses on principles for identifying logically coherent choices that make preferred outcomes more likely based on a decision maker’s beliefs and value trade-offs, risk analysis seeks to inform analytic-deliberative decision-making by multiple stakeholders—possibly with conflicting worldviews, values, and beliefs—for managing critically important matters ranging from the safe operation of nuclear power plants to priority-setting for public and occupational health and safety measures.
Risk analysis is often subdivided into risk perception, risk assessment, risk communication, risk management, and risk governance and policy-making (Greenberg & Cox, Citation2021). The following sections describe these components.
2.18.1. Risk perception
Public concerns and political appetite to address them are shaped by perceived risks, whether or not they are accurate. Several frameworks have been developed to help understand the technical, psychological, and social drivers of risk perceptions (Siegrist & Árvai, Citation2020). The psychometric paradigm (Slovic, Citation2000) explains many aspects of risk perceptions in terms of a few underlying factors such as as dread risk (associated with a lack of control, dreaded consequences, catastrophic potential, inequity in the distribution of risks, risks increasing over time, and fatal consequences) and unknown risk (associated with unobservability, novelty, unknown exposure, being unknown to science, and delayed consequences). The cognitive heuristics and biases literature positions risk perceptions within a “dual process” framework in which rapid emotional evaluations (“System 1”) can be modified by slower, more effortful cognition (“System 2”) (Kahneman, Citation2011; Skagerlund et al., Citation2020). The cultural theory of risk (Douglas & Wildavsky, Citation1983; McEvoy et al., Citation2017; Bi et al., Citation2021) posits that individual perceptions of risk are shaped by social and ideological processes that emphasise or suppress perceptions of risks depending on the respondent’s values and preferred form of social order. The social amplification of risk framework (SARF) (Kasperson et al., Citation2022) describes the social amplification or attenuation of perceived risks as risk information is communicated among people with different worldviews.
Major lessons from the study of risk perception are that experts and members of the public often view risks quite differently; that experts often focus on the probability and consequence severity dimensions of risk while members of the public consider many other aspects; that most people tend to overestimate the frequencies of rare but vivid events (e.g., terrorist attacks, murders) and underestimate the frequencies of common but familiar ones (e.g., car accidents, heart attack fatalities); and that risk perceptions of both experts and lay people are predictably shaped and distorted by cognitive heuristics and biases and are amplified or attenuated by media reports and other communications in ways that reflect the recipients’ worldviews. System 1 tends to be innumerate, responding emotionally to possibilities and categories of harm while underweighting or ignoring relevant frequencies and magnitudes. System 2 often fails to sufficiently adjust or correct the promptings of System 1 leading to decisions with predictable regrets. These findings help to explain why expert and actuarial assessments of risk often differ from lay perceptions of risk. In a democratic society, perceptions affect decisions. A major challenge for risk analysis is to assess and communicate risks to help inform and improve collective decisions in ways that understand and respect the realities of risk perception.
2.18.2. Risk assessment
Risk assessment addresses how large and uncertain risks are. It begins with qualitative questions about what might go wrong and proceeds to quantitative assessments of how likely adverse events are to occur and what their possible consequences and their probabilities would be (Kaplan & Garrick, Citation1981). Probabilistic risk assessment (PRA) and quantitative risk assessment (QRA) methods apply probability models and statistical methods to data and modelling assumptions to quantify or bound the predicted frequencies and severities of losses and to estimate how their joint probability distribution would be changed by different risk management policies or interventions. Quantitative measures of risk can be derived from the full probability distribution or stochastic process descriptions of uncertain outcomes (Smidts, Citation1997), including dynamic coherent risk measures used in financial risk analysis (Bielecki et al., Citation2017). Stochastic process models of the occurrence frequencies of adverse events (such as accidents at power plants or tornadoes in cities) and the probability distribution of losses for each event can also be used to estimate entire cumulative probability distributions for losses over a stated time interval for different scenarios or sets of assumptions (Kaplan & Garrick, Citation1981, see also §2.10 and §3.19).
In the past decade, PRA techniques such as causal Bayesian networks (BNs), dynamic Bayesian networks (DBNs), and related probabilistic graphical models have increasingly been used to predict the probabilistic effects caused by interventions in engineering systems (Ruiz-Tagle et al., Citation2022) and public health applications (Butcher et al., Citation2021). They have largely supplanted older and less general PRA techniques such as fault tree analysis and Markov decision processes (Hanea et al., Citation2022; Cox et al., Citation2018). Together with discrete-event stochastic simulation models and continuous (systems dynamics) simulation, they provide constructive methods to predict how risk management interventions would change the probabilities of outcomes over time. This information can be used for simulation-optimisation of risk management decisions (Better and Glover, Citation2011).
PRA techniques have been extended to address adversarial risks in which intelligent adaptive adversaries rather than chance events threaten the safety and values that a risk manager seeks to protect (Banks et al., Citation2022); and unknown risks (or risks under radical uncertainty, sometimes called Knightian uncertainty by economists), in which relevant probabilities are unknown, e.g., by using uncertainty sets that replace precise probability distributions by (usually convex) sets of possible probability distributions or by scenarios of possibilities that are not necessarily exhaustive (Gilboa et al., Citation2017). Recent artificial intelligence and machine learning (AI/ML) methods are now being applied to natural hazards and disasters (Guikema, Citation2020), cybersecurity (Nifakos et al., Citation2021), power markets (Marcjasz et al., Citation2022), and financial portfolio risk management problems where new, changing, and unknown conditions make it necessary to learn effective risk prediction and management decision rules from data and experience without the guidance of well-validated PRA models (Cox, Citation2020).
2.18.3. Risk management, governance, communication, and risk-cost-benefit analysis
Given public perceptions and technical estimates of risks, what should be done about them? Who should decide, and how? Managing risks to human health, safety, or the environment often involves “wicked” decision problems and “deep” uncertainties, meaning that there are no clear, widely agreed-to definitions of the decision problem and solutions to it (Lempert & Turner, Citation2021). Although multiobjective and risk-sensitive or risk-constrained optimisation problems can be formulated for some risk management problems, such as routing hazardous cargo, for many wicked risk management problems, relevant decision variables, constraints, possible outcomes, and objective functions may be unknown or not widely agreed to. Risk management in such challenging cases usually involves issues of causation (what can be done and how much difference in outcome probabilities would different feasible choices make?), collective choice (how should the disparate perceptions and preferences of individuals be resolved or aggregated for purposes of collective decision-making?) and risk governance (who should be responsible for making, implementing, obeying, enforcing, and revising risk management decisions; how should stakeholders participate in risk management decisions; what institutions and processes should guide, restrain, and integrate collective risk management; and how should conflicts be resolved and collective decisions be made at individual, organisational, community, local, national, and international levels?) (Klinke & Renn, Citation2021).
The most immediate decisions for risk managers responding to potential or actual crises are often about risk communication. For example, if a pandemic or natural disaster such as a tsunami, volcanic eruption or hurricane, seems possible but not necessarily imminent or certain, then what should scientists and government officials tell policy-makers and the public about the uncertain risks? Who should say what to whom, and how soon? Different risk communication goals such as informing and empowering individual and community decisions, persuading individuals to change their behaviours, instructing citizens what to do, and informing or shaping policy deliberations and decisions, require different communication approaches. Risk communication frameworks for addressing these challenges overlap with risk perception frameworks but also emphasise the roles of trust in information sources and of outrage in mobilising public engagement and changing behaviours (Malecki et al., Citation2020).
Risk-cost-benefit analysis provides a simple-sounding approach to collective risk management: take risk management actions to maximise expected social utility or net societal benefits (expressed as expected net present value, possibly with a risk-adjusted discount rate; Eliashberg & Winkler, Citation1981; Hammond, Citation1992). However, mathematical impossibility theorems have shown that when different people have sufficiently different beliefs and preferences, there may be no coherent way to aggregate them to make collective decisions that respect normative principles such as Pareto efficiency (Nehring, Citation2007). Trade-offs between measures of accuracy and fairness have recently been identified for machine-learning algorithms used in risk assessment in areas such as mortgage lending and criminal justice (Corbett-Davies et al., Citation2017). Societal risk management is now often viewed less as a top-down or centralised decision and control process in which experts provide estimated probabilities and social utilities or net benefits to use in risk-cost-benefit or social utility maximisation calculations than as a participatory democratic deliberative process (Rad & Roy, Citation2021). Experts in risk analysis can provide useful technical information in this process but should not dominate it (Pellizzoni & Ungaro, Citation2000; Greenberg & Cox, Citation2021; Klinke & Renn, Citation2021).
Risk analysis poses intellectual, technical, and practical implementation challenges that are likely to engage and challenge Operational Research and risk analysis professionals for the foreseeable future. A more detailed review of the accomplishments, current state, and remaining challenges for much of the field of risk analysis can be found in the 40th Anniversary Special Issue of Risk Analysis (Greenberg et al., Citation2020), in specialised books such as Aven (Citation2015), and in online resourcesFootnote29.
2.19. SimulationFootnote30
A simulation aims to reproduce the important behaviour of a real system. Our focus here is on the use of computer simulation models within operational research (OR), whilst acknowledging that the field is much wider and ranges from computer models of sub-atomic particles to simulations involving real human actors, particularly prevalent in medicine and health sciences. Three main flavours of simulation are used in this context: discrete event simulation, agent-based modelling and system dynamics. After discussing the uses of simulation, we continue this subsection by introducing these three main flavours before going on to discuss four important areas in simulation research: conceptual modelling, input modelling and parameterisation, simulation optimisation, and finally the newer area of data-driven simulation, linking to Industry 4.0 and digital twins. A selection of open source tools for simulation are given in §3.18.
A simulation model, built on a computer, has a number of potential functions. Principally it is used for experimentation because testing out new settings or ways of working on a simulation results in fewer negative implications than experimenting with the real system. This can allow simulation to be used for optimisation of complex stochastic systems and there has been considerable research in this area in recent years, as we discuss below. Simulation can also be used for predicting future behaviour, and the COVID-19 pandemic showcased the predictive power of simulation modelling in a very high-profile situation (e.g., the agent-based model used to advise the UK government and described in Ferguson et al., Citation2020). The process of building a simulation model results in a better understanding of the real system because of the need to identify and model the important relationships between different entities. Running the model can also help with estimating the sensitivity of model outputs to system parameters. Another use of simulation models is for training. Within the OR context, this most often takes the form of strategic game-playing (e.g., the beer game developed by MIT and described in Sterman, Citation1989) to practice decision-making under different scenarios in a safe environment.
Discrete event simulation (DES) is typically used to model systems in which entities move through a set of activities. Where these activities require resources, entities will queue until the resource becomes available. Such simulations are described as discrete event because the system state only varies at discrete time points, known as events. For example, a DES model might be used to describe a manufacturing line and in this case the events could include an item starting or finishing processing by a machine on the line. Usually in DES, the simulation clock will jump from one event to the next rather than moving in equal time steps.
System dynamics (SD; §2.22) was first developed in the 1950s by Jay Forrester to help with the understanding of industrial problems. SD models deal with stocks and flows, where the dynamics are dictated by a set of connected differential equations. Describing a system using an SD model can help with detecting feedback loops and delay effects and SD modelling is useful for strategic decision-making.
Agent based modelling (ABM) describes the behaviour of individual entities or agents within a population. As Macal (Citation2016) states, one of the key differences between ABM and both DES and SD is that it takes an agent perspective of a system. Each agent in the simulation will follow its own set of rules dictating its behaviour and how it interacts with the environment and other agents. Agent behaviour is typically stochastic, allowing natural variability to be included in the model. An ABM can be used as a bottom up approach to determine emergent behaviour where individual actions lead to a system level response.
Regardless of the simulation modelling technique, the first part of any simulation project is to gain an understanding of the system being modelled, the objectives of the work, and the key components that should be included, referred to as conceptual modelling. There is some discussion of the exact definition of conceptual modelling in Robinson (Citation2008) but some key points are made to support the process. First, the conceptual model can be thought of as separate from the final computer model that is built and serves as an abstraction of the real system that describes what is going to be modelled and gives an indication of how that might be done. Second, the development of the conceptual model requires input from the modeller and the system owners. Third, a conceptual model does not remain constant through a simulation project but is revisited and adapted as the project continues. Recent research in conceptual modelling is reviewed by Robinson (Citation2020) and has focused on designing modelling frameworks. The work described tends to be related to DES models but the core principles can also apply to the building of both ABS and SD models.
Like any other model, the utility of a simulation is very much dependent on its inputs: the garbage-in-garbage-out principle holds true here. Setting up the probability distributions used for inputs of a stochastic simulation model or parameterisation of a deterministic simulation model is referred to as input modelling and is typically achieved through fitting statistical models to available data and eliciting expert opinion. When estimating the inputs for a simulation model from data there is some uncertainty in their true values. With a different set of data, the estimates of the inputs would likely be different. Any uncertainties setting the model inputs will propagate through to the model outputs, resulting in input uncertainty. This is influenced both by the accuracy of the estimates of the inputs and the sensitivity of the model output to that particular distribution or parameter. Corlu et al. (Citation2020) provide a review of the current state of the art in input uncertainty research for simulation, while Song et al. (Citation2014) provide practical suggestions on how to estimate the impact of unput uncertainty on the output results.
Often simulation models are used to experiment with different system set-ups. Simulation optimisation, sometimes referred to as optimisation via simulation describes the use of a simulation model to find the optimal value for one or more decision variables. Typically it is used in the design of stochastic systems that are too complex to be effectively described by an analytical model. Practical examples of problems that can be solved using simulation optimisation include finding the optimal number and configuration of beds in a hospital ward; determining the appropriate number of repair staff on a production line; choosing between a selection of different configurations for a system.
The problem can be represented mathematically as
where the function we are optimising
is generally the expected value of the output of a stochastic simulation model,
x is a vector of decision variables;
denotes the feasible region for x; and
indicates the randomness inherent in the model. The majority of research in simulation optimisation aims to improve the efficiency of the optimisation algorithms by reducing the number of simulation replications needed to estimate the optimal values of x. Where a complex and slow-running simulation model is used to generate the
this efficiency is particularly important. Hong and Nelson (Citation2009) classify simulation optimisation problems into three categories:
Small number of solutions:
Decision variables are continuous:
Decision variables x are discrete and ordered:
A set of algorithms exists for solving each category of problem. There has also been significant work on multi-objective optimisation via simulation; for example, see Hunter et al. (Citation2019) for a detailed description of the problem and different solution approaches.
In recent years, sensing has become more widespread and the transfer of data from physical systems to control systems is now happening in close to real time. This has allowed modellers to design simulation models that are automatically fed data from the real system allowing them to either predict the future (e.g., prediction of emergency departments crowding Hoot et al., Citation2008) or to use the simulation models to optimise system parameters as part of a dynamic control process. Such models are sometimes referred to as a digital twin or symbiotic simulation (see Onggo, Citation2019, for a definition). Xu et al. (Citation2016) describe how simulation can be incorporated into the Industry 4.0 framework using the example of a semiconductor fab operation. The use of simulation in dynamic control is still in its infancy and requires fast and reliable simulation optimisation algorithms as well as mechanisms for enabling the simulation model to evolve based on new input data. Industry 5.0 is intended to complement Industry 4.0 by putting societal goals at the heart of industrial decision-makingFootnote31. This is a potential growth area for simulation optimisation, particularly multi-objective simulation optimisation (e.g., see Hunter et al., Citation2019) which enables solutions to be found that support several competing objectives.
Being a huge topic with many different facets, there is no single article that provides an overview of simulation but there are several excellent textbooks covering simulation techniques including Law (Citation2015) and Banks et al. (Citation2004). The archive of the Winter Simulation ConferenceFootnote32 is also an extensive resource in understanding the state-of-the-art in the field and its tutorial papers provide more basic tuition in the effective implementation of simulation. Recently, the history track at the conference has also provided an overview of the evolution of the simulation field.
2.20. Soft ORFootnote33 and problem structuring methodsFootnote34
Problem Structuring Methods (PSMs) are concerned with addressing problem formulation in OR. Following definitions of Mingers and Rosenhead (Citation2004) and Rosenhead (Citation1996) they consist of a set of rigorous but not mathematical methods based on qualitative, diagrammatic modelling. They allow for a range of distinctive stakeholder views of a problem to be expressed, explored and accommodated. They encourage active participation of stakeholders in the modelling process, through facilitated workshops and the cognitive accessibility of the modelling approach. PSMs afford negotiating a joint agenda and ownership of actions. The aim is for exploration, learning and commitment from stakeholders, rather than optimisation or prediction. PSMs thus are vital and constitute a significant developmental direction for OR. See Smith and Shaw (Citation2019) and Franco and Rouwette (Citation2022) for recent reviews.
Understanding the contribution of PSMs to OR requires some knowledge of their evolution. We characterise the development of the field into three phases: (i) origins, (ii) growth (only noted here through the increased publication rate of PSM related articles), and (iii) maturity, covering the diffusion of PSMs to fields outside of OR, and re-integration of problem structuring into mainstream OR. Looking at the last first, we see PSMs at an important turning point, as recent work by Dyson et al. (Citation2021) specifically identify the centrality of problem structuring in the origins of OR and lead us towards the important question of why PSMs are not seen as an essential element of every OR engagement.
The origins of PSMs as a set of formal methods in OR arose as a consequence of the broad critique of the process of OR in the 1970-80s; the label itself was pioneered by Woolley and Pidd (Citation1981). Ackoff became a trenchant critic of the sole pursuit of objectivity and optimisation in OR describing it as an “opt-out” (Ackoff, Citation1977) and set out an agenda for reconceptualising OR practice (Ackoff, Citation1979a). Dando and Bennett (Citation1981) described the situation as a “Kuhnian crisis in management science”. In Rosenhead’s “Rational Analysis for a Problematic World: Problem Structuring Methods for Complexity, Uncertainty and Conflict” their prescription in OR engagements was associated with dealing with problem contexts identified variously as wicked, messy, or swampy (Rosenhead, Citation1989, pp. 3-11). These can be summarised as problem situations that are not well-defined, involving many interested parties with different perspectives (worldviews), where there is difficulty agreeing objectives and the meaning of success, and that require creating agreement amongst the parties involved for actions to be taken. The implication of the dichotomous framing of problem contexts – i.e., wicked/tame, swamp/high ground, hard/soft, tactical/strategic – was to set out a clear critique for the whole field of OR and to suggest that to retain its relevance in dealing with the messiness of real-world problems PSMs were required to bring some rigour – and indeed a reminder of the importance – to the process of problem formulation. Importantly, the pioneers of PSMs were concerned that traditional (i.e., ‘Hard OR’) processes for problem formulation were practitioner-free (Checkland, Citation1983; Rosenhead, Citation1986).
The main PSMs set out by Rosenhead (Citation1989) were Strategic Options Development and Analysis (SODA; Eden, Citation1989), arising from cognitive mapping; Soft Systems Methodology (SSM; Checkland, Citation1989), emerging from the failure of Hard Systems Thinking approaches (e.g., Systems Engineering, RAND-style Systems Analysis) when applied to messy problems; and the Strategic Choice Approach (SCA; Friend, Citation1989), arising from planning. In addition, Robustness Analysis, Metagame Analysis, and Hypergame Analysis were also included. However, setting the boundary of PSMs has always been an open question (Mingers, Citation2011b). In the main, the core methods (SODA, SSM, SCA) are seen as exemplary and provide sufficient coherence for OR scholars and practitioners to be provided with a clear view of a common theme.
The methodology of PSMs has long been associated with contextual matters through Systems Thinking (§2.23 Checkland, Citation1983; Mingers & White, Citation2010), Community OR (Johnson et al., Citation2018; Jones & Eden, Citation1981; Parry & Mingers, Citation1991), and large group processes (Shaw et al., Citation2004; White, Citation2002). Methodological individualism has been addressed through Behavioural OR (§2.2; Franco & Hämäläinen, Citation2016; White, Citation2016). There has also been long-standing relevance to Multi-Criteria Decision Analysis (MCDA; Marttunen et al., Citation2017), value-focused thinking (Keeney, Citation1996b), policy analysis (Eden & Ackermann, Citation2004), and strategy making (Ackermann & Eden, Citation2011; Dyson, Citation2000). Bridging between PSMs and other techniques in OR has been developed as multimethodology (Mingers & Brocklesby, Citation1997); for example, integration with Simulation (§2.19; Kotiadis & Mingers, Citation2006; Tako & Kotiadis, Citation2015). Some approaches to using the Viable Systems Model (VSM), System Dynamics (§2.22), and Decision Analysis (§2.8) would also be considered as PSMs too (Rosenhead & Mingers, Citation2001, pp. 267-288), e.g., VSM (Lowe et al., Citation2020) and System Dynamics (Lane & Oliva, Citation1998). We also see developments in Group Model Building (GMB) from the System Dynamics community making a significant contribution to PSMs (Andersen et al., Citation2007). In their growth and mature phase, applications of SSM, SCA, and SODA have extended the reach of PSMs into, e.g., project management (Franco et al., Citation2004) and environment, sustainability, and energy policy, e.g., SCA (Fregonara et al., Citation2013), SODA (Hjortsø Citation2004), SSM (Pahl-Wostl, Citation2007), and the Drivers, Pressures, State, Impact and Response framework (DPSIR Bell, Citation2012).
The state of the art and research agenda for PSMs has been the subject of periodic reflection e.g., reviews by Rosenhead (Citation1996) and Mingers and Rosenhead (Citation2004). A Special Issue of JORS in 2006 questioned where PSMs were heading (Rosenhead, Citation2006) – variously argued as a “grassroots revolution” (Westcombe et al., Citation2006), an appeal to common principles (Eden & Ackermann, Citation2006), and observations that “form and content have evolved through interaction between the ideas and their practical use” (Checkland, Citation2006). A more recent viewpoint debate “whither PSMs” again questioned their direction of travel Harwood (Citation2019); Lowe and Yearworth (Citation2019).
The qualitative nature of PSM methods raises questions about evaluating both effectiveness and value. Midgley et al. (Citation2013), White (Citation2006), and Franco and Rouwette (Citation2022) have addressed the question of effectiveness, and whilst White goes some way towards defining the value of PSMs it is important to note the reservations expressed by Checkland and Scholes (Citation1990, p. 299) – that measuring value in a unique problem context, the ‘messy’ realm of PSMs, is unlikely to be meaningful. Tully et al. (Citation2019) examine this conundrum in depth from the perspective of a consulting business and make some practical suggestions for its resolution.
Theory provides an important basis for PSM development. The range of PSM practice reported has been explained by the constitutive rules that underpin specific methods. First articulated by Checkland (Citation1981, pp. 252-254), constitutive rules are generative of method rather than prescriptive and account for the range of practices that emerge, even when adopting a specific methodology such as SSM i.e., adaptation is always necessary to address the specifics of the application context. The idea was developed further by Jackson (Citation2003, pp. 307-311) and then by Yearworth and White (Citation2014) into a generic constitutive definition for PSMs. Another significant development has been a focus on PSMs as practice and drawing on practice theories. These theories provide a means of understanding OR practices by “zooming-in” to the detailed, fine-grained, scale and by “zooming-out”, looking at how specific practices affect the broader context (Ormerod et al., Citation2023). Together these theoretical strands provide sufficient basis on the one hand, to liberate PSMs from the pigeon-hole of the dichotomous framing of their origins, and on the other, to address OR practice as a whole and to see problem structuring as a normal, indeed necessary, part of every OR intervention. For instance, Actor Network Theory (ANT) provides a lens to look at the processes of problematisation (i.e., problem formulation) in OR practice (White, Citation2009). Callon (Citation1981) draws specific attention to the “abundance of problematisations” facing expert practitioners – that there is no single specific way of problematising. Strands of ANT focus on the performative idiom; (Ormerod, Citation2014a) draws attention to the “mangle of practice” and the need for more informative case studies of OR practice. Other theoretical underpinnings are relevant to PSM developments e.g., PSMs as technology (Keys, Citation1998), Critical Realism (Mingers, Citation2000), Activity Theory (White et al., Citation2016), and the specific role of models as boundary objects (Franco, Citation2013) in facilitated workshops (Franco & Montibeller, Citation2010).
From a practitioner point of view, the recent report “Reinvigorating Soft OR for Practitioners” by Ranyard et al. (Citation2021) to the Heads of OR and Analytics Forum (HORAF) and the inclusion of the knowledge requirement “How to select and apply, a range of problem structuring methods to understand complex problems” in the Operational Research Specialist Degree Apprenticeship specification by the Institute for Apprenticeships and Technical Education (Citation2021) are a welcome development.
In conclusion, for PSMs we see a return to the roots of OR as a discipline – encompassing both practice and academic scholarship – through the centrality of problem formulation to the process of OR (Churchman et al., Citation1957, p. 13) and a reminder that the seeds of problem structuring can be seen in the work of the ‘founders’ of OR as uncovered by Dyson et al. (Citation2021). We have identified a number of research gaps that indicate future research directions for the development of PSMs. In the area of the impact of new digital technologies, Yearworth and White (Citation2019) propose greater use of online “same time/different places” problem structuring workshops in order to meet the requirements for fast meeting setup times, reducing carbon emissions, enabling the scale-up to large group participation, and supporting new post-pandemic working patterns. The need to address complex policy issues in the context of wicked problems is highlighted by Howick et al. (Citation2017) and Ferretti et al. (Citation2019), who argue for a re-invigorated engagement for PSM practice in policy analysis. Finally, Ormerod (Citation2014b), Ranyard et al. (Citation2015) and Ormerod et al. (Citation2023) remind us that we need to see a renewed practitioner-led orientation for OR scholarship that grounds future development in solid empirical work.
2.21. Stochastic modelsFootnote35
Many decision problems involve uncertainty, e.g., network design with disruption risk, portfolio selection with uncertain return, resource planning with unknown resource availability, crop planting with uncertain yield, inventory control with varying demand, and project scheduling with random task duration, etc. While the effect of uncertain parameters on the optimal solution and objective value can be studied through the well-known sensitivity analysis, or what-if analysis, in a deterministic optimisation approach, such post-optimality analysis does not prescribe solutions under uncertainty a priori. This subsection provides an overview of a suite of optimisation models and methods that seek to obtain optimal or near-optimal solutions for the class of decision problems where some parameters are stochastic with known probability distributionFootnote36.
Originated in the seminal work of Dantzig (Citation1955), stochastic programming is one of the earliest and most prominent approaches to deal with optimisation problems with stochastic parameters. The basic stochastic programming model has a two-stage framework, called two-stage stochastic programming with recourse (2S-SPR; Birge & Louveaux, Citation2011). In the first stage, the here-and-now decision is made. Then in the second stage, the recourse decision is prescribed for each scenario of stochastic parameters after their realisation. The objective function minimises the total cost as the summation of the first-stage cost and the expected second-stage cost given the probability distribution of the stochastic parameters. It is often insightful to compute the value of stochastic solution (VSS; Birge, Citation1982) as the difference between the optimal objective function value of the deterministic counterpart (by substituting the stochastic parameters with their point estimates) and that of the stochastic programming model. We refer to Birge and Louveaux (Citation2011) and Shapiro et al. (Citation2021) for a systematic and updated treatment on the modelling and theory of stochastic programming, and to Wallace and Ziemba (Citation2005) for a collection of applications of stochastic programming. Recent applications include disaster relief management (Grass & Fischer, Citation2016), transit network design (Zhao et al., Citation2017), portfolio selection (Masmoudi & Abdelaziz, Citation2018), treatment plant placement in drinking water systems (Schwetschenau et al., Citation2019), process systems (Li & Grossmann, Citation2021), multi-product aggregate planning (Gómez-Rocha & Hernández-Gress, Citation2022), and resource allocation for infrastructure planning (Zhang & Alipour, Citation2022), among others.
A stochastic programming model may also include a constraint that is satisfied with a probability. This model is is known as the chance constrained programming model introduced by Charnes et al. (Citation1958). The probabilistic constraint can often be transformed into a deterministic constraint given the known probability distribution of a stochastic parameter. Detailed coverage on the chance constrained programming models and methods is available in Prékopa (Citation2013). Notable applications include farm management (Moghaddam & DePuy, Citation2011), broadband wireless network design (Claßen et al., Citation2014), supply chain network design (Shaw et al., Citation2016), equity trading server allocation (Sun & Hassanlou, Citation2019), and power system planning (Geng & Xie, Citation2019), among others.
A stochastic programming model can be formulated as a deterministic mathematical programming model by associating its decision variables with the scenarios of stochastic parameters, an approach often referred to as deterministic equivalent formulation (DEF). Solving a stochastic programming model via its DEF can be computationally challenging as the size of DEF grows rapidly with the number of scenarios of stochastic parameters. Thus custom designed algorithms are often needed to obtain quality solutions for medium- and large-size stochastic programming models. Assuming the set of random parameters has finite support, the DEF of a 2S-SPR has a block structure with L-shape, which motivates the well-known L-shape method (Van Slyke & Wets, Citation1969) based on Benders decomposition (Benders, Citation1962). For problems with a large number of random scenarios, it can be computationally intractable for the exact decomposition method to obtain an optimal solution. One may resort to various sampling-based methods to obtain approximate solutions. The stochastic decomposition method proposed by Dantzig and Infanger (Citation1991) and Higle and Sen (Citation1991) employs Monte Carlo simulation and importance sampling to compute sampling cuts instead of generating the exact cuts in the L-shape method. The other successful approach is sample average approximation (SAA; Kleywegt et al., Citation2002; Shapiro, Citation2003), which approximates the second-stage objective function by an expected value function corresponding to a set of scenarios of the random parameters. Numerical experiments and results of the SAA method on various benchmark instances are available in Linderoth et al. (Citation2006).
Another well-known stochastic modelling and solution approach is the integrated simulation-optimisation (Fu et al., Citation2005), especially used for solving problems involving discrete decision variables, widely encountered in applications in management science, operations and supply chain management. A typical integrated simulation-optimisation framework consists of two inter-related components: search and sampling. The search component deals with the solution space, often combinatorial in nature with large size, for which various metaheuristics (Glover & Kochenberger, Citation2003) can be applied. These include local search based metaheuristics such as simulated annealing (Kirkpatrick et al., Citation1983), tabu search (Glover & Laguna, Citation1997) and scatter search (Glover, Citation1998), as well as population-based metaheuristics, e.g., genetic algorithm (Holland, Citation1975). The sampling component evaluates a candidate solution via simulation, e.g., Monte Carlo or discrete event simulation. Thus an integrated simulation-optimisation approach can be viewed as an augmented deterministic metaheuristic that employs simulation to evaluate/estimate solutions in an uncertain environment. Recent applications include maritime logistics (Zhou et al., Citation2021), pooled ride-hailing operators (Bischoff et al., Citation2018), and staffing for service operations (Solomon et al., Citation2022).
Many real-world applications need decisions to be made sequentially under uncertainty, e.g., production planning, inventory control, resource allocation, and project scheduling, etc. One approach to this type of applications is the multi-stage stochastic programming (Birge & Louveaux, Citation2011), which is a generalisation of the 2S-SPR. In a typical multi-stage stochastic programming framework, a decision is made in a stage, based on the observed realisation of random parameters and the decisions made in the previous stage, to minimise the total expected future cost. The random parameters are assumed to evolve according to some known stochastic process. We refer to Zhang (Citation2023) for an updated and comprehensive treatment on various stochastic processes. A nested decomposition as a generalisation of the L-shape method can be applied to obtain exact solutions to a multi-stage stochastic programming model (Birge, Citation1985). Conceptually, it applies Benders decomposition or the L-shape method recursively to a series of nested two-stage subproblems. Although theoretically sound, it can be computationally challenging to handle reasonably large instances as the number of scenarios grows exponentially with the number of stages and random parameters. Thus one often resorts to various approximation algorithms for obtaining quality solutions efficiently, including value function approximation, constraint relaxation, scenario reduction, and Monte Carlo methods, among others (Birge & Louveaux, Citation2011).
An alternative approach to sequential decision making under uncertainty is stochastic dynamic programming (Ross, Citation1983) or as a Markov decision processes (MDP; Puterman, Citation2014). See §2.9 for more details.
There are two general approaches for solving an MDP model: open-loop and closed-loop (Bertsekas, Citation2012a). An open-loop approach obtains a solution to all the decision variables upfront, which is static in nature without updating during execution of the sequential decision-making process. The integrated simulation-optimisation approach introduced above is a successful way to obtain an open-loop policy, e.g., using genetic algorithms (Ballestín, Citation2007b), tabu search (Tsai & D. Gemmill, Citation1998), or the greedy randomised adaptive search procedure (GRASP; Ballestín & Leus, Citation2009) with simulation for the Stochastic Resource-Constrained Project Scheduling Problem (SRCPSP).
Instead of optimising the entire problem upfront, a closed-loop approach seeks to obtain an optimal decision rule (policy) to map the state at a stage to a decision, given the information available to the decision-maker at the current stage. A closed-loop policy is dynamic and adaptive in nature, thus is more flexible than an open-loop policy (Dreyfus & Law, Citation1977; Bertsekas, Citation2012a). Although theoretically attractive, to obtain an optimal closed-loop policy through the well-known Bellman equation in recursive way (Bellman, Citation1957) is computationally intractable due to the curse-of-dimensionalities of MDP in state space, solution space of decision variables, and sample space of random parameters.
Recent advances advocate the design and implementation of approximate dynamic programming (ADP) for solving large-scale MDPs. ADP has its roots in neural dynamic programming (NDP; Bertsekas & Tsitsiklis, Citation1996) and reinforcement learning (RL; Sutton & Barto, Citation2018). Its key idea is to replace the exact cost-to-go function with some sort of approximation. We refer to Si et al. (Citation2004) and Powell (Citation2011) for comprehensive coverage on ADP and its applications. There are two approximation paradigms for the design of an ADP algorithm. The value function approximation approach works directly on the cost-to-go function to replace it with an alternative functional form that is computationally tractable. Using sample path simulation, a forward iteration procedure can be implemented to solve a deterministic sub-problem with the approximated objective function subject to the set of constraints corresponding to the state of the current stage (Powell, Citation2011). This approach has been successfully applied to the multicommodity network flow problem (Topaloglu & Powell, Citation2006), dynamic fleet management (Simão et al., Citation2009), and dynamic resource planning (Solomon et al., Citation2019).
While the value function approximation approach works well for problems with structures amenable to efficient mathematical programming methods such as linear programming or network optimisation, many combinatorial optimisation problems are -hard themselves, and can be computationally demanding for mathematical programming to handle. We refer to §2.5 for a review on the topic of computational complexity and
-hardness. This calls for an alternative approximation paradigm known as the rollout policy (Bertsekas et al., Citation1997). A rollout policy estimates the cost-to-go function using some heuristic via simulation, which can be either an efficient problem-specific heuristic or a custom-designed metaheuristic for the problem at hand. It can be viewed as a look-ahead policy that estimates the cost of a decision-state pair under uncertainty about the future, which can be in contrast to the lookup table approach in RL (Sutton & Barto, Citation2018) where the cost of a decision-state pair is learned through simulation in a look-back fashion. A hybrid look-ahead and look-back ADP algorithm has been developed by Li and Womer (Citation2015) to take advantage of the complementary strengths of the pure rollout approach and the lookup table approach alone. Successful applications of rollout policy have been reported for stochastic vehicle routing (Secomandi, Citation2001; Goodson et al., Citation2013), SRCPSP with stochastic activity durations (Li & Womer, Citation2015), RCPSP with multiple-overlapping modes (Chu et al., Citation2019), ride-hailing system planning (Al-Kanj et al., Citation2020), and attended home delivery (Koch & Klein, Citation2020).
All the aforementioned models and methods assume that the probability distribution of random parameters is known or can be properly estimated. This assumption may not hold in some situations where there is lack of knowledge about the uncertain parameters, or error in measurement or implementation. Optimisation with uncertain parameters without probability distribution calls for the robust optimisation (RO) approach. Although the origin of RO can be dated back to the 1970s (Soyster, Citation1973), RO has been growing as an active research field since the last two decades. In an RO model, one assumes that uncertain parameters are within a user-specified uncertainty set. A robust feasible solution satisfies the set of uncertain constraints for all realisations of the uncertain parameters in the uncertainty set. One main technique to solve an RO model is the robust reformulation approach to obtain a computationally tractable robust counterpart (RC) with a finite number of deterministic constraints (Bertsimas et al., Citation2011a). When choosing the type of uncertainty set for the model, one often needs to trade-off between robustness against realisations of the uncertain parameters and computational tractability, i.e., size of the uncertainty set (Gorissen et al., Citation2015). We refer to Ben-Tal and Nemirovski (Citation2002) and Ben-Tal et al. (Citation2009) for systematic treatment on robust optimisation. RO has been applied in various fields including finance (Georgantas et al., Citation2021), energy and utility (Sun & Conejo, Citation2021), supply chain (Ben-Tal et al., Citation2005; Pishvaee et al., Citation2011), healthcare (Meng et al., Citation2015), and marketing (Wang & Curry, Citation2012).
2.22. System dynamicsFootnote37
System Dynamics (SD), founded by Forrester (Citation1961), is a “rigorous method for qualitative description, exploration and analysis of complex systems in terms of their processes, information, organisational boundaries and strategies; which facilitates quantitative simulation modelling and analysis for the design of system structure and control” (Wolstenholme, Citation1990). SD modelling involves (as extracted from the System Dynamics Society website - www.systemdynamics.org):
“Defining problems dynamically, in terms of graphs over time.
Striving for an endogenous, behavioural view of the significant dynamics of a system, a focus inward on the characteristics of a system that themselves generate or exacerbate the perceived problem.
Thinking of all concepts in the real system as continuous quantities interconnected in loops of information feedback and circular causality.
Identifying independent stocks or accumulations (levels) in the system and their inflows and outflows (rates).
Formulating a behavioural model capable of reproducing, by itself, the dynamic problem of concern. The model is usually a computer simulation model expressed in nonlinear equations or can be left without quantities as a diagram capturing the stock-and-flow/causal feedback structure of the system.
Deriving understandings and applicable policy insights from the resulting model.
Implementing changes resulting from model-based understandings and insights.”
SD can be employed for both qualitative and quantitative modelling. On the one hand, tools and methods employed for qualitative SD modelling are also considered Soft Operational Research or Problem Structuring methods. On the other hand, quantitative SD modelling shares many aspects of traditional simulation methods or Hard Operational Research. Using SD quantitatively implies the development of a 5-steps process (Sterman, Citation2000) that starts with a dynamic hypothesis about a structure responsible for the performance over time observed in the system followed by the model formulation, testing and experimentation. The next section discusses both approaches in detail.
One interesting characteristic of SD models is the spectrum of model fidelity they cover (Morecroft, Citation2012). illustrates a spectrum of model fidelity and realism. Models range in size from large and detailed to small and metaphorical. On the left-hand side are analogue, high-fidelity models epitomised by aircraft flight simulators used to train pilots and to rehearse crisis scenarios. They are constructed with realistic detail and accurate scaling to provide a vivid and lifelike experience of flying the aircraft they represent. People typically expect business and social models to be similarly realistic; the more realistic the better. Realistic high-fidelity models are discussed later in this subsection. But very often smaller models are extremely useful, particularly when their purpose is to aid communication and to build shared understanding of contentious problem situations in business and society. As suggests, the spectrum of useful models can include illustrative models (of limited detail yet plausible scaling) or even tiny metaphorical models (of minimal detail yet transferable insight).
Figure 1. Modelling and realism: a spectrum of model fidelity. Adapted from Morecroft (Citation2015), Chapter 10.
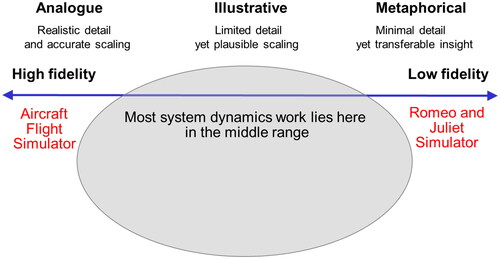
At the other end of the spectrum, on the far right, is a low fidelity Romeo and Juliet simulator (Morecroft, Citation2010). This particular simulation model contains just four main concepts: Romeo’s love for Juliet, Juliet’s love for Romeo and the corresponding rates of change of their love. It is used as a metaphorical model or transitional object to help undergraduates and high school students to better understand something complex and abstract – differential equations or even Shakespeare’s play. Clearly, a simulator cannot possibly replicate Shakespeare’s play, but it can encourage students to study the play more closely than they otherwise would. It is this metaphorical property of small models – to attract people’s attention, to encourage them to reflect and debate – that often underpins their value to model users. Sometimes metaphorical models enable client engagement. One could say that ‘small is beautiful’ in the world of policy and strategy modelling. Over the years SD studies have included models and simulators that cover the entire range. See Kunc (Citation2017b) for a sample of papers published in the Journal of the Operational Research Society and Kunc et al. (Citation2018) for a study on published SD models.
2.22.1. Qualitative system dynamics
The main objective of qualitative SD involves discovering the structure, in terms of feedback loops, driving the dynamic behaviour of key variables, usually with clients through facilitated workshops. The main tool employed in qualitative SD modelling is causal loop diagram (CLD). The steps for developing a CLD are (based on Kunc, Citation2017a):
Understanding the direction of causality between two variables. Interestingly, it is a source of important discussion among participants in facilitated qualitative SD modelling.
Defining polarities involves identifying the relationships between two variables as either positive (same sense of direction of change) or negative (opposite sense of direction of change).
Identifying feedback processes responsible for the dynamic behaviour of variables. They originate from connecting variables in a circular chain of cause-and-effect. There are two types of feedback process: reinforcing and balancing.
Finally, shows description of the modelling process
Table 1. Qualitative SD modelling process based on Kunc (Citation2017a).
2.22.2. Quantitative system dynamics
Quantitative System Dynamics characterises the system behaviour using a set of accumulation processes linked through feedback processes. The structure of the model is represented through stocks and flows diagrams. The numerical results, which are deterministic and continuous, aim to replicate past system behaviour through calibration and testing processes before the model is used to test interventions in the system. presents a summary of the modelling process.
Table 2. Quantitative SD modelling process based on Kunc (Citation2017a).
2.22.3. Application areas
Behavioural modelling: There are three main areas of application. Firstly, research in decision making under dynamic complexity focused on identifying and documenting systematic misperceptions of feedback in decision making processes across multiple industries and environmental conditions using SD models (Gary et al., Citation2008; Atkinson & Gary, Citation2016). Secondly, experimental studies explore decision making and performance using management flight simulators or microworlds based on SD models (Gary et al., Citation2008; Sterman, Citation2014). Thirdly, individual experimental work using SD models examines how differences in mental model accuracy and decision rules lead to differences in the performance (Torres et al., Citation2017). Recently, scholars have advocated for a practice of behavioural system dynamics (Lane & Rouwette, Citation2023).
Group model building: There is a wide body of research on model conceptualisation in groups; see Rouwette et al. (Citation2010), where the outcome is either qualitative or quantitative SD models. Researchers have assessed the effects on communication, learning, consensus and commitment in the behaviour of groups, as well as measuring the changes in mental models and understanding the impact of group model building in terms of persuasion and attitudes (Rouwette, Citation2016).
Multi-scale high-fidelity systems modelling: SD modellers are embracing new approaches to improve the scale and fidelity of their models to move from aggregate conceptual models into realistic detailed models supported with specific data. There are multiple considerations to develop high-fidelity models (Sterman, Citation2018). Firstly, these models represent heterogeneous actors in the system, which involves disaggregating single stocks into multiple stocks reflecting their differences across dimensions (e.g., age). While this solution increases granularity in the model, it also implies increasing computational burden and long simulation times, which can limit the ability to perform sensitivity analysis, change structure and test interventions by stakeholders. Secondly, high-fidelity models reflect business and social processes in detail fitting the data. Therefore, models may move from the traditional representation of time, continuous, to discrete; from state continuous variables or discrete variables; and include uncertainty using stochastic variables. Consequently, SD models can employ ordinary differential equations, stochastic differential equations, discrete event simulations, agent-based models and dynamic network models. Thirdly, multiscale modelling involves integrating models working at different temporal scales (e.g., fast and slow dynamics). Fourthly, since SD models tend to employ qualitative data (e.g., decision making rules), modellers should identify and mitigate biases in sample selection and data elicitation to collect robust qualitative data. Fifthly, quantitative data should have a clear purpose in terms of the model, so specific data related to the problem the model is solving has to be collected rather than accepting only available numerical data. Sixthly, high-fidelity models should consider parameter estimation and model analysis extremely necessary to replicate historical data.
SD and Artificial Intelligence (AI): Since abundant information is available in different forms (images, text, and numbers), there is a need for technologies that not only predict data but also learn from the environment such as AI (Baryannis et al., Citation2019). AI can be used for cognitive thinking, learning from behaviour, recalling, and drawing inferences (Min, Citation2010). SD models use inferences of the casual structure in system to predict future trends or test interventions (e.g., new policies). SD can combine with AI to generate AI-driven simulations based on machine-learned and mathematical rules to make more accurate models (Li et al., Citation2022b). Another use is the employment of AI methods to interpret the results of simulations, especially feedback loop dominance in complex SD models.
2.22.4. Future of system dynamics research
The future of SD may be driven by developments in several on different areas. Firstly, SD can be used as a problem structuring or systems thinking method (in terms of qualitative SD) so improvements in terms of facilitation will be critical. Secondly, when SD is an aggregated simple model that helps modeller and client to learn about dynamic complexity, improvements in terms of impact on behaviour from using the model (Kunc et al., Citation2020) will be expected. Thirdly, SD can be high fidelity systems models using all the toolkit available in terms of simulation methods and AI. The next section on systems thinking (§2.23) looks at other systems methodologies for different purposes.
2.23. Systems thinkingFootnote38
‘Systems thinking’ involves us viewing complex problem situations and possible human responses to them using systems theories, methodologies, methods and concepts. We will start this section by presenting a contemporary understanding of what a ‘system’ is. An explanation of how systems thinkers use this understanding to support action to address or prevent complex problems will then follow. Subsequently, we will review 70+ years of systems thinking to show how we got to this contemporary understanding via three ‘waves’ of methodological development.
2.23.1. What is a system?
A system is made up of a set of interrelated parts, with emergent properties (Emmeche et al., Citation1997). An emergent property is a feature that cannot be traced back to any single part of the system, so can only be understood as arising from the whole (all the parts and interrelations together). Systems have boundaries: we can say what is inside and outside the system (Ulrich, Citation1994), although some interactions may cross these boundaries (von Bertalanffy, Citation1968). However, systems are always seen from the perspective of an observer/participant (Churchman, Citation1979; Cabrera et al., Citation2015). Indeed, there can be multiple perspectives on the boundaries of the system, what interrelationships (within the system and with its environment) need to be considered, what emergent properties matter, and what other perspectives should be heard.
2.23.2. What is systems thinking?
Based on the above understanding of systems, we can now explain systems thinking. It is taking a systems approach to rethinking the taken-for-granted assumptions of decision makers, OR practitioners and stakeholders on what perspectives, boundaries, interrelationships and/or emergent properties matter in a given situation, and what the implications are for action. Many systems thinkers use the adjective ‘critical-systemic’: thinking is systemic because of the use of the above systems concepts, but it is also critical because it involves rethinking options for understanding and action in relation to the deployment of these concepts (Ulrich, Citation1994; Gregory et al., Citation2020).
2.23.3. Three waves of systems methodology
Since the 1950s, there have been three ‘waves’ (or successive paradigms) of systems methodology, although the second and third waves didn’t fully replace their predecessors: some groups of practitioners stuck with earlier ideas. The first wave was typified by early work in systems engineering (e.g., Hall, Citation1962; Jenkins, Citation1969), systems analysis (e.g., Miser & Quade, Citation1985, Citation1988), system dynamics (e.g., Forrester, Citation1961, see also §2.22), and organisational cybernetics (e.g., Beer, Citation1966, Citation1981). The first wave emphasised quantitative computer modelling by experts serving clients. These experts explained emergent properties of systems by understanding interrelatedness, and then deployed these explanations to make recommendations to clients on the possible consequences of strategic and tactical decisions.
In terms of the definition of a system presented earlier, systems were seen as real-world entities; the emphases were on interrelationships and emergent properties; boundaries were relevant because modelling had to account for all the parts and interrelationships in a system that are needed to understand given emergent properties; but multiple perspectives were often bypassed, rather than listened to, in the interests of objectivity or impartiality.
Almost all the first-wave methodologies regarded models as representations of reality, with people often being viewed as deterministic parts of systems being modelled rather than self-conscious actors who can change their purposes (Ackoff, Citation1979a). Indeed, stakeholder purposes can differ significantly from those of the systems modeller and his/her client, and ignoring this can create conflict that undermines an OR project (Checkland, Citation1985). Some critics (e.g., Hoos, Citation1972; Lee, Citation1973) argued that massive investments in large-scale modelling were wasted because systems practitioners tried to be comprehensive (e.g., modelling all interacting problems at the city scale), yet they didn’t sufficiently account for the actual questions that decision makers wanted to address—more modest modelling for specific purposes would have been better. Worse, the typical response to project failures was to say that the models were not comprehensive enough, so the ideal of comprehensiveness remained unquestioned (Lilienfeld, Citation1978).
These criticisms led to a second wave of systems methodologies focused on stakeholder participation, qualitative modelling and dialogue for collaborative learning. The idea of producing expert recommendations was replaced by a facilitation role for the practitioner, so multiple stakeholders could develop and integrate their ideas into proposals for change. Modelling shifted from a focus on real-world systems to understanding stakeholder perspectives, which could help people develop better mutual understanding and agree broadly-acceptable ways forward. Second-wave methodologies included soft systems methodology (Checkland, Citation1981), strategic assumption surfacing and testing (Mason & Mitroff, Citation1981), interactive planning (Ackoff, Citation1981) and interactive management (Warfield, Citation1994). Several earlier, first-wave methodologies were transformed in the second wave to become more participative, most notably system dynamics (e.g., Vennix & Vennix, Citation1996) and organisational cybernetics (e.g., Espejo & Harnden, Citation1989).
It was during the second wave that the definition of a system was expanded to recognise that all systems are understood from a perspective. Boundaries were no longer considered the real-world edges of systems, but instead marked what people include in or exclude from their deliberations (Churchman, Citation1970). There was a shift away from seeing systems as real-world entities to viewing them as useful ways of thinking to structure interpretations, either of the world or of prospective actions to change that world (Checkland, Citation1981).
However, this second wave came to be critiqued by a third wave of systems thinkers. Two issues came to the fore. First, a bitterly-entrenched paradigm war between first- and second-wave systems thinkers was sparked by the emergence of the second wave (Jackson & Keys, Citation1984). In response, there were many third-wave proposals for methodological pluralism: drawing creatively from both first- and second-wave methodologies, and reinterpreting methods through new frameworks or guidelines for choice. The idea was to refuse the forced choice between first- and second-wave thinking, and embrace the best of both. This gave us a more flexible and responsive practice than either of the previous two waves could deliver (e.g., Jackson, Citation1991; Mingers & Gill, Citation1997). Much of the work on methodological pluralism was developed under the banner of ‘critical systems thinking’ (Flood & Jackson, Citation1991b; Flood & Romm, Citation1996; Jackson, Citation2019).
The second issue identified in the third wave was that earlier approaches were relatively naïve with respect to power relations. The first-wave assumption that the practitioner and/or client knows best could result in the coercive imposition of ‘solutions’ and/or a lack of stakeholder buy-in, which would frustrate implementation of recommendations for change (e.g., Jackson, Citation1991; Rosenhead & Mingers, Citation2001). Also, there was a second-wave, practice-limiting belief that stakeholder participation in dialogue, in and of itself, allows the better argument to prevail. This overly minimises problems of bias, coercion, groupthink, deceit, ideological framing and disempowerment (Mingers, Citation1980, Citation1984; Jackson, Citation1982).
A seminal, third-wave response to the power issue was Ulrich’s (Citation1987; Citation1994) critical systems heuristics. Ulrich’s central idea is being critical of the boundary judgements made by decision makers, including the OR practitioner him/herself. Nobody can have a comprehensive viewpoint, so boundaries are inevitably set with reference to the purposes and values of decision makers. However, too often, boundary judgements are taken for granted, so decision makers (often unknowingly) foist their normative assumptions on those affected by their decisions, and the latter’s voices are not heard. Ulrich encourages those involved in and affected by an OR project to reach agreement in dialogue on the key assumptions upon which that project should be based. However, when dialogue is avoided by decision makers, those affected by their ideas have the right to make a ‘polemical’ case to embarrass the decision makers into accepting discussion. The key principle is preventing powerful stakeholders (decision makers and ‘experts’, including the OR practitioner) from simply taking their boundaries and values for granted and imposing them on others.
Following Ulrich (Citation1994), Midgley et al. (Citation1998) then reviewed all the second- and third-wave work on boundaries, and proposed a broader theory and practice of boundary critique. This encourages the practitioner to explore different possible boundaries, purposes and values in an OR project, and also to uncover conflicts (Midgley & Pinzón, Citation2011) and processes of marginalisation (Midgley, Citation1992). Midgley et al. (Citation1998) argue that boundary critique is necessary in all projects dealing with complex issues, as there are likely to be initially-hidden elements of the situation that need to be accounted for. Indeed, even deciding whether a problem situation should be viewed as complex or not requires some up-front boundary critique.
In terms of the definition of a system given earlier and its implications for systems thinking, this work deepened our understanding of boundaries: taken-for-granted boundaries can reflect the structural entrenchment of power relations in our organisations, institutions and wider society (Jackson, Citation1985), which can cause major socio-political and environmental issues (Midgley, Citation1994). Therefore, third-wave systems thinkers started talking about evolving stakeholder perspectives and structural relationships: doing either without the other can result in systemic resistance to change (Gregory, Citation2000). However, the starting point for intervention (following an initial boundary critique) is usually stakeholder perspectives because it is the stakeholders themselves who can then turn their attention to structural reform (Boyd et al., Citation2007). Here we see the co-existence of both the first-wave understanding of real-world systems and the second-wave emphasis on stakeholder perspectives. Methodological pluralism makes perfect sense in this context, as some approaches are particularly useful for evolving stakeholder perspectives (e.g., Checkland, Citation1981), and others support intervention in organisational and institutional structures (e.g., Beer, Citation1981). Both can be integrated into an OR project design (e.g., Sydelko et al., Citation2021, Citation2023).
Eventually, research on methodological pluralism and boundary critique was integrated into a new ‘systemic intervention’ approach by Midgley (Citation2000). He recognised that boundary critique could support deep diagnoses of problem contexts, and these diagnoses could then inform the design of OR projects, drawing creatively upon methods from both previous waves of systems thinking and from other traditions. This work unified the different strands of third-wave methodology.
Recently, however, there have been discussions about whether a fourth wave is forming. Current research foci include whether a universal theory of systems thinking is possible and necessary (Cabrera et al., Citation2023); how to construct a simple narrative of systems thinking to effectively communicate our work (Midgley & Rajagopalan, Citation2021); how arts-based methods can enhance practice (Rajagopalan, Citation2020); and what we can learn from neuroscience to inform methodological development (Lilley et al., Citation2022). It remains to be seen whether addressing these issues will extend the third wave or launch a fourth wave of systems thinking.
2.24. VisualisationFootnote39
Visualisation, the graphic (and often interactive) display of quantitative or qualitative information, has established itself not only as a powerful working modality for many management and engineering contexts (Basole et al., Citation2022; Lindner et al., Citation2022), but also as a research field (and research method) in its own right (Eppler & Burkhard, Citation2008). In this subsection we briefly review the visualisation field, its relevance for Operational Research (including its benefits and caveats), its various types and application contexts, its theoretical perspectives and approaches, as well as its likely future evolution.
Why care about the graphic representation of information, especially for Operational Research? The short answer that research has provided over the last decades to this question is that it provides numerous cognitive, emotional, and social benefits and thus improves our individual and collective ability to make use of information. These benefits include a quicker comprehension of information (Kress & Van Leeuwen, Citation2006), the detection of important patterns (Bendoly & Clark, Citation2016), the ability to better discuss information (Bendoly & Clark, Citation2016; Meyer et al., Citation2018), or the greater recall of information (Paivio, Citation1990; Childers & Houston, Citation1984).
The visual representation of information is not, however, without risks or potential disadvantages (see Bresciani & Eppler, Citation2015; Basole et al., Citation2022). Visualisations can be misleading, manipulating, oversimplified, biased, or simply confusing or overwhelming. If, for example, the y-axis of a line chart has been cropped, a small improvement may be mistakenly interpreted as a substantial one. The correct interpretation of information may also require what is often referred to as visual literacy (including data and information literacy, see Locoro et al., Citation2021) on behalf of the viewers. A diagram is sometimes worth ten thousand words (Larkin & Simon, Citation1987), but at times it requires that many words of explanation to properly understand it.
To avoid such risks, professionals need to choose the right visualisation format for the task at hand and use it diligently and in line with existing guidelines (such as those made popular by Tufte, Citation2001) and our perceptual preferences (Ware, Citation2020). There is research on both of these questions, i.e., on the available types of visualisation (Shneiderman, Citation1996; Chi, Citation2000) and on their proper use (see for example Ware, Citation2020).
In terms of segmenting the different kinds of graphic representations for operations management contexts, one can, at the highest level, differentiate between quantitative and qualitative information visualisation. This distinction is based on the type of information that is represented: in the case of numbers or data this is referred to as quantitative visualisation. Typical examples of this genre of visualisation are business intelligence dashboards or simple overhead slides with bar and pie charts. Pie charts, however, are perceptually problematic, as we cannot visually distinguish pie section sizes accurately, let alone compare them in different pie charts. In the case of concepts, arguments, ideas, or issues this is often labelled as qualitative visualisation. Argument mapping (Bresciani & Eppler, Citation2018) is one approach within this group that is already used in different management contexts. Whereas quantitative visualisation is mostly software-based, qualitative visualisation can be done on paper, walls, flipcharts, and other physical media.
There are, of course, also instances of mixed visualisations that combine quantitative information and qualitative insights in a single image (see Eppler & Kernbach, Citation2016, for such combined representations). An example of such a hybrid visualisation would be a business intelligence dashboard (consisting of charts) that reveals conceptual diagrams through mouse-over comments (or vice versa).
The aforementioned distinctions are part of one tradition of visualisation research, namely the classificatory or taxonomic approach (see, for example, Shneiderman, Citation1996). This research stream or visualisation perspective aims at providing a systematic and comprehensive overview on all forms of information visualisation that are useful for the engineering or management sector.
Another theoretical framing of the visualisation field comes from the literature on graphic representations as boundary objects that span professional frontiers and connect expertise across disciplines – through the help of joint visual displays (Black & Andersen, Citation2012). This stream of literature emphasises the dual nature of visualisations to be simultaneously fixed and fluid, clear and open to multiple interpretations or functions (for example the blueprint chart of a building or the Gantt chart for a project).
A third influential approach to make sense of the use and impact of visualisation in workplace settings is the cognitive or collaborative dimensions approach (Green et al., Citation2006; Bresciani & Eppler, Citation2018). This theoretical lens sheds light on the different qualities of graphic representation that make them more or less suited to be collaboration catalysts—for example based on their (procedural or representational) clarity, unevenness or facilitated insight.
A similar theoretical perspective is the affordance approach (Meyer et al., Citation2018), that highlights the different cognitive ‘invitations’ or incentives that visualisations can provide, such as their attention grabbing effect, their interpretive flexibility or their story telling potential.
Another influential research stream focuses not on how images are best designed for their application contexts, but on how they are appropriated and interpreted. Many researchers with this research stream employ a semiotic approach to the study of visualisation based on the seminal work by Kress and Van Leeuwen (Citation2006). This approach is also informed by (research-based) insights into our perception of visual information, but additionally enriched by the conventions and (cultural) traditions that govern our interpretation processes of graphic symbols.
There are of course many other research streams discussing the design and use of visualisation in management or engineering contexts. While some of them focus on particular visualisation formats, such as diagrams, maps, 3D models, or sketches, others focus on certain application contexts, such as (big data) analytics, creativity and innovation, production simulation, or planning. This brings us to the actual application contexts of visualisation.
When are the visualisation formats and perspectives described above mostly used? Typical application contexts for information visualisation are strategising (Eppler & Platts, Citation2009) and planning sessions of managers and experts (for example with the help of Gantt charts or technology roadmaps (Blackwell et al., Citation2008), risk analysis (Eppler & Aeschimann, Citation2009), ideation and problem solving workshops (using mind mapping, argument mapping, or simple sketching) in product development and business model innovation contexts (using canvases and other visual framerworks), training and development (including knowledge transfer and retention), as well as for performance management, simulations and forecasting or scenario workshops. Last but not least, visual methods are also used as research tools in their own right (Comi et al., Citation2014) to enable better access to practitioners’ expectations, experiences, or priorities (Bell & Davison, Citation2013).
Many new application contexts are currently emerging within the realm of Operational Research and management, including new forms of visualisation. These novel forms include trainings and simulations in three dimensional immersive settings such as the Metaverse or augmented reality visualisations for simulations or assisted on-site decision making or operations. Another fascinating recent phenomenon consists of images created by artificial intelligence based on user instructions (such as DALL-E or similar systems). Such artificially created, at times photo-realistic images, can help (for example) in the ideation, service innovation, or product development context. The rise of artificial intelligence also impacts the interpretation of information visualisation: A case in point are data visualisation packages (such as Tableau or PowerBI) that (through AI) already assist the user in the exploration and interpretation of the provided data charts and suggest areas for deeper analysis. The visualisation field is thus a highly dynamic area with great promise, both in terms of its methodological repertoire as well as its application scope.
3. Applications
3.1. Auctions and biddingFootnote40
The 2020 Nobel Prize in Economics was awarded to Paul Milgrom and Robert Wilson for their improvements to auction theory and inventions of new auction formats. Their theoretical discoveries have improved auctions in practice and benefited sellers, buyers and taxpayers around the world (RSAS Citation2020).
An auction is usually a process of selling and/or buying goods or services that are up for bids. A bid is a competitive offer of a price and/or quantity tag for a good or service. Auction is a particular way to determine prices and allocation of goods or services.
Auctions have been used since antiquity for the sale of a variety of objects. Today, both the range and the value of objects sold by auction have grown to staggering proportions (Krishna, Citation2010). The contexts within which auctions are applied include art objects, antiques, rare collectibles, expensive wines, numerous kinds of commodities, livestock, radio spectrum, used cars, real estate, online advertising, vacation packages, wholesale electricity and emission trading, and many more.
In the basic economic model, the price of a good or service is obtained when the supply and demand meet and it is normally an equilibrium value after adjustments over time. However, in some situations such adjustments cannot be made to reach an equilibrium. As Haeringer (Citation2018) points out, auctions are commonly used when (a) sellers and/or buyers have little knowledge of what would be the “right” price (e.g., a tract of land with an unknown amount of oil underground); (b) the supply is scarce (e.g., an art painting); (c) the quantity or quality of the good changes very frequently (e.g., electricity or fish); and (d) transaction frequency is low (e.g., radio spectrum).
Bidders behave strategically. Based on the available information, what they know themselves and what they believe other bidders to know, it is difficult to analyse the outcomes of different bidding rules. This is where auction theory comes in, which is closely linked to many other domains of operational research, such as game theory (§2.11), behavioural OR (§2.2), combinatorial optimisation (§2.4), computational complexity (§2.5), linear programming (§2.14) and integer programming (§2.15).
3.1.1. Key concepts and results
As detailed by Haeringer (Citation2018), an auction consists of the following component rules: (a) bidding format (e.g., a price, a price and a quantity, a quantity only, or a list of items if more than one item are for sale); (b) bidding process (e.g., auction stopping criteria and information for bidders); and (c) price and allocation (i.e., auction winner(s) and the final price(s)).
In studying auctions, it is important to bear in mind the underlying model of valuation, the values attached to the objects by individual buyers and/or sellers. If the value, though unknown at the time of bidding, of an object is the same for all bidders, then the evaluation is of a common value. More generally, in situations of private values, the value of an object varies from one bidder to another. These values can be independent or interdependent.
If there is only one item to be sold, we have the most basic auction. Some common forms of such simple auctions are well known. In an open-outcry auction, an auctioneer takes bids from the participants and at some point of time a winner is declared, who will then pay for the item at some price related to the bids. If all bids follow the dynamics of ascending prices and the winner is the highest bidder, who pays his bidding price, then we have an English auction. In the case of private values, the English auction is strategically equivalent to the second-price sealed-bid auction (Krishna, Citation2010), in which bidders submit written bids without knowledge of other bids. The highest bidder wins but pays the price that is the second highest in the auction. On the other hand, if the auctioneer in an open-outcry auction begins with a high asking price (in the case of selling) and lowers it until some participant accepts the price (or until it reaches a predetermined reserve price), then we have a Dutch auction. This type of open-outcry descending-price auction is most commonly used for goods that are required to be sold quickly such as flowers, or fresh produce (Mishra & Parkes, Citation2009), as it has the advantage of speed since a sale never requires more than one bid. The Dutch auction is strategically equivalent to the first-price sealed-bid auction (Krishna, Citation2010), which is the same as the second-price sealed-bid auction except that the winner pays his bidding price.
If there are multiple homogeneous (resp., heterogeneous) items to be sold, we have a multiunit (resp. combinatorial) auction.
One of the most important results in auction theory is the revenue equivalence theorem (Heydenreich et al., Citation2009; Nisan, Citation2007), which in its simple form states that when bidders’ valuations are private and uniformly distributed, the expected revenue of the seller is the same in the English (or second-price) and Dutch (or first-price) auctions.
In a forward auction, a number of buyers compete to obtain goods or services from one seller (e.g., spectrum auction). In contrast, in a reverse auction, a number of sellers compete to obtain business from one buyer (e.g., electricity capacity market). In a double auction, there are multiple sellers and multiple buyers (e.g., wholesale electricity market). Potential buyers submit their bid prices and potential sellers submit their ask prices to the market institution, which then chooses the price that clears the market. At this price p, all the sellers who asked no more than p sell and all buyers who bid at least p buy.
The main issues that guide auction theory involve a comparison of the performance of different auction formats. Naturally revenue is by far the most common yardstick from the seller’s perspective. However, if the auction concerns the sale of a publicly held asset to the private sector, such as the case of spectrum auction, efficiency may be more important – the object ends up in the hands of whoever values it most ex post, or in the more general case of multiple items, the sum of realised values for all participants is maximised. Besides, simplicity and susceptibility to collusion among bidders are among other criteria for the choice of an auction format (Krishna, Citation2010).
3.1.2. Some best practices
One of the most important applications of auction theory is the implementation of spectrum auctions to allocate licenses to mobile phone carriers, who act as buyers in the forward auction. One of the auction formats introduced by Milgrom (Citation1987) and Wilson (Citation1998) was first used in 1994 by the US authorities to sell radio frequencies. This practice has since spread globally and led to great benefit to society.
There can be many ways for allocating licences in general. In addition to an auction, it can proceed either with a lottery in which any interested party would just have to sign up possibly with an entry fee, or with a beauty contest in which all those wishing to obtain a licence are required to present a case and the final winners would be selected by a committee. Haeringer (Citation2018) provides a detailed argument why a lottery or a beauty contest is inappropriate in the case of radio frequencies and why an auction offers a more attractive solution. There are a number of issues in selling licences of spectrum, such as those concerning collusion, demand reduction and lack of entry. Of particular relevance for common-value auctions is the so-called winner’s curse – the winner pays too much and loses out. Haeringer (Citation2018) discusses how a suitable format of an auction can be used to address these issues.
A wholesale electricity market exists when competing generators offer their electricity output to retailers. Double auctions are normally used for such a market (Mayer & Trück, Citation2018). By its nature electricity is difficult to store and has to be available on demand. Consequently, unlike other products, it is not possible, under normal operating conditions, to keep it in stock, ration it or have customers queue for it, so the supply should match the demand very closely at any time despite the continuous variations of both (Weron, Citation2014, §3.19). The supply uncertainty becomes particularly relevant with an increased use of green energy (such as solar, tidal, wind energy).
The electricity capacity market becomes necessary to build and maintain electricity capacity that may be called upon in time of need to maintain the grid balance. In the UK’s system for purchasing Short Term Operating Reserve (STOR) for electricity supply (National Grid ESO Citation2022), the National Grid maintains a reserve generation ability in case of sudden demand or supply variations. Part of the operating reserve is made up by contracts through auctions. In this market, the bids come as electricity capacity, so the National Grid determines the right amount of capacity to reserve from a competitive tender. Tenders are assessed on the basis of availability prices and utilisation prices together with a consideration of response times and geographical locations. In this reverse auction, the National Grid acts as the buyer, while individual electricity operators act as sellers. Extensive studies on such auctions can be found in Chao and Wilson (Citation2002) and Schummer and Vohra (Citation2003). More recently, Anderson et al. (Citation2017, Citation2022) investigate the problem under more general settings. They show that a natural equilibrium is not only efficient but also optimal for individual bidders.
The Internet is a new exciting venue for auctions and eBay is certainly the most well-known auction place on the Internet. Auctions on eBay face new challenges due to the nature of the Internet, where an auction can take days or even weeks and potential buyers can bid whenever they want. In response, eBay uses proxy bidding wherein a computer programme is used to bid on behalf of the bidder, who enters an auction effectively with a maximum bid. The computer programme raises rival bids by the minimum increment set beforehand as long as it is below the maximum bid. It is easy to see that such an auction is effectively a second-price auction in which the amount entered by the bidder serves as the bidding amount. Ariely and Simonson (Citation2003) propose an analytical framework for studying bidding behaviour in online auctions. Chothani et al. (Citation2015) provide an overview of online auctions. Hickman (Citation2010) analyses significant differences between electronic auctions and non-electronic auctions.
3.1.3. Closing remarks
There are many excellent surveys of auction theory and applications. Milgrom (Citation1985) and McAfee and McMillan (Citation1987) provide a cogent account of the theory of single-object auctions and explain many extensions and applications of the theory. Milgrom (Citation2004) provides a comprehensive introduction to modern auction theory and its important new applications. Samuelson (Citation2014) examines the use of auctions, paying equal attention to theory and practice. Haeringer (Citation2018) and Kagel (Citation2020) give respectively an overview of empirical and experimental studies on auctions. Cassady (Citation1967) provides a colourful and insightful overview of real-world auction institutions.
3.2. Community operational researchFootnote41
Community Operational Research (COR) reflects the aspirations of OR’s early theorists and practitioners of “science helping society” (Cook, Citation1973/1984, p.36). There is a long tradition of COR practice that includes Ackoff’s, Citation1970 engagement with members of the Mantua ghetto in Philadelphia, Cook’s projects with inner-city community organisations (Cook, Citation1973; Luck, Citation1984), Beer’s work with the Allende Government in Chile (Beer, Citation1981), and numerous projects undertaken from the University of Bath (Jones & Eden, Citation1981; Sims & Smithin, Citation1982). See Jackson (Citation2004) and Rosenhead (Citation1993) for a discussion of such work. Although these early examples of COR are significant, they were far from the norm as a focus on “science helping the establishment” predominated (Cook, Citation1973, Citation1984, p.36). In recognition of this, Rosenhead (Citation1986) posed the question of “who O.R. worked for (“custom”)” (p.335) in his inaugural address as President of the UK’s Operational Research Society. Rosenhead answered his own question in stating that the customers were, in the main, “big business, public utilities, the military and central government departments, with a thin scatter of local governments and health and other public authorities” (p.336) to the neglect of other groups “located outside the power structure” (p.337). Rosenhead (Citation1986) not only discussed the custom of OR, but also tackled the related issue of practice in asserting that “The evolved forms of tools reflect the circumstances of their use” (p.338). Hence, mainstream OR’s focus on quantification and modelling reflected its customers’ privileging of technical matters over dialogue between stakeholders and issues of emancipation (Rosenhead, Citation1993, drawing on Habermas, Citation1972), and involved the use of OR methods “beyond the comprehension of most people” (Rosenhead, Citation1986, p.339), effectively masking the social and value-laden nature of much decision making. In contrast, concerns for better mutual understanding in society and freedom from oppressive power relationships inspired the call for a more transparent OR to support “a more lively, complex and elaborate social process of decision-making” (Rosenhead, Citation1986, p.339).
Such was the impact of Rosenhead’s inaugural speech and his efforts within the OR Society that engagement with non-traditional clients quickly became legitimised and formalised through the founding of a research centre, the Community Operational Research Unit, located at Northern College, which later moved to its present location at the University of Lincoln, UK. In the 1980s, the OR Society also provided support for the Centre for Community OR at the University of Hull (later to be merged into the Centre for Systems Studies), and the Community OR Network of around 300 OR practitioners. The universities of Lincoln and Hull continue to actively practice and promote COR. More recently, in 2011, the OR Society created a Pro Bono OR scheme that connects volunteer analysts with good causesFootnote42,Footnote43.
Given the multi-faceted and often complex nature of COR projects, there appears to be no one particular OR approach that has emerged as dominant. There are, though, three streams of complementary, sometimes overlapping, approaches that have proven useful in multiple reported cases of COR:
Problem Structuring Methods (PSMs) are a collection of approaches that offer decision support by “way of representing the situation (that is, a model or models) that will enable participants to clarify their predicament, converge on a potentially actionable mutual problem or issue within it, and agree commitments that will at least partially resolve it” (Mingers & Rosenhead, Citation2004, p.531). The modelling effort may involve clarification of normative agendas through dialogue, as PSMs are largely founded on interpretivist or social constructivist epistemologies (Jackson, Citation2006). For more on PSMs see §2.20.
Critical Systems Thinking (CST) and Critical Systems Practice (CSP) focus on the distinction of a broad range of problem contexts and the development of systems-based methods appropriate to those contexts (Flood & Jackson, Citation1991a, Citation1991b; Mingers & Brocklesby, Citation1997). Having a broad range of systems methodologies to draw on is necessary but not sufficient for good practice. Consequently, Jackson (Citation2000) encapsulated the notion of good practice in his statement of three commitments of CSP: critical awareness, relating to critique of the different systems methodologies, and social awareness of the societal and organisational context; improvement, referring to the achievement of something beneficial, reflecting a cautious approach to the aspiration of universal liberation; and pluralism, the need to work with multiple paradigms without recourse to some unifying metatheory. For more on systems thinking, see §2.23.
Systemic Intervention (SI) developed out of CST and took as its two primary concerns critical reflection on boundaries of inclusion and exclusion (Churchman, Citation1970; Ulrich, Citation1983, Citation1987; Midgley, Citation2000) and methodological pluralism. Midgley (Citation2000) defines SI thus: “If intervention is purposeful action by an agent to create change, then systemic intervention is purposeful action by an agent to create change in relation to reflection on boundaries” (p.129). He shows how exploring boundaries informs the methodological design of a project, with the meaningful engagement of communities built in. For more on SI see section §2.23.
These three streams of approaches have much in common with action research (AR; Levin, Citation1994; Midgley, Citation2000; Mingers & Rosenhead, Citation2004) and, perhaps not surprisingly, AR has been a focus of a lot of COR work. Indeed, the Community Operational Research Unit explicitly articulated a working philosophy of AR following the traditions established in Latin America and Scandinavia (Thunhurst, Citation1992). Over the years, a considerable and diverse body of COR work has amassed, with some contemporary and notable examples including conference papers (e.g., Wong & Hiew, Citation2020), case-based research papers (e.g., Rosenhead & White, Citation1996; Deutsch et al., Citation2022; Paucar-Caceres et al., Citation2022; Pinzon-Salcedo & Torres-Cuello, Citation2022; Chowdhury et al., Citation2023), journal special issues (e.g., Johnson et al., Citation2018), project reports (e.g., Stephens et al., Citation2018) and edited books (e.g., Bowen, Citation1995; Ritchie et al., Citation1994; Midgley & Ochoa-Arias, Citation2004; Johnson, Citation2012a).
What counts as COR is not a simple matter though, and there have been several papers over the years that have critically discussed this (see for example the different understandings reflected in Midgley et al., Citation2018, and White, Citation2018). Importantly, Johnson and Smilowitz (Citation2012) suggest that some examples of COR might be more appropriately classed as capacity-building instead of “applications based on analytic models intended to provide specific policy and operational guidance to decision-makers in a way that extends existing theory and methods” (p.39). While some COR might indeed be classed as capacity building (for example, Boyd et al., Citation2007, are explicit that capacity building was part of their project), it is important not to confuse such interventions with those that are based on the use of models of a qualitative rather than quantitative nature. Indeed, the commitment to knowledge being embedded within the client organisation (Klein et al., Citation2007), handing over tools and techniques (Gregory & Jackson, Citation1992a, Citation1992b; Boyd et al., Citation2007; Gregory & Ronan, Citation2015) and self-organised learning (Herron & Mendiwelso-Bendek, Citation2018) serve to bring about capability-building alongside model building and the use of analytical approaches at the local level, which does not rule out modelling and data analysis. The needs and skills of citizens and associated groups have moved on since the 1980s, such that the tools of OR (data and models) are not so incomprehensible as they might previously have been regarded, and are familiar to most if not all citizens (Caulkins et al., Citation2008). Indeed, Hindle and Vidgen’s (Citation2018) work with the Trussell Trust on mapping food bank data demonstrates that charities can make good use of big data and data visualisation.
Although there are examples of COR projects being undertaken world-wide, sustained organised support has been most evident in the UK and US. Johnson (Citation2012a, Citation2012b) brought renewed interest to the field in the US with his promotion of a stream of activity that goes by the title of Community-Based Operations Research (CBOR). Johnson and Smilowitz (Citation2012) define CBOR as “a subfield of public-sector OR… that emphasizes most strongly the needs and concerns of disadvantaged human stakeholders in well-defined neighborhoods. Within these neighborhoods, localized characteristics vary over space and exert a strong influence over relevant analytic models and policy or operational prescriptions” (p.38). Complementary to the remit of CBOR is the Institute for Operations Research and the Management Sciences (INFORMS) Pro Bono Analytics® initiativeFootnote44.
Whilst COR, CBOR and pro-bono OR may be said to have a related remit, it is worth mentioning a key difference, “COR takes as its remit to work with (i.e., to take as its clients) disadvantaged community groups themselves” (Rosenhead, Citation2013, p.610), whereas CBOR and pro-bono OR are more focused on making OR and analytics available to third sector and public organisations. This distinction is not undisputed (Midgley et al., Citation2018), but the important thing is that such efforts, geared to meaningful community engagement, have not only enabled community access to OR, but have also provided a strong impetus for its theoretical and methodological development in a way that honours the legacy of OR’s early founders.
As we have an increasing number of ways to connect with others and form communities, it would be easy to assume that, going forwards, COR merely needs to develop new forms of practice to support communities in these different realms. But, in a VUCA (volatile, uncertain, complex and ambiguous) world (Bennis & Nanus, Citation1985), we must be alert to the need to challenge simple assumptions. Rather, there is a good argument for a critical turn in COR involving the explicit examination of underpinning values and ethics (Córdoba & Midgley, Citation2006; Jackson, Citation2006). Midgley and Ochoa-Arias (Citation2004) have already claimed that “if practitioners do not reflect on the different visions that it is possible to promote, then there is a danger that they will default to the understanding of community that is implicit in the liberal/capitalist tradition” (p.259). This brings with it missed opportunities to pursue more challenging and empowering practices that enable political activism and give some of the most marginalised people in our society a meaningful voice in OR projects. Much of COR has arguably been quite tame, doing good in local communities without challenging the political status quo (Wong & Mingers, Citation1994), but in an era of climate change, biodiversity loss, rising nationalism, insecure employment, mass migration, and increasing wealth inequality, a new, more critical agenda for COR is urgently needed.
3.3. Cutting and packingFootnote45
Cutting and packing (C&P) problems are geometric assignment problems, in which small items are assigned to large objects such that a given objective function is optimised and two basic geometric feasibility conditions hold, specifically containment and non-overlap. They appear in a wide range of settings, but are most commonly investigated for applications in manufacturing and transportation. For example, cutting pattern pieces from material or packing boxes into containers. These are combinatorial optimisation problems and -hard. Depending on the size or geometry of the problem, there exists strong formulations that can be solved using exact methods. However, there remains many open problems that have instances that cannot be solved to optimality, or computational times are impractical for applications in practice. Moreover, there are problems where bounds are weak and only toy instances can be solved to optimality. As a result, heuristics remain an important tool in C&P.
Given the wide variety of C&P problems, Dyckhoff (Citation1990) and later Wäscher et al. (Citation2007) defined a typology of problems using the following dimensions:
3.3.1. Objective function
Output maximisation: packing the greatest value of items in a given fixed dimension finite number of large object(s).
Input minimisation: pack all items using the minimal number of fixed dimension objects or the minimum size large object with at least one unconstrained dimension.
3.3.2. Assortment of small items (items to be packed)
All items are identical.
Weakly heterogeneous: few item types given the total number of items.
Strongly heterogeneous: many item types that are unique or have few copies.
3.3.3. Assortment of large items
Single large object: fixed dimension for output maximisation, open dimension(s) for input minimisation.
Multiple large objects: fixed dimension, either identical or heterogeneous.
These distinctions lead to named problem types, e.g., bin packing problems (BPP) are input minimisation problems, with strongly heterogeneous small items and multiple large objects, while a knapsack problem (KP) shares the same characteristics but is an output maximisation problem. Note that problem names and their definitions are not universally accepted or consistently used, so researchers should check the articulated problem definition in the paper when selecting literature.
The following focuses on two-dimensional (2D) and three-dimensional packing (3D) as these include the unique challenges of the geometric constraints associated with C&P problems. One-dimensional (1D) problems remain interesting and challenging (see Martinovic et al., Citation2018; Munien & Ezugwu, Citation2021). For an introduction to C&P, see Scheithauer (Citation2017).
3.3.4. Geometry
Handling the geometric characteristic of C&P problems adds significantly to the computational burden and the number of variables needed in a model. These increase with the spatial dimensions and with the irregularity of the shape of the small items. For 1D problems, the geometric constraints of overlap and containment are trivial. Regular shapes (rectangles, boxes, circles, spheres) add complexity through additional item location variables x, y (and z) co-ordinates, and dimensions: length, width (and depth). However, the common characteristics of the shape mean these are straightforward to model. Pairwise constraints between items and between each item and the boundary of the large object ensure feasibility.
In the case of irregular shaped items, accurate non-overlap constraints cannot be reduced to comparing a set of common dimensions. While the item location is still determined by a defined origin, the arbitrary nature of the shape significantly increase the complexity of assessing geometric feasibility. At a basic level, it requires testing for edge intersections between items and containment of one item inside another. Methods to reduce the complexity include the nofit polygon, raster method and phi-functions in 2D and voxels and phi-functions in 3D. Bennell and Oliveira (Citation2008) provide a tutorial in geometric methods for 2D nesting problems. Lamas-Fernandez et al. (Citation2022) describe approaches for modelling 3D geometry. Developing solution methods for irregular packing problems requires a comprehensive, fast and robust geometry library.
3.3.5. Constraints
There exists a wide range of practical constraints arising from the applications. These may relate to the material being cut having defects or quality variability, the cutting tool requiring space between items or constraints on the types of cut. There may be sequencing constraints or assignment constraints that include precedence or prevent/require the packing of items together. In 2D rectangle C&P, a common requirement is guillotine cuts where all cuts must be orthogonal and span the entire width or breadth of the rectangular material sheet. Furthermore, the number of alternate cuts (e.g., a switch from vertical to horizontal cuts) may be restricted. Applications in 3D container loading provide a challenging set of constraints on the arrangement of boxes to ensure weight distribution, horizontal and vertical stability of load and consider the weight baring strength of the stacked boxes. Bortfeldt and Wäscher (Citation2013) describe the different types of constraints and their adoption by researchers.
3.3.6. Two-dimensional problems
In two dimensions, research has focused on rectangle packing problems, and irregular shape packing problems, often called nesting problems. There is also a smaller body of literature on circle packing (Hifi & M’Hallah, Citation2009).
Exact solution approaches to the 2D rectangle packing problem are reviewed by Iori et al. (Citation2021) and cover the main problem types. The paper evidences the recent advances in exact methods for these problems while identifying a number of open problems that remain very challenging. Specifically, they identify the open-dimension problem, some specific instances of BPP, and problems with multiple heterogeneous large objects. Moreover, nesting problems remain a rich area of research for developing high fidelity and scalable exact methods.
Heuristics and metaheuristics are a natural choice, particularly for problems with a large number of small items. Early research focused on placement heuristics such as First Fit and Next Fit for BPP (Coffman Jr. et al., Citation1980), Bottom Left and Bottom Left Fill for open dimension problems (Albano & Sapuppo, Citation1980; Chazelle, Citation1983; Burke et al., Citation2004b). These place items into the large object in a given sequence according to the placement rule and observing any additional placement constraints. A natural evolution of this approach is to apply a metaheuristic to re-sequence the packing order to obtain better solutions, of which there are many examples.
The 2D rectangle identical item packing problem is known as the manufacturer’s pallet loading problem. Research is mature with exact methods and heuristics that perform well across benchmark instances. Silva et al. (Citation2016) comprehensively review these problems. Fewer papers have looked at the case where the small item is irregular, for example cutting metal blanks (e.g., Costa et al., Citation2009).
Output maximisation problems focus on the 2D rectangle knapsack problem, with few articles considering problems with weakly heterogeneous data. Problems cover guillotine and non-guillotine cutting and item values may be equivalent to area or have an assigned value. Furthermore, the constrained variant places upper and lower bounds on the number of each item type placed. The guillotine variant where area and value align has a fast exact method (Oliveira & Ferreira, Citation1990). Non-aligned item values and non-guillotine cutting is still challenging. Cacchiani et al. (Citation2022b) includes a summary of 2DKP. Packing a single large object is often a component of a larger practical problem, where the decision problem of whether a set of rectangles will fit into a fixed dimension rectangle, referred to as a 2D orthogonal packing problem, is of interest (Clautiaux et al., Citation2007).
Cutting stock problems have been studied for over 60 years with the seminal paper by Gilmore and Gomory (Citation1965) that described the column generation approach for 2D rectangle cutting stock problem with guillotine cuts. Most papers focus on ILP/MILP approaches. A notable feature of these problems and how they differ from the BPP, is the way solutions are constructed arising from the data instances. Since there are few item types, but many items of each type, the solutions are composed of pattern types that are repeated across multiple stock sheets leaving a residual problem of unmet demand.
Bin packing problems have been extensively studied and include the guillotine and non-guillotine variant. Lodi et al. (Citation2014) provide a review of BPPs. Early heuristic approaches (Berkey & Wang, Citation1987) include two-phase algorithms that pack multiple bin width strips and then solve a 1D BPP where the item size is the height of the strip, while single-phase algorithms pack directly into the bins either using a level packing approach or a placement heuristic such as bottom-left. Increasingly, researchers are focusing on exact methods; see for example Pisinger and Sigurd (Citation2007) who use branch and price for variable size and fixed size bins. There are very few examples of bin packing with irregular shapes, where one example is glass cutting (Bennell et al., Citation2018).
The open dimension problem variant is often called the strip packing problem. This can be formulated as a linear mixed integer programme, although practical size problems are still very challenging. Martello et al. (Citation2003) develop bounds by relaxing the problem so it can be solved as a one dimensional BPP. Placement heuristics (bottom left and bottom left fill) based on sequencing of items within a (meta)heuristic framework are widely used. Hopper and Turton (Citation2001) undertook an extensive analysis of this type of approach.
Nesting problems, where the small items are irregular, are commonly formulated as open dimension problems. Solution approaches are dominated by the use of heuristics and metaheuristics. Bennell and Oliveira (Citation2009) provide a review of these methodologies including using exact models to improve local optima. This approach is also used by Stoyan et al. (Citation2016) who use phi-functions, which allow orientation as a decision variable. In the last decade, researchers have developed formulations that can be solved to a global optimum for small problems. Toledo et al. (Citation2013) approximates the items and the packing area to a discrete set of points allowing the problem to be solved as a MIP model. Alvarez-Valdes et al. (Citation2013) used the nofit polygon to define a finite set of convex spaces and used binary variables to activate constraints.
3.3.7. Three dimensional problems
These problems are solved across the range of problem types, largely considering single container output maximisation, multi-container input minimisation and the open dimension problem. For packing boxes, the mix of constraints addressed across the literature is inconsistent and frequently not congruent with industry standards. Solutions to the problem focus on building walls, layers or blocks of identical boxes. See Zhao et al. (Citation2016) for a comparative review of algorithms including exact methods. Recent papers are now looking at the additional constraints arising from a vehicle, such as axle load and stability under breaking and acceleration (see Ali et al., Citation2022). 3D packing of irregular shapes is an open problem that had increasing relevance in areas such as additive manufacturing. Efficient handling of the geometry is a significant factor in the solution approach along with the level of fidelity required for the application.
3.3.8. Data
Across all problem types there are standard data sets and data generators that provide a useful means to test the effectiveness of solution approaches. Many of these are listed on the EURO Special Interest Group on Cutting and Packing (ESICUP) websiteFootnote46.
3.4. Disaster relief and humanitarian logisticsFootnote47
Humanitarian logistics (HL) is one of the key application areas that Operational Research (OR) has been offering solutions to improve the welfare of the society under difficult circumstances. Humanitarian logistics problems are highly relevant in today’s world due to various challenges including but not limited to, climate change and its consequences (increases in extreme weather events such as heatwaves, floods), natural disasters (e.g., earthquakes, tsunamis), man-made conflicts (e.g., Syria and Ukraine crises) and health-related catastrophic events (e.g., pandemics). Humanitarian logistics operations involve complex systems with multiple stakeholders such as victims, planners, public/private service providers, volunteers, general public and media, each with their own preferences and priorities; and the inherently challenging decisions of scarce resource allocation have to be made over a long time span, under high uncertainty. We use humanitarian logistics as an umbrella term, which covers relief logistics, disaster logistics, and development logistics. The humanitarian literature uses all these terms interchangeably. Actually, disaster logistics and relief logistics should refer to the cases where a disaster is/was/is expected to be in action whereas development logistics refers to cases which aim to improve daily life.
In relief logistics, the operations require advanced planning, hence the authorities are constantly facing challenges in the four main stages of: mitigation, preparedness, response, and recovery (Altay and Green III Citation2006; Çelik et al., Citation2012; Kara & Savaşer, Citation2017). In , we list some of the most frequently considered problems, categorised based on the phase that they arise. As seen in the table, mitigation and preparedness phases mostly consist of activities related to planning, which involves network design, location, allocation and routing operations as well as provisioning processes that include inventory and other supply chain-related decisions (see, e.g., Balcik & Beamon, Citation2008; Rawls & Turnquist, Citation2010, for applications in location and prepositioning, respectively).
Table 3. Problems in relief logistics.
Response activities occur after the crisis or the disaster hits. In this phase, the aim is providing a rapid response, prioritising the survival needs. This, however, does not preclude considering efficiency in these operations as the system requires scarce resource allocation such as personnel, equipment and supplies across demand points, invoking a need for good decision support mechanisms. In line with this need, a large body of work is devoted to the application problems arising in this phase. Finally, recovery phase focuses mainly on debris management and infrastructure repair and restoration. Most of the mentioned operations involve additional decisions regarding workforce planning and scheduling and require structured methods for data management, information sharing and coordination, which are key for effective response (Altay & Labonte, Citation2014). Some of these models require quantification of human suffering due to lack of services or goods and the deprivation cost can be used for this purpose, as discussed in detail in Holguín-Veras et al. (Citation2013).
Not all humanitarian operations are triggered by challenges stemming from a single well-defined event. There are crises that can not be attributed to a single cause e.g., famine in under-developed countries. There are well-established efforts in the development logistics literature to alleviate the effects of such crises. Some examples are global health projects for increasing access to health coverage and fighting diseases that occur in low and middle-income countries on a wide-scale, such as malaria and AIDS, through distribution of effective tools and/or medication. Vaccine development and distribution to poorer regions as well as distribution of other basic needs to the deprived populations: food aid distribution (Rancourt et al., Citation2015; Mahmoudi et al., Citation2022), clean water network design and distribution (Laporte et al., Citation2022), energy, education and hygiene provision are also widely considered. A recent trend is utilising cash and voucher distribution whenever possible, since it is a method that respects human dignity, avoids complications of relief item logistics and supports the local market (Karsu et al., Citation2019).
The recent COVID-19 pandemic has also motivated a wide range of HL applications such as personnel protective equipment allocation and distribution, frontline workforce planning and system design for testing, tracing and vaccination (Farahani et al., Citation2023).
The HL literature also integrates newer technologies to the delivery systems: There has been recent attempts to use drones in the last mile distribution as they constitute a convenient tool to reach remote areas in short time (examples include delivery of blood samples, vaccines and food aid; see also Gentili et al., Citation2022; Ghelichi et al., Citation2021; Alfandari et al., Citation2022).
OR offers decision support for humanitarian settings based on a wide range of quantitative and qualitative tools. Mathematical modelling and optimisation is used in almost all problems arising in HL to make the related location, allocation, routing and network design decisions. The models are shaped by the priorities in the phase and constraints imposed by the physical infrastructure, resource availability as well as the social, economic and cultural environment. As the underlying technical problems are difficult to solve, various mathheuristic and metaheuristic approaches are employed. There is also an increasing trend in using system dynamics (Besiou & Van Wassenhove, Citation2021) and empirical analysis (Pedraza-Martinez & Van Wassenhove, Citation2016).
There is no one-size-fits-all methodology but some key properties require specific methods to be used. In most relief logistics problems the environment is highly stochastic, calling for applications of forecasting and stochastic programming. The uncertain factors include but are not limited to the number of affected individuals, the extent of the effect, types of needs, and usability status of the infrastructure and other resources. Multiple stakeholders and conflicting criteria are involved, requiring multicriteria decision making (Ferrer et al., Citation2018) approaches. Unlike commercial logistics systems, fairness is a key concern in humanitarian settings. Fairness or equity, however, is hard-to-quantify and is context dependent: a rule that is considered fair under some circumstances may not be deemed so in others. The policy makers may want to prioritise beneficiaries based on attributes such as socio-economic status and hence ensure vertical equity or may consider them indistinguishable and seek horizontal equity (Karsu & Morton, Citation2015).
HL has been receiving attention with an increasing rate, which led to many review studies that the interested reader can refer to: see, e.g., Luis et al. (Citation2012); Çelik (Citation2016); Aringhieri et al. (Citation2017); Besiou et al. (Citation2018); Baxter et al. (Citation2020); Dönmez et al. (Citation2021). See also Kunz et al. (Citation2017) for a discussion on how to make humanitarian research more impactful for humanitarian organisations and beneficiaries.
Next we categorise the future of the humanitarian applications to motivate and direct new researchers:
OR is responsive to the difficulties the world is facing and humanitarian challenges are no exception to this. The recent COVID-19 pandemic has shown that relief logistics can be applied in health-related crisis management to provide quick, effective, efficient and fair responses to health care problems. WHO “urges countries to build a fairer, healthier world post-COVID-19” and this is doable with good humanitarian practices relying on OR. The recent efforts in designing fair and efficient systems using OR would contribute in addressing inequities in health and welfare, which have been exacerbated by the pandemics. We believe that there is still room for improvement in adopting a holistic approach and conducting multidisciplinary work when designing such systems. One example is the vaccine implementation and roll-out problem: conceptualising this problem as a sole logistics problem may not be the best practice as the success of any design highly depends on human behaviour. People have different views, risk attitudes and preferences over available options, which affects how any proposed policy will perform. Incorporating such behavioural factors is an important yet scarcely studied issue.
The underlying technical problems in the HL domain are hard to solve due to uncertainty in various parts of the system, lack of (reliable) data and multiple criteria that are involved. Moreover, a significant portion of these problems are combinatorial optimisation problems, i.e., they require choosing from a prohibitively large set of solutions that are implicitly defined by constraints of the system. Therefore advances in OR methodology to obtain better, quicker solutions to optimisation problems, and in data analytics on handling big data such as the one obtained through geographic information systems (GIS), would pave the way for quicker and better response. Effective data analysis would especially help when learning from past practice. Indeed, lessons learned from humanitarian supply chain practice can also be used in managing supply chain disruptions in other sectors, as discussed in (Kovács & Falagara Sigala, Citation2021).
UN’s Sustainable Development Goals emphasise the global challenges faced including poverty, inequality, climate change, environmental degradation, peace and justice (SDG Citation2022). As stated in (Street et al., Citation2016), “Increases in extreme weather events and climate change can compound risks of international food shocks, water insecurity, conflict and other humanitarian emergencies and crises. Difficulty of access to critical resources such water and food may trigger migrations or exacerbate conflict risks.” All these areas are, by definition, related to humanitarian operations, hence humanitarian logistics has a lot to offer in these domains.
The Turkey/Syria earthquakes in February 2023 have clearly demonstrated the importance of effective coordination and strategic planning. Thus, we would like to emphasise the need for collaborative research that brings field expertise (of e.g,. municipalities, NGOs and volunteers) and academic know-how together.
3.5. E-commerceFootnote48
3.5.1. What is E-commerce about?
E-commerce deals with the transactions of goods and services through online communications (computers, tablets, smartphones, etc.). Both business-to-business (B2B) and business-to-consumer (B2C) realisations are observed in practice. In B2B, companies operate their supply chains through online networks. In B2C, products and services are sold directly to consumers. E-commerce sales steadily increased for years and amounted to $5,211 billion worldwide in 2021, with the pandemic being a major contributor.Footnote49Footnote50
E-fulfilment describes all fulfilment activities for e-commerce. All necessary steps for a customer to receive an order after placing are thus referred to as the e-fulfilment process. Due to the nature of the e-commerce domain, these e-fulfilment activities often occur in a city context (Savelsbergh & Van Woensel, Citation2016). E-fulfilment processes are planning intensive, and creating a profitable business in this environment is challenging. Customer service expectations are high, however, and the customer is more and more in the lead on how and where their orders need to be delivered (the “logsumer” takes an active role in time, price, quality, and sustainability decisions of logistic services DHL, Citation2013).
The e-fulfilment process can be divided into three steps, namely (i) order acceptance, (ii) order assembly, and (iii) order delivery (Campbell & Savelsbergh, Citation2005). For most online companies, these steps take place separately, one after the other. However, new on-demand companies have considerably shortened lead times and perform these steps simultaneously (Waßmuth et al., Citation2022).
During order acceptance, customer requests arrive on a retailer’s website and ask for service. As fulfilment capacities are limited (for example, delivery capacities), the retailer wants to accept the most profitable subset of all customer requests. However, customer requests arrive one at a time. Thus, the retailer does not know the total delivery costs until all customers are accepted and the final delivery route is planned. In addition, when a request is accepted, the retailer does not know whether requests with higher revenues will arrive afterward for which capacity should have been reserved. To estimate costs, vehicle routing methods are adapted for usage as customer acceptance mechanisms (e.g., Ehmke & Campbell, Citation2014; Köhler & Haferkamp, Citation2019)). Revenue management methods are used to allocate capacities to high revenue requests (e.g., Cleophas & Ehmke, Citation2014; Klein et al., Citation2019)). However, since decisions in the online environment must be made instantly, the use of complex and, thus, computationally intensive solution methods is limited.
The warehouse picking and consolidating ordered goods are summarised under order assembly. Before this, the retailer must decide on the location and design of the warehouses. Choosing the location is closely linked to the fulfilment capacity of the retailer and must be well-planned. The design of the warehouse determines the efficiency of picking the ordered items. Finding efficient picking strategies to reduce retailer costs is studied in, for example, Schiffer et al. (Citation2022). Lastly, the retailer must determine the optimal stock level of items. Given the short lead times in e-commerce, this task must be completed before customer requests arrive. The task is closely linked to the research field of inventory management, where techniques such as forecasting (Ulrich et al., Citation2021) or artificial intelligence (Albayrak Ünal et al., Citation2023) are commonly used to address this challenge effectively.
For order delivery, routes are planned for all accepted orders. For e-commerce, the last-mile delivery is usually towards the customer’s location, i.e., the consumer’s home or company site (Agatz et al., Citation2008), leading to a magnitude of fragmented delivery locations with small drop sizes. Significant challenges arise from how these last-mile deliveries (routes) are designed. Delivery route planning is closely related to the established field of vehicle routing, and approaches are being adapted for use in e-fulfilment (e.g., Emeç et al., Citation2016). Two-echelon routing systems are often considered to maintain economies of scale and satisfy the emission zone requirements in the cities (Sluijk et al., Citation2022a, Citation2022b)). In most cases, delivery is made by conventional delivery vehicles. However, individual retailers are also starting to bring orders to customers in the city centre using bikes. We also see drones (e.g., Ulmer & Thomas, Citation2018; Dayarian & Savelsbergh, Citation2020)) and robots (e.g., Simoni et al., Citation2020).
3.5.2. E-fulfilment challenges
E-fulfilment processes present several challenges. For unattended deliveries, delivery is possible without the customer being present. Pick-up point delivery enhances the efficiency of the delivery operations via consolidation opportunities. Consumers can also find it a more convenient delivery option than waiting for the delivery at home. There is a need for incentive mechanisms to increase the attractiveness of pick-up points (e.g., reduced delivery price). Galiullina et al. (Citation2022) study this problem as a trade-off between routing cost savings gained from steering the customer demand and the investments required to influence customer behaviour. Another challenge is to find the optimal locations for pick-up points, such that delivery costs are minimised and customers still have convenient access, which is, for example, considered in Lin et al. (Citation2020b) and Wang et al. (Citation2020). The customer must accept the delivery herself for attended deliveries, e.g., to prevent grocery spoiling. To avoid delivery failures, the customer and the retailer usually agree on a delivery time window.
Customers expect short time windows, which increase the retailer’s delivery costs (Köhler et al., Citation2020). As the time windows assignment to orders is crucial for the retailer’s profitability, several approaches consider balancing demand along the offered time windows. One possibility is to withhold specific time windows from customers and only offer a subset of beneficial time windows. Campbell and Savelsbergh (Citation2005) and Cleophas and Ehmke (Citation2014) consider routing costs and customer value and only offer time windows to customers that are expected to maximise the profit. Another possibility is to assign prices to time windows to nudge customers to specific time window options (Campbell & Savelsbergh, Citation2006; Yang et al., Citation2016; Klein et al., Citation2019). Some approaches consider adapting the time window design to increase routing flexibility. Köhler et al. (Citation2020) only offer short time windows to customers when it does not impact the routing costs too much, and Strauss et al. (Citation2021) hand out time window bundles to customers that are only narrowed down to one option once more customers requests are known.
Recently, many online retailers began offering on-demand deliveries, so customers can receive their orders the same day (some grocery stores promise delivery times within a few minutesFootnote51). Shortening lead times poses another challenge as there is almost no time for planning or consolidation of orders available. The approach presented by Klapp et al. (Citation2020) hence supports retailers in deciding which customers can be promised an immediate delivery and which can only be served from the next delivery day. Ulmer and Thomas (Citation2018) investigate how the number of same-day deliveries can be increased if delivery is not only done by vehicles but additionally by drones. In Banerjee et al. (Citation2022), the authors examine how retailers must allocate their delivery capacity to cover same-day delivery needs per service area.
For delivery in an urban context, high demand in densely populated areas often goes hand in hand with high traffic and unreliable travel times, and vice versa. Ehmke and Campbell (Citation2014) therefore create acceptance mechanisms that present the customer with a time window offer that is as reliable as possible so that the customer does not notice an unforeseen change in travel times. Köhler and Haferkamp (Citation2019) test the suitability of customer acceptance mechanisms for more and less densely populated areas to derive how well different routing mechanisms approximate delivery times.
Another ongoing challenge is the increasing prevalence of customers being granted the option to return ordered items free of charge by many companies. As a result, the e-fulfillment process expands beyond the three steps outlined earlier to include the management of returns. Despite the typically high return rates that result in substantial additional costs for retailers, offering a return option is still profitable due to the subsequent improvement in customer satisfaction and retention (Rintamäki et al., Citation2021). The management of returns can be perceived as reverse order delivery, leading to routing challenges related to those presented earlier. To mitigate costs, several studies, such as Mahar and Wright (Citation2017) and Yan et al. (Citation2022b), explore the implementation of in-store returns.
3.5.3. Operational research challenges: Time, timing, and data
The time dimension involves all dimensions to how key elements are (conceptually) modelled with regards to the time (e.g., travel times or handling times). Identifying the time features in modelling and solution methodologies are essential qualifiers for realistic model representations.
The timing dimension involves all actions at a particular point or in a period when something happens (e.g., a new order arrives). Timing considers synchronisation issues where, for example, vehicles need to meet at a certain point in time and geographical location. Drexl (Citation2012) presents a survey of vehicle routing problems with multiple synchronisation constraints. Synchronisation requirements between the vehicles relate to spatial, temporal, and load aspects. Synchronisation is a challenge, for example, in heterogeneous fleets (Ulmer & Thomas, Citation2018) or, in the case of battery-powered vehicles that must be charged in time.
Offline means that we do the planning and scheduling before the execution, often assigned to tactical planning. Data is estimated (forecast) based on past observations, and the operations are planned based on that. For example, Agatz et al. (Citation2011) use expected demand to decide which time windows should be offered within different parts of the delivery area. Lang et al. (Citation2021a) propose a preparation offline phase that serves as input to speed up decisions during later online customer acceptance. The data considered could be either time-independent (i.e., independent of time) or time-dependent (i.e., the data has a time-stamp). For example, travel times can be modelled time-independent (i.e., constant speed) or time-dependent (e.g., Spliet et al., Citation2018).
Online refers to the optimisation in real-time, where revealing new data and planning and scheduling operations happen simultaneously. The terms “dynamic” or “operational planning” is also often used. As time is critical in online planning, methods are always limited by their solution time. Instead of finding a routing solution, delivery costs are approximated (e.g., Yang & Strauss, Citation2017; Lebedev et al., Citation2021) or a simple routing heuristic is applied (e.g., Mackert, Citation2019; Klein et al., Citation2018)). Alternatively, customer choice is estimated simply (e.g., Campbell & Savelsbergh, Citation2006) instead of complex and time-consuming customer choice modelling. van der Hagen et al. (Citation2022) uses a machine learning approach to fasten up feasibility checks of time windows offered during order acceptance.
The data dimension refers to how the data and observations are modelled. The data can be handled deterministic or stochastic, or we observe the realised data. Most models assume deterministic data and build their solution approach around this notion. More and more researchers, however, recognise the challenge of adequately representing reality in their models. Yang et al. (Citation2016) use booking data of an online grocer to estimate realistic customer behaviour. Köhler et al. (Citation2022) investigate how to accept high revenue requests by applying a sampling procedure with booking data from an e-grocer in Germany.
3.5.4. Relevant literature
Agatz et al. (Citation2013) provide the first overview of how retailers can manage e-fulfilment processes. A recent review on e-fulfilment for attended home deliveries can be found in Waßmuth et al. (Citation2022). We refer the reader to Fleckenstein et al. (Citation2022) and Snoeck et al. (Citation2020) for a focus on routing and revenue management methods in e-fulfilment, respectively.
3.6. EducationFootnote52
Education spans activity from kindergarten, through primary and secondary schooling, to higher education. The earlier years of education are often compulsory reflecting the premise that an educated workforce is crucial to economic performance. The extent to which education is publicly funded varies from one level of education to another, as well as from one country to another depending on the local view concerning the social return on investment. Public funding for education alongside the role education and training play in the performance of an economy therefore make education a prime context for application of operational research (OR) tools. This section provides a brief overview of some of the main areas.
Many OR methods can be useful to the policy maker for macro-planning and financial allocation purposes. Forecasting student numbers can be done using Markov chain models (Nicholls, Citation2009; Brezavšček et al., Citation2017) or machine learning (ML) and artificial intelligence (AI) (Yan & Wang, Citation2021) – the importance of AI applications to education will be further expanded later. Allocation of finances is typically supported by multi-objective decision analysis (Cobacho et al., Citation2010).
One important aspect of resource allocation relates to the efficient use of resources. Availability of published education data in many countries provides an opportunity to examine the “black box” of education production. Consequently, there is a long-standing literature surrounding efficiency in education, typically a not-for-profit context where conventional measures of performance are inappropriate.
Early studies of efficiency in higher education applied deterministic ordinary least squares methods to university-level data to examine efficiency in the production of specific outputs (Jauch & Glueck, Citation1975; Johnes & Taylor, Citation1990) while schools adopted multilevel modelling methods to derive performance insights from pupil-level as opposed to school-level data (Woodhouse & Goldstein, Citation1988). But the multi-product nature of production in education establishments means that looking at inputs separately provides only a partial picture. The tools of multiple-criteria decision analysis such as principle components, he analytic hierarchy process and co-plot have therefore been adopted to examine and visualise the many dimensions more easily (Johnes, Citation1996; Paucar-Caceres & Thorpe, Citation2005; Mar-Molinero & Mingers, Citation2007).
Two frontier estimation approaches to analysing efficiency, both of which derive from Farrell (1957), have evolved to address various shortcomings of early approaches. The non-parametric data envelopment analysis (DEA) easily handles the multi-input multi-output nature of production observed in education and provides easily-interpreted measures of efficiency (Charnes et al., Citation1978). DEA shows each observation in its best possible light (in efficiency terms) by computing a distinct set of input and output weights. This permits the derivation of benchmark observations for each inefficient institution, i.e., the establishment(s) the observation should be looking to emulate to become more efficient. Non-parametric frontier estimation techniques have been applied in the context of education at all levels, providing management information at the institution level, and policy insights at the macro-level (Thanassoulis et al., Citation2011; Portela et al., Citation2012; Burney et al., Citation2013).
Network DEA provides a more forensic examination of the “black box” (Färe & Grosskopf, Citation2000) by breaking down the production process into its component parts, and overall efficiency can be decomposed into efficiency in each of the stages (Wang et al., Citation2019b; Lee & Johnes, Citation2022).
When longitudinal data are available, DEA can be used to analyse changes in efficiency using the Malmquist (Citation1953) productivity index which decomposes productivity change into efficiency and technological change components Wolszczak-Derlacz (Citation2018). The method can be used to make comparisons between groups rather than (or as well as) between time periods (Aparicio et al., Citation2017).
The deterministic non-parametric nature of DEA has been addressed in numerous extensions including by introducing bootstrapping and significance tests (Johnes, Citation2006; Essid et al., Citation2010; Papadimitriou & Johnes, Citation2019). Second stage analyses which examine the determinants of efficiency also abound (Haug & Blackburn, Citation2017). This approach is only valid if the hypothesis of separability holds i.e., the variables used in the second stage should only influence the efficiency scores and not the determination of the efficiency frontier (Simar & Wilson, Citation2011). The development of separability tests (Daraio et al., Citation2018) and the robust conditional estimation approach address these issues (Daraio & Simar, Citation2007); their application in education provide more robust and insightful results (López-Torres et al., Citation2021).
Stochastic frontier analysis (SFA) provides both parameter estimates (with significance tests) and efficiency estimates which allow for stochastic errors (Aigner et al., Citation1977; Meeusen & van den Broeck, Citation1977; Jondrow et al., Citation1982). Compared to DEA it is more difficult to model multi-input, multi-output production; most SFA applications in education therefore focus on cost efficiency (Agasisti, Citation2016), or a single output model (Kirjavainen, Citation2012), although there are some exceptions (Abbott & Doucouliagos, Citation2009; Johnes, Citation2014). The parameter estimates have made SFA popular in the cost function context as scope and scale economies can be estimated and these have useful policy implications (Johnes et al., Citation2005; Johnes & Johnes, Citation2013).
In its basic form, SFA parameter estimates apply to every observation in the dataset. Extensions of the technique include latent class SFA and random parameters SFA which allow the parameters to vary by specific groups (latent class) or by each observation (random parameter). These approaches benefit from the advantages of DEA and SFA although are computationally demanding but have been applied in education to interesting effect (Johnes & Schwarzenberger, Citation2011; Johnes & Johnes, Citation2016).
The interested reader is referred to comprehensive reviews of the relevant literature (Kao, Citation2014; Thanassoulis et al., Citation2016; De Witte & López-Torres, Citation2017; Johnes, Citation2022).
All these OR methods can be applied in the contexts of macro- and micro-level planning and budget allocation. One area at the micro-level for which OR techniques are useful is timetabling. Timetabling of examinations and/or teaching is most complex at secondary and tertiary levels and can be viewed as a scheduling problem whereby resources, limited in supply, are allocated to a constrained number of times and locations, with the allocation satisfying stated objectives. Timetabling differs from scheduling in that the resources (staff members) are typically specified in advance rather than being a part of the allocation problem; and while scheduling aims to minimise costs, the objective of timetabling is to realise desirable objectives (e.g., no clashes) as closely as possible (Petrovic & Burke, Citation2004). Timetablers face both hard and soft constraints in constructing the timetable (Asmuni et al., Citation2009) and this is therefore a problem which lends itself to solution by various possible OR techniques in the field of combinatorial optimisation. The main approaches are briefly summarised below.
Mathematical programming (particularly integer linear programming) is commonly used in timetabling (Cataldo et al., Citation2017) but often leads to computationally demanding problems. Heuristics (see below) are introduced for increased efficiency (Dimopoulou & Miliotis, Citation2001). Case-based reasoning approaches use a past solution (stored in the case base) as the starting point for a new timetable and use similarity measures to identify the optimal solutions (Burke et al., Citation2006). These approaches are often problem-specific making them non-transferable. Their computational demands can be addressed by using heuristics (Petrovic et al., Citation2007). The multi-criteria approach assumes that there are solutions to the timetabling problem satisfying the hard constraints and then the quality of these solutions is assessed on the basis of how well each one satisfies the soft constraints (Burke & Petrovic, Citation2002). As with other methods it is often combined with heuristics.
Heuristics are an increasingly common method for application to timetabling either on their own or in combination with other methods. Low level construction heuristics include largest degree, largest weighted degree, largest colour degree, largest enrolment, saturation degree and random. Extensions include meta-heuristics which work in the search space guiding neighbourhood moves to a solution (Qu et al., Citation2015); fuzzy heuristics which can find a best approach in the initial timetable construction phase (Asmuni et al., Citation2009); and hyper-heuristics which find or generate appropriate heuristics to solve complex search problems as encountered in timetabling (Qu et al., Citation2015). Given their focus, hyper-heuristics have the potential to provide more generalised solutions to timetabling problems than other approaches (see Pillay, Citation2016, for a review).
The interested reader is referred to reviews of educational timetabling approaches (Oude Vrielink et al., Citation2019; Tan et al., Citation2021).
Finally, an emerging area of interest is the application of AI and ML to education. AI and ML are, as already highlighted, useful for forecasting as they can analyse rich data on, for example, student numbers, retention, achievement, teaching and quality to derive better predictions and/or understanding of the challenges (Alyahyan & Düstegör, Citation2020; Bates et al., Citation2020; Teng et al., Citation2022). They can also be used in the teaching and learning process itself by personalising each student’s experience for example through use of chatbots, by creating exercises for students which address their weaknesses, and by reviewing assessments highlighting strengths and weaknesses (Teng et al., Citation2022). In the growing distance learning education arena where it is more difficult to manage participants who have more freedom to learn when they want and may encounter more distractions, AI can be used to support teachers in gauging student engagement. Thus AI algorithms can be used to develop an online education classroom management system (Wang, Citation2021). AI and ML have much to offer in education but their potential across all disciplines has yet to be properly explored (Bates et al., Citation2020). See Zawacki-Richter et al. (Citation2019) for further literature.
3.7. EnvironmentFootnote53
Environmental problems are at the centre of societal concerns, and of many research activities, also in Operational Research (OR). It is impossible to comprehensively present this literature. Instead, we first introduce characteristics of environmental problems, then present some insights from specific OR fields, mainly citing review articles. Thereafter, we discuss Decision Analysis (§2.8) methods applied to environmental problems.
Environmental problems are usually multi-faceted and complex (French & Geldermann, Citation2005; Gregory et al., Citation2012; Reichert et al., Citation2015). Since 50 years, such public policy issues are known as “wicked problems” (Rittel & Webber, Citation1973). In many environmental cases, uncertainties are high. It may be difficult to establish scientific knowledge and adequately model environmental systems. They usually span all sustainability dimensions, which requires making trade-offs between achieving environmental, economic, and societal objectives. Various decision-makers and stakeholders with different world-views are affected, sparking conflicts of interest. Any action may have irreversible or far-reaching consequences over long time horizons. Additionally to the temporal dimension, spatial considerations over varying geographic regions may be important. As wicked problems are typically unique, we might need to find new solutions in each case. OR methods can be highly suitable to disentangle and structure complex environmental problems, and can certainly contribute to problem solving. Below, we present some viewpoints.
Soft OR methodologies, and problem structuring methods (PSMs; see also §2.20) have been developed to tackle complex real-world problems in interaction with stakeholders (Rosenhead & Mingers, Citation2001; Smith & Shaw, Citation2019). However, most (review) articles are not specific to environmental problems. Using an applied example, White and Lee (Citation2009) explored the potential of soft OR for a city development case. Marttunen et al. (Citation2017) reviewed the combination of PSMs with Multi-Criteria Decision Analysis (MCDA) methods. More complex PSMs seem to be under-utilised, suggesting that their benefits cannot sufficiently inform real-world issues, including environmental decision-making. Similarly, French (Citation2022) argued that literature of quantitative and qualitative OR approaches has developed in silos, and that an intertwined, cyclic understanding of soft and hard OR methods is needed to address complex problems. This author was also concerned that behavioural issues are less well understood in qualitative compared to quantitative model building. Related to problem structuring, stakeholder analysis and participation is central to environmental problems. Such research is recently gaining increased interest by OR (de Gooyert et al., Citation2017; Gregory et al., Citation2020; Hermans & Thissen, Citation2009). Behavioural OR (BOR; §2.2) is also gaining momentum (Franco et al., Citation2021). BOR strongly focuses on interventions, and could increase the understanding of societal and psychological issues in environmental problems. However, to date an environmental perspective is rarely taken. One exception is a conceptual paper about behavioural issues in environmental modelling (Hämäläinen, Citation2015). A meta-analysis of 61 environmental and energy cases analysed patterns and biases that may occur in the problem structuring phase of decision-making (Marttunen et al., Citation2018).
Sustainable supply chains (see also §3.24) have been recently reviewed by Barbosa-Póvoa et al. (Citation2018). These authors took a multi-stakeholder perspective along the supply chain to achieve sustainability goals. They found a predominance of optimisation methods applied to strategic decision levels. Most of the 220 reviewed articles focused on economic and environmental aspects, leaving behind the social aspects. Similarly, another review focused on combinatorial optimisation (§2.4), integrating reverse logistics (see also §3.14) and waste management (Van Engeland et al., Citation2020). Among other aspects, the authors emphasised the importance of environmental, social and performance indicators, and stakeholder integration, when dealing with flows of waste products. Taking a life-cycle perspective, usually addressed with life cycle sustainability assessment (LCSA), Thies et al. (Citation2019) reviewed advanced OR methods for sustainability assessment of products. While most articles used ecological indicators, the integration of economic and social indicators is emerging. They concluded that improved systematic procedures for uncertainty treatment are needed, and better integration of qualitative social indicators as well as spatially explicit data.
Other authors reviewed specific OR methods. For instance, Zhou et al. (Citation2018) reviewed Data Envelopment Analysis (DEA; §2.7) for sustainability assessments. Again, economic and environmental measures were well included, but the literature lacked social measures such as customer satisfaction. New DEA methods should be developed that include social network relationships. Mathematical programming and optimisation methods to support biodiversity protection were reviewed by Billionnet (Citation2013). Some of these difficult combinatorial optimisation problems were well solved, but further research is needed to satisfactorily address real-world biodiversity issues. For conservation management, spatial aspects are central, for example creating biological corridors in the landscape to increase biodiversity. Future research should include the temporal dimension and needs of practitioners. Robust optimisation (§2.21) could be a research avenue to handle uncertainty. A review of invasive species also took a mathematical perspective (Büyüktahtakın & Haight, Citation2018). Among other conclusions, research should develop more realistic models to capture spatial and temporal dynamics of invasive species, improve uncertainty treatment and coordination among stakeholders, and include holistic approaches for addressing trade-offs between conservation management and costs of such programs.
Multi-criteria decision analysis (MCDA; §2.8) provides a rich literature addressing environmental decision problems. French and Geldermann (Citation2005) discussed properties of wicked environmental problems from a conceptual point of view (introduced above), and implications for decision support. Cinelli et al. (Citation2014) analysed MCDA methods for sustainability assessments. They voiced some concern that choosing the MCDA methods is rather based on preferences, not analytic considerations. Indeed, text-mining of 3,000 articles provided little evidence that particular environmental application fields used certain methods more frequently, possibly because researchers are unaware of specific method merits (Cegan et al., Citation2017). To overcome this, Cinelli et al. (Citation2014) classified five MCDA methods using ten criteria important for sustainability assessments, e.g., uncertainty management and testing robustness of results, software, and user-friendliness. We know of two general articles for systematically choosing a suitable MCDA method (Cinelli et al., Citation2020; Roy & Słowiński, Citation2013). Several articles reviewed decision support systems (DSS) to identify features and best practices for supporting environmental problems (Mustajoki & Marttunen, Citation2017; Walling & Vaneeckhaute, Citation2020). Moreover, there are many reviews of MCDA applied to a specific environmental field, but only few were published in OR journals (e.g., Colapinto et al., Citation2020; Kandakoglu et al., Citation2019). There is a pronounced increase of articles applying MCDA in all environmental areas (e.g., water, air, energy, natural resources, and waste management; Cegan et al., Citation2017; Huang et al., Citation2011). Below, we introduce some important findings from decision analysis.
Some authors defined frameworks for environmental assessments taking a method perspective. Gregory et al. (Citation2012) proposed structured decision making (SDM) to tackle real-world environmental decision problems. Based on multi-attribute value theory (MAVT), SDM can be applied without much (mathematical) formalisation. This textbook discusses many practical environmental issues, highlighting solutions from international decision cases. Reichert et al. (Citation2015) proposed a framework for environmental decisions that emphasises uncertainty of scientific knowledge and societal preferences. They argued that theoretical requirements are best met by combining multi-attribute utility theory (MAUT) with scenario planning and probability theory, illustrated with a river management case. Scenario planning has been advocated by various authors for tackling wicked problems (Wright et al., Citation2019). The combination of scenario planning with MCDA has been reviewed by Stewart et al. (Citation2013), and applied to e.g., nuclear remediation management (Geldermann et al., Citation2009), coastal engineering under climate change (Karvetski et al., Citation2011), or water infrastructure planning (Scholten et al., Citation2015). Scenario analysis has also been combined with probabilistic statements and mathematical optimisation for risk assessment (see also §2.18) of nuclear waste repositories (Salo et al., Citation2022). A climate policy review illustrates the importance of integrating various OR methods to effectively support decision-making (Doukas & Nikas, Citation2020). The currently predominant evaluation of policy strategies with climate-economy or integrated assessment models (IAMs) fails to incorporate all relevant uncertainties and stakeholders, and sufficiently address system complexity. These authors proposed integrated approaches, including participatory stakeholder processes with fuzzy cognitive maps, combined with MCDA and portfolio analysis (PA). PA is especially useful as meta-analysis, and has been reviewed by Liesiö et al. (Citation2021). A PA-framework for environmental decision-making has been proposed by Lahtinen et al. (Citation2017).
To address spatial aspects of environmental problems, geographic information systems (GIS) are often combined with MCDA, sometimes also developing DSSs (Keenan & Jankowski, Citation2019). Risk analysis (§2.18) and OR research increasingly focuses on spatial planning (Ferretti & Montibeller, Citation2019; Malczewski & Jankowski, Citation2020). One example is the axiomatic foundation of spatial multi-attribute value functions (Harju et al., Citation2019; Keller & Simon, Citation2019).
Many reviews found that stakeholder integration throughout the decision-making process was insufficiently considered, e.g., in flood risk management (de Brito & Evers, Citation2016) or nature conservation (Esmail & Geneletti, Citation2018). This reflects generally found deficits in problem structuring (§2.20), for instance insufficient consideration of social objectives (Kandakoglu et al., Citation2019), or systematic underestimation of the importance of economic objectives (Marttunen et al., Citation2018; Walling & Vaneeckhaute, Citation2020). Moreover, there is a tendency to choose too many objectives in environmental cases (Diaz-Balteiro et al., Citation2017), potentially inducing biases in later stages of MCDA (Marttunen et al., Citation2019).
Many reviews emphasised the importance of uncertainty analyses in environmental decisions, but this is strongly ignored in practice. One review found that only 19% of 271 articles included uncertainty analysis, 17% using fuzzy techniques to capture imprecise numbers (Diaz-Balteiro et al., Citation2017). In another review, 34% of 343 articles dealt with the imprecision of predictions, 70% using fuzzy sets, and 20% stochastic modelling (Kandakoglu et al., Citation2019). In both reviews, only 20%–30% of the articles performed sensitivity analysis. Additionally, only 5% of 343 reviewed papers included temporal aspects of the environmental decision (Kandakoglu et al., Citation2019).
As conclusion, OR researchers are widely engaging in environmental problems. Environmental problems are intriguingly complex, thus offering opportunities for inspiring research. Although our evaluation is neither comprehensive nor systematic, some general research needs appear across all OR fields. Many articles emphasised the importance of better integrating practitioners and stakeholders in environmental problems, and of better considering societal objectives. Various fields require improved methods to address the complexities of environmental problems, including appropriately dealing with many types of uncertainties, time, and space. Combining soft with hard OR, improving problem structuring, and integrating questions from behavioural OR will increase the chances of finding sustainable solutions for our worlds’ environmental problems. This can also spark cross-disciplinary research over different fields of OR.
3.8. Ethics and fairnessFootnote54
There is substantial literature on the ethical practice of operational research, surveyed in Brans and Gallo (Citation2007), Ormerod and Ulrich (Citation2013), Tsoukias (Citation2021), and Bellenguez et al. (Citation2023). While this is a vitally important discussion, it is useful to consider how the science of operational research can contribute to ethics, as well as how ethics can contribute to the practice of operational research. It has accomplished this primarily through the development of modelling techniques and algorithms that embody ethical concepts, notably distributive justice.
An operational research model that aims simply to minimise total cost or maximise total benefit may unfairly distribute costs or benefits across stakeholders. This concern arises in a number of application areas, including healthcare (§3.11), disaster relief (§3.4), facility location (§3.13), task assignment, telecommunications (§3.26), and machine learning (§2.1). It poses the problem of finding a suitable formulation of equity or fairness that can be incorporated into a mathematical model.
For example, if donated organs are allocated in the most economically efficient fashion, patients with certain medical conditions may wait far longer for a transplant than other patients (McElfresh & Dickerson, Citation2018). If earthquake shelters are located so as to minimise average distance from residents, persons living in less densely populated areas may have much further to travel (Mostajabdaveh et al., Citation2019). If a machine learning algorithm awards mortgage loans so as to maximise expected earnings, members of a minority group may find themselves unable to obtain loans even when they are financially responsible (Saxena et al., Citation2020). If traffic signals at intersections are timed to maximise traffic throughput, motorists on side streets may have to wait forever for a green light (Chen et al., Citation2013).
We provide here a brief overview of mathematical formulations of fairness that have been proposed for OR and AI models. Comprehensive treatments can be found in Karsu and Morton (Citation2015) and Chen and Hooker (Citation2022b). In addition, Ogryczak et al. (Citation2014) review formulations developed for telecommunications and facility location, two major users of fairness models. Recent years have seen an enormous surge of interest in fairness criteria for machine learning, many of which are surveyed in Mehrabi et al. (Citation2022).
We suppose that the model into which one wishes to incorporate fairness allocates utilities to a collection of stakeholders, and we are concerned about the fairness of this allocation. Utility could take the form of wealth, resources, negative cost, health outcomes, or some other type of benefit. Stakeholders can be individuals, organisations, demographic groups, geographic regions, or other entities for which distributive justice is a concern.
Fairness models can be divided into three broad categories. Inequality measures are normally used to constrain the degree of inequality in solutions obtained by maximising total benefit or minimising total cost. Some of these focus on inequalities across individuals, and others on inequalities across groups. Various statistics for measuring the former are discussed in Cowell (Citation2000) and Jenkins and Van Kerm (Citation2011). Perhaps the best known is the Gini coefficient, widely used to measure income or wealth inequality (Gini, Citation1912; Yitzhaki & Schechtman, Citation2013). The Hoover index (Hoover, Citation1936) is proportional to the relative mean deviation of utilities and represents the fraction of total utility that must be redistributed to achieve perfect equality. Both the Gini coefficient and the Hoover index can be given linear formulations (§2.14) in an optimisation model by means of linear-fractional programming (Charnes & Cooper, Citation1962). Jain’s index (Jain et al., Citation1984), well known in telecommunications, is a strictly monotone function of the coefficient of variation.
Inequality between groups, generally referred to as group disparity, is by far the most discussed type of inequality metric in the machine learning field (§2.1; Verma & Rubin, Citation2018; Mehrabi et al., Citation2022). It assesses whether AI-based decisions (e.g., mortgage loan awards, job interviews, parole, college admission) are biased against a designated group, perhaps defined by race, ethnic background, or gender. Fairness implementations in machine learning typically strive to minimise loss (due to defaults on loans, etc.) while placing a bound on some measure of resulting group disparities. The best known measures are demographic parity (Dwork et al., Citation2012), equalised odds (Hardt et al., Citation2016), and predictive rate parity (Dieterich et al., Citation2016; Chouldechova, Citation2017), and counterfactural fairness (Kusner et al., Citation2017; Russell et al., Citation2017). The first two have mixed integer/linear programming (MILP) formulations (§2.15), and the third a mixed integer/nonlinear formulation. Weaknesses of group parity measures include a lack of consensus on which one is suitable for a given application (Castelnovo et al., Citation2022), as well as on which groups should be monitored for bias.
A second category of models is concerned with fairness for the disadvantaged. They strive for equality, but with greater emphasis on the lower end of the distribution. The maximin criterion, based on the famous difference principle of John Rawls, maximises the welfare of the worst-off individual or social class (Rawls, Citation1971). It is defended with a social contract argument that has been intensely discussed in the philosophical literature (as surveyed in Freeman, Citation2003; Richardson & Weithman, Citation1999). A more sophisticated form of the principle is lexicographic maximisation (leximax), which maximises the worst-off, then the second worst-off, and so forth. The McLoone index compares the total utility of stakeholders at or below the median utility to the utility they would enjoy of all were brought up to the median. It is based on a concern that no one be disadvantaged but tolerates inequality in the top half of the distribution. It has been used to assess the allocation of public services, particularly education (Verstegen, Citation1996) and can be given an MILP formulation (Chen & Hooker, Citation2022b).
Criteria that balance efficiency and fairness can be placed in three categories: convex combinations of efficiency and fairness, criteria from classical social choice theory, and threshold criteria. Convex combinations provide the simplest approach, as for example a combination of total utility and a fairness measure (e.g., Mostajabdaveh et al., Citation2019). Other formulations are given by Yager (Citation1997), Ogryczak and Śliwiński (Citation2003), and Rea et al. (Citation2021). Convex combinations and other weighted averages pose the general problem of justifying a choice of weights, particularly when utility and equity are measured in different units, although Argyris et al. (Citation2022) propose a means of avoiding this issue.
The task of balancing fairness and efficiency gave rise to one of the oldest research streams in social choice theory, beginning with the Nash bargaining solution, also known as proportional fairness (Nash, Citation1950a). Proportional fairness has seen application in such engineering contexts as telecommunication and traffic signal timing (Mazumdar et al., Citation1991; Kelly et al., Citation1998) and elsewhere. Nash gave an axiomatic argument for the criterion, while Harsanyi (Citation1977), Rubinstein (Citation1982), and Binmore et al. (Citation1986) have shown that it is the outcome of certain bargaining procedures. Alpha fairness generalises proportional fairness by introducing a parameter that governs the importance of fairness, where
corresponds to a purely utilitarian criterion,
to proportional fairness, and
to the maximin criterion (Mo & Walrand, Citation2000; Verloop et al., Citation2010). Alpha fairness has been derived from a set of axioms (Lan et al., Citation2010; Lan & Chiang, Citation2011), including an “axiom of partition” that is largely responsible for the result. It provides an objective function to be maximised that is nonlinear but concave (§2.16). Another criterion, Kalai-Smorodinsky bargaining, likewise has an axiomatic defence (Kalai & Smorodinsky, Citation1975) and addresses what one might see as a weakness in Nash bargaining, namely that it can result in reduced utility for some stakeholders when the feasible set is enlarged. The Kalai-Smorodinsky criterion can be viewed as a kind of normalised maximin, as it calls for allocating to each stakeholder the largest possible fraction of his or her potential utility (ignoring other stakeholders) on the condition that this fraction be the same for everyone. This criterion has received support from Thompson (Citation1994) as well as the “contractarian” ethical philosophy of Gauthier (Citation1983) and has been recommended for wage negotiations and similar applications (Alexander, Citation1992).
Threshold criteria are of two types. One, based on an efficiency threshold, imposes a maximin objective until the efficiency cost becomes unacceptably great, at which point some stakeholders are switched to a utilitarian criterion. The other, based on an equity threshold, imposes a utilitarian criterion until inequity becomes unacceptably great, at which point a maximin criterion is introduced. Originally proposed for two stakeholders (Williams & Cookson, Citation2000), the threshold criteria have been extended to n persons, using an MILP formulation for the former (Hooker & Williams, Citation2012) and a linear programming model for the latter (Elçi et al., Citation2022). A parameter regulates the equity/efficiency trade-off in both models, in that stakeholders with utility within
of the worst-off are given special priority. Thus, the parameter
may be interpretable in a practical situation in a way that
in the alpha fairness criterion is not. Both threshold criteria inherit a weakness of the maximin criterion, namely that they may be insensitive to the equity position of disadvantaged stakeholders other than the very worst-off. This has been addressed for the efficiency threshold by combining a utilitarian criterion with a leximax rather than a maximin criterion. McElfresh and Dickerson (Citation2018) accomplish this by assuming there is a pre-existing priority ordering of stakeholders. Chen and Hooker (Citation2022a) avoid this assumption by giving greater priority to stakeholders with utilities closer to the lowest, and by solving a sequence of MILP models to balance the leximax element with total utility.
Fairness modelling is a relatively recent research program in operational research that may forge new connections with other fields. Much as interactions between OR and economics, management, and engineering have been mutually beneficial on both a theoretical and practical level, collaboration with ethicists on the precise formulation of fairness concepts may bring similar benefits to both ethical philosophy and operational research.
3.9. FinanceFootnote55
The use of mathematical models and numerical algorithms to solve an extensive range of problems in finance is widespread, by both researchers and practitioners. In this subsection, we offer an overview of some established models and discuss a selection of the corresponding OR approaches and techniques.
3.9.1. Resource allocation models
As in any other industry, the optimal allocation of resources to activities is a central problem in finance. Prototype models include short-term cash flow management (a linear program), portfolio dedication and immunisation (linear programs), capital budgeting (knapsack problem), asset/liability management (stochastic program with recourse), and portfolio selection (quadratic program).
The portfolio selection model introduced in Markowitz (Citation1952) and discussed in Markowitz and Todd (Citation2000) is one of the best known optimisation models in finance. This mean-variance model consists of determining the composition of a portfolio of risky assets – a vector of weights – where the performance (to be maximised) is measured by the expected portfolio return, a linear function of the assets’ weights, while the risk (to be minimised) is measured by the variance of the portfolio return, a quadratic function of the weight vector. The resulting optimisation problem gives rise to a convex quadratic program. This model and its analytical properties led to a formalisation of diversification as a strategy to mitigate risk and to important developments in financial theory.
While the Markowitz model represents a considerable simplification of the portfolio management problem, mean-variance optimisation models are still very much applied in practice. Straightforward variations of the Markowitz model can account for various constraints on the asset weights (e.g., bounds, minimum participation, regulatory or operational restrictions, logical constraints, etc.), yielding mixed integer quadratic programs.
Mean-variance models rely on sets of parameters describing the expected returns and their correlation matrix in the universe of the set of considered assets. Various forecasting approaches (§2.10) have been proposed to obtain estimates of these parameters, often relying on some assumptions about the correlation structure. One important issue related to the use of mean-variance optimisation models is the sensitivity of their solutions to the estimated parameter values (Michaud, Citation1989), specifically when the feasible region is relatively unconstrained. Robust optimisation (see also §2.21) is increasingly used to limit the estimation risk of mean-variance portfolio solutions (Ismail & Pham, Citation2019; Yin et al., Citation2021; Blanchet et al., Citation2022).
Another related limitation of mean-variance models is the fact that they are static models, that is, expectations and correlations of asset returns are assumed to be known and constant over the planning horizon. In practice, estimations are updated periodically to reflect changes in data, and portfolios are rebalanced to the optimal composition corresponding to the new set of estimates. Small perturbations in the values of the input parameters may lead to significant changes in the composition of the portfolio from one period to the next (for instance, when groups of assets have similar characteristics). When the costs associated with changing the composition of the portfolio are significant, a static model may be far from optimal. The portfolio selection problem can be readily extended to a multi-period context, allowing to account for transaction costs and/or to use a dynamic model of the evolution of asset prices over time (Li & Ng, Citation2000). Dynamic models can also account for additional frictions, such as taxes on capital gains or losses (Dammon et al., Citation2001). The resulting dynamic portfolio selection problem may be a large-scale stochastic dynamic program (§2.9; §2.21). Moreover, risk measures based on portfolio variance are not additively separable, precluding the efficient use of dynamic programming. Steinbach (Citation2001) proposes a solution approach based on scenario decomposition.
3.9.2. Risk management
While, in OR, the classical way to deal with decisions under risk is utility theory, finance models usually take a different approach by directly measuring and/or pricing risk. Various measures, such as variance, semi-variance, Value at Risk (VaR) or Conditional value at risk (CVaR) have been proposed to characterise riskFootnote56. VaR is effectively concerned with computing quantiles of the predictive distrubution (see also §2.10 and §3.19). In the following paragraphs, we present two contrasting families of approaches to financial risk management.
Diversification and hedging approaches are closely related to the resource allocation models presented above. They consist in setting up and managing portfolios of securities with desirable properties. Diversification is effective in reducing risk that is uncorrelated across securities, while hedging is used to reduce systematic risk, for instance by holding securities exposed to the same risk factors to eliminate uncertainty, or by buying insurance in the form of derivative contracts. In general, hedging positions must be continuously adjusted to account for the time evolution of risk factors and security prices. In addition, investment portfolios are often required to satisfy institutional or regulatory constraints. Risk mitigation portfolio planning problems give rise to dynamic stochastic mathematical programs. In recent years, CVaR has become prominent for measuring portfolio risk; CVaR is well-suited to measure down-side risk in skewed distribution and, as shown in Artzner et al. (Citation1999), it has the desirable properties of a coherent risk measure. Moreover, the use of CVaR in optimisation models gives rise to convex or linear programs, allowing to efficiently solve the large-scale problems encountered in practice (Rockafellar et al., Citation2000; Andersson et al., Citation2001; Rockafellar & Uryasev, Citation2002).
Risk pricing approaches rather seek to evaluate the consequence of unpredictable events and are notably used for the management of credit and counterparty risk, that is, the risk that the issuer of a security (for instance, a corporate bond) will not be able to meet its future obligations. A variety of models have been proposed to evaluate the VaR of debt instruments, mainly for the purpose of assessing regulatory requirements ensuring that financial institutions put aside sufficient capital to sustain eventual losses. Crouhy et al. (Citation2000) presents a review of methodologies currently proposed by the industry to evaluate the probability and consequences of default events. Most approaches used in the industry to price credit and counterparty risk are based on probabilistic models or Monte-Carlo simulation (§2.19) and, as such, cannot account for strategic behaviour by the debtor or the lender (Breton & Marzouk, Citation2018).
3.9.3. Asset pricing
Most asset pricing models are founded on an absence of arbitrage assumption, which is usually motivated by the efficiency of markets. Under this assumption, the value of a financial asset is equal to the expected value of its future payoffs, under a suitable probability measure. One specific application is the valuation and replication of contingent claims, such as financial options. The contribution of OR to this area lies in the development and implementation of efficient numerical pricing methods for complex financial securities.
Starting from the binomial tree model of Cox et al. (Citation1979), numerical methods for option pricing include Monte-Carlo (§2.19) and quasi-Monte-Carlo approaches (Acworth et al., Citation1998; L’Ecuyer, Citation2009); dynamic programming (§2.9) and approximate dynamic programming models accounting for optimal exercise strategies (Ben-Ameur et al., Citation2002; Longstaff & Schwartz, Citation2001); and robust control models (§2.21) accounting for transaction costs and model uncertainty (Davis et al., Citation1993; Bernhard, Citation2005; Bandi & Bertsimas, Citation2014). Numerical algorithms developed for option pricing have also been applied to the valuation of numerous instruments, including corporate bonds, credit derivatives, contracts, and, under the designation of real options, managerial flexibility (Trigeorgis, Citation1996; Schwartz & Trigeorgis, Citation2004; Dixit & Pindyck, Citation2009).
In the context of algorithmic trading, asset pricing algorithms have been revisited using artificial intelligence approaches, for instance by using machine learning to identify factor models or reinforcement learning to compute optimal exercise strategies (Dixon et al., Citation2020; Gu et al., Citation2020), or by augmenting the set of covariates with textual data (Algaba et al., Citation2020).
3.9.4. Strategic interactions
Decisions made by investors, firms, financial institutions, and regulators have a direct impact on asset values, returns and risk. Players in the financial sector have competing interests and interact strategically over time, and these interactions are recognised in many game-theoretic models of investment and corporate finance (§2.11). Important issues include market impact and market manipulation, option games, strategic exercise of real options, agency conflicts, corporate investment, dividend and capital structure policies, financial distress, and mergers and acquisitions.
Optimal execution refers to the determination of a trading strategy minimising the expected cost of trading a given volume over a fixed period, accounting for the impact of the trades on the price of the security. This problem is addressed in Bertsimas and Lo (Citation1998), using a stochastic dynamic program minimising the execution costs, and in Almgren and Chriss (Citation2001), where a combination of volatility risk and transaction costs is minimised. Optimal execution and market impact are particularly significant issues in the context of algorithmic trading and have been addressed by the recently developed mean-field game theory, acknowledging the fact that price is impacted by the trades of many atomic players (Firoozi & Caines, Citation2017; Cardaliaguet & Lehalle, Citation2018; Huang et al., Citation2019).
Option games appear in asset pricing models when a security gives interacting optional rights to more than one holder, that is, when the exercise of an optional right by one holder modifies those of the others. Examples include callable, putable and convertible bonds, warrants, and, especially, instruments subject to credit or counterparty risk. In general, the pricing of such financial instruments corresponds to the solution of a non-zero-sum stochastic game where players use feedback strategies (Ben-Ameur et al., Citation2007).
Financial distress models are used to price corporate debt, according to various assumptions about strategic default, debt service and bankruptcy procedures (Fan & Sundaresan, Citation2000; Broadie et al., Citation2007; Annabi et al., Citation2012).
Finally, a large literature in corporate finance uses game-theoretic models to deal with financial decisions made by firms, such as the choice between debt and equity when financing operations, the amount of dividends paid out to shareholders, and decisions about whether to invest in risky projects.
3.9.5. Further readings
The recognition of finance as an thriving application area for OR methods developed about thirty years ago (see, for instance, Dahl et al., Citation1993a, Citation1993b, for an introduction to optimisation problems underlying risk management strategies and instruments). A review of practical applications of OR methods in finance appeared in Board et al. (Citation2003). For a comprehensive textbook covering optimisation models in finance, we refer the reader to Cornuejols and Tütüncü (Citation2006). A unified framework for asset pricing can be found in Cochrane (Citation2009) and a review of applications of dynamic games in finance in Breton (Citation2018). Recent discussions about the interface of operations, risk management and finance as a promising research area are presented in Wang et al. (Citation2021) and Babich et al. (Citation2021).
3.10. Government and public sectorFootnote57
This subsection will present some OR applications within the UK’s government operational research service (GORS). GORS represents over 26 departments and agencies across Great Britain and Northern Ireland with analysts working in multi-disciplinary teams to find workable solutions to real life problems. The outbreak of the Coronavirus pandemic in 2020 introduced a new global backdrop and we were faced with the challenge of producing appropriate analysis to answers questions during an ever-changing landscape where time was of the essence. This led to collaborations across a wide range of departments across the nations.
A few examples of where this collaborative approach was adopted successfully are highlighted by the work carried out by the Department for Transport (DfT) and the Office for National Statistics (ONS). The ONS worked with other government departments such as Department of Health and Social Care (DHSC) and schools across the UK to monitor infection rates. They also applied their expertise in artificial intelligence (AI) in the form of semantic maps to gather insight into the pandemic. Additionally, the DfT along with other government departments used agent based modelling and discrete event simulation to unpick the issues around border disruptions and international travel.
3.10.1. Coronavirus (COVID-19) infection survey and schools infection survey
The Office for National Statistics (ONS) played a vital role during the pandemic in monitoring infection rates. The Coronavirus (COVID-19) infection survey estimates how many people across England, Wales, Northern Ireland, and Scotland would have tested positive for a COVID-19 infection, regardless of whether they report experiencing symptoms. This study was a collaboration with academic partners and funded by Department of Health and Social Care. This major study involved asking people up and down the country to provide nose and throat swabs on a regular basis. These are analysed to see if they have contracted COVID-19. In addition, some adults are also asked to provide blood samples to determine what proportion of the population has antibodies to COVID-19. Further details of the methodology can be found in Office for National Statistics (Citation2022a).
Estimates of the total national proportion of the population testing positive for COVID-19 are weighted to be representative of the population that live in private-residential households in terms of age (grouped), sex and region. The analysis for the infection study is complex, the model generates estimated daily rates of people testing positive for COVID-19 controlling for age, sex, and region. This technique is known as dynamic Bayesian multi-level regression post-stratification (MRP). Details about the methodology are also provided by Pouwels et al. (Citation2021).
Estimates from the ONS survey are published weekly, a critical element was how best to communicate the uncertainty, for dissemination estimates were translated into, for example, 1 in 50 people, with appropriate visuals including the ONS insights tool (Office for National Statistics, Citation2022b). A complementary piece of work was monitoring transmission and antibody levels within schools, enabling the government to accurately assess the risk of different policy options.
The Schools Infection Survey (SIS) was a longitudinal study which collected data through polymerase chain reaction (PCR) tests, antibody tests and questionnaires. As well as monitoring transmission within a school environment, this data was used to assess the wider impacts of the pandemic and repeat lockdowns on our children and young people, including long covid, mental health and physical activity levels. Further detail can be seen in Office for National Statistics (Citation2022c) and Hargreaves et al. (Citation2022).
The Daily Contact Testing (DCT) trial was a blind medical trial which compared infection rates across two groups subject to different policies: the control group where children were in “bubbles”, and after one child testing positive the entire bubble would be sent home from school, and the intervention group where after a child tested positive, close contacts would then test daily and were allowed to remain in school as long as their results were negative. The study was a success and led to a policy change that resulted in schools being kept open for longer. Further detail can be seen in Young et al. (Citation2021).
3.10.2. Semantic maps and their use for understanding regional disparities
Semantic Maps are a type of knowledge graph, championed in the world of robotics and Artificial Intelligence as a way to provide infrastructure to exploit all kinds of potentially even crowdsourced data and information in such a way as to provide dynamic, online, interactive visualisations that support the controlled and secure use of live data. The can be geospatial in nature, but they can also reflect connections through semantic relationships. These maps populated with data would provide users with many different ways to consume the underlying data and help inspire citizens about the potential power of data to drive understanding and generate insights.
During the development of the Levelling Up White Paper the evidence base needed to be developed across government in order to define the key metrics and measures to focus policies in areas that would drive change. The white paper itself was delivered by the Levelling Up Taskforce in the Cabinet Office, however, ONS worked with the geospatial commission in convening a group of chief analysts from all departments on a regular basis. ONS and the Levelling Up Taskforce used the group to commission and collate existing evidence and then worked with officials in His Majesty’s Treasury (HMT) to develop a systems thinking model from that evidence. This systems mapping was the basis of the theory of change that underpins the white paper. Subsequently, the metrics and missions were developed and refined with this group in recognition of the fact that there needs to be a focus across the system to reduce disparities that are often larger within areas such as local authorities or regions than they are between them.
ONS took this and developed a semantic map that identifies potential data sources for various aspects of the knowledge graph, using this to both prioritise filling evidence gaps where data and evidence do not currently exist and developing an integrated data asset for Levelling Up. This data is in the process of being acquired and engineered to be able to be easily linked through a set of linking ‘spines’ referred to as the reference management database. This engineering and architecture is key for supporting the sharing of information in a way that ensures privacy. It is intended that in future this asset will be made available across government and in a secure integrated data service.
3.10.3. Agent based modelling
The COVID-19 pandemic presented challenges for the international travel community. Government officials in transport and health needed to model the preventative effect of the various policy options including testing and isolation on importation of infections from international travel.
The approach chosen in the Department for Transport to support this fast-moving policy area was agent based modelling which built upon the more scientific epidemiological modelling undertaken by colleagues in Health and academia. This allowed for the incorporation of the various differing parameters of international travellers including, where they were coming from and their risk of being infected and infectious, the uncertainty over incubation and infectious periods, and their likely behavioural response to various isolation and testing regulations.
Whilst not designed to be a scientific forecast, the modelling allowed the cross-government community to estimate the relative effectiveness of policy options. This work supported policy making during a highly uncertain and changing environment when Government had to balance risk with the wider impacts on the aviation sector and the second order impacts on the economy.
3.10.4. Discrete event simulation
As part of the EU Exit preparations, it was important for both the Department for Transport, the Home office and regional resilience teams to understand the impact of the expected border disruption at UK ports for roll-on roll-off freight traffic travelling to EU Member States. As the issue was around changes to the time taken and resource available to carry out additional border processes, the natural choice was discrete event simulation. Analysts in government developed a detailed model of the Short Strait crossings (Port of Dover and the Channel Tunnel to France accounting for 84% of accompanied heavy goods vehicles travelling to continental Europe in 2019; Department for Transport, Citation2022). Regional models were developed to cover other ports. These allowed government officials to understand the likely queues and flow of vehicles and to understand the impact of changes to the system, which was vital to supporting contingency planning.
3.10.5. Statistical analysis and forecasting
The COVID-19 lockdowns of 2020 accelerated the uptake of new and novel data sources for understanding mobility. Government analysts rapidly ingested new data sources such as that provided by Google mobility as open source data as well as procuring in additional anonymised and aggregated mobile network operator data. By analysing these new data sets alongside traditional demographic and geographic data sets it was possible to generate insights into the changes in mobility being seen across the country as a result of the various national and regional restrictions. Regression analysis was undertaken to produce a predictive model. It was then possible to forecast the impact of later changes to restrictions on population mobility.
3.10.6. Net zero – system thinking
In 2020 the UK Prime Minister’s Council for Science and Technology advised on the following: ‘a whole systems approach can provide the framework that government requires to lead change across public and private sectors and …enables decision makers to understand the complex challenges posed by the net-zero target and devise solutions and innovations that are more likely to succeed’ (Council for Science & Technology, Citation2020). The Prime minister agreed.
As transport represents a huge portion of the challenge, ORs have run participatory systems mapping workshops in the Department for Transport with modal subject matter experts to identify the key causes and effects in the Transport Net Zero system. This aims to enable those working on Transport policy to explore the evidence, gain new insights and visibility of interdependencies within the system, and to understand the likely wider impact of their policy choices.
3.10.7. Conclusions
All these examples help to illustrate the breadth of analysis undertaken across central government during the global pandemic to tackle real life issues; and the ranges of techniques we have as OR analysts to find workable solutions in an ever changing world.
3.11. HealthcareFootnote58
Why is the organisation and delivery of health and care services so difficult to manage, plan for and improve? Difficulties and delays in accessing care services, cancellations and increasing costs have a negative impact on all of us: patients, carers, and care professionals. Despite the attention and resources invested in addressing these problems, many health systems face increasing pressure to improve the effectiveness and efficiency of their operations. Part of the problem is the complexity inherent in the organisation of care services and our limited understanding of how changes will affect their delivery. Another problem is the intrinsic uncertainty and variability in many aspects of care service delivery. Add the multifaceted dynamics arising in this very complex socio-technical system involving professionals, patients and existing and new technologies, against a background of increased demand and budgetary constraints, and it is no surprise the effort to improve healthcare has been termed ‘rocket science’ (Berwick, Citation2005).
Operational research has a long established history in this area with the first application (scheduling outpatient hospital appointments) reported in the early 1950s (Bailey, Citation1952). Since then, there has been a proliferation of OR applications reported in the literature (Katsaliaki et al., Citation2010), and evidence of use to support policy making and care delivery (Royston, Citation2009). This is not a surprise given the importance of healthcare in our lives and that many of the problems faced by those managing and delivering care services are amenable to the methods and ethos of OR (Utley et al., Citation2022). In the short review that follows, which is by no means exhaustive and draws primarily (but not exclusively) from the UK academic community and the National Health Service (NHS), I have attempted to give examples of review and individual studies grouped in a few broad areas of healthcare.
3.11.1. Applications to hospital settings
Hospital care has been the setting of a large number of OR studies (Jun et al., Citation1999). Hospitals typically survive reorganisations and funding cuts (unlike management, policy and other statutory bodies), and are large enough to be able to engage meaningfully in research projects (unlike, for example, many primary care practices). Some (mainly teaching) hospitals host large biomedical research centres, with many of the professionals working in them active researchers.
A specific area that has attracted the attention of operational researchers is the Emergency Department (ED). A recent review article identified 21 studies that used a computer simulation method to capture patient progression through the ED of an established UK NHS hospital, mainly focusing on service redesign (Mohiuddin et al., Citation2017). Individual studies have addressed the micro (single hospital) level (Baboolal et al., Citation2012), as well as the meso-level of emergency and on-demand healthcare within a region (Brailsford et al., Citation2004). The study by Lane et al. (Citation2000) used System Dynamics to model the interaction of demand patterns and resources deployed in ED and other parts of the hospital to examine the link between emergency and elective operations in hospitals.
Another hospital area that has been the focal point of OR is peri-operative care. Sobolev et al. (Citation2011) in their systematic review identified 34 studies modelling the flow of surgical patients. Various forms of optimisation have also been applied to surgical scheduling problems including operating room (Fairley et al., Citation2019), staffing (Bandi & Gupta, Citation2020) and nurse rostering (Xiang et al., Citation2015) among others. Cardoen et al. (Citation2010) identified almost 250 papers, with the rate of published studies accelerating at around the start of the new millennium (similar trends have been observed across many disciplines). The review revealed that most of the research was directed towards the planning and scheduling of elective patients in highly stylised scenarios – although many operational challenges are triggered by factors such as the arrival of non-elective (emergency) patients. More recently, the problems tackled have become more realistic to include considerations of downstream resource availability such as critical care and general ward beds (Fügener et al., Citation2014), and scheduling elective operations in such a way that randomly arriving emergency patients can be accommodated without excessive delays (Jung et al., Citation2019).
An area OR has demonstrably made a beneficial impact is the organisation of acute stroke services. Several studies have attempted to address the rate and speed with which patients with suspected acute ischemic stroke go through the initial diagnostic steps and receive treatment (Meretoja et al., Citation2014). Monks et al. (Citation2012) made a number of recommendations for improving treatment rates in a rural hospital. In a follow-up study that evaluated the results of their recommendations, mean door-to-needle times (a key performance metric with direct impact on patient survival and recovery) fell from 100 min to 55 min while thrombolysis rates increased to 14.5% (Monks et al., Citation2015). More recently, the focus has shifted to supporting decision around the centralisation of regional acute stroke services (Wood & Murch, Citation2020; Wood et al., Citation2022), as well as the supporting the introduction of endovascular thrombectomy, a new and very effective treatment for ischemic stroke (Maas et al., Citation2022).
3.11.2. Applications to non-acute hospital care settings
Much of healthcare is delivered outside of large hospital facilities. Primary care, home and community care, social care are significant components of the healthcare ecosystem. Primary care, whether provided by physicians, nurse practitioners or pharmacists, is typically concerned with providing a first contact and principal point of continuing care and/or coordinating other specialist care. There are early examples of theoretical work to assist primary care planning by estimating the coverage achieved by staff and facilities, using antenatal care as an example (Kemball-Cook & Vaughan, Citation1983). More recently in the area of maternity care provided in community as well as hospital facilities, Erdoğan et al. (Citation2019) developed and empirically tested an open source facility location solver to assist with a decision on the number and location of regional maternity facilities.
Home-based care has attracted considerable attention from operational researchers (Grieco et al., Citation2021). This review identified studies proposing models and solution methods for operational decisions on staff rostering, the allocation of staff to patient visits, the scheduling of visits and the routing of staff. An example of impactful OR project is the Swedish study by Eveborn et al. (Citation2009), where a set of algorithms and accompanying software tool were developed to provide solutions to staff-to-patient allocations, staff scheduling and staff routing problems. Having deployed the tool to more than 200 units/organisations, operational efficiency was increased by up to 15%, resulting in annual savings of 20-30 million euros. More recently, modelling work has supported the effort to address the timely discharging of hospital patients by using a combination of home-based and bedded ‘step-down’ community care (Harper et al., Citation2021).
Mental health, one of the leading causes of disease burden internationally, has also received the attention of operational researchers (Long & Meadows, Citation2018). Specific areas of application varied from psychiatric ICUs (Moss et al., Citation2022) to system design (Smits, Citation2010) and planning (Vasilakis et al., Citation2013), medical decision making (Afzali et al., Citation2012), and epidemiology (Ciampi et al., Citation2011).
3.11.3. Public health, health system preparedness and resilience, and pandemic response
Public health, the science and practice of helping people stay healthy and protecting them from threats to their health, is another area of OR applications. The review article by Fone et al. (Citation2003), identified OR studies of infection and communicable disease, screening, and several epidemiological and health policy studies. Microsimulation, a type of simulation which models individual life trajectories through a number of healthy and disease states, has found wide applicability in the area of public health (Krijkamp et al., Citation2018), such as forecasting the long-term care needs of the older population in England (Kingston et al., Citation2018a). Multicriteria decision analysis (MCDA) methods have also been used extensively to address questions of health policy or health technology assessment (Glaize et al., Citation2019).
An area that has seen increased attention over the last two decades is that of emergency preparedness and health system resilience (Tippong et al., Citation2022). Emergency preparedness studies include a study of red blood cell provision following mass casualty events (Glasgow et al., Citation2018). Examples of health system resilience studies include the paper by Crowe et al. (Citation2014), which examined the feasibility of using modelling to assess the capacity of a care system to continue operating in the face of major disruption.
The COVID-19 pandemic not only gave rise to a large number of modelling studies, it also raised the profile of mathematical modelling with the general public and policy makers. Pagel and Yates (Citation2022), in their excellent article on the role of modelling in the pandemic response, discussed the early lessons learnt from this experience including the poor understanding of policy makers and the public of key concepts such as exponential growth. They argue that infection disease modelling, which generated much of the evidence used to support decisions of pandemic response (Brooks-Pollock et al., Citation2021), is intrinsically difficult given the complex relationships between the model parameters, and the difficulties associated with quantifying these parameters.
The possible benefits of modelling in addressing the challenges presented by the pandemic were outlined by Currie et al. (Citation2020). Indeed, several studies emerged early in the pandemic including, for example, an attempt to forecast the number of infected and recovered cases used univariate time series models (Petropoulos & Makridakis, Citation2020). Wood et al. (Citation2020) published one of the first OR studies that examined the likely impact of increases in critical care capacity as a means to reduce the COVID-19 death toll. In a follow-up study, the sophistication of the model was increased to capture notions of triaging access of patients to critical care beds during periods of intense demand (Wood et al., Citation2021b). The operation of large vaccination centres was also the topic of several modelling studies, both theoretical (Franco et al., Citation2022) and empirical (Wood et al., Citation2021a; Valladares et al., Citation2022).
3.11.4. Concluding remarks
Despite the large body of literature, the role and impact of OR on improving care systems is less clear. Hospitals have “largely failed to use one of the most potent methods currently available for improving the performance of complex organisations” (Buhaug, Citation2002) and “staff may be largely unaware of the potential applications and benefits of OR” (Utley et al., Citation2022). A systematic review found that only half of the included studies reported models that were constructed to address the needs of policy-makers, and only a quarter reported some involvement of stakeholders (Sobolev et al., Citation2011). Recent positive developments include the introduction of guidelines to improve the reporting of OR studies (e.g., Monks et al., Citation2019), studies that recognise the importance of behavioural factors in attempts to influence practice and decision making with OR (Crowe & Utley, Citation2022) and attempts to systematically generate evidence on the value and impact of OR on patient and system outcomes (Monks et al., Citation2015; Soorapanth et al., Citation2022). The research agenda should continue to evolve with the aim of addressing the challenges around engagement, implementation and evidencing the impact of OR applied to healthcare problems.
3.12. InventoryFootnote59
Inventories are the materials, parts, and finished goods held by an organisation for future use or sale. Not having enough inventory is costly. Shortages of materials and parts cause interruptions in production processes, delays in product delivery, and stockouts of finished goods. On the other hand, carrying inventory is costly, too, involving the cost of capital due to tied-up capital, storage cost, insurance, taxes, and spoilage and obsolescence costs.
Inventory theory studies analytical models and solution techniques to help organisations meet the service requirement most cost-effectively or minimise the total expected costs of ordering, inventory-holding, and shortage. It does so by quantifying the tradeoffs driven by economies of scale, lead time (the time it takes to receive the ordered quantity after placing an order), and supply and demand uncertainties. It prescribes effective inventory-control policies that govern when to order an item (called reorder point) and how much to order (called order quantity).
Inventory models distinguish from each other along several features: single or multiple planning periods, discrete- or continuous-time inventory monitoring, single- or multi-product, single- or multi-stage (or location), demand nature (deterministic or stochastic, stationary or nonstationary, distribution known or unknown), product perishability, lost sales or backlogging when shortages occur, deterministic or stochastic lead time, supply system (single- or dual-source, exogenous or endogenous, a finite or infinite capacity), and cost structure (with or without a fixed ordering cost, etc.). The following research-based textbooks and handbooks offer more detailed coverage and references: Arrow et al. (Citation1958), Axsäter (Citation2006), de Kok and Graves (Citation2003), Graves et al. (Citation1993b), Hadley and Within (Citation1963), Nahmias (Citation2011), Porteus (Citation2002), Silver et al. (Citation1988), Simchi-Levi et al. (Citation2014), Snyder and Shen (Citation2019), Song (Citation2023), and Zipkin (Citation2000).
One class of models focuses on characterising the optimal inventory-control policy under a given supply and demand environment and cost structure. A common approach is formulating a multi-period inventory decision problem as a dynamic program and transforming the original formulation into a simpler one through state reduction. Next, identify the structural properties of the single-period cost function to determine the optimal policy form for a single-period problem. Then, show that these properties are preserved by the (Bellman) optimality equation, so the policy form is optimal for each period. The optimal policy parameters may not be easy to compute; hence some works develop efficient algorithms to calculate the optimal policy parameters.
Another class of models focuses on developing efficient performance evaluation tools for a given type of inventory policy that is either commonly used in practice or of simple structure and easy to implement. This is particularly important for systems where state reduction is not viable and the dimension of the system state grows exponentially in the number of periods (the so-called curse of dimensionality), so the optimal policy has no simple form. Typically, this type of work analyses a continuous-review system in which demand follows a stochastic process and derives steady-state performance measures of any given policy, such as average inventory, average backorders, and stockout rate, as well as the long-run average cost. Then, optimisation tools can be developed to find the optimal policy parameters that minimise the long-run average cost.
The third class of models conducts asymptotic analysis to establish asymptotic optimality of some simple-structured policies for less tractable inventory systems with unknown and complex optimal policies.
The following are several classic models where the optimal policies are shown to have simple forms. Unless otherwise stated, the models assume a single stage, a single source, and a single nonperishable product.
The EOQ (Economic Order Quantity) Model was first developed by Harris (Citation1913) (see the reprint Harris, Citation1990) and popularised by Wilson (Citation1934). It concerns the balancing of holding and ordering costs due to economies of scale in procurement or production. It is a continuous-review model over an infinite planning horizon, assuming the annual demand for the stocked item is a constant There is a fixed procurement cost k independent of the order size, accounting for administrative, material handling, and transportation-related costs. The annual per-unit inventory-holding cost is h. The optimal order quantity (EOQ) that minimises the annual order and holding costs equals
which is insensitive to small perturbations of the model parameters. Variations of this model can accommodate finite production rate, planned backlogs, random yield, a quantity discount, and time-varying demand (also known as the dynamic lot sizing problem; see Wagner & Whitin, Citation1958; Silver & Meal, Citation1973). It also forms the basis for the development of efficient multi-item joint replenishment policies and multiechelon coordinated replenishment policies such as the power-of-two policies; see Roundy (Citation1985), Roundy (Citation1986). For major developments and references, see Axsäter (Citation2006), Muckstadt and Roundy (Citation1993), Silver et al. (Citation1988), Simchi-Levi et al. (Citation2014), and Zipkin (Citation2000).
The Newsvendor Model, which originated from Edgeworth (Citation1888) in a banking application, was formalised by Arrow et al. (Citation1951) in the general inventory context. It optimises the tradeoff between too much and too little inventory caused by demand uncertainty for a seasonal product. It is a single-period model with only one ordering opportunity before the selling season, assuming an estimated demand distribution. The fixed order cost is negligible. After the ordered quantity arrives, the selling season begins, and demand realises. At the end of the season, there will be either unsold units (overage) or unmet demand (underage). The unit overage cost (o) = purchasing cost less - salvage value, while the unit underage cost (u) is the lost profit. The optimal newsvendor order quantity equals to the fractile of the demand distribution at the critical ratio The model can be generalised in many ways, including random yield, different cost structures, pricing, and distribution-free bounds (Gallego & Moon, Citation1993; Petruzzi & Dada, Citation1999; Porteus, Citation1990; Qin et al., Citation2011) and multi-location with risk-pooling effect (Bimpikis & Markakis, Citation2016; Eppen, Citation1979).
Dynamic Backlogging Models. The most tractable and developed setting for multi-period models with stochastic demand and a constant lead time is full backlogging. When stockouts are rare, this model is a reasonable approximation for the lost-sales system. An important concept (due to state reduction) is inventory position, which is the sum of the on-hand inventory plus total pipeline inventory minus backorders. This is the total system inventory available to satisfy future demand if we do not order again.
Assume demand is independent over time. A base-stock policy is optimal if the order cost is linear (no fixed order cost). Each period has a target inventory position called the base-stock level. If the inventory position before ordering is below this level, order up to this level; otherwise, do not order. If the demand is stationary, the myopic base-stock level that minimises a single-period expected cost is optimal. The base-stock level has the same form as the newsvendor quantity, with the holding cost as the overage cost, the backorder cost as the underage cost, and the demand during a lead time replacing the single-period demand. For nonstationary demand, as long as the myopic base-stock levels are nondecreasing in time, the myopic base-stock level is still optimal. See Veinott Jr (Citation1965) and Porteus (Citation1990).
When the order cost is linear plus a fixed cost k, the optimal policy is an (s, S) policy. In each period, if the inventory position before ordering is below a threshold s, order up to S; otherwise, do not order. The key enabler of this result is that the single-period cost is k-convex, a property discovered by Scarf (Citation1960a). When the demand is stationary, the policy is also stationary. In a continuous-review system with Poisson demand, the optimal policy is an (r, q) policy: When the inventory position reaches r, order q units. It is equivalent to the (s, S) policy with r = s and A simple yet effective heuristic policy is to use the optimal base-stock level to approximate r, and use the EOQ formula to approximate q; see Zheng (Citation1992) and Axsäter (Citation1996).
These policy structures have been extended to more complex models, such as Markov modulated demand (Iglehart & Karlin, Citation1960; Song & Zipkin, Citation1993; Sethi & Cheng, Citation1997), exogenous and sequential stochastic lead times (Kaplan, Citation1970; Nahmias, Citation1979; Ehrhardt, Citation1984; Song, Citation1994; Song & Zipkin, Citation1996), capacity constraints (Federgruen & Zipkin, Citation1986a, Citation1986b), unknown demand distribution (Scarf, Citation1959, Citation1960b; Azoury, Citation1985), and a dual-source problem where the lead times of the two sources differ by one period (Fukuda, Citation1964) or the lead times are stochastic and endogenous (Song et al., Citation2017). See Veinott Jr (Citation1966), Perera and Sethi (Citation2022b), Perera and Sethi (Citation2022a), Porteus (Citation1990), and Zipkin (Citation2000) for more detail.
Multiechelon (or multi-stage) inventory systems are common in supply chains where the stages are interrelated, such as production facilities, warehouses, and retail locations. The literature focuses on understanding three basic system structures: series, assembly, and distribution systems.
In a series system with N stages and backlogging, random customer demand arises at stage 1, stage 1 orders from stage 2, and so on, and stage N orders from an outside supplier with ample supply. There is a constant transportation time between two consecutive stages. Define the echelon inventory of each stage to be the inventory at the stage plus all downstream inventories (including those in transit). Assuming no fixed order costs, Clark and Scarf (Citation1960) establish that an echelon base-stock policy is optimal for all stages. That is, we can treat each echelon as a single location and order the echelon inventory position up to a target base-stock level. Axsäter and Rosling (Citation1993) show that for any echelon base-stock policy, there is an equivalent local base-stock policy; therefore, the implementation of the optimal policy is simple. Federgruen and Zipkin (Citation1984b) find that the optimal echelon base-stock policy for the infinite horizon problem can be efficiently obtained. Rosling (Citation1989) proves that under certain mild conditions, an assembly system can be transformed into an equivalent series system, so the Clark-Scarf result applies. Chen and Zheng (Citation1994) further streamline the proofs of these results. Shang and Song (Citation2003) construct effective single-stage newsvendor solutions to approximate the optimal echelon base-stock levels. Chen and Song (Citation2001) show that a state-dependent echelon base-stock policy is optimal for Markov-modulated demand. See Axsäter (Citation1993), Axsäter (Citation2003), Axsäter (Citation2006), Angelus (Citation2023), Federgruen (Citation1993), Kapuściński and Parker (Citation2023), and Shang et al. (Citation2023) for more developments, including batch ordering, capacity limits, distribution systems, transshipment, and expediting.
Many other features are much less tractable, such as lost-sales systems (Bijvank et al., Citation2023), censored demand data, perishable products (Li & Yu, Citation2023), general dual-sourcing systems (Xin & Van Mieghem, Citation2023), distribution systems, and assemble-to-order systems (Atan et al., Citation2017; Song & Zipkin, Citation2003; DeValve et al., Citation2023). Nonetheless, significant progress has been made in recent years on structural properties of the optimal policy, asymptotic optimal policies, and effective heuristics, thanks to more analytical tools such as discrete convexity, asymptotic analysis, and machine learning algorithms. See Chao et al. (Citation2023), Cheung and Simchi-Levi (Citation2023), Shi (Citation2023), and other chapters in Song (Citation2023).
3.13. LocationFootnote60
In the domain of operations research, location problems are concerned with determining the location of a facility or multiple facilities to optimise one or more objective functions under constraints. Location problems seek answers to questions such as how many facilities should be located, where should each facility location be, how large should each facility be, and how should the demand for the facilities’ services be allocated to these facilities (Daskin, Citation1995). An example of a facility to be located is a factory, distribution centre, warehouse, cross-dock, or hub, where demand can be for raw materials, components, products, passengers, data, etc.
Location decisions arise in a variety of public and private sector decision-making problems. Some examples from different sectors include locating landfills where demand is for disposal of household waste (Erkut & Neuman, Citation1989), ambulances where demand is for transporting emergency patients to hospitals (Brotcorne et al., Citation2003), warehouses where demand is for storing products arriving from factories (Aghezzaf, Citation2005), schools where demand is for students (Haase & Müller, Citation2013), regenerators in optical networks where demand is for data (Yıldız & Karaşan, Citation2017), shelter sites where demand is for refugees (Bayram & Yaman, Citation2018), and charging stations where demand is for electric vehicles that need to charge (Kınay et al., Citation2021). More applications of location problems from practice can be found in Eiselt and Marianov (Citation2015).
Location decisions refer to the placement of a facility considering its interactions with demand points (e.g., customers, suppliers, retailers, households) and possibly with other facilities to be located. It includes selecting the location and determining how this location supports meeting a decision-maker or organisation’s objective. It is important to note that facility location decisions are different from facility design decisions. Facility design decisions usually consist of facility layout and material handling systems design. The layout entails all equipment, machinery, and furnishing within the building, whereas material handling systems comprise the mechanism needed to satisfy the required facility interactions. Facilities planning and design are extensively discussed in Tompkins et al. (Citation2010).
Several factors influence facility location decisions, the most prominent ones being transportation costs and the availability of the transportation infrastructure. Among other important factors are the availabilities and costs of land, market, labour, materials, equipment, energy, government incentives, and competitors as well as geographical factors and weather conditions. Distance is usually considered to be one of the most important criteria in facility location models. Several distance metrics can be used in location models such as Euclidean (straight-line), rectilinear (Manhattan), Cheybyshev (Tchebychev), and network distance. Network distance is the distance that is calculated on an existing transportation network, for example, through using Google or Bing maps.
An important criterion to be considered in location problems is how demands are to be satisfied by the facilities to be located. In some applications, the whole demand of each customer must be satisfied from a single facility (“non-divisible” demand) which is referred to as a single source or single allocation. Single allocation location problems are also referred to as location-allocation problems as each demand point is allocated to a single facility. On the other hand, in multiple source/allocation problems, the demand of a single customer can be served from several facilities.
Location decisions are usually classified according to their decision space. In continuous or planar location problems, the facilities can be located anywhere in the decision space. The search is for the optimal coordinates; i.e, latitude and longitude. In discrete location problems, a finite set of potential facility locations is provided, possibly determined through a pre-selection process. In network location problems, on the other hand, there is a given network and the facilities are to be located on this network. In network location problems, facilities can further be restricted to be placed only on the vertices or nodes of this network and not on the edges or arcs, referred to as vertex- or node-restricted location problems.
Continuous location problems focus on minimising some function related to the distance between the facilities to be located and the existing facilities or demand points, such as suppliers and customers, where minisum (minimising the total weighted distance) and minimax (minimising the maximum or worst weighted distance) are among the most commonly employed objectives. Special cases of continuous single-facility location problems with commonly used distance metrics (e.g., rectilinear and Euclidean) are well-studied and polynomial time solution algorithms exist (Francis et al., Citation2004). In the case of multi-facility continuous location problems, the facilities to be located can be homogeneous or non-homogeneous; in the latter, there are different types (e.g., a factory and a warehouse) or sizes of facilities to locate.
One of the most studied discrete location problems is the p-median problem. The goal is to pick a subset p of (homogeneous) facilities to open from among a given set of potential locations that minimise the total transportation cost of satisfying each demand point from the (nearest) facility it takes service from. There is a well-known node optimality theorem by Hakimi (Citation1965) for the p-median problem on networks that proves that at least one optimal solution to the p-median problem consists of locating the facilities only on the nodes of the network (even though a facility is allowed to be located anywhere on the network including any point on an edge between the nodes). Possible applications of the p-median problem are clustering, transit network timetabling and scheduling, placement of cache proxies in a computer network, diversity management, cell formation and much more (Marín & Pelegrín, Citation2019).
An important related problem is the uncapacitated facility location problem (UFLP) which is also referred to as the simple plant location problem. Unlike the p-median problem, in UFLP, the number of facilities to be located is no longer known and determined by optimising an objective function that considers the trade-off between the fixed costs of locating facilities and the transportation costs. Numerous extensions of UFLP with uncertainty, multiple commodities (e.g., products or services), multi-period planning horizon, multiple objectives, and network design decisions have been studied with applications in several domains such as supply chain and distribution systems design.
A nice structure of p-median and UFLP is that since the facilities to be located are assumed to have enough capacity (e.g., space or labour hour), all demands of each customer can be served from a single facility with minimum allocation costs. This is no longer the case for capacitated versions of the facility location problems, where single- and multiple-allocation versions are both extensively studied. For multiple allocation capacitated (fixed-charge) facility location problems, when the set of open facilities is given, the resulting subproblem of finding the best allocations is a transportation problem. In the single allocation case, on the other hand, when the set of open facilities is pre-determined the resulting allocation subproblem is a generalised assignment problem (Fernández & Landete, Citation2019).
When the worst-case is more important than the average, it might be better to consider the furthest or most disadvantaged demand point to ensure equity in servicing the demand. Accordingly, the p-centre problem aims to locate p facilities such that the maximum distance (or travel time/cost) from a demand point to its nearest facility is minimised (minmax). The p-centre problem can be used to locate public schools and various emergency service facilities such as police stations, hospitals, and fire stations. Different variations of this problem have been studied such as the capacitated, conditional, continuous, fault-tolerant, and probabilistic p-centre problems (Çalık et al., Citation2019).
In covering location problems, the aim is to locate facilities so as to cover demand. Typically, a demand point is considered to be covered if it is within a certain distance or travel time of a facility. Unlike in the previous models, the demand points are not assigned to facilities in covering location problems. The two most common covering location problems are set covering and maximal covering location problems. In the set covering location problem, the aim is to minimise the total cost of locating facilities to cover all demand points, whereas, in the maximal covering location problem, the aim is to maximise the total demand covered subject to a budget constraint or a constraint on the total number of facilities to locate. Continuous variants of these covering location problems are also studied (Plastria, Citation2002). Several different versions of covering location problems have been studied in the literature, including, but not limited to weighted, redundant, hierarchical, backup covering problems with applications in emergency services, crew scheduling, mail advertising, archaeology, metallurgy, and nature reserve selections (García & Marín, Citation2019).
In general, facility location problems consider and model only a single echelon; i.e., either the flows of commodities (e.g., products, customers) coming into or out from the facilities to be located are negligible, for instance, when one of those transportation costs is borne by another decision-maker and somehow not related to the current decision-making problem. An example would be a manufacturing company determining the location of its new factory for delivering products to its customers with minimum total cost, where the company is not directly involved in the delivery of raw materials from their suppliers to the factory. When the flow of commodities coming into the facilities to be located as well as the flow going out of those facilities are simultaneously considered in the models, these location problems are referred to as two-echelon location problems. For example, while locating a distribution centre, the transportation cost of products from the factory to this distribution centre as well as the transportation costs from the distribution centre to the retailers may need to be considered in the model. Sometimes there are facilities to be located at several echelons where flows of commodities in and out of all those facilities need to be considered. These multi-echelon types of location problems are encountered for several applications of supply chain network design (Melo et al., Citation2009). Another related category is when there is a hierarchical network structure among the facilities to be located, referred to as hierarchical facility location problems (Şahin & Süral, Citation2007). An example of a hierarchical location problem is designing a postal delivery network where the locations of the sorting centres as well the locations of the post offices that are to be allocated to those sorting centres need to be determined.
There might also be interactions among the facilities to be located. This is the case, for example, for hub location problems where the demand is defined between pairs of demand points (origin-destination pairs) as opposed to having the demand of an individual point. In that case, to satisfy the demand from an origin to a destination point, flow can be transported between the facilities to be located en route to the destination, where those facilities can act as switching, transshipment, sorting, connection, consolidation, or break-bulk points. Hub location models have several applications in passenger and freight airlines, express shipment, postal delivery, trucking, public transit, and telecommunication network design (Alumur et al., Citation2021).
Location problems have been a testbed for many algorithmic and methodological advances in operations research. Most discrete location problems commonly belong to a class of -hard decision problems (§2.5) and they can usually be formulated with mixed-integer programming (MIP) models (see §2.15). In addition to using commercial MIP solvers, several exact and (meta)heuristic algorithms (§2.13) have been developed and tested on benchmark instances from the literature. Some of those benchmark instances can be obtained from Beasley (Citation1990), Posta et al. (Citation2014), and Fischetti et al. (Citation2017b).
Location science is a very broad field of research that encompasses geography, continuous and discrete optimisation (§2.4), graph theory (§2.12), logistics (§3.14), and supply chain management (§3.24). This section only highlights the basic and most well-known location models. For a more detailed overview of the field of location science, we refer the reader to several books written in this field, such as Drezner and Hamacher (Citation2004), Eiselt and Marianov (Citation2011), and Laporte et al. (Citation2015).
3.14. LogisticsFootnote61
Logistics refers to the organisation and implementation of the processes related to the procurement, transport and maintenance of materials, personnel and facilities. The application of operational research to logistics dates back to 1930 (Schrijver, Citation2002), where Tolstoı (Citation1930) solved to optimality the problem of transporting salt, cement, and other cargo on the railway network of the Soviet Union. In general, the objective of logistics management can be summed up as “getting the right thing/people to the right place at the right time in the right quantity at the right cost”. For materials, logistics operations require the co-ordination of forecasting, purchasing, inventory control, warehousing, distribution, transportation, delivery and installation. Logistics management of personnel involves, in addition, skills matching, capabilities training, labour rules and worker preferences. At a strategic level, logistics involves the design of the transport network and facilities. In this subsection, we discuss several major domains of logistics applications, namely, military, inventory, time-sensitive, reverse and humanitarian logistics. We also mention some new technologies for emerging logistics applications.
3.14.1. Military logistics
Logistics play an important role in military operations. Indeed, the word “logistics” itself is derived from the position Maréchal des logis created in the French army in the 17th century, whose responsibilities of establishing camps and arranging transport/supplies were referred as “la logistique” (de Jomini, Citation1862). Many historians credited logistics as the success factor in wars from ancient to modern times. During World War II, the need for large-scale logistics planning accelerated the development of operational research. The ability to sustain the convoy of supply ships was a major factor in the Battle of the Atlantic (Kirby, Citation2003). The 1948-1949 Berlin Airlift, where over 2.3 million tons of goods were flown to besieged West Berlin, is well-known as the first use of logistics as a military and political strategy (Tine, Citation2005).
The North Atlantic Treaty Organisation defines logistics as the science of planning and carrying out the movement and maintenance of forces, and covers acquisition, transport, maintenance and evacuation of materiel, personnel and facilities, and provision of services and medical support. Operational research methodologies are extensively used (Scala and Howard II, Citation2020). Reliability and operability of the supply lines are a major concern in military logistics (McConnell et al., Citation2021), and simulation is much utilised. Cioppa et al. (Citation2004) review agent-based simulation for military applications. Emerging technologies – such as additive manufacturing (den Boer et al., Citation2020) and unmanned transport (Jotrao & Batta, Citation2021) – have also sparked research in smart military logistics (Schütz & Stanley-Lockman, Citation2017). The reader is also referred to §3.16.
3.14.2. Inventory logistics
In modern logistics, most activities are related to products and goods, where their availability to customers or users is a key concern. Inventory, thus, plays an important role in this respect. A classic problem related to inventory logistics is the inventory-routing problem (IRP), introduced by Bell et al. (Citation1983) for the distribution of industrial gases. Since then, various IRP applications have been studied, including those related to automobile components (Blumenfeld et al., Citation1985), groceries (Gaur & Fisher, Citation2004), cement (Christiansen et al., Citation2011). Typically, IRP arises in vendor-managed inventory systems as the supplier monitors the inventory and makes replenishment decisions for its retailers (Archetti et al., Citation2007). Because inventory can be carried from one period to the next, IRP considers joint decisions of inventory and routing across multiple periods and aims to minimise the total transportation and inventory holding costs over the planning horizon, subject to all demands being satisfied. Speranza and Ukovich (Citation1994) extended the IRP to settings with multiple products. When demands are uncertain, IRP becomes stochastic IRP (Federgruen & Zipkin, Citation1984a; Trudeau & Dror, Citation1992), where the objective function includes additional shortage cost. Coelho et al. (Citation2014) investigated the stochastic dynamic IRP where decisions are made as customers’ demand become realised. Inventory logistics is even more timely today due to e-commerce (Archetti & Bertazzi, Citation2021). The main challenge of these inventory logistics problems is due to the computational complexity of solving multiple -hard problems simultaneously. The reader is also referred to §3.12.
3.14.3. Time-sensitive logistics
The quality and functionality of items, in storage or transit, deteriorate over time. For items such as fresh vegetables, the value degrades continuously. Other perishables, such as blood, have fixed lifetimes and cannot be used beyond expiry. Logistics management of time-sensitive goods must consider production, distribution and transport jointly. Federgruen et al. (Citation1986) was one of the first papers to consider jointly inventory allocation and transportation for fixed-lifetime perishables with probabilistic demand. Since then, there has been much research exploring additional issues, such as freight consolidation (Hu et al., Citation2018), storage/transport capacities (Crama et al., Citation2022) and environmental concerns (Govindan et al., Citation2014). Shaabani (Citation2022) gives a comprehensive literature review.
For continually decaying food items, delivery costs must be traded off with freshness-upon-arrival which may lead to lost sales or revenue (Mirzaei & Seifi, Citation2015). The overall network design – especially decisions on where along the supply chain processing occurs – is important, since deterioration rates differ for unprocessed vs. finished/packaged goods, and for items in transport vs. in storage (de Keizer et al., Citation2017).
An important category of perishable goods is blood. Integer-programming models were developed by Hemmelmayr et al. (Citation2009) for collection and distribution of blood products to Austrian hospitals, and by Araújo et al. (Citation2020) for blood delivery in south Portugal. Pirabán et al. (Citation2019) survey research on blood supply chain management.
3.14.4. Reverse logistics
Due to increased sustainability awareness and legislation, reducing the environmental impact of production and distribution has become important. Twenty years ago, Beamon (Citation1999) advocated that supply chains must be extended from one-way to a closed loop, where used products and materials are recovered for re-use, recycle or re-manufacture. Reverse logistics, thus, refer to the material flow from the point of consumption back upstream for regenerating value (Rogers & Tibben-Lembke, Citation2001). Compared to a forward supply chain, reverse logistics processes are more complicated. Firstly, the source, quality and quantity of recoverable used products/materials from end-users are highly unpredictable. There is an added decision-stage for inspection, evaluation and sorting of the collected materials, and streaming them into various processes (re-use, re-manufacture, disassembly, disposal, etc.). These re-purposing processes may be expensive, so trade-offs must be made between recovery cost and salvage value.
Re-manufacturing, where items are repaired to serviceable (like-new) condition, is an important aspect of reverse logistics. Simpson (Citation1978) was the first to address a multi-period repairable inventory problem with random demand and returns supply; using dynamic programming, he found the optimal policy structure which specified the repair, purchase and scrap levels for each period. Later, the model was extended to consider side-sales (Calmon & Graves, Citation2017) and warranty demands (Lin et al., Citation2020a). Nowadays, the concept of reverse logistics is broadened holistically to closed-loop supply chains and the circular economy (Santibanez Gonzalez et al., Citation2019). See Van Engeland et al. (Citation2020) for a recent review.
3.14.5. Humanitarian logistics
When disasters strike, speedy evacuation and prompt delivery of resources to affected areas are critical. From some sparse early studies (Sherali et al., Citation1991), humanitarian logistics research grew rapidly since 2000. The research stream yielded insights that have changed how humanitarian agencies plan and manage disaster relief. A key concept is inventory pre-positioning where depots are set up already stocked with supplies in anticipation of disaster occurrences, instead of scrambling for procurement in the aftermath. Duran et al. (Citation2011) developed a facility-location and supply pre-positioning plan for CARE. See also Rawls and Turnquist (Citation2011). Many of the models used are large-scale mixed-integer-programming models.
Humanitarian logistics involve multiple objectives: costs, response urgency and fairness are all important. Huang et al. (Citation2012) considered equity in last-mile distribution; Sheu (Citation2014) incorporated perceptions of people awaiting rescue. Other researchers considered decision under uncertainty: Mete and Zabinsky (Citation2010) developed a stochastic model for location and delivery of medical supplies. Yet other research took an interdiction approach and anticipated post-disaster deployment (O’Hanley & Church, Citation2011; Irohara et al., Citation2013). Recent technological advances have stimulated new research and practices. Maharjan et al. (Citation2020) investigated pre-positioning of mobile logistics/ telecommunications hubs for Nepal. See Behl and Dutta (Citation2019) for a survey. The reader is also referred to §3.4.
3.14.6. Emerging technologies
As technologies advance, the role of logistics has become more important in the Industry 4.0 era (Tang & Veelenturf, Citation2019). Tracking and locating technologies (RFID, GPS, IoT, etc.) enable organisations and companies to acquire information in real time. Powerful computing facilities can perform analytics of massive volumes of historical data to support near real-time solutions for large-scale problems – essential for city logistics involving thousands of orders to fulfil within a day, or even an hour. Exciting emerging applications include TSP/VRP for routing of drones (Masmoudi et al., Citation2022) and/or autonomous vehicles (Reed et al., Citation2022), risk analysis powered by block-chain technology (Choi et al., Citation2019), flow-based optimisation for crowd-sourcing logistics (Sampaio et al., Citation2020) and cargo hitching (Fatnassi et al., Citation2015), demand-driven optimisation for car/bike sharing systems (Wang et al., Citation2022e), and queuing and simulation for robotic warehouses (Fragapane et al., Citation2021).
These more complex and larger-scale problems with tighter response times require new solution methodologies. Most of these new approaches are combinations of operational research and data science techniques, for example, robust optimisation (Zhang et al., Citation2021), reinforcement learning (Yan et al., Citation2022c) and other machine learning-based optimisation approaches (Bengio et al., Citation2021).
3.15. ManufacturingFootnote62
Manufacturing is the production process from materials to goods. Such goods can be finished goods sold to end consumers or components sold to other manufacturers for the production of other more complex products. Manufacturing has gone through several different phases (Industry 2.0 to 4.0) in the twentieth and twenty-first centuries. Here we offer an overview of important manufacturing topics in different time periods.
In Industry 2.0 (from the end of nineteenth century to the 1980s), demand was relatively stable. Important manufacturing systems include the Toyota production system (TPS) and cellular manufacturing. The aim of these systems is to increase productivity with lower production cost, which fits the needs of a stable market during this time period.
Taichi Ohno published Toyota Seisan Hoshiki describing the TPS in 1978. TPS is an integrated production system that can supply products to meet both requirements of product volumes and product varieties. Research and practical papers, reports, and books were published in various media to describe TPS. The underlying management principles and theoretical mechanisms of TPS are well-known. A TPS is an integrated production system that generates products to satisfy requirements of volumes and varieties simultaneously with minimum resource waste. A large number of TPS enablers have been reported and include just-in-time material system (JIT-MS), seven wastes, heijunka, multi-skilled workers, quick set-up and changeover, and keiretsu. Excellent analysis and review papers on the TPS are de Treville and Antonakis (Citation2006), Hines et al. (Citation2004), and Narasimhan et al. (Citation2006).
Cellular manufacturing (CM) uses group technology to efficiently produce a high variety of parts. Cells are converted from job shops with functional layouts to improve efficiency (Yin & Yasuda, Citation2006). A cell consists of a machine group and a part family. The first step in CM system design is cell formation. Part families and machine groups are identified to form manufacturing cells such that the intercell movements of parts are minimised. Parts in the same family have similar machining sequences. Machines in a cell are arranged to follow this sequence. In this way, parts flow from machine to machine in their processing sequence, resulting in an efficient machining flow that is similar to an assembly line. For each part family, the volume of any particular part type may not be high enough to utilise a dedicated cell. The total volume of all part types in a part family should be high enough to utilise a machine cell well. CM attempts to flexibly accommodate high variety and simultaneously efficiently take advantage of flow lines (Celikbilek & Süer, Citation2015).
In Industry 3.0 (from the 1980s to today), demand is relatively volatile because of technological innovations, higher product variety, and shorter product life cycles. The important manufacturing topics include flexible manufacturing systems (FMSs) and seru production system. The theme of these topics is to meet the increased demand for high variety and short delivery time. Product life cycles decreased during this time period, which drives manufacturers to focus on responsiveness and delivery time. Short changeover time between different product types is useful.
An FMS is an integrated, computer-controlled manufacturing system of automated material handling and computer numerically controlled machine tools that can simultaneously process medium-sized volumes of a variety of part types. A fully automated FMS can attain the efficiency of well-balanced, machine-paced transfer lines, while utilising the flexibility that job shops have to simultaneously machine multiple part types (Stecke & Solberg, Citation1981; Stecke, Citation1983; Browne et al., Citation1984).
A seru production system is an assembly system that has been adopted by many Japanese electronics companies. Yin et al. (Citation2008) is the first English language paper on seru production. They describe and analyse the success of seru production systems in Canon and other Japanese companies. It is more flexible than TPS, which cannot achieve the required responsiveness in this innovative time period. A seru production system consists of one or more serus. Serus within a seru system are quickly reconfigurable, i.e., they can be constructed, modified, dismantled, and reconstructed frequently in a short time. There are three types of serus, called divisional serus, rotating serus, and yatais. They represent the evolutionary development of serus. A divisional seru is a short, often U-shaped, assembly line staffed with several partially cross-trained workers. Tasks within a divisional seru are divided into different sections. One worker is in charge of each section. A rotating seru is often arranged in a U-shaped short line with several workers. Each worker performs all required tasks from start to finish without interruption. Tasks are performed on fixed stations, so workers walk from station to station. A worker follows the worker ahead of her or him, and is also followed by the worker behind her or him. A seru with only one worker is called a yatai. An important performance of the seru production system is that it can quickly respond to product varieties with fluctuated volumes. By applying seru, delivery time is reduced. Variety and volume are easily handled.
The TPS-based assembly line became inefficient because of an inability to change very frequently to produce small-volume demands. The typical seru creation process in Sony and Canon can be summarised as follows (Yin et al., Citation2017). Assembly lines were dismantled and replaced with divisional seru systems through resource co-location and removal/replacement, cross training, and autonomy. The technique of karakuri (involves procedures to discover and appropriate the useful functions of expensive equipment into inexpensive self-made equipment) is applied to replace expensive dedicated equipment by inexpensive self-made and/or general-purpose equipment that can be duplicated and redeployed as needed by serus. As cross-training progresses, divisional serus evolve into rotating serus and yatais.
More details about the underlying management and control principles of seru can be found in Stecke et al. (Citation2012), Yin et al. (Citation2008), Yin et al. (Citation2017), and Liu et al. (Citation2014). Roth et al. (Citation2016) reviews the last 25 years of OM research and provides eight promising research directions, one of which is seru production systems.
Today, manufacturing has entered a new age (Industry 4.0) because of the emergence of disruptive technological innovations. Examples of important manufacturing topics include smart manufacturing, mass-customisation, sustainable manufacturing, and additive layer manufacturing. Strozzi et al. (Citation2017) examines the evolution, trends, and emerging topics of a smart factory and provides topics for future research. Hughes et al. (Citation2022) provides a review for manufacturing in the Industry 4.0 era.
Smart manufacturing refers to flexible and adaptable manufacturing processes through integrated systems and using advanced technologies such as sensors, IoT, cloud computing, big data, artificial intelligence, automation, robots, cyber-physical systems, and additive layer manufacturing. Some detailed discussions can be found in Ivanov et al. (Citation2016), Kersten et al. (Citation2017), Liao et al. (Citation2017), Theorin et al. (Citation2017), Thoben et al. (Citation2017), and Hughes et al. (Citation2022).
One important benefit of smart manufacturing is that it aids the capability of mass customisation and short lead time to quickly meet changing demands. Zawadzki and Żywicki (Citation2016) suggested smart product design and production control for efficient operations in a smart factory to enable mass customisation. Brettel et al. (Citation2014) show that self-improving smart manufacturing systems can utilise data and quickly react (e.g., reconfigure) to personalised customer orders, which helps realise mass customisation. Some efficient mathematical models that use big data to manage and control manufacturing processes can be applied in smart factories (Ivanov et al., Citation2016, Citation2017).
Sustainable manufacturing aims to minimise negative environmental impacts while conserving energy and natural resources. Sustainable manufacturing also enhances employee, community, and product safety. The emergence of blockchain technology and its potential disruption within the manufacturing and supply chain industries present opportunities for greater levels of sustainability in Industry 4.0. The immutability and smart contract capability of blockchain technology allow the provenance and integrity of products to be monitored more effectively. These factors contribute to reducing verification costs and the provision of real-time status information on the quality of materials throughout the supply chain (Ko et al., Citation2018). The disintermediation attributes of blockchain can directly contribute to manufacturing sustainability by effectively reducing complexity, and improving efficiency with less waste via the streamlining of the supply chain (Hughes et al., Citation2019).
Additive layer manufacturing may generate a disruptive and revolutionary impact on manufacturing (Garrett, Citation2014). It enables a manufacturer to further increase responsiveness by reducing lead time and increasing customisation levels. Long et al. (Citation2017) provide a definition, characteristics, and mainstream technologies of 3D printing. Dong et al. (Citation2016) compared the optimal assortment strategies under traditional flexible technology and 3D printing to find that 3D printing may allow a larger set of product assortment. Song and Zhang (Citation2020) and Ivan and Yin (Citation2017) examined the use of 3D printing on a logistics system for spare parts inventory design. 3D printing tends to be slower than other manufacturing methods, which currently limits its use in practice.
For a detailed encyclopedic overview of the manufacturing field, both in terms of theory and practice, see Yin et al. (Citation2017). They discuss and compare production systems from Industry 2.0 to Industry 4.0. The demand dimensions of each industry era are analysed and provided as the driving force for the changes in the production systems over time.
3.16. Military and homeland securityFootnote63
The birth of OR is related to the use of optimisation modelling for military operations and resource planning during the Second World War. The early linear programming (§2.14) problems ranged from the efficient use of weapon systems to logistics and strategy planning. Today, the arena of defence has expanded extensively with new areas including information and cyber warfare. The need to counter terrorism has created the field of homeland security. OR has a role in all these emerging topics. One can say that all OR methods are applied in military and homeland security problems.
Optimisation methods are used in a wide range of defence and security applications. For instance, assigning weapons to targets (Kline et al., Citation2019) using integer programming (§2.15; §2.4) has been addressed with a variety of optimisation algorithms. Other integer programming studies include, for example scheduling of training for military personnel (Fauske & Hoff, Citation2016) as well as military workforce and capital planning (Brown et al., Citation2004). Mixed integer linear programming is utilised in diverse applications such as path planning of unmanned ground and areal vehicles including drones, mission planning, acquisition decisions of military systems as well as load planning in transportation. Optimisation of vehicles’ routes is also carried out by solving network optimisation problems (§2.12) with shortest path algorithms (Royset et al., Citation2009). Network optimisation is also used, e.g., in developing military countermeasures. Examples of bilevel and robust optimisation (§2.21) formulations cover positioning of defensive missile interceptors (Brown et al., Citation2005) and design of a supply chain for medical countermeasures against bioattacks (Simchi-Levi et al., Citation2019). Multiobjective optimisation has been applied, for example in optimising boat resources of coast guard (Wagner & Radovilsky, Citation2012) and planning of airstrikes against terrorist organisations (Dillenburger et al., Citation2019). Inherent structures of specific military optimisation problems have motivated the development of new solution techniques (Boginski et al., Citation2015) including, for example, metaheuristics (§2.13). Such techniques are used, e.g., for solving nonlinear military optimisation tasks (§2.16) such as design of projectiles.
Game theoretic modelling (§2.11) is used in many defence studies. Information related topics include misinformation in warfare (Chang et al., Citation2022) and public warnings against terrorist attacks (Bakshi & Pinker, Citation2018). Examples of game theoretic strategy design problems cover the optimal use of missiles and the validation of combat simulations (Poropudas & Virtanen, Citation2010). Designing security and counter strategies against enemies, terrorists and adversarial countries naturally lead to the use of game models. Interdiction network game models arise in security applications (Holzmann & Smith, Citation2021), and they are used, e.g., in route planning through a minefield.
Military simulation models (§2.19) are classified into constructive, virtual and live simulations (Tolk, Citation2012). Constructive simulations do not involve real-time human participation. They are based on well-known modelling methodologies such as Monte Carlo, discrete event and agent-based simulations. Applications of constructive models cover, e.g., the development and use of weapons, sensor and communications systems, planning of operations and campaigns, improving maintenance processes of military systems, and evaluating effects of fire. In addition, cyber-defence analyses have been conducted (Damodaran & Wagner, Citation2020). Constructive simulations have also been used in simulation-optimisation studies such as scheduling maintenance activities of aircraft, military workforce planning, and aircraft fleet management (Mattila & Virtanen, Citation2014; Jnitova et al., Citation2017).
The complexity of modelling human behaviour generates a major challenge for constructive simulation. This issue is avoided in virtual simulations, i.e., simulators in which real people operate simulated systems and in live simulations where real people operate real systems with simulated weapon effects. These practices are typically used, e.g., in military exercises and training of personnel. An emerging trend is to combine live, virtual and constructive simulations into a single simulation activity (Mansikka et al., Citation2021b). Applications of this simulation type vary from training to testing large-scale systems and mission rehearsals (Hodson & Hill, Citation2014). In a combined simulation, new ways to measure performance are introduced (Mansikka et al., Citation2021a) by complementing traditional measures such as loss exchange or kill ratio by human measures such as participants’ situation awareness, mental workload and normative performance (Mansikka et al., Citation2019).
Features of virtual simulation can be recognised in wargaming (Turnitsa et al., Citation2021) that has been used for military training and educating since the early 19th century. Other wargaming areas are, for example, examination of warfighting tactics as well as evaluation of military operations and scenarios. Nowadays, wargames are also applied in studies of international relations and security as well as in analyses of government policy, international trade, and supply-chain mechanics (Reddie et al., Citation2018). The implementations of wargames range from manual tabletop map exercises to computer-supported setups in which different OR and artificial intelligence techniques are utilised (Davis & Bracken, Citation2022).
Dynamic phenomena regarding military and defence are often represented with differential or difference equations. Examples of these models are Lanchester attrition equations that describe the evolution of strengths of opposing forces in gunfire combat (e.g., Jaiswal, Citation2012). There are also several modifications of these equations aiming to model, e.g., asymmetrical combat, tactical restrictions and even morale issues. Another example of simple combat models is the salvo model that represents naval combat of warships involving missiles (Hughes, Citation1995). Optimal control (see also §2.6) has been utilised, for example in planning optimal paths of military vehicles as well as in guidance systems of unmanned aerial vehicles, drones and missiles (Karelahti et al., Citation2007). For a recent overview, see for example Israr et al. (Citation2022). Another type of optimal control application is the assignment of resources to counter-terror policies and measures (Seidl et al., Citation2016). Markov decision processes and approximate dynamic programming (§2.9) have recently emerged as important techniques for analysing dynamic military decision-making problems related to, e.g., missile defence interceptors and military medical evacuation (Jenkins et al., Citation2021).
The need for multicriteria evaluation is common in military decision-making. Example applications of multi-criteria decision analysis (MCDA; see also §2.8) are acquisition of military systems and equipment procurement, military unit realignments and base closures, locating military bases, and assessment of future military concepts and technologies (Ewing et al., Citation2006; Geis et al., Citation2011; Harju et al., Citation2019). Public procurement even for the military is regulated in many countries, and directives require it to consider multiple criteria (Lehtonen & Virtanen, Citation2022). It is interesting to notice that the recent acquisition decision of a 5th generation multirole fighter aircraft in Finland was, indeed, supported by MCDA (Keränen, Citation2018). MCDA weighting methods have also been used to create measures of mental workload in military tasks (Virtanen et al., Citation2022). In portfolio decision analysis problems, the goal is to find the best set of components, e.g., in weapons systems or in force mix for reconnaissance, with respect to multiple criteria (Burk & Parnell, Citation2011). The evaluation of the effectiveness of military systems calls also for the use of cost-benefit analysis (§2.18; Melese et al., Citation2015). Data envelopment analysis (§2.7) is a multicriteria approach helping to seek efficiency also in military problems such as personnel planning.
MCDA studies in homeland security is a broad area ranging from the design of countermeasure portfolios to threat analysis and cyber-security (Wright et al., Citation2006). The questions of interest include, e.g., identification of terrorists’ goals and preferences, estimation of attacks’ consequences, and comparison of countermeasure actions (Abbas et al., Citation2017). Cost-benefit models are also relevant in terrorism research (Hausken, Citation2018).
Today, we are witnessing the vast growth of the use of machine learning and artificial intelligence (§2.1) in military and security problems (Dasgupta et al., Citation2022; Galán et al., Citation2022). Such problem areas are, e.g., wargaming and simulation, command and control of autonomous unmanned vehicles including drones, air surveillance, and cyber-security only to mention a few. Data analytics (see also §2.3) is naturally also used in military OR (Hill, Citation2020), e.g., for supporting logistics planning. Considering uncertainty is essential, e.g., in intelligence analysis and risk analysis related to terrorism (see also §2.18) . Adversarial risk analysis (Rios Insua et al., Citation2021) uses Bayesian approaches (see also §2.18) for taking into account information, beliefs and goals of adversaries. A similar approach is also applied in the modelling of pilot decision-making in air combat with influence diagrams (Virtanen et al., Citation2004). Markov models and Bayesian networks are used to evaluate risks and conduct time dependent probabilistic reasoning related to military missions (Poropudas & Virtanen, Citation2011). Kaplan (Citation2010) studies the infiltration and interdiction of terror plots using queueing theory (§2.17).
In the future, combat models need to include socio-cultural and behavioural factors (Numrich & Picucci, Citation2012). We are also likely to see an increase in the modelling of individual and group behaviour as well as the consideration of behavioural issues in military and homeland security contexts. Behavioural game theory can give insights into military strategy and conflict situations. Behavioural OR (§2.2), which studies the impacts of the human modeller and model users including cognitive biases in decision support, is likely to receive increasing attention in military applications as well.
For further readings, we refer to the military OR textbooks by Fox and Burks (Citation2019) and Jaiswal (Citation2012). The recently edited volume by Scala and Howard II (2020) describes various OR methods and how to apply them in military problems. Abbas et al. (Citation2017) and Herrmann (Citation2012) focus on homeland security modelling.
3.17. Natural resourcesFootnote64
Climate change and natural resource management require different quantitative and qualitative models that support public policy (Ackermann & Howick, Citation2022). One of the early papers on the use of modelling for natural resource utilisation describes a resource analysis simulation procedure to assess the environmental impact of human activities (Bryant, Citation1978). The procedure comprises a structural model to express the complex network of interacting human activity systems and a parametric model to determine the scale of the activity being modelled.
An integrated decision support system for water distribution and management was built to generate alternative water allocation and agricultural production scenarios for a semi-arid region (Datta, Citation1995). The model considers ground and surface water sources as the supply. The water demand is a combination of the need for drinking, irrigation, household and public utility, natural vegetation, industrial use, and ecological balance. The decision support tool visualises water allocation to competing crops under a range of simulation scenarios, providing a wider set of options to the department taking decisions how water is distributed.
A web-based decision support system developed for the US Fish and Wildlife Service and the US Geological Survey initiative facilitates cross-organisational data sharing and performs analyses to improve conservation delivery (Hunt et al., Citation2016). Situation-specific management actions such as controlled burn or prescribed graze required by this decision support tool improves ecological outcomes of other conservation efforts. Buffelgrass is an invasive species that causes significant damage to the native desert ecosystem. A multi-period multi-objective integer programming model was proposed to find optimal treatment strategies to control the buffelgrass population in the Arizona desert (Büyüktahtakin et al., Citation2014). The multiple objectives minimise damage to threatened resources: a native cactus species (saguaros), buildings, and vegetation subject to budget and labour constraints. The results show the necessity of cooperation between different interest groups to establish reasonable treatment strategies and the need for a policy change because current resources cannot stop an ecological disaster in the future.
A mixed-integer programming model is developed to evaluate fishery management policies over an infinite horizon by incorporating steady state levels of variables into a multi-period analysis framework (Glen, Citation1997). This model is intended to be used annually with updated stock estimates to set a dynamic total allowable catch per year depending on the stock estimates over several years. Statistical and fuzzy multiple criteria analysis establishes which materials contribute the most to the presence and the abundance of species in artificial reef structures (Shipley et al., Citation2018). Managers of fisheries can use this model to screen different species without loss of rigour and validity of results. Multiple-criteria analysis is used in conjunction with integer programming to assist complex management plans in ecology and natural resources (Álvarez-Miranda et al., Citation2020). A case study on the Mitchell River catchment (Australia) shows the trade-offs between ecological, spatial, and cost criteria, enabling decision-makers to explore and analyse a broad range of conservation plans. The use of catastrophe theory in management of natural resource systems are described with cases on forestry and fishery management (Wright, Citation1983). Catastrophe theory applies the mathematical theory of structural stability to practical systems. It allows modelling of ecosystems with low and high levels of predator and prey populations. It helps model a catastrophic jump from one level to the other, supporting decision making for management of natural resources.
As a natural resource, wind provides clean, renewable, and sustainable energy. A multi-objective model minimises cost and idle time under reliability thresholds, maintenance priority, and opportunism (Ma et al., Citation2022). Reliability thresholds trigger maintenance activity. Maintenance priority indicates which maintenance tasks need to be performed under limited maintenance resources. Opportunistic approach indicates whether additional maintenance should be performed when a maintenance team is already out to service several turbines. The proposed multi-objective optimisation model is tested using a stochastic simulation model of a wind farm and confirmed to keep the wind system at a higher performance level with lower cost and higher availability.
Natural resource exploration is frequently subject to real options analysis (Nishihara, Citation2012; Martzoukos, Citation2009). A stochastic mixed integer nonlinear programme is proposed to incorporate geological and market uncertainty into mineral value chain optimisation (Zhang & Dimitrakopoulos, Citation2018). Simulation of mine deposits and commodity market informs the profitability of strategic and tactical plans. A range of real options applied to natural resource management include investments in infrastructure, use of land, and management of natural resources (Trigeorgis & Tsekrekos, Citation2018). Firms require high output price levels to invest in environmental technologies, because they would not want to commit to an investment that could turn out to be unprofitable in the event of a price fall (Cortazar et al., Citation1998).
Several papers are published on the use of operational research for natural resource management. Typical operational research problems and actors in agricultural supply chains informs strategic investment and operations management under increased pressure on natural resources (Plà et al., Citation2014). The contribution of operational research applications to agricultural value chain sustainability and resilience call for applications of complex systems methods such as agent-based modelling, systems modelling, and network analysis (Higgins et al., Citation2010). A review of environmental management and sustainability papers in major management science/operational research and systems journals revealed dominance of hard optimisation methods (Paucar-Caceres & Espinosa, Citation2011).
The environment-development problem concerns reconciling industrial development and environmental protection. A methodological framework is proposed to model the environmental impact of development under uncertainty arising from the degree of unpredictability arising from decision makers and environmental processes (Dzidonu & Foster, Citation1993). Natural resource development contracts depend on the bargaining power of transnational corporations and host country governments (Anandalingam, Citation1987). Contracts that stipulate sharing of the net income from resource development between the developing corporation and the government show that government would receiver higher income if many corporations are involved and if the government agrees to contribute to production costs. A review of Operational Research in mine planning reports optimisation and simulation applied to surface and underground mine planning problems, including mine design, long- and short-term production scheduling, and equipment selection (Newman et al., Citation2010). The operational research on mining is evolving to solve larger and more detailed and realistic models.
A series of cases studies from Asia, Africa, and Latin America presents principles and applications of an integrated approach to natural resources management, including the complexity of systems and redirecting research towards participatory approaches, multi-scale analysis, and tools for systems analysis, information management, and impact assessment (Campbell & Sayer, Citation2003). A specialised book on the Baltic region presents scientific research on activities depleting natural resources, emissions from energy use, pollution, and strategies for environmental management (Fenger et al., Citation1991). Stochastic Models and Option Values: Applications to Resources, Environment and Investment Problems presents a collection of research papers on the use of control theoretic methods to address problems that arise in natural resource development (Lund & Oksendal, Citation1991). Strategic Planning in Energy and Natural Resources contain innovative and methodologically rigorous operational research applications (Lev et al., Citation1987). The Handbook of Operations Research in Natural Resources collate research papers that address optimal allocation of scarce resources in agriculture, fisheries, forestry, mining, and water resources (Weintraub et al., Citation2007). Operations Research and Environmental Management organises its content by regional and global policies (Carraro & Haurie, Citation1996). Models help local and regional authorities optimise their energy distribution and minimise natural resource waste.
3.18. Open-source software for ORFootnote65
Commercial solvers for solving Operational Research (OR) problems have been used for several decades and have provided both practitioners and academics with access to the state-of-the-art OR techniques. Mathematical programming solvers IBM ILOG CPLEX (IBM Citation2022), Gurobi (Gurobi, Citation2022), BARON (Sahinidis, Citation1996), and discrete event simulation software Arena (Rockwell Automation, Citation2022) and Simul8 (Simul8 Corporation, Citation2022) are among the best-known examples. There also exists ad-hoc software for particular problems raising in manufacturing (e.g., AIMMS; AIMMS, Citation2022), healthcare (e.g., SimCAD Pro Health; CreateASoft Inc., Citation2022), and logistics (e.g., AnyLogistix The AnyLogic Company, Citation2022). The strength of commercial software is primarily based on the fact that they provide users with a simple interface to declare a problem, utilise state-of-the-art solution algorithms, and visualise the result with minimal effort.
These software do not only solve problems but also provide modelling, debugging, and scenario analysis to improve the solution process (Dagkakis & Heavey, Citation2016). However, the lack of access to the source code and knowledge of how these tools work internally inhibit users from customisation. It is difficult to contribute to the development of commercial software as it is a black-box to the end-user. The high licence costs of those software has been one of the most prominent factors blocking many companies, especially small and medium enterprises, from integrating them into their tactical and operational planning (Linderoth & Ralphs, Citation2005). Dagkakis and Heavey (Citation2016) argued that the lack of reusability and modularity have been the additional factors impeding the use of commercial OR software.
Open-source software, on the other hand, enable users to solve OR problems without a significant initial investment. Although using open-source software does not require licensing fees, the effort to deploy it may require a significant amount of effort and time. Nevertheless, the opportunity to access the core components of a solver (or simulator) and ease of development has driven the OR community to shift from a strict, slow-pace black-box software development to modular, flexible, and quick open-source software development.
In this section, we discuss open-source OR software, categorising them into two main groups: (i) open-source solvers and (ii) open-source simulators. The former category covers the software focusing on solving mathematical programming problems. The latter includes software for simulating a real-world environment and helping decision makers to understand and analyse the system without consuming physical resources. Note that we neither provide the specific features of such software nor the characteristics in terms of programming languages, etc. Interested readers are referred to the comprehensive reviews in Linderoth and Ralphs (Citation2005) and Dagkakis and Heavey (Citation2016) for some of the software we mention below.
3.18.1. Open-source solvers
A solver can be defined as a set of computationally efficient analytical tools that can find optimal (or near-optimal) solutions to a mathematical programming model. In 2000, a public initiative was built by the IBM Research Division (Pulleyblank et al., Citation2000) to promote and support community-driven development of open-source solvers that utilise the state-of-the-art research in OR. Subsequently, a public project called COIN-OR (COIN-OR Foundation, Inc. Citation2022) has been initiated to host a range of open-source solvers with an open-source interface that enables contributors, users, and developers to implement their own algorithms. The repository has been expanded to provide different open-source solvers for different programming problems such as CLP (Forest et al., Citation2022) and HiGHS (Huangfu & Hall, Citation2018) for linear programming (LP); ABACUS (Jünger & Thienel, Citation2000), BCP (Lad‘anyi, Citation2004), CBC (Forrest et al., Citation2022), Pyomo (Bynum et al., Citation2021), and SYMPHONY (Ralphs & Guzelsoy, Citation2005) for mixed integer linear programming (MILP); Bonmin (Bonami et al., Citation2005), Couenne (Belotti et al., Citation2009), DisCO (Bulut et al., Citation2019), Ipopt (Wächter & Biegler, Citation2006), and SHOT (Lundell et al., Citation2022) for linear and mixed integer nonlinear programming (MINLP); SMI (King, Citation2022) and Pyomo (Bynum et al., Citation2021) for Stochastic Programming (SP). COIN-OR also includes several other projects that would help users to improve their experience with modelling like PuLP (Mitchell et al., Citation2022) and visualising such as GiMPy (Ralphs et al., Citation2022).
SCIP Optimization Suite (Bestuzheva et al., Citation2021) can be used as a framework for mixed-integer linear or nonlinear programming as well as a standalone solver for such problems. A recent initiative commenced by the introduction of Julia language (Bezanson et al., Citation2017), which is a high-level, high-performance dynamic language for technical computing, is JuMP (Dunning et al., Citation2017) which helps users to solve a variety of problem classes including linear, mixed-integer linear, and nonlinear programming. It allows developers to use its framework and introduce new open-source solvers for particular problem classes.
We would like to also mention GLPK (Makhorin, Citation2020), which is the default linear programming solver behind some of the aforementioned mixed integer linear programming solvers. GLPK can also be used as a standalone linear programming solver. Finally, a suite of open-source solvers has been developed by Google (Google, Citation2022) to tackle integer programming and constraint programming problems. The OR-Tools provide a modelling interface and allow users to select different commercial or open-source solvers to generate solutions.
3.18.2. Open-source simulation software
Simulation software can be categorised into three based on the methods that they use to define the system and its resources. We should note that we cover the software that has been applied particularly in OR domains. We opt to omit open-source software that focus on specific domains, e.g., OMNet++ (Andras, Citation2010) for communication networks, for the sake of brevity. We refer interested readers to the works of (Dagkakis & Heavey, Citation2016) and (Lang et al., Citation2021b) and references therein for a broader review. An experimental comparison of some of the software presented here can be found in Kristiansen et al. (Citation2022).
The first method, Discrete Event Simulation (DES), is based on the processes of a system. In DES, the processes are defined as hosts of resources that run different operations on entities. For instance, one can define a part to be manufactured as an entity and create a manufacturing process with three machines to shape the part. DES software can be used to model and visualise complex queuing systems in order to help decision makers better understand the interactions between entities and processes.
JaamSim (JaamSim Development Team, Citation2016) is one of the most popular open-source DES with its user-friendly interface, easy-to-use drag and drop facilities, and continuous maintenance support. JaamSim provides a standalone executable which allows users to start using the software without technical knowledge on installations. Another DES framework is SimPy (Scherfke, Citation2021) which is based on standard Python functions. Its simple structure enables users to quickly obtain results for their simulation problems. SimPy has also initiated two other DESs, SimSharp (Beham, Citation2020) and SimJulia (Lauwens, Citation2021), which are the implementations of SimPy on C# and Julia languages, respectively. The last DES we would like to mention is Facsimile (Facsimile Simulation Library, Citation2021) which uses Scala as its basis scripting language. The main purpose of Facsimile, is to provide a high-quality discrete-event simulation library that can be used for industrial projects.
The second method, known as System Dynamics (SD), is based on representing a system as a causal loop diagram to define interactions between different components of a system. Some of the open-source SD software are PySD (Martin-Martinez et al., Citation2022), InsightMaker (InsightMaker, Citation2016), SysDyn (Simantics System Dynamics, Citation2017), and OpenModelica (Fritzson et al., Citation2020). PySD can convert the well-known commercial SD software Vensim (Ventana Systems Inc. Citation2022) input and allow user to configure. SysDyn uses the OpenModelica environment for simulation but provides an alternative built-in environment to speed up the simulation process. All these software have their own visualisation and reporting tools.
The third method is called Agent Based Simulation (ABS) and focuses on the autonomous individuals, i.e., agents, in a system. Each agent in ABS has its own characteristics and its way to interact with the other agents and the surrounding environment can differ. One of the open-source ABS software is Gama (Taillandier et al., Citation2019), which provides users a modelling language, a cross-platform to reproduce simulations, as well as a visualisation tool. InsightMaker (InsightMaker, Citation2016) is another open-source ABS software that allows users to create their own model on a web-based interface. Lastly, NetLogo (Wilensky, Citation1999) provides a modelling environment together with different applications to interact with other scripting languages.
We would like to complete this section with a brief summary of the application areas of both solvers and simulation software. provides examples of areas on which the OR software can be used.
Table 4. Application areas of solvers and simulation software.
3.18.3. Discussion
For the sake of completeness, we should also mention that there are also several ad-hoc software that address specific OR problems. For instance, OptaPlanner (Red Hat, Citation2022) can solve staff rostering, scheduling, timetabling, and Vehicle Routing Problems (VRPs). Another example is VRP Spreadsheet Solver (Erdoğan, Citation2017), which is an Excel-based solver. Although these software provide easy and fast access to solutions, the lack of generalisation to more complex OR problems and limited development opportunities can be seen as barriers to widespread impact.
As a final discussion point, we would like to list some of the essential features of an open-source OR software. First and foremost is the performance of the software. A user would expect a comparable level of performance from an open-source software with respect to commercial software. Secondly, the scalability of a solver, i.e., its performance when the problem size increases, is one of the factors desired by practitioners. Finding an optimal solution to a VRP instance with 20 customers does not guarantee that a VRP solver will achieve the same performance when the number of customers increases to 2000. Thirdly, technical support for a software has a crucial role in attracting users. Continuous development, documentation, and clear descriptions to change requests are some of the aspects that an open-source software should address to improve its maintainability. Finally, integration with existing libraries would help an open-source software widen its community and attract more developers to contribute.
3.19. Power markets and systemsFootnote66
The energy industry relies on forecasts (§2.10) and decision support tools (§2.8) for operations and planning. While long-term demand forecasts – with lead times measured in months, quarters or years – have been used for planning purposes for over a century, contemporary energy forecasting literature focuses more on the short- (minutes, hours) and mid-term (days, weeks) horizons (Hong et al., Citation2020). Since the late 1990s, the workhorse of power trading and a typically used reference point for long-term contracts is the day-ahead market (Mayer & Trück, Citation2018), where prices for all load periods of the next day are determined at the same time during a uniform-price auction (Weron, Citation2014, see also §3.1). No wonder, the majority of studies focus on predicting intermittent generation from renewable energy sources (RES), electric load (or demand) and prices for the 24 hours of the next day (Maciejowska et al., Citation2021). Two classes of approaches dominate: regression-based models and artificial neural networks (ANN; Lago et al., Citation2021, see also §2.1).
Regression and ANN models of the 1990s and 2000s were built on expert knowledge, often independently for each hour of the day. Their inputs included past values of (depending on the context) RES generation, loads or prices from the last few days, day-ahead forecasts of exogenous variables (e.g., temperatures for load, load for prices) and a seasonal component captured by sinusoidal functions or weekday dummies (Hong, Citation2014; Weron, Citation2014). Their sub-optimal performance could be readily improved by combining forecasts across different models (Bordignon et al., Citation2013), calibration sets (Nowotarski et al., Citation2016) or calibration windows (Hubicka et al., Citation2019). Interestingly, combining is not only a remedy for time-varying point forecasting performance. Together with quantile regression it provides a simple, yet powerful tool for probabilistic predictions – Quantile Regression Averaging (QRA; Nowotarski & Weron, Citation2018). During the Global Energy Forecasting Competition 2014, teams using variants of QRA were ranked 1st and 2nd in the price track (Gaillard et al., Citation2016; Maciejowska & Nowotarski, Citation2016). QRA can be also used to construct dynamic strategies aiming at finding the optimal trade-off between risk and return when trading the intraday and day-ahead markets (Janczura & Wójcik, Citation2022).
With the advent of easily accessible computational power, the models became more complex and expert knowledge was no longer enough to handle them. A major breakthrough came with the introduction of regularisation methods to energy forecasting in the 2010s. Although regularisation is a much older concept, its use in load (Chae et al., Citation2016; Ziel & Liu, Citation2016), price (Uniejewski et al., Citation2016; Ziel, Citation2016; Ziel & Weron, Citation2018), wind (Messner & Pinson, Citation2019) and solar forecasting (Yang, Citation2018) began only recently. Ridge regression has not seen many applications in energy forecasting, however, the least absolute shrinkage and selection operator (LASSO) and elastic nets (Hastie et al., Citation2015) have been shown to yield extremely competitive predictive models. LASSO-estimated autoregressive (LEAR) models often have hundreds of inputs, e.g., spanning all hours of the past week, but LASSO can shrink redundant coefficients to zero and, thus, perform variable selection. Despite their ability to handle only linear relationships between variables, LEAR models tend to be only slightly inferior to the much more complex and much harder to estimate deep ANNs (Lago et al., Citation2021).
The availability of high-performance GPUs and advances in optimisation algorithms made it possible to efficiently train ANNs with hundreds of inputs and outputs, multiple hidden layers and recurrent connections (§2.1). This led to a wave of deep learning and hybrid energy forecasting models in the late 2010s (Gao et al., Citation2019; Wang et al., Citation2017). A prominent, yet relatively parsimonious example is the deep neural network (DNN) model proposed for price forecasting (Lago et al., Citation2018). It uses a feedforward architecture with two hidden layers, 24 outputs (one for each hour of the next day) and ca. 250 inputs: past prices from the previous week, day-ahead forecasts of fundamental variables (demand, RES generation) and weekday dummies. To decrease the computational burden, its hyperparameters (number of neurons per layer, activation functions, optimisation algorithm, etc.) and inputs (treated as binary hyperparameters – either selected or discarded) are jointly optimised once every few weeks, while the weights are recalibrated every day to account for the most recent market data. Despite this simplification, daily recalibration of the DNN model is two orders of magnitude slower than of the LEAR model with the same inputs (minutes vs. seconds on a quadcore i7 CPU; see Lago et al., Citation2021).
The increased complexity of deep ANNs is a major obstacle in understanding the underlying processes. Partial remedy provide recently proposed architectures like the neural basis expansion analysis for interpretable time series forecasting (NBEATS; Oreshkin et al., Citation2021; Olivares et al., Citation2023), which project the time series onto basis functions in the fundamental blocks of the network structure. The final forecasts can be decomposed into interpretable components returned by groups of blocks (called stacks). Separate stacks can account for the trend, seasonality and exogenous variables. Another recent innovation in energy forecasting is a distributional ANN (Mashlakov et al., Citation2021). It only requires a small change in the architecture – instead of the 24 hourly forecasts, the network can return the parameter sets of 24 probability distributions (e.g., the mean and standard deviation for the Gaussian). The benefits are clear. The downside, however, is that the distribution itself has to be estimated (it is a hyperparameter). Somewhat surprisingly, distributional ANNs not only can yield more accurate probabilistic predictions, but also better point forecasts (Marcjasz et al., Citation2022).
For horizons beyond the next 48 hours other approaches have been proposed (Weron, Citation2014), not necessarily forecasting per se. Structural models define the functional relationships between physical (weather, generation, consumption, etc.) and economic (bidding, trading) variables that set the price, then utilise – typically – parsimonious statistical or machine learning techniques to provide the stochastic inputs. Due to the nature of fundamental data, often of weekly or monthly granularity, such models are more suitable for medium-term risk management, portfolio optimisation and derivatives pricing (Kiesel & Kusterman, Citation2016), than for short-term forecasting (Mahler et al., Citation2022). In the class of multi-agent approaches, Ventosa et al. (Citation2005) identify three trends: equilibrium, simulation and optimisation models. The former (Nash-Cournot framework, supply function equilibrium, strategic production-cost models) have seen limited application in oligopoly markets (Ruibal & Mazumdar, Citation2008). Agent-based simulations are used when the problem is too complex to be addressed within an equilibrium framework (Fraunholz et al., Citation2021).
Optimisation models address profit maximisation from the point of view of a firm competing in the market. One of the simplest settings is that of the price clearing process being exogenous to electricity generation optimisation – as the price is fixed, the market revenue is a linear function of the production and linear programming (§2.14) or mixed integer linear programming (MILP) can be employed (Ventosa et al., Citation2005). On the other hand, Virtual Power Plant (VPP) operations constitute a more complex problem of decision-making under uncertainty. A VPP is a cluster of dispersed generating units (e.g., intermittent rooftop solar panels on residential houses), flexible loads and battery storage that operates as a single entity. Robust optimisation and stochastic programming can be used to derive the optimal VPP trading strategy (Morales et al., Citation2014).
To support broader regulatory decisions at the firm or country level, frontier analysis methods are employed. Such methods aim to estimate the efficient frontier of the evaluated production units, to measure their relative efficiency (against the frontier) and to provide targets that can support policymakers. The benchmarking nature of these methods has established them as a flexible and multifaceted decision-making tool. In particular, Data Envelopment Analysis (DEA, §2.7) has been employed in a wide spectrum of energy applications. Early DEA studies relied only on a few factors (labour, fuel, capital, electricity production) to assess the technical efficiency of electric utilities (Färe et al., Citation1983). Later studies took into account sustainable practices by including environmental variables. Such factors are commonly treated as undesirable outputs that arise as by-products of the production process (Färe et al., Citation1996) or as non-controllable variables, which reflect external factors that the unit under evaluation cannot control (Hattori et al., Citation2005). When price information is available, DEA allocation models can be used to evaluate revenue, cost and profit efficiency. Ederer (Citation2015) argued that sophisticated cost efficiency assessment methods should be employed to evaluate RES, and relied on DEA models to assess the capital and the operating cost efficiency of offshore wind farms. Notably, DEA is often combined with multi-criteria decision-making techniques to incorporate decision maker’s preferences into the assessment (Lee et al., Citation2011; Wang et al., Citation2022a) and econometric techniques to study causal effects (Shah et al., Citation2022).
For a review and outlook into the future of energy (load, price, wind, solar) forecasting see Hong et al. (Citation2020). Hong and Fan (Citation2016) offer a tutorial review on probabilistic load forecasting. The standard reference for electricity price forecasting is Weron (Citation2014). Lago et al. (Citation2021) offer a more recent viewpoint focusing on deep learning and hybrid models. They also provide a set of guidelines/best practices and make freely available the epftoolbox with Python codes for two highly competitive benchmark models (LEAR, DNN). Two thorough treatments of probabilistic price forecasting are Nowotarski and Weron (Citation2018) and Ziel and Steinert (Citation2018). Sweeney et al. (Citation2020) present a brief overview of the state-of-the-art in RES forecasting, whereas Yang et al. (Citation2022) jointly discuss atmospheric science and power system engineering in the context of solar forecasting. Finally, for detailed literature reviews on energy related applications of DEA see Mardani et al. (Citation2017), Sueyoshi et al. (Citation2017) and Yu and He (Citation2020).
3.20. Project managementFootnote67
Operational Research methods play a fundamental role in managing a portfolio of projects, in project selection and in the management of each individual project. Project portfolio management is concerned with the optimal mix and prioritisation of proposed projects in order to maximise the organisation’s overall goals (Levine, Citation2005). At the strategic level, project selection deals with the selection of and resource allocation among a group of projects (Kavadias & Loch, Citation2004). Static models rely on mathematical programming, scoring and sorting, financial modelling, graphical and charting techniques. Dynamic models for selecting projects from a stream of arrivals may rely on queueing theory (§2.17), simulation (§2.19), decision theory (§2.8) and stochastic dynamic programming (§2.9; §2.21).
At the tactical and operational levels, project management (Meredith & Mantel, Citation2003) basically involves the planning, scheduling and control of project activities to achieve performance, cost and time objectives for a given scope of work, while using resources efficiently and effectively. The scope of a project is the magnitude of the work that must be performed to make sure that the product or items to be provided (the project result or the project deliverables) meet the requirements or acceptance criteria agreed upon at the onset of a project. Once the project is properly defined in terms of its scope and objectives, the planning phase may start through the identification of the project activities, the estimation of time and resources, the identification of relationships and dependencies between the activities and the identification of the schedule constraints. The activities can be graphically portrayed in the form of a project network showing the necessary interdependencies of the activities. Based on the type and quantities of resources required, cost estimates can be made. Project scheduling (Demeulemeester & Herroelen, Citation2002) then involves the construction of a project base plan which specifies for each activity the precedence and resource feasible start and completion dates, the amounts of the various resource types that will be needed during each time period, and as a result the budget. Once a baseline schedule has been established, it must be implemented. This involves performing the work according to the plan and controlling the work by monitoring the progress and taking necessary corrective action when the project is on its way to run behind schedule, to overrun the budget, or to violate the original technical specifications.
3.20.1. Construction of the project network
A project network is a graph consisting of a set of nodes and a set of arcs. In the activity-on-arc representation (AoA), the nodes represent the events and the arcs represent the activities. AoA networks form the basis of the Project Evaluation and Review Technique (PERT; Malcolm et al., Citation1959) and the Critical Path Method (CPM; Kelley, Citation1961). The precedence relationship used is the finish-start relationship with a zero time lag: an activity can start as soon as all its predecessor activities have finished. In the mostly used activity-on-node representation (AoN) the nodes represent the activities and the arcs denote the precedence relations. The AoN representation allows for the specification of generalised precedence relations of four types: start-start, start-finish, finish-start and finish-finish with minimal and/or maximal time lags. A minimal time lag specifies that an activity can only start (finish) when its predecessor activity has already started (finished) for a certain time period, whereas a maximal time lag specifies that an activity should be started (finished) at the latest a number of time periods beyond the start (finish) of another activity.
3.20.2. Temporal analysis for deterministic unconstrained project scheduling
In this case, a single deterministic duration estimate is used for the activities. Basically, the temporal analysis then involves the computation of the activity start times under the objective of minimising the project duration. In the presence of strict finish-start precedence relations, this can be achieved by simple forward and backward pass calculations. Generalised precedence relations with maximal time lags call for the use of graph algorithms for computing the longest path (critical path) in networks.
The temporal analysis may also be performed under the objective of maximising the net present value of the project. The deterministic max-npv problem can be formulated as a nonlinear problem. An efficient recursive solution procedure has been developed for AoN networks and has been extended to deal with the case of time-dependent cash flows (Vanhoucke et al., Citation2001b).
Another non-regular performance measure is the minimisation of the weighted earliness-tardiness penalty costs of the project activities, where activities have an individual due date with associated unit earliness and unit tardiness penalty costs. The problem can be solved by an exact recursive search procedure (Vanhoucke et al., Citation2001c).
3.20.3. The deterministic resource-constrained project scheduling problem
Project activities require resources for their execution. Renewable resources (e.g., manpower, machines) are available on a per-period basis. Their introduction into the analysis complicates matters considerably. Computing a precedence- and resource-feasible deterministic schedule that minimises the project duration, the resource-constrained project scheduling problem (RCPSP) is -hard in the strong sense (§2.5). Both exact and suboptimal procedures have been presented in the literature.
Many mathematical programming formulations (§2.15), either binary or mixed integer linear programs, have been developed (Demassey, Citation2008). The RCPSP may also be solved through constraint-based scheduling (Laborie & Nuijten, Citation2008). Also a number of branch-and-bound algorithms have been presented for optimally solving the RCPSP (Brucker et al., Citation1998; Demeulemeester & Herroelen, Citation1992).
Heuristic procedures broadly fall into two categories: constructive heuristics and improvement heuristics. Constructive heuristics start from an empty schedule and add activities one by one until a feasible schedule is obtained. Activities are ranked by priority rules which determine the order in which the activities are added to the schedule. Improvement heuristics start from a feasible schedule that was obtained using a constructive heuristic. Operations are then performed on a schedule which transforms a solution into an improved one. These operations are repeated until a locally optimal solution is obtained.
Project scheduling metaheuristics come in a wide variety and broadly include tabu search (Baar et al., Citation1999), simulated annealing (Bouleimen & Lecocq, Citation2003), genetic algorithms (Hartmann, Citation2002), ant colony optimisation (Merkle et al., Citation2002), scatter search and electromagnetic approaches (Debels et al., Citation2006).
3.20.4. Resource problem variants and generalisations
Branch-and-bound may be used for solving the RCPSP with generalised precedence relations (Demeulemeester & Herroelen, Citation1997; De Reyck & Herroelen, Citation1998), when activities may be preempted (Demeulemeester & Herroelen, Citation1996), when the problem has to be solved under the objective of maximising the net present value (Vanhoucke et al., Citation2001b) or with the earliness-tardiness objective (Vanhoucke et al., Citation2001a).
The resource levelling problem aims at completing the project within its deadline with a resource usage that is leveled as much as possible over the entire project duration. Exact solution procedures based on integer or dynamic programming and branch-and-bound as well as heuristic procedures have been developed (Neumann & Zimmermann, Citation2000). The resource availability cost problem, that consists of scheduling the project activities such that the total cost of acquiring the necessary resources is minimised, assuming that a resource is assigned to the project for the total project duration, can be solved optimally (Demeulemeester, Citation1995). The resource renting problem (Nübel, Citation2001) which assumes that resources can be added or removed from the resource pool over the project life, can be solved optimally using branch-and-bound or heuristically using genetic algorithms and scatter search (Ballestín, Citation2007a; Kerkhove et al., Citation2017).
The multi-mode RCPSP assumes limited availability of renewable and nonrenewable (e.g., money) resource types and assumes that a project activity may be executed in multiple modes, where an activity mode corresponds to the assignment of a mode-specific number of units of a (non)renewable resource type to the activity with correspondingly resulting activity duration. The project decisions then involve the decisions to start and perform the activities in a specific mode in order to minimise the project duration. Branch-and-bound (Hartmann & Drexl, Citation1998), branch-and-cut, local search (De Reyck & Herroelen, Citation1999) and genetic algorithms (Hartmann, Citation2001) are available.
For projects with a flexible project structure, where activities to be performed are not known in advance, decisions for the implementation of optional activities can be made using genetic algorithms and tabu search (Kellenbrink & Helber, Citation2015; Servranckx & Vanhoucke, Citation2019a, Citation2019b).
3.20.5. Dealing with uncertainty
Risk analysis involves the identification of the qualitative and quantitative assessment of the risk factors for the project through the estimation of the probability of the risk factors (activity duration, cost and resource requirement increases, start time delays) as well as their potential impact. The impact of each risk is best assessed individually and mapped to the duration of a project activity (Creemers et al., Citation2014). Risk responses may then involve risk avoidance by performing an alternative approach without the risk, taking actions to reduce the risk, and risk impact reduction by switching to a different execution mode, adding additional resources, etc.
Stochastic scheduling does not generate a baseline schedule before the start of the project, but deals with time uncertainty by viewing the scheduling problem as a multi-stage decision process where scheduling policies are used to decide at each of the stages which occur serially through time at random decision points, which activities selected from the set of precedence and resource feasible activities have to be started under the objective of minimising the expected project duration (Demeulemeester & Herroelen, Citation2011).
Proactive project scheduling generates a robust baseline schedule through solving the RCPSP and subsequently tries to protect it as well as possible against time and resource disruptions that may occur during project execution. This protection can be achieved by deciding on a clever way to transfer the renewable resources between the activities (Leus & Herroelen, Citation2004). Both branch-and-bound and heuristics are available for the minimisation of the weighted sum of the difference between the planned and the realised activity start times (Van de Vonder et al., Citation2008; Lambrechts et al., Citation2008). Another way involves the insertion of time buffers that should prevent the propagation of distortions throughout the schedule. The critical chain methodology (Goldratt, Citation1997; Herroelen & Leus, Citation2001; Newbold, Citation1998) defines the critical chain as that set of tasks which determines the overall project duration. Protection is then realised through the insertion of feeding buffers and resource buffers in combination with a project buffer at the end of the critical chain.
When during the actual execution of the project disruptions occur that cause deviations from the protected baseline schedule or even render this schedule infeasible, reactive scheduling procedures may be deployed.
For reviews and comprehensive textbooks on project management and scheduling we refer the reader to Demeulemeester and Herroelen (Citation2002), Demeulemeester and Herroelen (Citation2011), Hartmann and Briskorn (Citation2010), Herroelen (Citation2007), Herroelen and Leus (Citation2005), Meredith and Mantel (Citation2003), Neumann et al. (Citation2003), Shtub et al. (Citation2004), and Vanhoucke (Citation2018).
3.21. Revenue managementFootnote68
The discipline of revenue management (RM) deals, in the widest sense, with demand management decisions to improve overall revenue or profit. Demand management decisions aim at influencing demand, such as pricing and availability control. Occasionally, demand management decisions can also take different forms like ranking lists (e.g., when showing customers of a meal delivery platform a rank order of restaurants that offer home delivery) or green van icons to denote which time slots for grocery home delivery are more environment-friendly (because there is a delivery planned to take place already anyway). RM is about IT-supported decision-making, mostly on the operational level, in contrast to strategic pricing theory encountered in the marketing domain.
Such decision support systems, referred to as RM systems, have been first developed in the airline industry in the 1970s when deregulation introduced competition in the US airline market. They were so successful that the practice of RM soon spread to other industry domains, particularly to those that sell services or perishable goods (perishability creates pressure to sell within a limited selling horizon). Examples include restaurant tables, hotel rooms, rental cars, or airline seats, among many other applications. In these industries, the supply is usually fairly inflexible, fixed costs are high and variable costs are relatively low (which also makes revenue maximisation mostly equivalent to profit maximisation, hence the name revenue management).
In this section, we first outline recent research trends on demand models (and their estimation) that are required to provide an input to the RM optimisation system. Then, we present recent research on efficient optimisation of demand management decisions. Finally, we outline further reading suggestions including some current popular application areas. We mostly use the passenger airline industry throughout this subsection to illustrate developments in the field of RM.
3.21.1. Modelling demand
In order to make good demand management decisions, we first need to have a model of demand to describe the response to specific RM actions (such as pricing or changing the availability of products or services). The first demand models used in RM assumed that demand for a given product is independent of what else is offered. These so-called ‘independent demand models’ are relatively easy to estimate. However, this independence assumption usually only holds in applications where rate fences (such as advance purchase requirements) strongly limit customers’ abilities to substitute a product with one another.
One way to relax the – often unrealistic – independent demand assumption is by considering that the customer looks at all alternatives available and chooses one. The requires modelling of customers’ choice behaviour; the seminal paper by Talluri and Van Ryzin (Citation2004a) introduced discrete choice modelling to the domain of revenue management. In choice-based RM, demand for a product is assumed to depend on the available purchase alternatives and their attributes. These models tend to be more accurate in predicting demand if the independent demand assumption is not met, at the cost of being more difficult to estimate and implement (Klein et al., Citation2020). Much research has been carried out on choice-based RM since 2005; for a recent review, see Strauss et al. (Citation2018).
Among the most recent trends – building on the aforementioned choice-based RM literature with fixed choice model parameters – is a stream of work on personalisation and choice model parameter learning. For example, Cheung and Simchi-Levi (Citation2017) solve an online personalised assortment optimisation problem formulated as a multi-armed bandit problem. Demand learning models balance the trade-off between gathering new samples (and thereby learning more about the true customer behaviour) and applying the RM decision that, based on the current belief of customer behaviour, looks to be the best. In the short term, this means that we occasionally make decisions that seem not very promising, yet that will gain us insights into customer behaviour (for instance, by offering price points that were never offered before). For our airline example, a potential application is the ongoing learning of model parameters governing the choice of ancillary products (like seat upgrades, extra luggage, etc.). Models like the one by Agrawal et al. (Citation2019) can be used for this purpose.
Demand models in RM may be biased if they are estimated on constrained data, meaning that the sales data does not necessarily reflect the actual demand. For example, if a flight is fully booked, we observe no further sales transactions for that flight. Yet demand may well exceed flight capacity and, as such, should be estimated somehow. Methods to statistically unconstrained demand data are reviewed in Guo et al. (Citation2012).
Another dimension of demand modelling is represented by strategic versus myopic customer behaviour. One of the earliest papers on this topic is the work by Su (Citation2007). He considers customers who may delay their purchase when they expect lower-priced offers in the future. With RM mostly focusing on myopic customers (meaning customers who do not anticipate future developments in their purchase decision), the behaviour of strategic customers leads to inefficiency. Su (Citation2007) proposes an intertemporal pricing component to adjust the offering based on the market composition between these customer types, and more work has built on this since.
3.21.2. Optimisation advances
A central element of an RM system is the decision of what to offer whenever a customer arrives. Decision policies (essentially a mapping from the state space of available information to the action space) are used to determine which products are made available (i.e., availability control), or at which price (i.e., dynamic pricing) – and sometimes, a combination of both. Using dynamic prices to manage demand can be very similar to availability control: when there are products defined with identical features but different price tags such that there is a discrete set of prices to choose from for a product, it can be considered a special instance of the aforementioned availability control (Strauss et al., Citation2018). This can be observed in airline’s implementations of differently priced booking classes for the same seat such that a customer can only purchase that seat for the fare of the booking class made available to them. The groundbreaking papers by Gallego and van Ryzin (Citation1994, Citation1997) also featured a dynamic pricing concept for a single-commodity and a network-level problem, respectively. Both papers also considered the effect of significant cancellations and no-shows (meaning bookings that are not actually being used in the end). In that context, it can be valuable to accept more reservations than physical capacity would allow. This practice is called overbooking and is widespread in many industries where the risk of having to reject a customer with a valid reservation is not overly costly (with examples such as Simon, Citation1968, showing it being applied already before RM but now usually integrated into systems to manage demand for available capacity). For an overview of recent contributions on this matter, see Klein et al. (Citation2020).
Decision policies in RM are trading off the immediate reward of having a customer buy a product versus the so-called opportunity cost associated with this purchase, stemming from having to commit some resources to a given sale. For example, a resource might be a flight with a specific seat capacity. Selling a ticket for a seat on this flight requires us to commit a seat to this customer, which otherwise might have still gotten sold in the future at a potentially larger fare. Therefore, by having a customer buy the product, we incur the cost of losing the opportunity to sell the associated resource units in the future. This value (or at least an approximation thereof) is sometimes used as a revenue threshold defining which products shall be shown as available; such special versions of availability control are known as bid price policies, with the bid price being this threshold, and only products with revenues that exceed the bid price being shown.
There are two major challenges in deriving optimal decision policies: first, we need to somehow obtain the opportunity costs involved with having a customer book a particular product at a given point in time; second, we need to solve the resulting optimisation problem to give us the actual decision to be implemented.
The latter decision problem, given opportunity cost, may be as simple as a comparison of two numbers (traditionally used in independent-demand settings), but can be non-trivial in the presence of sophisticated models of customer behaviour (dependent demand settings). Much research over the past few years has been devoted to studying properties of choice models that can be exploited to efficiently solve – or at least closely approximate – the online RM decision problem. This work is further motivated by the need to solve these RM decision problems quickly to ensure an acceptable user experience. Within availability control, assortment optimisation under various choice models has received particularly much attention because this problem becomes -hard for many customer choice models unless a certain structure can be exploited; for a review, see Strauss et al. (Citation2018).
The other challenge in deriving optimal decision policies is the computation of opportunity costs. This is usually the more difficult task for real applications because the opportunity costs depend on time, the current state (of inventories), and future demand and actions. Dynamic programming (DP; §2.9) is usually being applied to solve or at least characterise the optimal decision policy over a given booking horizon.
However, obtaining opportunity costs using DP is often only possible when dealing with problems that have a single resource (like optimising for a single flight only, for example in Wollmer, Citation1992). When there are products that use more than one resource (like a itinerary of multiple flights connecting in a hub), then we speak of network RM problems. These require much more effort to solve (so as to get opportunity cost estimates for our decision policy) due to the fact that decisions on one product may affect many others that are using the same resource. Therefore, to reach at least an approximate solution for a network RM problem, one usually needs to resort to deterministic linear programming (Liu & van Ryzin, Citation2008, §2.14) or approximate dynamic programming (Gallego & Topaloğlu, Citation2019, describe how approximate dynamic programming can be used in RM). In practical applications, the network-level optimisation problem is often decomposed into a collection of single-resource problems such as in Kemmer et al. (Citation2012) who were motivated by methods deployed by Lufthansa Systems in their RM optimisation module. In older RM systems, booking control was typically implemented using versions of the so-called Expected Marginal Seat Revenue (EMSR) heuristics (Belobaba, Citation1987a), which are in turn rooted in the work of Littlewood (Citation2005), originally written in 1972.
Once a decision policy has been obtained (by first obtaining opportunity costs and then solving the corresponding decision problem), we then need to evaluate the decision policy using simulation or even in real-world trials. Bertsimas and De Boer (Citation2005) give an overview of different decision rules for airline RM that are evaluated with a simulation study. Further details on simulation techniques can be found in §2.19. An example of testing a dynamic pricing policy in live trials is the work by Fisher et al. (Citation2018).
3.21.3. Further reading
RM is also applied in retailing, both for e-commerce and offline shopping. Agatz et al. (Citation2013) provide a practical overview of ways online retailers implement RM in their business. But there are also retail RM applications outside of online shopping. For example, Caro and Gallien (Citation2012) describe how brick-and-mortar fashion stores optimise their price markdowns during season clearing sales.
In particular, linking RM to general transportation problems has received significant attention over recent years. An overview of advances in that field is given by Fleckenstein et al. (Citation2022). Applications thereof can be seen here especially in business models with delivery constraints, such as same-day deliveries (Ulmer, Citation2020) or for attended home delivery (AHD) which is common for online grocery shopping. Customers’ desire for short and guaranteed time windows in AHD leads to less than optimal routings. Yang et al. (Citation2016) show how RM can be used to steer demand for delivery time slots towards a routing solution closer to the optimum, thereby increasing overall profit for businesses shipping goods that require AHD. Another example of applying RM ideas to new transportation problems is the work by Künnen and Strauss (Citation2022). They analyse how an air traffic network manager could reduce overall delays for all airspace users (i.e., airlines) by offering dynamically priced flight trajectories.
For more detailed readings about the development of the RM domain, the techniques being used, and more applications, we refer the reader to the books by Talluri and Van Ryzin (Citation2004b) and Gallego and Topaloğlu (Citation2019).
3.22. Service industriesFootnote69
Service industry from the perspective of operations: Service industry is a concept from economics originally defined by what it is not. It is not a manufacturing industry that produces tangible goods (cars, clothes, equipment), but industry that provides intangible outputs, such as hospitality, healthcare, and education. In service research, services are also defined by additional characteristics. In addition to intangibility, the so-called IHIP characteristics, recognises heterogeneity, inseparability, and perishability as the defining characteristics of service industries.
In Operations and Operational Research, service industry is approached not from its characteristics but operationally to support actionable insights (Burger et al., Citation2019). For Operational Research applications, service industry can be approached through the FTU-framework, defining services as a particular type of transformation (). Service industries are distinguished from goods industries through the direct provision and integrative decision making. In services the decision making of customers and providing companies is intertwined, while in goods industries customer and providers make autonomous decisions. In service industries the value is directly provided to the customer, while in goods industries indirectly through the product.
Figure 2. An actionable framework for service industries: facilities-transformation-usage (adapted from Moeller, Citation2010)
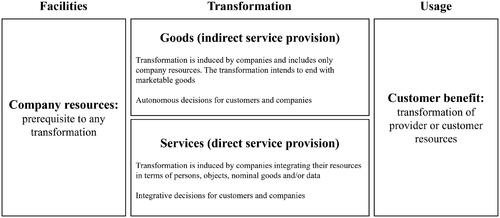
However, operational reality is not this clear-cut. In manufacturing industries, through servitisation (Kohtamäki et al., Citation2018), some companies seek to make their products more like services to differentiate their offering, and directly create value to their customers. In service industries, managers seek to make services more like goods, to be able to run service facilities more like factories and improve productivity (Levitt, Citation1972; Schmenner, Citation2004). OR methods that were initially developed in manufacturing industries (e.g., forecasting, queuing, scheduling, simulation), are increasingly applied in service industries to make service facilities operate more like factories (cf. Eveborn et al., Citation2009). For servitisation, OR presents a more limited range of methods. Methods supporting the servitisation of products are for example, value constellation modelling (Holmström et al., Citation2010; Brax & Visintin, Citation2017), and ecosystem modelling to support innovation and new business model design in an open environment (Talmar et al., Citation2020).
The challenge in service industries is that service systems tend to be open, problems wicked, and optimising solutions difficult to develop and apply. Value provision often requires interaction with customers (customisation) limiting the situations where facilities can be organised for flow and efficiency as service factories. Also, servitisation of products occurs in an open systems environment, requiring responsiveness to influences and disturbances from the outside, as will be seen for our application examples from industrial services and home healthcare.
Service industry applications: In the following we will present two examples on the use of OR methods for creative insight and novel solutions in service provision. The examples are homecare of elderly patients (Groop et al., Citation2017), and line maintenance of commercial aircraft (Öhman et al., Citation2021). In the first example systems thinking, in the form of soft OM methods from Theory of Constraints (Davies et al., Citation2005), is used in combination with design science research (implementation and evaluation). In the second example design and simulation are used in combination, uncovering an unexpected new way of simultaneously improving resilience and reducing costs in a commercial airline.
Homecare of elderly patients (Groop et al., Citation2017): Nurses, team leaders, and healthcare management had distinct and diverging views on what is the problem with the homecare operations. Strongly held and divergent views are an indication of a possibly wicked problem (Sydelko et al., Citation2021). The divergent views in the case were uncovered through engagement (following actors in their work) and interviewing, with the purpose of articulating what different stakeholders identified as undesirable effects (UDE) of the current solution. UDE is thinking tools terminology from Theory of Constraints (Dettmer, Citation1997). These UDEs of the current operation were pruned for overlaps and narrowed down to a list of seven (including the seeming contradiction between low utilisation of full-time employed nurses, stressed-out nurses, and chronic under-staffing requiring frequent use of temporary staff). Using effect-cause logic, the interconnections between effects, and mechanisms behind the effects were specified and then evaluated by all stakeholder groups in joint workshops. In this case, the first effect-cause analysis pointed towards a core problem, a contradiction, which when addressed, would improve efficiency. The needed change was in the way the nurse visits are scheduled to improve effectiveness. Instead of scheduling nearby patients after each other to save travelling time, the home care organisation should focus on only scheduling nurses for time-critical visits (visits that must be performed at a specific time) at the peak-demand in the morning. This way the time of full-time nurses will be more effectively used.
However, when implemented, the scheduling change had next to no effect. With the initial solution a failure, the evaluation of the implemented change pointed to issues with the problem framing. Going back, considering the stated problems (UDEs) and initial solution, the field researchers found that they had missed an important undesirable effect originating from the way the organisation operated. In the mapping nobody had raised as a problem that full-time nurses, when not busy, do not help-out in other teams. When nurses stay within their teams, work is evenly divided between everybody in the team, which is not a problem for nurses, nor for team leaders. Instead, when there is need for more nurses, outside temporary nurses are called in, and they move between teams if needed, but not the full-time employed nurses.
Management, for whom the low utilisation of full-time employed nurses is a cost issue (with payment of salaries both for idling full-time nurses and busy temporary nurses), were not aware of how nurses staying with their team was a mechanism behind the low utilisation. Nor had the researchers working in the field realised this before failing with the first solution design. Re-framing the problem once more, another solution changing the scheduling for employed nurses was proposed. Instead of dividing work equally between all nurses in their teams, the team leaders should seek to schedule work so that one, or even two nurses in their teams have no work, and can be made available to help-out in other teams.
Line-maintenance of commercial aircraft (Öhman et al., Citation2021): The second example illustrates the use of simulation in problem reframing and finding a new type of solution. The service operations are line-maintenance of aircraft in an airline. Initially the problem was framed by management as improving departure reliability without increasing the number of maintenance technicians. The intended solution was introducing lean in the turn-around of aircraft.
However, in line maintenance there are no material and time buffers for which lean approaches have been so impactful in manufacturing. The minimum frequency and content of maintenance tasks are regulated. Departures are delayed by technical problems that add unplanned tasks, which need to be carried out. Here, lean principles can increase productivity but not reduce the unplanned tasks. To reduce the delays caused by unplanned tasks a resource buffer of maintenance technicians appears necessary.
In this example, the same method of engagement was applied as in the homecare example. Observing and interviewing different actors involved, field researchers sought to articulate a set of undesirable effects of the current way of operating. However, no agreement on a core problem to address could here be reached. Instead, problem framing ended with a question and a puzzling response that pointed in a new direction. Line-maintenance scheduling assumed that maximising the interval for planned tasks is optimal, also when there are unplanned tasks and constrained resources. Engaging and interviewing maintenance planners for both long-haul and short-haul fleets and operations, production, and resource planning, field researchers began to gain an in-depth understanding of the airline maintenance planning function. Heuristics and principles related to dealing with over-maintenance not visible in the operational documentation were encountered.
To explore the implications, the researchers first modelled the relationship between over-maintenance and planned workload variance in a deterministic setting, focusing solely on scheduled maintenance. The model indicated a promising relationship: an increase of one percent in the total planned workload (over-maintenance) could result in up to a six percent reduction in workload variance. Next, simulation of the airline operation and maintenance included the unplanned events according to their historical distribution. The simulation surprisingly indicated that increasing over-maintenance could reduce over-all costs and improve departure reliability, if combined with a re-scheduling solution for maintenance task. Re-scheduling introduces a new type of time buffer, a frontlog of planned maintenance tasks that can be postponed to allow technicians to address unplanned tasks without disruptions to departure schedule.
Summary and conclusion: In service industry applications problem framing methods are particularly important. The openness of service operations and wicked problems often require the Operational Researcher in service industry applications to go outside their comfort zone regarding methods (Mingers, Citation2011b, Citation2015) to search for actionable insight (Burger et al., Citation2019). In the examples provided, a combination of approaches, tools, and methods were contingently employed in the search for a good problem framing as the basis for an effective solution design. For the application of OR methods in service industries, the homecare example illustrates the use of a soft OR method in framing the problem (from the practice of Theory of Constraints, Davies et al., Citation2005), the use of scheduling from hard OR as a solution component, and implementation as a method of design science for evaluation and redesign (Holmström et al., Citation2009; Sein et al., Citation2011). The second example illustrates the use of simulation as a method of explorative design. In the empirical grounding of the simulation model we encountered the good problem, which is the key to success in simulation projects (Law, Citation2003). Through simulation we developed and explored the effect of the dynamic re-scheduling and buffer management approach, with surprising outcomes. Before the simulation study nobody knew about the opportunity to both improve departure reliability and reduce costs.
The example multi-method approach combined soft OR, simulation, and systems thinking for framing the problem. As in cross-agency problem solving in government and public administration, service industry problem solving benefits from mapping different actor perspectives, as the purposes, perspectives and values of the service supply chain actors can easily be in conflict (Sydelko et al., Citation2021). However, in addition to methods for actionable insight, methods for turning insights into solution proposals are also needed. For proposing and developing a solution design, the two examples relied on explorative design science (Holmström et al., Citation2009), relying on OR methods in evaluation when implementation is possible, and simulation for substituting implementation. In the search of effective solution designs, OR methods such as scheduling, and forecasting were applied as potential solution components in both examples.
3.23. SportsFootnote70
Moneyball (Lewis, Citation2003) told the story of how the Oakland Athletics Major League Baseball team was able to leverage an inefficiency in the labour market for baseball players, and perform above expectations (given the team’s salary spend). Its impact on how quantitative analysis is viewed within sport and wider society is unprecedented. We have moved from an age when society tended to undervalue quantitative skills to a post-Moneyball era where analytics is generally accepted as being “cool”. Told in both a best-selling book (Lewis, Citation2003), and a Hollywood movie of the same name, Moneyball has driven a rapid expansion of interest in the field of sports analytics. For an analysis of Moneyball, see, for example, Hakes and Sauer (Citation2006).
The history of quantitative analysis in sports dates back to centuries before the Moneyball story, and to the conception of probability itself. The concepts of chance are as old as the first dice games, but they did not evolve into the mathematical principles of probability until the 17th century when Pascal and Fermat exchanged ideas in a series of letters during 1654. The letters were written in response to the following problem: two players, A and B, each stake 32 pistoles on a first-to-three-point game. When A has 2 points and B has 1 point, the game is interrupted and cannot continue. How should the stakes of 64 pistoles be fairly distributed? Fast forward three centuries and the similarities of this problem with the problem encountered in limited-overs cricket, when a match is cut short because of rain, are uncanny. Indeed, the solution offered by Duckworth and Lewis (Citation1998) is one of the great success stories of OR in sport, or arguably OR in any field. That sports fans routinely use the names of a statistician, and an operational researcher should be the source of great pride to the OR community.
The field of sports analytics now boasts specialist journals, regular special issues in top-rated mainstream journals, large departments in sports teams, and many stories of success and over-achievement in professional sport.
3.23.1. What is ‘sports analytics’?
Analytics is largely an umbrella term for data science, statistics, operational research, and nowadays, machine learning. A simple definition of sports analytics is the use of analytics to gain a competitive edge in sport. A wider definition would be the use of analytics to improve decision making in sport.
Research has been published on the use of analytics in almost all popular sports including: football, tennis, cricket, golf, American football, baseball, motor sport, martial arts, and many more. Rather than review the field by sport, it is more logical to consider the field by task. The following is not a comprehensive list of such tasks, but provides an overview of the more common objectives of sports analytics.
3.23.2. Ranking and rating
Ranking of competitors is, to a large extent, the entire purpose of organised sport, and rating is a popular area of research. There are several families of models used to rate competitors. Paired comparisons models are used when two competitors play in each contest. For example, Elo ratings were first developed for use in chess, but have since been used by, for example, Hvattum and Arntzen (Citation2010) for forecasting football results. Glickman (Citation2001) presented a more general Elo model based on a Bayesian updating system and applied it to the problem of dynamic ratings of chess players. Another paired comparisons model is the Bradley-Terry model and this was used in McHale and Morton (Citation2011) to forecast the results of tennis matches. Multiple comparisons models are used when several competitors play in each contest and Baker and McHale (Citation2015) use a time-varying multiple comparisons model to rate golfers from different eras. Langville and Meyer (Citation2013) provide an excellent overview of rankings models.
Rating individuals in team sports is a somewhat more complex task than the examples given above, especially when the individuals have different objectives, as is the case in football for example, where some players are mainly responsible for defending, whilst others are mainly responsible for attacking. Basketball, ice-hockey and football all fall into this category. In such circumstances plus-minus ratings are useful. At its most basic level, a player’s plus-minus rating is a comparison of a team’s performances with and without the player. Rosenbaum (Citation2004) presented a method for calculating plus-minus player ratings in basketball, before extensions were added by Macdonald (Citation2012) and Kharrat et al. (Citation2020) to account for the intricacies of ice-hockey and football, respectively.
The availability of more granular data, such as event data (detailing each and every event in a game, e.g., the timing, coordinates and players involved in a pass) and player tracking data (the coordinates of all players on the field of play recorded at several times per second), has enabled more advanced measures of player performance to be calculated. One such measure is that of expected value of possession (EVP) for valuing individual actions in team sports. The concept of EVP was first presented in Cervone et al. (Citation2016) and asks the question “what is the probability of the objective happening before an action, compared to the probability after an action?”. The objective may be to score a goal in football. If an action is a good one – the probability of a goal should increase, whilst if it is a bad one, the probability of a goal will likely decrease. The change in the probability of the objective occurring is then the value of the action. Recent applications of deep reinforcement learning have seen EVP calculated for football (e.g., Liu et al., Citation2020; Fernández et al., Citation2021). Indeed, it is likely that the EVP concept will be used in many sports in the future.
Akhtar et al. (Citation2015) uses the change in probability of a team winning a Test match to rate cricketers. The idea is similar to the EVP idea proposed by Cervone et al. (Citation2016), but uses multinomial regression to calculate probabilities of a team winning/drawing/losing the match, before and after each ball of the match.
The idea of monitoring the change in an expected value is also used in golf’s ‘strokes gained’ metric (Broadie, Citation2012). Strokes gained measures how good an individual shot is, and by aggregating over many shots, one can identify how good a player is overall, or how good certain areas (e.g., putting and driving) of a player’s game are.
3.23.3. Decision making
A core tenet of sports analytics is that it should drive improvement, indeed improving decision making is central to the OR paradigm. There are many papers looking to use analytics to improve decision making in a sports context.
Perhaps the costliest consequences of decision making in sport concern the recruitment of athletes. Indeed, the Moneyball premise is built on the idea of avoiding overpaying for talent.
Football clubs exchange huge sums of money to acquire the services of players. These transfer fees were studied in Coates and Parshakov (Citation2022) who consider the issue of the wisdom of the crowd in estimating the fees. McHale and Holmes (Citation2022) use machine learning techniques to model transfer fees as a function of performance metrics and contract status, amongst other things.
In lucrative team sports such as American football, football and basketball, recruitment of young talent with high potential is of potentially great value, but it appears a relatively little researched area. In one of only a handful of papers on this issue, Craig and Winchester (Citation2021) present a model to predict the potential of college quarterbacks to one day play in the NFL.
In addition to making good decisions around player recruitment, sports teams must make good decisions about their coaches. Peeters et al. (Citation2020) consider the impact of coaches on the performance of Major League Baseball teams, whilst Muehlheusser et al. (Citation2018) rate coaches in German football. Identifying good coaches is just one dimension of decision-making surrounding running a sports team, and it is often the case that team owners are faced with the decision of whether or not to fire a coach. The impact of managerial dismissals has been the focus of attention in the economics literature. In football, Tena and Forrest (Citation2007) measure the consequences of mid-season managerial dismissals on a team’s performance and find that there is a short-term improvement in results, but only in home matches.
The final area of decision making we note is that of team selection. In cricket the ordering of the batting line-up was considered in Perera et al. (Citation2016), whilst Watson et al. (Citation2021) use machine learning to optimise team selection in rugby union. Cao et al. (Citation2022) look at optimising team selection in soccer.
3.23.4. Other areas of sports analytics
Sport has attracted the attention of quantitative analysis in numerous other areas, though some do not have the objective of improving performance and/or decision making. For example, OR has been used to inform scheduling of tournaments (see also §3.27).
The popularity of sports betting means forecasting results has received a great deal of attention in the literature. As the sport with the largest global betting market, football has attracted the most attention in the forecasting literature. A notable contribution was that of Dixon and Coles (Citation1997), whose Poisson model has been used as the basis of subsequent work for over two decades. More recently, machine learning techniques have begun to outperform Poisson-type models. See Dubitzky et al. (Citation2019) for details of the results of the ‘Soccer Prediction Challenge’.
Tournament design has been the subject of research in, for example, Scarf et al. (Citation2009). The idea is that tournaments should maintain excitement. On a similar theme, Friesl et al. (Citation2017) and Scarf et al. (Citation2019) looked at the rules of ice-hockey and rugby and considered how they might be adjusted to increase excitement. By lowering scoring rates, the outcome of a game is more uncertain, and according to the uncertainty of outcome hypothesis this is what drives interest. However, there is conflicting evidence on the uncertainty of outcome hypothesis (see, for example, Forrest & Simmons, Citation2002). Understanding what drives the interest of fans was the subject of Buraimo et al. (Citation2020) who looked at how suspense, surprise and shock during a match drives in-match television viewing figures.
To find more articles on sports analytics, the interested reader has several options including specialist journals (the Journal of Quantitative Analysis in Sports, the Journal of Sports Economics, and the Journal of Sports Analytics), and discipline journals such as the European Journal of Operational Research, the Journals of the Royal Statistical Society, the Journal of the Operational Research Society, and the International Journal of Forecasting, together with a plethora of blogs and websites all focused on sports analytics.
3.24. Supply chain managementFootnote71
The field of supply chain management (SCM) is concerned with the information, material, and cash flows within and between supply chain members. Materials generally flow down a supply chain (like water in a river); information and money flow up the supply chain. The way we design, source, produce, move, store, schedule, communicate, collaborate, and compete are important factors in SCM.
3.24.1. Lean production
SCM is built on the foundations of good industrial engineering. The pioneering industrial engineers Frank and Lilian Gilbreth provided us with time and motion studies (Gilbreth, Citation1911), human factors, and scientific management. During the 1920s scientific management techniques were imported into Japan’s Imperial Navy’s shipyards and factories to improve efficiency and quality. Initially, some table top management games learnt from the Gilbreths in the United States were taken to the Kure Navel Arsenal (a navel shipyard) in 1923 (Robinson & Robinson, Citation1994). The table top management games were used demonstrate the efficient flow, and organisation, of work. Robinson and Robinson (Citation1994) claims these table top games facilitated Japan in general, and Toyota in particular, to become highly efficient at producing high quality, low cost, reliable products. The Toyota Production System (TPS) became the world standard in the highly efficient lean production technique (Ohno, Citation1988). Western companies soon sought to emulate the success of TPS (Womack et al., Citation1990), hunting high and low for the seven lean wastes (Hines & Rich, Citation1997). Holweg (Citation2007) provides an excellent summary of the genealogy of lean production.
3.24.2. Value stream mapping
One of the best ways to document and understand a supply chain is to draw a value stream map (VSM; Rother & Shook, Citation1999). VSMs detail how the material flow is controlled by the information flow and decision-making activities. Key is to determine the point in the material flow where the customer order directly regulates the production cadence. This point is known as the pacemaker process or the customer order decoupling point (CODP; Olhager, Citation2010). The pacemaker is often the process that separates the work that is pulled through the system by a Kanban system, and the work that flows out to the customer in a first-in-first-out (FIFO) queue.
3.24.3. Agile and leagile supply chains
Lean supply chains are characterised by just-in-time inventories and high capacity utilisation. But not all supply chains should be lean. Some supply chains need to be responsive, with extra inventory and spare capacity held in reserve so the system can quickly respond to unexpected demand (Fisher, Citation1997). This has become known as agile production. The lean and agile paradigms can integrated in together in a concept known as leagility (Naylor et al., Citation1999). In leagile supply chains, the material flow is set up to follow lean principles upstream from the CODP; downstream from the CODP, agile principles are followed.
3.24.4. Bullwhip and supply chain dynamics
The bullwhip effect is one of the biggest areas of SCM research. The moniker, coined by Lee et al. (Citation1997), refers to the tendency of the slowly changing consumer demand (the bullwhip handle) to create wildly fluctuating fast moving demand at the raw material processors (the bullwhip popper). This variance amplification effect is caused by the decision-making activities (Forrester, Citation1958). The seminal paper by Lee et al. (Citation1997) highlights four causes of the bullwhip effect: demand signal processing, order batching, shortage gaming, and price fluctuations.
Demand signal processing has been the most studied cause of the bullwhip effect. Demand signal processing refers to the activity of forecasting the demand over the lead time (and review period), so that one may determine production and/or replenishment order quantities to maintain finished goods inventory and raw material levels close to a target. Setting target inventory levels is a problem similar to the newsvendor problem (Churchman et al., Citation1957). As orders eventually turn into the inventory here is a feedback loop in the decision; there is also a work-in-progress feedback loop in the system (Sterman, Citation2000). Both these feedback loops contain delays. This creates a complex system whose dynamics are in part driven by the external demand, but are mostly an internally generated effect caused by the fundamental structure of the supply chain (Sterman, Citation2000).
Control engineers have developed a large toolkit to understand and manipulate the dynamics of feedback systems. Towill (Citation1982) and John et al. (Citation1994) studied the dynamics of continuous time replenishment rules with the Laplace transform. Dejonckheere et al. (Citation2003) studied discrete time replenishment rules via the z-transform and the Fourier transform. They showed the order-up-to replenishment policy with moving average and exponential smoothing forecasts, for all lead-times and all possible demand patterns, always created bullwhip.
Michna et al. (Citation2020) studied stochastic lead times, revealing the forecasting of lead times is an important cause of the bullwhip effect. Gaalman et al. (Citation2022) explores the interaction between the lead time and bullwhip under general order auto-regressive moving average demand. They reveal the interaction between demand, lead times, and bullwhip is complex and subtle; bullwhip does not always increase in the lead time. Wang and Disney (Citation2016) provides a recent review of the bullwhip effect, its causes, solution approaches, and thoughts on future research directions.
3.24.5. Location and localisation
The number, and location, of distribution centres (DC) is an important problem in distribution network design. Too few DCs result in longer travel distances (and times) to customers; too many result in high amounts of distribution inventory. The square root law for inventory (Maister, Citation1976) shows the amount of inventory in a distribution network falls by when n DC’s are consolidated into a single DC. The transportation costs involved in delivering customer demand from n DCs can be accurately modelled using transportation planning software (Hammant et al., Citation1999). This software typically includes: road maps, speed limits, tolls, congestion, as well as various methods for modelling transport costs.
Postponement can also reduce inventory in supply chains. Postponement involves delaying final assembly until demand reveals itself; products are then quickly customised to meet the consumer’s desires. For example, HP build generic printers in Mexico to ship to Europe. Upon arrival, they are assigned to a country and the correct power pack is “assembled” into the product (Feitzinger & Lee, Citation1997). With postponement HP holds less generic inventory to buffer the shipping lead time compared to the amount of country specific inventory it would need if the power packs were assembled in Mexico.
Another important SCM decision is where to produce? Should you produce locally where perhaps labour cost is high, or should you outsource, or off-shore, to a low labour cost country? Sometimes, offshore production is supplemented with a local factory or a near-shored supplier in a dual sourcing arrangement (Allon & Van Mieghem, Citation2010). A tailored base surge policy sends constant orders to the offshore supplier with the long lead time, while the near-shore supplier flexes production quantities with a short lead time. A small local SpeedFactory may be able to correct for the forecast errors and gain enough of an inventory advantage to offset the increased local labour costs (Boute et al., Citation2022).
3.24.6. Information flows in supply chains
Changing the information used in replenishment decisions can improve the dynamics of supply chains. The sharing of demand information with upstream suppliers is often referred to as the information sharing (Lee et al., Citation2000), or information enrichment strategy (Dejonckheere et al., Citation2004). Knowing the end consumer demand allows upstream members to base their demand forecasts on the real demand information, removing one of the potential causes of the bullwhip effect. Indeed, information sharing allows for a linear, rather than a geometrically, increasing bullwhip effect as orders go echelon-to-echelon up the supply chain (Chen et al., Citation2000). Kaipia et al. (Citation2017) considers the practicalities of implementing the information sharing strategy.
Sharing both demand and inventory information with your supplier can enable the vendor managed inventory (VMI) strategy (Dong & Xu, Citation2002). In the VMI strategy, the consumer demand and downstream inventory information is used by the supplier (the vendor) to make replenishment decisions on behalf of his customer. This allows two supply chain echelons to behave dynamically as one echelon, removing a bullwhip generating decision from the supply chain (Holweg et al., Citation2005).
3.24.7. Coordinating supply chain contracts
Supply chains often consist of many different organisations, each operating to maximise their own profit. Due to the double marginalisation problem, if each player acts solely in their own interests, the supply chain will not be able to reach the first best solution; money will be left on the table. Sometimes, the first best solution can be reached by a centralised decision-maker coordinating the supply chain; at other times the altruistic behaviour of one supply chain member, in return for a transfer payment, can coordinate.
There are many different types of contracts (Cachon & Lariviere, Citation2005): revenue sharing, buy-back, price-discount, quantity-flexibility, sales-rebate, franchise, and quantity discount contracts to name just a few. All have their strengths and weakness and are applicable in different settings. Many contracts are based on newsvendor principles (Lariviere, Citation2016). Another important concept in contract design is the idea of Pareto improving contracts, where no player is worse off than the (locally optimised) base case, but at least one other player is better off. Other contracts allow for the arbitrary allocation of profits between players, and for the delegation of decision-making activities to others (Chintapalli et al., Citation2017).
3.24.8. Emerging topics in the field of supply chain management
Emerging topics in the SCM field include:
The distributed ledger technology behind block chains (Babich & Hilary, Citation2020) and cryptocurrencies (Choi, Citation2020) can be used to create a permanent record of provenance and ownership. Ensuring your cotton has not been produced by slaves, your diamonds are not conflict, and children did not mine your Lithium is vital now as UK Directors can face prison time under the Proceeds of Crime Act for crimes committed in their supply chains.
Opaque pricing is a technique used to sell last minute travel industry inventory (e.g., hotel rooms) at discounted prices. The traveller books a room without knowing the exact hotel brand. Cost sensitive travellers are happy because they get a bargain. The hotel is happy because they get extra income without damaging their brand. Opaque pricing can be used for products as well; for example, a red pen sells for $10, and a blue pen sells for $10, but if you don't care which colour you have, a red-or-blue pen is offered at the opaque price of $8. The vendor is able to use the customer’s lack of preference to reduce inventory requirements (Ren & Huang, Citation2022).
Quantum computing allows one to solve
3.25. SustainabilityFootnote72
In this subsection, we focus on the area of sustainable operations from the perspective of closed-loop supply chains (CLSC). We consider literature that focuses on product-, module/part-, and material-level recovery and reuse activities. These activities provide economic and environmental benefits. CLSC entail transportation and acquisition of used products; sorting, grading and disposition for different recovery methods; disassembly and reassembly (i.e., remanufacturing operations); and marketing of remanufactured products. Guide and Van Wassenhove (Citation2003) and Ferguson and Souza (Citation2010) provide comprehensive overviews of the strategic, tactical, and operational aspects of CLSC.
The supply side in CLSC differs from traditional supply chains in the following ways. The quantity of used products being returned is uncertain; the timing of when they are returned is uncertain; and the condition (quality) in which they are returned is also uncertain. These differences lead to uncertain recovery rates and processing times, uncertain cost of recovery, and imperfect matching between supply of used products and demand for remanufactured products, and hence the subsequent demand for new parts needed to make the remanufactured (finished) product. Below, we provide a brief overview of some of the methods used to optimise the different activities in CLSC, while managing these uncertainties.
The reverse logistics (RL) network (see also §3.14) handles the collection of used products from end-users, and their transportation between collection points, consolidation centres, testing, sorting, and grading facilities, and recovery (e.g., remanufacturing, reuse, recycling) facilities and landfill locations. Stylised and game-theoretic models are developed to determine the optimal collection strategy for producers (if they choose to, or are required to collect used products). The collection strategy includes decisions on whether producers should collect directly from end-users, or use the retail network as collection points, or use third-party collectors (e.g., Savaskan & Van Wassenhove, Citation2006). In further analysis of the collection strategy, the continuous approximation method is used to determine whether the producer (or business) should offer to pick-up, or have end-users drop-off the used product (e.g., Fleischmann, Citation2003).
Several quantitative models are developed to determine the optimal RL network design. An extensive discussion of these models and solution approaches can be found in Akçalı et al. (Citation2009). Linear programming, mixed-integer linear programming (MILP), and stochastic programming are widely used to determine optimal network structures. Fleischmann et al. (Citation2004) provide and excellent overview of MILP and stochastic programming models for facility location and network design for dedicated reverse, and integrated (forward and reverse) logistics networks. Mixed-integer nonlinear programming models are also sometimes used to determine the optimal RL network structure (e.g., de Figueiredo & Mayerle, Citation2008). In addition to optimal network design, vehicle routing models (§3.32) are used to determine optimal collection and pick-up routes. These vehicle routing problems are often -hard, and are based on location of demand: node, arc, and general. The models are extended to include vehicle routing with backhaul, routing with simultaneous delivery and pick-up, and routing with partially mixed deliveries and pick-ups (see Beullens et al., Citation2004, and references therein).
One way of managing the supply uncertainty in CLSC is to forecast the return of used products. Different methods are used to compute the product return probability. These include modelling returns as a function of past sales (via a known delay distribution), regression models (Samorani et al., Citation2019), simulation models, and queueing models (e.g., Toktay et al., Citation2000)
Buyers of used products (i.e., producers or their contract-remanufacturers, and third-party remanufacturers) actively manage the supply uncertainty (timing, quantity, and quality) by using incentive mechanisms such as quality-based pricing, trade-ins, and buybacks. Buyers acquire used products either in sorted (i.e., known quality-levels) or unsorted (i.e., unknown quality-levels) form. Lot-sizing models are developed to determine the optimal acquisition quantity when the used products are available in unsorted form (e.g., Galbreth & Blackburn, Citation2006); and when they are available in sorted (continuous or discrete quality-levels) form (e.g., Mutha et al., Citation2016). The acquisition process has also been analysed in the context of buyer-supplier contracts. The objective of these analyses is to determine the optimal contract structure with known or unknown quality levels, e.g., quality-dependant acquisition costs and quantities (Mutha et al., Citation2019), and coordination mechanisms (Debo et al., Citation2004; Vedantam & Iyer, Citation2021; Li et al., Citation2023). Several models are also developed to determine the optimal acquisition cost for used products and selling price for remanufactured products for an exogenous set of discrete quality-levels of used products (e.g., Guide et al., Citation2003).
Testing, sorting, and grading of the acquired used products are important activities in product recovery operations. Hahler and Fleischmann (Citation2017) provide a detailed description of these operations for used consumer electronics. Sorting defective, and economically and technically infeasible-to-remanufacture units from the acquired quantity streamlines the subsequent operations (e.g., transportation, disassembly, and reassembly). Knowing the quality of the incoming units before scheduling recovery operations significantly improves the performance of the system. The benefit of yield information (i.e., information on the quality distribution of the incoming units) has been analysed using lot-sizing models and simulation models (e.g., Ketzenberg et al., Citation2003). Several models are developed to optimise the different decisions in the grading process, e.g., the optimal number of grades (e.g., Ferguson et al., Citation2009), the resulting optimal grade-wise remanufacturing cost and selling price (e.g., Mutha & Bansal, Citation2023), and the optimal location and timing of the sorting and grading process, for example at the point of collection/return or at the disassembly stage (e.g., Guide et al., Citation2006; Zikopoulos & Tagaras, Citation2008).
The disposition of sorted and graded used products typically involve a problem of optimal assignment of the economically and technically recoverable units to different recovery options, e.g., product-level recovery (i.e., remanufacturing); module/part-level recovery (i.e., reuse for making remanufactured and new products, or for spares); and the non-recoverable products for material-level recovery (i.e., recycling). The assignment decisions are usually based on considerations of supply (yield information, processing times, and costs) and demand (revenue, opportunity cost, and inventory cost). Optimal control models (e.g., Inderfurth et al., Citation2001) and revenue management-based models (e.g., Pinçe et al., Citation2016; Calmon & Graves, Citation2017; Calmon et al., Citation2021) are widely used to determine optimal disposition decisions. Depending on the type of the product, single-period models (for products with short lifecycles, e.g., cellphones) and multiperiod models (for products with long lifecycles, e.g., engines) are used in the disposition analyses. For example, Özdemir-Akyıldırım et al. (Citation2014) formulate the optimisation problem as a multiperiod Markov decision process (MDP) and provide a linear-programming model for solving the deterministic approximation of the MDP model.
Within the production planning and control literature in CLSC, a relatively small part has focused on disassembly planning and sequencing, and material requirement planning (MRP). Inderfurth et al. (Citation2004) provide an extensive overview of the various optimisation models developed to optimise these elements, including shop floor control rules, in remanufacturing-only and hybrid (joint manufacturing and remanufacturing) systems. Disassembly sequencing is mainly analysed using direct graphs (see Lambert, Citation2003, and §2.12), and MRP decisions are analysed from an inventory control perspective (e.g., Inderfurth & Jensen, Citation1999; Ferrer & Whybark, Citation2001). A significant part of the literature on CLSC has focused on inventory management. Optimal inventory control policies are derived using periodic-review models (e.g., Teunter et al., Citation2004; Zhou et al., Citation2011) and continuous-review models (e.g., van der Laan et al., Citation1999; Toktay et al., Citation2000; Jia et al., Citation2016). The single-period newsvendor-like models are largely analysed as acquisition lot-sizing models (discussed in the preceding paragraphs).
The research on market (selling)-related aspects of CLSC is focused around understanding the profit and pricing implications due to the co-existence of new and remanufactured products in the (same) market, and on understanding the customers of remanufactured products. Optimisation models are developed to determine the pricing and profitability of remanufactured products (e.g., Ovchinnikov, Citation2011; Abbey et al., Citation2015). Game-theoretic models are developed to determine optimal market-segments (based on pricing) for new and remanufactured products (e.g., Debo et al., Citation2005; Atasu et al., Citation2008). The market for- and customers of- remanufactured products are mostly analysed using empirical methods, e.g., using sales data from websites selling used and remanufactured products, usually accompanied by customer surveys (e.g., Guide & Li, Citation2010; Subramanian & Subramanyam, Citation2012). Behavioural experiments are used to understand consumer perceptions (e.g., quality, functionality), their acceptance (and rejection), and willingness to pay for remanufactured products (e.g., Abbey et al., Citation2017, and references therein).
3.26. TelecommunicationsFootnote73
Operational Research plays a key role in the design and management of telecommunication networks. A large variety of applications of both exact methods and heuristics can be found in the literature. We focus here on the applications for wired networks.
3.26.1. Topological network design
The earliest works on telecommunication networks focused on wired fixed line telephony. For the long-term planning of these networks, clients’ demands are not known in advance, or with a lot of uncertainty. This often gives rise to two-stage approaches where only the fixed cost of opening links are considered first, and the decisions on routing and capacity allocation taken in a second (later) stage. This approach is relevant when the fixed costs are very high compared to routing and capacity costs, and/or when topological decisions do not affect capacity decisions too much . For example, digging a trench to install fiber optic cables is very costly, while increasing capacity can be done by adding or upgrading equipment into nodes, which is relatively simple and cheap. The objective is to build a network at minimum cost, considering only the fixed cost associated with opening a link, ignoring capacity and routing costs.
Two main issues appear in the planning process of such networks: economy and survivability. Economy refers to the construction cost, while survivability refers to the restoration of services in the event of equipment failure. A network is called a tree if it is connected (i.e., there exists a path between all pairs of nodes), and removing any link disconnects at least one pair of nodes. Trees satisfy the primary goal of minimising the total cost while connecting all nodes. The minimum cost spanning tree problem therefore received a lot of attention, see e.g., Magnanti and Wolsey (Citation1995).
However, only one node or edge breakdown causes a tree network to become disconnected and therefore to fail in its main objective of enabling communication between all pairs of nodes. This means that some survivability constraints have to be considered while building the network. Usually, these constraints come in the form with k-connectivity requirements, i.e., the ability to restore network service in the event of a failure of at most k – 1 components of the network. In their earliest work on the subject, Grötschel and Monma (Citation1990) introduced a general model for survivability requirements, and studied the polytope associated with an integer programming formulation of the problem.
The minimum-cost two-connected spanning network problem, that consists in finding a network with minimal total cost for which two node-disjoint paths are available between every pair of nodes, was studied extensively, starting with the work of Monma and Shallcross (Citation1989). Such networks have been found to provide a sufficient level of survivability in most cases, but it turns out that the optimal solution of this problem is often very sparse. In such a topology, primary routing paths and re-routing paths in case of failure might become very long, introducing large delays in the network.
Two kinds of solutions have been proposed to remedy this problem: The first one imposes a constraint on the length of the paths (in terms of number of links crossed), the so-called hop-constrained models. The second approach consists of imposing that each edge belongs to at least one cycle (or ring) whose length is bounded by a given constant.
Hop-constraints were first considered by Balakrishnan and Altinkemer (Citation1992) in order to generate alternative solutions for a network design problem. Later on, Gouveia (Citation1998) presented a layered network flow reformulation that has since been used in many network design applications involving hops-constraints.
The second approach to avoid long re-routing paths in case of failure is based on the technology of self-healing rings. These are cycles in the network equipped in such a way that any link failure in the ring is automatically detected and the traffic rerouted by the alternative path in the cycle. Many problems involve setting a bound on the length of the ring including each edge. Network design problems with bounded rings were first studied in Fortz et al. (Citation2000).
3.26.2. Location problems
Location problems play a central role in telecommunications network design. We focus here on problems arising in wired (optical) telecommunications networks. These problems are mostly concerned with decisions related to the placement of specific equipments into nodes of the network, and are closely related to hub location problems (Alumur & Kara, Citation2008).
The Concentrator Location Problem is probably the most basic application of equipment placement. The problem consists of determining the number and location of concentrators that are used to aggregate end-user demands before sending them on the backbone network. The allocation of end-users demands to the concentrators has also to be determined such that the capacities of the concentrators are not exceeded. This problem has received much attention in the literature, starting with the work of Pirkul (Citation1987).
Another classical problem arises with the replacement of an old technology by a new one, e.g., when telecommunications companies replace outdated copper twisted cable connections by fiber optic connections. The Connected Facility Location Problem (ConFL) aims at optimising the building cost for networks involving the two technologies, which is modeled as tree-star networks: the core network, made of fiber optic connections, has a tree topology and interconnects multiplexers that switch traffic between fiber optic and copper connections. Each multiplexer is the centre of a star-network of copper connections to the customers. Early work on ConFL concentrated on approximation algorithms, such as the primal-dual procedures proposed by Swamy and Kumar (Citation2004). The currently best-known constant approximation ratio is given by the 4-approximation algorithm of Eisenbrand et al. (Citation2010). Heuristic approaches have been proposed by Ljubić (Citation2007) and Bardossy and Raghavan (Citation2010). Different Mixed Integer Programming models for ConFL were proposed by Gollowitzer and Ljubić (Citation2011).
In addition to these long-term design problems, operational short-term decisions are related to the routing of demands in the network, with a focus on avoiding congestion. Most networks nowadays operate the Internet Protocol. The internet is a collection of inter-connected networks called autonomous systems, that operates under a hierarchy of layers. An Autonomous System (AS) is defined as a set of routers under a single technical administration, such as an internet service provider or a country. As of July 2022, over 100, 000 ASes were registeredFootnote74, connecting over 5 billion internet users worldwideFootnote75.
3.26.3. Traffic engineering
Traffic engineering (TE) addresses the problem of efficiently allocating resources in the network so that user constraints are met. Several criteria can be used to measure the effectiveness of a routing configuration. The selection of the objective function may drastically change the quality of the resulting routing. This distinction has been illustrated in Pióro and Medhi (Citation2004). Balon et al. (Citation2006) discuss various TE objective functions and evaluate how well these objective functions meet TE requirements.
The internet routing protocols can be clustered into two main groups: inter-domain and intra-domain. While inter-domain are used to route traffic between ASes, Interior Gateway Protocols (IGPs) handle the routing within ASes. As inter-domain protocols are mostly governed by administrative and political considerations, there is not much room for Operational Research techniques to be applied for performing TE. On the other hand, the optimisation of IGPs have received a lot of attention. The most popular IGPs are based on shortest path routing: shortest paths are calculated using a link metric system, which corresponds to the set of link weights or link metrics that belong to the same AS. The network operator controls the routing of the traffic indirectly by setting the link metrics. This gives rise to very challenging optimisation that have mostly been tackled heuristically by many authors, starting with the seminal work of Fortz and Thorup (Citation2000). Some exact models have also been proposed, e.g., by Pióro et al. (Citation2000).
Recently, Filsfils et al. (Citation2015) proposed Segment Routing (SR), a new routing protocol developed to address known limitations of traditional routing protocols in IP networks. SR offers the possibility to deviate from the shortest path by using detours in the form of nodes or links respectively called node segments and adjacency segments. Optimisation of SR is a very active field of research and has been already addressed in Bhatia et al. (Citation2015); Hartert et al. (Citation2015); Jadin et al. (Citation2019).
3.26.4. Further readings
For surveys on survivable network design, we refer the reader to Christofides and Whitlock (Citation1981); Kerivin and Mahjoub (Citation2005); Fortz and Labbé (Citation2006); Fortz (Citation2021). Location problems in telecommunications are surveyed in Skorin-Kapov et al. (Citation2006); Fortz (Citation2015) and a unified view on location and network design problems was proposed by Contreras and Fernández (Citation2012). For a detailed survey on the Concentrator Location Problem, see Chapter 2 in Yaman (Citation2005). Traffic engineering with shortest paths routing protocols is covered in the surveys of Bley et al. (Citation2009); Fortz (Citation2011); Altın et al. (Citation2013).
3.27. TimetablingFootnote76
Timetabling represents a particular subgroup of scheduling problems, namely the set of problems for which activities must be assigned to resources within a set of fixed timeslots. Nevertheless, the two disciplines, scheduling and timetabling, are tightly related and benefit from mutual advancements in both modelling and method development.
Practical timetabling problems appear in many sectors, for example, in education, healthcare, sports and public transportation. They have been drawing academic attention for a few decades, partly because they are easy to grasp but challenging to solve. The timetabling community gathered at its first international conference in Edinburgh in 1995, one year before the Association of European Operational Research Societies (EURO) established a EURO Working Group on the Practice and Theory of Automated Timetabling (EWG PATAT Citation1996). Ever since the third conference, which took place in 2000, the timetabling community has gathered every two yearsFootnote77 to share ideas on both theoretical and practical aspects of timetabling.
This subsection provides a brief overview of timetabling history, while highlighting what makes timetabling problems computationally challenging, which initiatives have boosted timetabling research and how state-of-the-art knowledge, models and algorithms can be applied in practice. We restrict the discussion to timetabling problems involving human resources, such as students, teachers, healthcare workers and sports teams.
3.27.1. Problem definition
Let us consider a set of timeslots a set of activities
and a set of resources
A timetabling problem then consists in assigning (all) the activities in A to resources in R and timeslots in T in such a way that a set of constraints is met. Constraints may apply to resources, timeslots and activities. They usually restrict the number of assignments to certain resources within subsets of T.
Constraints are usually divided into two categories: hard constraints, which must be strictly satisfied, and soft constraints, for which violations may be tolerated but should be avoided if possible. Weights may be set on the soft constraints, denoting their relative importance. A common timetabling objective is to minimise the weighted sum of soft constraint violations. This objective sometimes has to be combined with other timetabling objectives, for example, to minimise the cost associated with the employed resources.
3.27.2. Educational timetabling
Educational timetabling problems can be split into three major groups: university examination timetabling, university course timetabling and high-school timetabling. In examination timetabling, the task is to assign examinations in A to a limited number of timeslots in T and rooms in R such that no student has more than one exam at a time. Each student’s exams should be spread out in time as much as possible. Additional constraints may include precedence constraints between exams, special room requirements, and limited room capacities. Course timetabling involves the assignment of course sections (lectures, tutorials, lab sessions, seminars) to specific days of the week and times of the day. Real-world problems may require sectioning, when students have to be split into separate subgroups for different sections. Typically, the objective is to minimise the number of students’ conflicts. High-school timetabling assumes that students are split into classes and each class has to take a set of resources. Given a set of timeslots, each activity (involving both a student group and a teacher) must be assigned to a timeslot so that no teacher and no student group are participating in more than one activity at a time. Most practical problems have additional constraints; for example, teachers may have limited availability and some activities may require more than one timeslot. In general, educational timetabling problems are -hard (de Werra et al., Citation2002). Additionally, the constraints often pose a feasibility challenge.
The educational timetabling community made a considerable effort to create rich sets of benchmark instances to be used for comparing methods. The first set of examination timetabling instances was defined by Carter et al. (Citation1996). Four competitions on educational timetabling, entitled ITC-2002 (McCollum, Citation2002), ITC-2007 (McCollum et al., Citation2007), ITC-2011 (Post et al., Citation2016) and ITC-2019 (Müller et al., Citation2018), further advanced the development of timetabling algorithms. Post et al. (Citation2012) developed a general format and benchmark instances for high-school timetabling, which were extended later by Post et al. (Citation2014). Ceschia et al. (Citation2022) published a review of educational timetabling, presenting detailed characteristics of all benchmark instances and state-of-the-art results. OptHubFootnote78 provides a common platform for storing problem instances and solutions to selected optimisation problems, including educational timetabling.
3.27.3. Personnel timetabling
Personnel timetabling, also referred to as employee timetabling or rostering, concerns the construction of a timetable for personnel in R in such a way as to satisfy coverage constraints throughout a time horizon (Ernst et al., Citation2004). The timeslots in T often represent shifts, which correspond to tasks or duties in A. Some activities may require certain skills, and hence can only be conducted by a subset of R. Many work-rest-related objectives are formulated in terms of time-related constraints, restricting, for example, the number of hours worked, the number of weekends worked, the number of consecutive night shifts (Burke et al., Citation2004a). Additionally, personnel rostering problems typically consider personal preferences as regards working time or days off. Whereas the problem is generally considered -hard, Smet et al. (Citation2016) showed that some personnel rostering problems are polynomially solvable, provided they do not contain a particular class of constraints. De Causmaecker and Vanden Berghe (Citation2011) developed a categorisation of personnel rostering problems, based on the characterisation of resources, objectives and constraints. Kingston et al. (Citation2018b) complemented this work by providing a unified notation for nurse rostering problems.
The Practice and Theory of Automated Timetabling (PATAT) community organised two International Nurse Rostering Competitions, entitled INRC I and INRC II. The problem definition of INRC I (Haspeslagh et al., Citation2014) was based on the instances collected by Burke and Curtois (Citation2014). INRC II (Ceschia et al., Citation2019) incorporated real-world constraints concerning subsequent rostering horizons. The competition datasets have been collected and publishedFootnote79.
Apart from the constraints and objective functions considered in the two INRCs, some sectors expect their personnel rosters to be cyclic (Musliu, Citation2006; Rocha et al., Citation2013). Recent trends also include objectives related to fairness (Gross et al., Citation2019) and well-being (Petrovic et al., Citation2020). Objective priorities set by the users may lead to unwanted solutions. To address this issue, Böðvarsdóttir et al. (Citation2021) developed an approach to automatically set acceptable weights which avoid conflicting objectives from leading to poor solutions.
3.27.4. Sports timetabling
Sports timetabling problems often address tournament or competition scheduling. They require assigning sports activities in A, represented by pairs of teams in R, to timeslots in T in such a way that each team meets all the other teams. Constraints depend on the competition’s rules, which may differ in different parts of the world (Ribeiro, Citation2012; Durán, Citation2021). Specific sports timetabling constraints prescribe that teams must not meet the same opponent within consecutive timeslots, or that the number of consecutive home or away games is restricted. The travelling tournament problem (TTP), introduced by Easton et al. (Citation2001), is an academic adaptation of the Major League Baseball competition in the United States. The objective of the TTP is to minimise the sum of travelling distances for each team. Travelling umpire scheduling (Trick et al., Citation2012) is subject to similar constraints, but it assumes that the tournament is fixed and that each game is assigned an umpire.
Rasmussen and Trick (Citation2008) provided a review on round robin sports timetabling, where each team plays against each other team twice, once at home and once away. Drexl and Knust’s (Citation2007) review focused on graph-theoretical approaches to sports timetabling. Briskorn et al. (Citation2010) investigated the complexity of several variants of the round-robin tournament problem, and similarly, de Oliveira et al. (Citation2015) studied the complexity of travelling umpire scheduling problems. The characteristic sports timetabling constraints, which forbid the assignment of activities to subsets of T, can be challenging in terms of feasibility.
Trick (Citation2001) and Toffolo et al. (Citation2015) boosted sports timetabling research by publishing challenging benchmark instances and monitoring best known and/or optimal results. Van Bulck et al. (Citation2021) organised the first international sports timetabling competition, for which the instances are available at the website of STT (Citation2021).
3.27.5. Timetabling and related problems
Academic timetabling problems are often considered in isolation from other problems. However, many real-world situations face timetabling entangled with other optimisation problems. Solutions for one of them have an impact on the solution for the other problems. For example, the staffing problem is concerned with optimising a group of human resources and their characteristics such as skills and contracts in an organisation, across a relatively large time horizon. From a staffing perspective, the personnel structure should adequately cover the organisation’s anticipated workload while respecting the available budget. On the other hand, from a rostering perspective, the personnel structure should enable computing good quality rosters across many subsequent rostering periods (Komarudin et al., Citation2020). Similarly, task scheduling usually assumes personnel rosters are fixed, but both problems can also be addressed in an integrated manner (Paul & Knust, Citation2015). The workforce routing and scheduling problem is related to vehicle routing. Apart from scheduling a fleet of vehicles to serve a set of customers, timetabling issues, such as temporal constraints, contracts and skills are also imposed on the problem (Castillo-Salazar et al., Citation2016). Some production scheduling and inventory problems are subject to additional timetabling restrictions which apply to their employees (Sartori et al., Citation2021).
3.27.6. Where do we stand and what is the future
Academic timetabling has made good progress and instances, models and algorithms have been shared and published. For example, the heuristic search strategies Step Counting Hill-climbing (Bykov & Petrovic, Citation2016) and Late Acceptance Hill-climbing (Burke & Bykov, Citation2008) were initially developed for solving timetabling problems. Due to their simplicity and effectiveness, they continue to be used in a much wider application domain by many computational experts.
So long as some instances remain unsolved, or solutions for instances have not been proven optimal, algorithm development remains open for improvement. Future challenges may also apply to new combinatorial optimisation problems encompassing a timetabling component. They may not necessarily map to any of the three timetabling categories detailed in this chapter. However, they may gain importance due to either increased practical need or academic initiatives, such as the publication of benchmarks or the organisation of competitions.
Apart from these future computational challenges, timetabling research should also focus on how to address human resources’ considerations. Besides the traditional work-rest constraints and objectives, academia should also reconcile personnel well-being with their perception of fair workload within a team and with their level of autonomy in determining their personal timetables. Research should also focus on how to address the increasing personnel resignation in human-centric working environments such as education and healthcare. Robust timetabling, for example, has a lot of potential and at the same time induces scientifically interesting modelling questions.
3.28. Transportation: RailFootnote80
The transportation of goods and passengers by rail has played an important role in the evolution of industrialised societies, contributing to their development and prosperity. Rail freight transport still holds critical importance in supporting the economic growth of many countries around the world due to its contribution to guaranteeing an efficient flow of goods internally and across borders. Furthermore, rail transportation is also essential for the movement of people, being the preferred transportation mode for commuters in many large urban areas. This preponderant role also affects the internal mobility of cities. First, a differentiation must be made between freight and passenger transport. Freight trains are longer and heavier than passenger trains, and can often have multiple propulsion units. Compared to that, passenger trains are much lighter and have more horsepower per tonne. There are also important planning and operational differences, whereas passengers decide freely where they will travel, each load of freight must be managed and routed from a specific origin to its destination. These differences originate very different problems in both areas. Even in passenger transportation, different problems arise depending on the type of service; long- and medium-distance, commuter rail, urban rapid transit, and scenic and sightseeing train transportation; see, for instance, Caprara et al. (Citation2007).
Despite all these differences, a set of common hierarchical stages can be highlighted in the process of planning and operating a rail transportation system (Bussieck et al., Citation1997): network design and/or line planning, timetabling, platforming, rolling stock circulation, shunting, and crew planning.
At a strategic level, the problems are characterised by long planning horizons and typically involve resource acquisition. This level includes network design and line planning problems. The first refers to the construction or modification of existing railway infrastructure and mainly concerns urban rapid transit systems. For a railway company or agency, the line planning problem consists of defining a set of lines and determining their frequencies, and it is usually the first stage in planning medium and long-distance passenger rail networks.
Bussieck et al. (Citation2004) considered the design of line plans in public transport with the objective of minimising the total cost. Goossens et al. (Citation2006) presented several models for solving line planning problems in which lines can have different halting patterns. Laporte et al. (Citation2007) proposed a first railway rapid transit network design model to maximise the expected trip coverage. Gutiérrez-Jarpa et al. (Citation2013) presented a model to minimise travel cost while maximising the captured demand. See also Laporte and Pascoal (Citation2015) for an extension where the idea consists of first building a set of segments within broad corridors connecting some vertex sets to later assemble the segments into lines.
A different set of works pays attention to the formulation of network design models from scratch. Starting from an underlying network, these models construct lines by joining edges, incorporating topological constraints to guarantee connectivity between consecutive edges of each line. This approach gives rise to complex models which are quite difficult to solve using exact procedures; see, for instance, the work by Szeto and Jiang (Citation2014), or the recent works by Canca et al. (Citation2017) and Canca et al. (Citation2019) which concern the design of a railway rapid transit network.
For a comprehensive review of the different methodologies used in practice to solve this problem, the readers can consult the review of Guihaire and Hao (Citation2008). More recent reviews of Schöbel (Citation2012) and Ibarra-Rojas et al. (Citation2015) present a systematic classification of problem variants, considered objectives and solving methodologies.
At the tactical level, the next stage in planning a railway system consists of several problems, starting with scheduling and timetabling, followed by rolling stock planning, crew rostering, and crew scheduling. The timetabling problem concerns the determination of the arrival and departure times of trains to stations. When overtaking and overlapping are allowed, the timetabling problem becomes a train scheduling problem. Timetables can be cyclic, regular, hybrid, and demand-driven. Concerning the design of cyclic timetables, Caprara et al. (Citation2002) proposed a graph-theoretic formulation for the train timetabling problem using a directed multigraph in which nodes correspond to departures and arrivals at a certain station at a given time instant. Liebchen and Möhring (Citation2002) used a Periodic Event Scheduling problem (PESP) with several add-ons concerning problem reduction and strengthening. Chierici et al. (Citation2004) extended the classical timetabling model to take into account the reciprocal influence between the quality of a timetable and the transport demand captured by the railway with respect to alternative means of transport. Cacchiani et al. (Citation2008b) proposed heuristic and exact algorithms for the (periodic and non-periodic) train timetabling problem on a corridor.
Regular timetables have been commonly used in the case of railway rapid transit systems, especially at relatively short time planning horizons where demand can be considered approximately constant. Canca et al. (Citation2016) proposed a sequential optimisation approach to determine the best regular timetable for a railway rapid transit network where lines share tracks. Canca and Zarzo (Citation2017) incorporated aspects of energy consumption in the design of a two-way rapid rail transit line. Later, Canca et al. (Citation2018) extended the previous work to a full network, taking into account transfers between lines. Robenek et al. (Citation2017) proposed a new type of timetable combining both the regularity of the cyclic timetables and the flexibility of the non-cyclic ones.
During recent years, starting from the works of Canca et al. (Citation2014) and Niu and Zhou (Citation2013) many researchers have paid attention to the design of demand-driven timetables (see, for instance, Barrena et al., Citation2014a, Citation2014b). The design of a specific train timetable can be combined by using different acceleration strategies such as stop-skipping and short-turning. For example, given predetermined train skip-stop patterns, Niu et al. (Citation2015) proposed a quadratic integer programming model with linear constraints to synchronise effective passenger loading and train arrival and departure times at stations. Zhou et al. (Citation2022) proposed a mixed integer linear programming model to jointly optimise the train timetable and the rolling stock circulation plan, allowing rolling stock to change its composition through coupling/decoupling operations at the terminal stations of a metro line. Yuan et al. (Citation2022) introduced a new integrated optimisation model for train timetabling that also considered rolling stock assignment and incorporated a short turn strategy on a bidirectional metro line.
Several authors have also proposed methods to increase the transport capacity of a given timetable (see Burdett & Kozan, Citation2009). Cacchiani et al. (Citation2010) studied the problem of incorporating freight transport trains in railway networks, where both passenger and freight trains are running. To finish this description of the OR contributions for the train timetabling problem, a special mention of the work by Kroon et al. (Citation2009) is convenient. In this research, the authors generated several real timetables using Operational Research techniques for the Dutch railway network.
Rolling stock management is probably the most complex stage in the classical sequential railway planning process and plays a key role in the efficient operation of railway networks. At a tactical level, the rolling stock circulation plan consists of a set of interrelated subproblems such as train composition decisions (coupling and decoupling operations involving locomotives and carriages), selection of rest locations, the design of vehicle circulations (specific paths that vehicles must follow to guarantee an efficient and safe operation), and the definition of maintenance policies (Caprara et al., Citation2007). In a general rolling stock circulation problem, every train circulation has a variable length (distance and number of days) and incorporates information about the allowed specific rolling stock types, composition, coupling/decoupling operations, maintenance and cleaning activities. (Maróti & Kroon, Citation2005, Citation2007). Other practical considerations such as rolling stock availability, depot capacity (Lai et al., Citation2015), coupling and decoupling activities (Fioole et al., Citation2006), turnaround times, maintenance (Maróti & Kroon, Citation2007), and track and platform capacities are simultaneously considered depending on the specific problem. Given the importance of this topic within the set of planning tasks, other contributions have been proposed for different problems concerning rolling stock management, as, for instance, determining a set of minimum cost equipment cycles such that the most convenient rolling material is assigned to each planned trip Cordeau et al. (Citation2000) or obtaining the optimal circulation of rolling stock considering order in train compositions (Alfieri et al., Citation2006; Peeters & Kroon, Citation2008). Maintenance also plays an important role in several rolling stock management contributions, see, for instance, the works by Maróti and Kroon (Citation2005); Giacco et al. (Citation2014) and D’Ariano et al. (Citation2019). Robustness is another topic of interest in the related literature. Interested readers can consult the works by Cacchiani et al. (Citation2008a, Citation2012).
After rolling stock management, the crew scheduling process determines the set of duties that covers all programmed services (Caprara et al., Citation1998). Finally, the crew is assigned to serve the crew schedule and the corresponding train services (Huisman et al., Citation2005). The rostering process aims at determining an optimal sequencing of a given set of duties into rosters satisfying operational constraints deriving from union contract and company regulations (Caprara et al., Citation2003).
To finish this section, two important problems of rail freight transportation are briefly commented. The first concerns the strategic design of freight transport networks and the second concerns the tactical operation of marshalling yards. Concerning the design of service networks, Crainic et al. (Citation1984) analysed the problems of routing freight traffic, scheduling train services, and allocating classification activities between yards on a rail network. Crainic et al. (Citation1990) developed a model of rail freight transportation adapted for the strategic planning of freight traffic considering other transportation modes. Zhu et al. (Citation2014) addressed the problem of scheduled service network design for freight rail transportation integrating service selection and scheduling, car classification and blocking, train makeup, and shipments routing based on a three-layer cyclic space-time network representation.
Shunting yards, also known as marshalling or classification yards, play a key role in rail freight transport networks, acting as hubs where inbound trains are first disassembled and the carriages are then to form new convoys, generating new trains which transport the load towards the correct destinations. This procedure allows carriages to be sent through the network according to their destinations without the need for many connections. Therefore, time savings in shunting operations (Jaehn et al., Citation2015) have a great impact on cost savings in the movement of freight through the rail network (Boysen et al., Citation2012). In passenger transportation, shunting operations focus on train units that are not necessary to operate a schedule and must be parked at shunt yards. Since different types of trains use the rail infrastructure, the specific type of a unit restricts the set of shunt tracks where they can be parked. The aim of this problem is to assign train locations to the shunt tracks while minimising routing costs from platforms to the corresponding shunt tracks (Huisman et al., Citation2005; Kroon et al., Citation2008). For a more detailed description of the optimisation problems involved in shunting operations, we refer the reader to the works by Jaehn and Michaelis (Citation2016) and Ruf and Cordeau (Citation2021).
3.29. Transportation: MaritimeFootnote81
Maritime transportation carries more than 80% of the world’s trade and some 70% of the value of that trade (UNCTAD Citation2022). The spectrum of Operational Research (OR) applications in maritime transportation is broad. Following the classification of Christiansen et al. (Citation2013), these problems can be broken down into three levels: strategic, tactical and operational. Some typical problems in each of these levels will be described in this section.
It is important to note that, in much of the OR maritime transportation literature, traditional economic criteria such as cost minimisation or profit maximisation are the norm, and environmental criteria (for instance emissions minimisation) are less frequent. However, with the quest to decarbonise shipping (IMO Citation2018), the body of knowledge that includes environmental criteria is growing very fast in recent years. Sometimes environmental criteria map directly into economic criteria: if for instance fuel cost is the criterion, and since it is directly proportional to ship emissions, if fuel cost is to be minimised as an objective, so will emissions, and the solution is win-win. However, for other objectives this direct relationship may cease to exist and one would need to look at environmental criteria in their own right.
In conceptual terms, if x is a vector of the decision variables of the problem at hand, f(x) is the fuel cost associated with x, c(x) is the cost other than fuel and m(x) are the associated maritime emissions (carbon, sulphur, or other), then a generic optimisation problem is the following:
where
and
are user-defined weights (both
) representing the relative importance the decision maker assigns to cost versus emissions, and X represents the feasible solution space, usually defined by a set of constraints.
One can safely say and without loss of generality that if d(x) is the amount of fuel consumed, p is the fuel price, and e is the emissions coefficient (kg of emissions per kg of fuel), then and
Therefore
with
as both f(x) and m(x) are proportional to the amount of fuel consumed d(x). The cases that different fuels are used onboard the ship, for instance in the main engine vs the auxiliary engines, or if fuel is switched from high to low sulphur along the ship’s trip, represent straightforward generalisations of the above formulation. Then the above problem can also be written as
The following special cases of the above problem are important:
The case
The case
The case c(x) = 0, in which fuel cost is the only component of the cost.
A solution x* is called win-win if both case Equation(1)(1)
(1) and case Equation(2)
(2)
(2) have x* as an optimal solution. It is important to realise that such a solution may not necessarily exist.
It is also straightforward to see that in case Equation(3)(3)
(3) , cost and emissions are minimised at the same time and we have a win-win solution. It is clear that c(x) = 0 is a sufficient condition for a win-win solution. But this is not a necessary condition, as it is conceivable to have the same solution being the optimal solution under two different objective functions. An interesting question is to what extent policy makers can introduce either (a) a Market Based Measure (MBM) such as a fuel tax and/or (b) a set of constraints, that would make win-win solutions possible.
Let us now examine some typical OR problems in the 3-level hierarchy.
Strategic level problems involve planning horizons of several years (from 1 to 25). Among them, fleet size and mix problems involve the basic questions, what is the best mix for a shipping company’s fleet in the years ahead? How large should these ships be? How many should they be, and how fast they should go? See Alvarez et al. (Citation2011), Zeng and Yang (Citation2007) and Pantuso et al. (Citation2014) for some work in this area.
Network design problems also belong to the strategic problem category and are special to liner shipping. They involve the design of a liner company’s network, which comprises the ports it would serve, the routes it will use, which ports will be chosen as hub ports, how are the company’s feeder networks configured, and whether the company will use the hub-and-spoke concept or direct calls. See Agarwal and Ergun (Citation2008), Reinhardt and Pisinger (Citation2012), and Brouer et al. (Citation2014) for more on these problems.
Tactical level problems involve intermediate planning horizons, from a few days to a year. Among them, ship routing and scheduling is perhaps the most important problem class, mainly for tramp shipping, with works by Christiansen et al. (Citation2013), Andersson et al. (Citation2011), Fagerholt et al. (Citation2010), and Lin and Liu (Citation2011). Routing and scheduling of offshore supply vessels belongs also to this area (Halvorsen-Weare & Fagerholt, Citation2011; Norlund & Gribkovskaia, Citation2013). All of these problems call for the determination of the best set of ship routes under some predefined criteria.
Fleet deployment is also included in the class of tactical level problems, calling for the allocation of ships to routes (see Meng & Wang, Citation2011; Andersson et al., Citation2015; Lai et al., Citation2022, among others). Speed optimisation problems are also tactical level problems and have received increased attention in recent years, due to the pivotal role of ship speed with regard to both economic and environmental criteria. Due to the fact that fuel consumption is a nonlinear function of ship speed, these problems are typically nonlinear. Related formulations attempt to find best vessel speeds along the legs of the route, according to specific criteria (see Psaraftis & Kontovas, Citation2013; Fagerholt & Ronen, Citation2013; Magirou et al., Citation2015). These problems may also involve flexible frequencies (Giovannini & Psaraftis, Citation2019).
Speed and route decisions may also be combined (Psaraftis & Kontovas, Citation2014; Wen et al., Citation2017). One of the perhaps counter-intuitive results of these combined scenarios is that sailing the minimum distance route at minimum speed does not necessarily minimise fuel consumption and hence emissions. This may be so whenever the minimum distance route involves a heavier load profile for the ship. Depending on ship type, the difference in fuel consumption between a fully loaded and a ballast (empty) condition can be up to 40%. A result that is less surprising is that expensive cargoes sail faster and hence induce more emissions. This is to be expected if cargo in-transit inventory costs are taken into account.
Modal split/discrete choice models examine scenarios in which shippers may choose a transportation mode that is alternative to the maritime mode as a result of unfavourable time, cost, or other considerations. As a result, cargoes from the Far East to Europe may prefer the rail vs the maritime mode, or cargoes in European short sea trades may choose the road mode as opposed to shipping. Such modal shifts may increase the overall level of CO2 and may warrant mitigation measures by the shipping lines and the policy makers. Papers that look into this problem include Psaraftis and Kontovas (Citation2010) and Zis and Psaraftis (Citation2017, Citation2019). A multi-commodity network flow formulation in the context of China’s Belt and Road initiative is given by Qi et al. (Citation2022).
Operational level problems concern problems with planning horizons from a few hours to a few days. Among them, a very important class of problems concerns weather routing scenarios. The important difference vis-à-vis the ship routing and scheduling problems described earlier is that weather routing problems are typically path problems defined as trying to optimise a ship’s track from a specified origin to a specified destination, under a prescribed objective and under time varying and maybe also stochastic weather conditions. Decision variables include the selection of the ship’s path and the speeds along the path, and typical objectives include minimum transit time and minimum fuel consumption. Several constraints such as time windows, or constraints to accommodate a feasible envelope on ship motions, vertical and transverse accelerations and ship loads such as shear forces, bending moments and torsional moments can be introduced. The influence of currents, tides, winds and waves, which may be varying in both time and space should be taken into account. See Perakis and Papadakis (Citation1989), Lo and McCord (Citation1998), and Zis et al. (Citation2020) for some references on this topic.
Disruption management is also another important operational level problem class and typically refers to liner shipping. It entails actions that can help the shipping company manage its recovery from possible disruptions of its schedule. Such disruptions may be the result of bad weather, port strikes, equipment malfunction, or more recently, the COVID-19 pandemic that caused massive congestion in many ports worldwide or the Ever Given incident that disrupted traffic in the Suez Canal and the Far East to Europe route in 2021. See Qi (Citation2015) and Asghari et al. (Citation2023) for work in this area.
Terminal management, berth allocation, and stowage planning problems also belong to the class of operational level problems, as they deal with an important part of the overall maritime supply chain, that of the coordination between a ship and a port. See Moccia et al. (Citation2006), Goodchild and Daganzo (Citation2007), and Zhen (Citation2015) for some related work.
To conclude, maritime transportation constitutes an important application area for OR, and the related problems are interesting and significant, both from a methodological perspective and from a business and policy perspective. This is so both for traditional economic performance criteria and for environmental criteria, the importance of the latter getting higher in recent years.
3.30. Transportation: AviationFootnote82
According to the Air Transport Action Group, in 2019, the world’s 1,478 airlines transported 4.5 billion passengers to 3,780 airports, generating 11.3 million direct jobs. Today’s airlines are sophisticated businesses making aviation a worldwide economic engine. Yet, aviation is a competitive industry, vulnerable to exogenous shocks, e.g., oil prices, infectious diseases or terrorism. This leads to high costs, and low profit margins, even in the best of times. To tackle these challenges, the industry relies heavily on Operational Research (OR) for decision-making. Prominent OR application domains within aviation include revenue management, airline schedule planning, airline operations recovery, airport flight scheduling, and air traffic flow management. Additionally, some recent OR studies focus on modelling delay propagation through aviation networks
3.30.1. Revenue management (RM)
RM is broadly defined as the strategies and tactics to increase revenues by optimally matching demand for products/services with the available capacity. Seat allocation and pricing are the two main decisions to control ticket sales of different fare-classes. Models using capacity allocation as the control variable are called quantity-based RM models. They allocate seats to fare-classes with exogenously determined prices. In contrast, price-based RMs uses pricing policies to maximise revenues. Early RM models focused on overbooking – the practice of selling more tickets than seats to hedge against cancellations or no-shows. Though various static and dynamic models have been presented since the pioneering work of Rothstein (Citation1971), airlines mostly use simpler static policies in practice.
Static and dynamic models have been proposed for both single-leg and network-wide seat allocation. Static models optimise seat allocation at a certain time, typically the beginning of the booking period. Dynamic models monitor and adjust to the booking process over time. The earliest static leg-based approach (Littlewood, Citation1972) considered two fare-classes. Brumelle et al. (Citation1990) relaxed the assumption of statistical independence between demands. For the multi-class problem, Belobaba (Citation1987b) introduced the Expected Marginal Seat Revenue heuristic, a widely used approach in practice. Many studies (e.g., Brumelle & McGill, Citation1993) provided optimality conditions for static models, while others developed methods to compute optimal protection levels in the absence of demand information, using optimality conditions (Van Ryzin & McGill, Citation2000) or stochastic approximations (Kunnumkal & Topaloglu, Citation2009). Dynamic formulations allow time-based controls, but require restrictive demand assumption for tractability, limiting practical impact. Solving network models exactly is computationally hard. Accordingly, most studies on network models use approximations, based on deterministic linear programming (Talluri & Van Ryzin, Citation2004a), randomised linear programming (Talluri & Van Ryzin, Citation1999) or decomposition into single-resource problems, as well as solutions using simulation-based optimisation (Bertsimas & De Boer, Citation2005). Seat inventory control usually assumes capacity to be fixed, an assumption relaxed by Büsing et al. (Citation2019) integrating capacity uncertainty in leg-based RM. Others integrated inventory control and pricing (You, Citation1999).
Simplest deterministic pricing models are price-sensitive versions of the well-known newsvendor problem (Gallego & Van Ryzin, Citation1994). This allows mathematical derivations of optimal prices. Several studies, such as, Feng and Gallego (Citation1995), generalised this problem to include demand dynamics and/or multiple products. Stochastic dynamic programming is a natural way to tackle dynamic pricing. Dynamic models depict reality more accurately, but are harder to solve (Gallego & Van Ryzin, Citation1994). Interestingly, solutions to deterministic models are usually good approximations for their stochastic counterparts, and are often used in practice. Traditional RM assumed independent demand, ignoring product substitutability. With the seminal paper of Talluri and Van Ryzin (Citation2004a), the RM field has shifted toward including customer choice behaviors within pricing and capacity decisions. §3.21 provides a detailed overview of RM concepts and trends beyond aviation.
3.30.2. Airline schedule planning (ASP)
ASP is the process of designing airline schedules maximising profits subject to resource constraints. Taking demand, airport and aircraft characteristics, and maintenance and personal requirements as inputs, ASP outputs selected flight timetables, aircraft schedules and crew duty plans. Most ASP steps typically occur before RM actions and thus constrain the set of decisions available to RM systems. Key ASP steps include fleet planning, route planning, frequency planning, timetable design, fleet assignment, aircraft routing and crew scheduling. Fleet planning involves decisions regarding purchasing, selling, and leasing of aircraft fleet, while route planning selects airport pairs to operate nonstop flights. Early studies, e.g., Hane et al. (Citation1995), matched a predetermined set of flights with aircraft types, developing a fleet assignment model (FAM). The FAM specifically focuses on fleet assignment, which is one particular step within the overall ASP process. The basic FAM, a mixed-integer linear program, minimised costs of operating aircraft and passengers unserved, given passenger demand for individual flight legs. This leg-based approach ignores that passengers often fly on multiple flights in connecting itineraries.
Barnhart et al. (Citation2002) overcame this limitation via an itinerary-based FAM to explicitly model network effects. Some studies developed tractable solution approaches. Barnhart et al. (Citation2009) proposed a subnetwork-based decomposition for capturing FAM’s revenue implications, an approach recently extended by Yan et al. (Citation2022a) to solve a FAM incorporating passenger choice. Others extended FAM by incorporating incremental timetable design decisions, e.g., changes to flight timings (Desaulniers et al., Citation1997) or selection of optional flights (Lohatepanont & Barnhart, Citation2004). Wei et al. (Citation2020) developed a clean slate heuristic optimising entire timetables and fleet assignments under choice-based demand. Frequency planning, which optimises the number of flights operated during a day or part of a day, rather than deciding exact timetables, has also received attention, with an emphasis on capturing affects of competition from other airline and high-speed rail operators (e.g., Cadarso et al., Citation2017).
The last two steps in schedule planning are conceptually similar. Aircraft routing assigns individual aircraft to flights while ensuring that each aircraft undergoes periodic maintenance, and crew scheduling assigns crew to operate flights while satisfying a myriad of crew regulations. Early studies individually optimised aircraft routing (Gopalan & Talluri, Citation1998) or crew scheduling (Graves et al., Citation1993a). Lavoie et al. (Citation1988) used column generation, an effective solution approach for both problems, to crew scheduling, while Cordeau et al. (Citation2001) used Benders decomposition to jointly solve both problems.
Good schedules not only minimise planned costs, but are also robust to disruptions, to keep the actual costs low. Researchers in early 2000s optimised robustness proxies, e.g., station purity, short cycles, crew swapping opportunities, and crew schedule slack (Schaefer et al., Citation2005). Later studies directly minimised total planned and unplanned costs of aircraft routing (Lan et al., Citation2006) and crew scheduling (Yen & Birge, Citation2006) separately, and also jointly (Dunbar et al., Citation2012). Recent studies have used robust optimisation to solve the aircraft routing (Yan & Kung, Citation2018) and crew scheduling (Antunes et al., Citation2019) problems.
3.30.3. Airline operations recovery (AOR)
AOR encompasses the actions undertaken to repair schedules, when disruptive events such as inclement weather, equipment failures, etc., take place. Rosenberger et al. (Citation2003) developed a model and a solution heuristic for repairing aircraft routing, whereas Lettovskỳ; et al. (Citation2000) tackled crew recovery. For the integrated recovery problem, Petersen et al. (Citation2012) developed a decomposition strategy, while Maher (Citation2016) used column-and-row-generation. Recent recovery studies incorporated other key elements, including flight planning (Marla et al., Citation2017) and passenger no-shows (Cadarso & Vaze, Citation2022).
3.30.4. Airport flight scheduling (AFS)
Beyond airline decision-making, OR is also used to improve decision-making of central authorities and air traffic managers. Research over the past decade demonstrated the potential for enhancing social welfare by constraining schedules at busy airports via slot-control mechanisms (Swaroop et al., Citation2012). Some studies balanced strategic cost of scheduling changes against tactical cost of delays, for a single airport (Jacquillat & Odoni, Citation2015) or multiple airports (Wang & Jacquillat, Citation2020). Zografos et al. (Citation2012) used an integer program for allocating slots to airlines under administrative controls. Fairbrother et al. (Citation2020) attempted to balance the often-conflicting goals of efficiency, equity and the incorporation of airline preferences in optimising slot-scheduling mechanism.
3.30.5. Air traffic flow management (ATFM)
The tactical side of airport and airspace capacity management has received considerable OR attention since the 1990s. ATFM is a broad term used to define key interventions, such as ground holding of airplanes, that ensure safe and efficient flight operations by restricting flow of aircraft into congested airspaces. Terrab and Odoni (Citation1993) and Vranas et al. (Citation1994) proposed the single-airport and multi-airport ground holding problems, respectively. The latter was extended to include enroute capacities by Bertsimas and Patterson (Citation1998). Bertsimas et al. (Citation2011b) additionally incorporated flight rerouting and solved larger-scale problems. Adoption of the collaborative decision-making (CDM) paradigm in practice ushered in a new era of research. Advocating increased agency to airlines, Vossen and Ball (Citation2006) provided an integer program for slot trading mechanism design under CDM. Recent studies (e.g., Starita et al., Citation2020) are increasingly focused on explicit handling of uncertainty on both demand and capacity side within the ATFM optimisation problems.
3.30.6. Modelling delay propagation
Tightly coupled aviation networks make disruption management particularly challenging. Delays and disruptions in one part of the network propagate to other parts, through aircraft, crew and passenger connections. Recent studies quantified these propagation effects. First, Pyrgiotis et al. (Citation2013) proposed an analytical queuing and network decomposition model for aircraft-based delay propagation. Barnhart et al. (Citation2014) presented discrete choice models for passenger itinerary estimation and a reaccommodation heuristic for passenger delay calculations. Wei and Vaze (Citation2018) solved inverse optimisation for estimating crew itineraries and crew-based delay propagation. These studies attempted bridging the gap between sparse and aggregate public datasets, and the detailed and disaggregated data needs for aviation OR research.
3.30.7. Further reading
Readers interested in aviation OR are referred to the second edition of the book by Belobaba et al. (Citation2015). In particular, Chapters 4 and 5 focus on pricing and RM, Chapters 8 and 10 on schedule optimisation, robustness and recovery, and Chapter 14 on air traffic management and control. Looking ahead, it is apparent that OR will keep finding natural applications within aviation, especially given the exciting disruptive innovations within urban air mobility. Rapidly growing fields of passenger air taxi operations and drone operations for parcel deliveries are giving rise to new variants of well-known OR problems, e.g., network design (Wang et al., Citation2022b), travelling salesperson (Roberti & Ruthmair, Citation2021), vehicle routing (Dayarian et al., Citation2020), and facility location (Chen et al., Citation2022).
3.31. Transportation: Network designFootnote83
In a transportation context, the term Network Design (Magnanti & Wong, Citation1984) generally refers to planning the supply side of a transportation system so that it efficiently satisfies some estimate of demand within the quality standards of the customers using the system. The planning decisions typically prescribe the movements of vehicles, or convoys (e.g., a railroad train or tug and barges), between stations/terminals in the network to transport people or goods. Network design is typically undertaken for situations wherein what is transported, be it people or goods, is small relative to vehicle capacity. Thus, one primary measure of efficiency is vehicle utilisation, with high utilisation achieved through consolidation. Quality is typically measured based on on-time delivery.
Network design is relevant to passenger transportation systems such as urban public-transport (Mauttone et al., Citation2021) by bus (Ceder & Wilson, Citation1986) or light rail (Farahani et al., Citation2013), as well as systems providing interurban transport by train (Hooghiemstra et al., Citation1999) or airplane (Franke, Citation2017). It is also relevant to a wide range of goods transportation markets, such as parcel and small-package (Barnhart & Schneur, Citation1996) and less-than-truckload freight (Powell & Sheffi, Citation1989). A network design case study for a postal carrier can be found in Winkenbach et al. (Citation2016). Transportation carriers serving these markets may rely on one or more modes, including motor carrier (Bakir et al., Citation2021), rail (Chouman & Crainic, Citation2021), ocean (Christiansen et al., Citation2020), and inland waterway (Konings, Citation2003). The planning of vehicle and goods movements by each mode and synchronisation of goods moving from one mode to the next (e.g., intermodal) can be assisted by network design (Arnold et al., Citation2004).
For different modes the scope of design decisions prescribed by network design models may be broadened in different ways. For example, modes such as rail and inland waterway involve multiple layers of consolidation. For rail (Zhu et al., Citation2014), goods are consolidated into rail cars, which are then consolidated into blocks that are transported by the same locomotive. For motor carriers, vehicles can not yet move without a driver, whose movements and schedules are restricted by governmental safety regulations and potentially labour management practices that dictate the driver return periodically to a specific physical location in the network (e.g., his/her domicile). Network design models for motor carriers may build schedules for drivers that observe safety regulations (Crainic et al., Citation2018) as well as determine how many drivers should be associated with each physical location (Hewitt et al., Citation2019).
The network design problem is typically modelled as a Mixed Integer Program (MIP) formulated on a directed graph (Crainic et al., Citation2021a). Nodes in such a graph model physical locations, potentially at different points in time. Directed edges between such nodes model transportation that begins in one physical location and ends at another. Edges may encode a scheduling dimension, such as when a vehicle departs from one location and arrives at another, that depends in part on the travel time required for the physical move (Erera et al., Citation2013). Associated with an edge is a function that maps the amount of vehicle capacity made available on that edge to cost. Typically, it is a step function with each step modelling an increase in capacity due to dispatching an extra vehicle. Commodities model people or goods that are to be transported; associated with each commodity is an origin node, a destination node, and a size.
The classical network design problem seeks to find a path for each commodity that begins at its origin node, ends at its destination node, and potentially visits one or more intermediate nodes. The problem evaluates these paths with respect to the total cost of capacity made available to support them and seeks to minimise that total cost. Some network design models (Frangioni & Gendron, Citation2021) instead minimise costs that are a function of the amount of goods transported on an edge, as opposed to the capacity made available to transport them. Network design is an optimisation problem that has received significant attention both for its practical relevance and the computational challenges (Johnson et al., Citation1978) associated with solving it.
Most MIP formulations of the network design problem involve commodity flow variables that model the transportation of goods within the network and another set of edge-based variables that model the transportation of vehicles. Typically, commodity flow variables are continuous when a shipper’s goods can be divided and routed on multiple paths or binary when they cannot. Commodity flow variables are typically edge-based, but some models involve paths from shipment origin to shipment destination. The use of a path formulation typically necessitates column generation (Hewitt et al., Citation2019). However, unlike the vehicle routing problem, extended, path-based formulations of the network design problem do not provide stronger linear relaxations than compact, arc-based formulations. Depending on the context and mode the vehicle edge variables may either be binary or integer. Linking constraints are included in the formulation to ensure sufficient vehicle capacity travels on an edge to carry the commodities making that transportation move. Typically, much larger cost coefficients are associated with vehicle edge variables than commodity flow variables.
The majority of literature on network design focuses on deterministic models wherein it is presumed all parameter values (costs, capacities, demands) are known with certainty. However, given that network design models are often solved as part of a tactical planning exercise, uncertainty has been studied (Hewitt et al., Citation2021). Much of that work focuses on uncertainty in commodity sizes and models such problems as two stage stochastic programs wherein vehicle movements are planned in the first stage and commodities are routed in the second stage given the vehicle movements prescribed in the first. There has been limited work on robust optimisation models (Koster & Schmidt, Citation2021) or those that view network design in a dynamic context (Al Hajj Hassan et al., Citation2022).
Both exact (Crainic & Gendron, Citation2021) and heuristic (Crainic & Gendreau, Citation2021) solution methods for deterministic network design models have been proposed. One challenge associated with solving MIP formulations of network design problems is that the linking constraints often lead to fractional vehicle edge variables. Thus, the linear programming relaxations of network design MIPs often yield weak bounds on the objective function value of an optimal solution to the MIP. As a result, much of the literature that focuses on speeding up the solution of MIP formulations of the network design problem focuses on strengthening formulations with valid inequalities (Nemhauser & Wolsey, Citation1988). Such inequalities are typically either based on classical ideas such as flow covers from integer programming (Gu et al., Citation1999) or leveraging the network structure of the problem (Raack et al., Citation2011). Another approach taken to solve network design problems is Benders decomposition (Benders, Citation2005; Costa, Citation2005), particularly when second stage variables are continuous and the optimisation problem resulting from fixing the network design is a linear program.
Another challenge associated with solving MIP formulations of the network design problem is due to the size of the network on which the MIP is formulated when that network encodes time. The classical approach to representing time in network design is to formulate a MIP on a network wherein multiple nodes represent the same physical location, albeit at different points in time (Crainic et al., Citation2016). Similarly, multiple edges represent the same physical transportation move, albeit at different departure and arrival times. Such networks are typically referred to as time-expanded networks and the overall solution procedure in contexts that require the modelling of time is to construct such a network, formulate a MIP on that network, and then solve that MIP. Boland et al. (Citation2019) study the impact on solution quality of modelling time at different granularities and observe that the finer the representation the higher the quality of the resulting solution. However, such an approach can be computationally challenging when long planning horizons must be modelled or fine representations of time are used, as both cases lead to networks and resulting MIPs that are very large. An alternate approach, called Dynamic Discretisation Discovery (Boland et al., Citation2017; Hewitt, Citation2019) proposed to instead generate time-expanded networks in a dynamic and iterative manner.
Heuristic methods for deterministic network design models can be classified into one of two categories. The first category focuses on metaheuristics (Hussain et al., Citation2019) and neighbourhood structures. Early heuristics (Powell & Sheffi, Citation1983) proposed for network design models searched neighbouring solutions by reducing the capacity on one edge in the network and, if necessary, increasing the capacity on another. However, more recent and effective methods have proposed more complex neighbourhood structures such as cycles or paths (Ghamlouche et al., Citation2003). The second category focuses on what is generally called matheuristics (Maniezzo et al., Citation2021). In these heuristics, a neighbourhood of a solution is searched by formulating and solving the MIP of the network design problem, albeit with the values of subsets of variables fixed to their values in the solution at hand (Hewitt et al., Citation2010). This is repeatedly done and with different mechanisms used for selecting subsets of variables to fix.
Similarly, both exact and heuristic solution methods have been proposed for stochastic network design models that take the form of scenario-based two stage stochastic programs. The vast majority of such stochastic programs studied to date involve continuous commodity flow variables in the second stage. As a result, the second stage subproblems are linear programs and the overall stochastic program is amenable to Benders decomposition (Birge & Louveaux, Citation2011). Thus, much of the methodological work on solving such stochastic programs has focused on techniques for speeding up or rendering more impactful different steps in the Benders scheme (Magnanti & Wong, Citation1981; Crainic et al., Citation2021c). While Progressive Hedging (Rockafellar & Wets, Citation1991) is an exact method for two stage stochastic programs with continuous variables in both stages, it has been used as the basis of heuristic methods for stochastic network design (Crainic et al., Citation2011, Citation2014).
Crainic et al. (Citation2021b) contains deeper dives into the subjects touched on here as well as discussions of those not discussed.
3.32. Transportation: Vehicle routingFootnote84
The Capacitated Vehicle Routing Problem (CVRP) was first proposed by Dantzig and Ramser (Citation1959), and named the Truck Dispatching Problem. The goal was that of routing a fleet of identical gasoline delivery trucks from a central depot to service stations (often referred as ‘customers’). Each truck had to return to the central depot, after visiting an ordered subset of the customers. All customers had to be visited once by a vehicle delivering all their gasoline requirements in the one delivery. The objective was the minimisation of the routing costs, as the sum of the travelling distances of every truck. The CVRP classical definition is the same as that proposed by Dantzig and Ramser (Citation1959) more than 60 years ago. Introducing a capacitated fleet of vehicles makes the CVRP for a much harder generalisation of the Travelling Salesman Problem (Flood, Citation1956).
The CVRP definition has been enriched over the decades to take into account all the delivery requirements of the customers and of the transportation providers, as well as the characteristics of the available fleet of vehicles, and the increasing availability of technology (i.e., GIS and real time mapping, autonomous vehicles, shared mobility systems and so on). The research literature has flourished with new variants, as well as more sophisticated and flexible solution approaches. This chapter aims at providing pointers to key milestones achieved in the last 60 years of the CVRP literature, identifying the latest and most successful exact and metaheuristic algorithms, as well as referencing the most famous online challenges and standard techniques for benchmarking CVRP solution algorithms.
The CVRP ‘classical’ variants and solution approaches are well summarised in Toth and Vigo (Citation2002). This book provides key references and definitions for critical application features, as for the CVRP with Time Windows, the CVRP with Backhauls and the CVRP with Pickup and Delivery, the CVRP with vehicle/site dependencies, the CVRP with inventory and the stochastic CVRP. Golden et al. (Citation2008) extends the definition of the classical variants to routing problems with heterogenous fleets, periodic routing problems, split routing problems, dynamic and online routing problems. Toth and Vigo (Citation2014) further widen the remit of application of routing algorithms to maritime applications, disaster relief distribution problems, and considers up-to-date objective functions different than minimising the distance travelled. More recently, fleets of electric vehicles (Pelletier et al., Citation2016), problems over time (Mor & Speranza, Citation2020), drones (Otto et al., Citation2018), cargo boats (Christiansen et al., Citation2013) and warehouse pickers (Schiffer et al., Citation2022) have been embedded in routing settings. The new dynamic environment inspired research on stochastic (Gendreau et al., Citation2016), dynamic (Soeffker et al., Citation2022) and time-dependent (Gendreau et al., Citation2015) routing problems.
An up-to-date survey on recent trends can be found in Vidal et al. (Citation2020), in which the CVRP extensions due to richer objective functions, the integration with other optimisation problems, and application-oriented transportation requirements are surveyed. Partyka and Hall (Citation2014) discuss routing algorithms from the practitioners’ perspective, and surveys which are the requirements of a logistics company when they acquire a routing software.
Next the most successful CVRP solution algorithms are summarised, first discussing exact methods. Formulations with a polynomial number of variables and constraints were the first proposed mathematical models, as for the two-commodity formulation by Laporte (Citation1992) and Baldacci et al. (Citation2004). They have the advantage of being easy to use (as they just require encoding in the syntax of the solver). The disadvantage of them however is their poor performance due to high dimension of the formulations, and the weakness of the continuous relaxation. Better results were obtained from formulations with an exponential number of constraints, such as those in which subtour elimination constraints are added dynamically to the formulations in a branch&cut fashion (Padberg & Rinaldi, Citation1991). The CVRPSEP library by Lysgaard et al. (Citation2004) provides separation procedures for subtour elimination constraints, as well as other strengthening additional inequalities. The most successful exact solution framework is up-to-date the branch&cut&price (Desaulniers et al., Citation2006; Laporte, Citation2009). This method is based on the Dantzig-Wolfe decomposition (Desrosiers & Lübbecke, Citation2005). Binary variables model if a route is used or not in the solution, thus their corresponding set is exponential in size. As a consequence, a restricted set of variables is used to initiate the formulation and only profitable routes are iteratively generated solving a subproblem, called the pricing problem. The CVRP pricing problem is a shortest path with resource constrains, and it is typically solved through dynamic programming (Irnich & Desaulniers, Citation2005). Some of the most relevant milestones in developing branch&cut&price algorithms for the CVRP are combining branch&cut and column generation into the first branch&cut&price (Fukasawa et al., Citation2006), applying bi-directional search in the subproblem (Righini & Salani, Citation2008), introducing subset row cuts (Jepsen et al., Citation2008), using ng-routes to speed up the subproblem solution (Baldacci et al., Citation2011), using stabilisation techniques for dual values (Gschwind & Irnich, Citation2016; Pessoa et al., Citation2018), and proposing primal heuristics based on the restricted master problem (Sadykov et al., Citation2019). The reader might refer to Desaulniers et al. (Citation2002) for the most widely used acceleration techniques for the solution of the pricing problem.
Lately, the work of Pessoa et al. (Citation2020) provides an impressive open-source branch&cut&price algorithm, based on Pecin et al. (Citation2017). This algorithm provides state-of-the-art exact solutions for the CVRP and, using a flexible solution representation, for most of the well known routing variants and other sequencing problems. The tool incorporates the algorithmic components previously mentioned, as well as other recent developments (see for example, Sadykov et al., Citation2021), and compares favourably to other branch&cut&price implementations. Some of the most powerful exact algorithms for the CVRP, available in different programming languages, are publicly available at Sadykov (Citation2022).
Metaheuristics are capable of solving very large CVRP instances in limited computing time, however there is no proof of optimality for the solutions found. They are typically initialised with solutions generated by constructive heuristics (the Clarke and Wright is a famous example, Clarke & Wright, Citation1964). Metaheuristics rely heavily on local search procedures to improve the solution quality and intensify the search, and on a metaheuristic framework to obtain a good balance of diversification and intensification (Gendreau & Potvin, Citation2010). In chronological order, popular CVRP frameworks have been the Tabu Search (Cordeau & Laporte, Citation2005), the Adaptive Large Neighbourhood Search (Pisinger & Ropke, Citation2007), the Iterated Local Search (Subramanian et al., Citation2013), and the Hybrid Genetic algorithm (Vidal, Citation2022b). The latter two examples of metaheuristic frameworks are particularly relevant to the CVRP literature due to their high performance, their flexibility in solving effectively many VRP variants, and because their code had been made publicly available to the research community (the code presented in Vidal, Citation2022b is, for example, available at Vidal, Citation2022a). Vidal et al. (Citation2013) provide a very good summary of the features that make a CVRP metaheuristic successful.
More recently, examples of algorithms producing very high quality solutions for the CVRP have been:
Arnold and Sörensen (Citation2019): data mining is used to identify solution features, and these features are used to effectively guide the search algorithms;
Christiaens and Vanden Berghe (Citation2020): SISRs is a ruin and recreate algorithm based on an innovative string removal operator;
Queiroga et al. (Citation2021): POPMUSIC is a matheuristic that iteratively solves smaller subproblems by means of the branch&cut&price by Pessoa et al. (Citation2020);
Accorsi and Vigo (Citation2021): FILO is an Iterated Local Search with acceleration techniques and annealing-based neighbour acceptance criteria;
Máximo and Nascimento (Citation2021): AILS-PR is an Iterated Local Search metaheuristic hybridised with Path Relinking; and,
Cavaliere et al. (Citation2022): a refinement heuristic using a penalty-based extension of the Lin and Kerninghan heuristic is combined with a restricted column generation to iteratively select meaningful routes.
Clear standards have been set by the CVRP community around which benchmark instances should be used for testing the performance of an algorithm, and which are ways of testing a computer code for a fair comparison with other previously proposed algorithms. Uchoa et al. (Citation2017) discuss the most widely used instances and provides a link to the repository, in which the input data, as well as the best known solutions, are provided and kept up-to-date by the authors. A more recent set of instances and best known solutions is available in Queiroga et al. (Citation2022), where the authors provide data enabling the use of machine learning approaches to solve the CVRP. Accorsi et al. (Citation2022) present the standard practices to test CVRP algorithms: how to determine computing time (typically on a single thread), common ways of tuning parameters, and providing best and average solutions on a specified number of executions, among others.
Finally, another popular and flourishing avenue for boosting research on the development of effective solutions approaches for the CVRP and variants is represented by competitions. Some of the most famous CVRP and routing challenges are:
the DIMACS challenge (DIMACS Citation2021), where the goal was to promote research on challenging routing problem variants;
the Amazon Last Mile Routing Research Challenge (Amazon last mile routing, Citation2021), where a specific problem was tackled, namely, the challenge of embedding driver knowledge into route optimisation;
the recently launched EURO Meets NeurIPS 2022 Vehicle Routing Competition (EURO Meets NeurIPS 2022 Citation2022), with the goal of developing and comparing machine learning techniques for the CVRP.
The Vehicle Routing problem has inspired an incredible amount of research. This is due to the challenges it poses when it comes to solving it, to the many variants related to it and to the relevant practical applications. Despite the decades of research efforts and achievements, interest continues to grow mainly thanks to the emerging topics raised by the ever changing application environment. This chapter provides a brief, but hopefully sufficiently comprehensive overview of the techniques, problem variants and emerging trends which will inspire further research.
4. ConclusionsFootnote85
This encyclopedic article, dedicated to the 75th anniversary of the Journal of the Operational Research Society, is made up of an Introduction and two distinct though related sections: Methods and Applications. The introduction section gives an interesting overview of OR with an emphasis on its origin in the UK and highlights the methods and applications that are covered in this paper. A brief summary of the two sections is given below.
In the first main section (§2), 24 OR-based methods are presented by experts in their respective areas. These methods, which are given in alphabetical order, are concisely described, each starting with the basics, then moving to advanced and contemporary aspects. The authors also pinpoint challenging limitations while highlighting promising research directions.
As OR is rooted in the need to solve decision problems either through optimisation, statistics, visualisation and information technology tools, or through soft system methodologies, we aim to retain this historical flavor in summarising these methods by adopting a simple three-group categorisation.
The first category covers optimisation-related topics and includes 10 out of the 24 subsections. It ranges from the original optimisation model of linear programming (LP; §2.14) in the late 1940s to its various extensions. One is obtained by restricting the decision variables to discrete elements including binary ones (§2.15), allowing uncertainty in the input (§2.21), or relaxing the objective function or the constraints not to be necessarily linear (§2.16). An interesting area that had been dormant for more than 30 years was revived in the late 1970s and early 1980s by studying a special case of fractional LP which defines relative efficiency and is known as data envelopment analysis (§2.7). Combinatorial optimisation (§2.4), a topic that has fascinated and intrigued many mathematicians of the 18th century, seeks an optimal subset or values from a large finite set of elements. These problems can be defined and solved through graphs and networks (§2.12), some of which are relatively more difficult than others. To measure the performance of algorithms in terms of time and space complexity, computational complexity (§2.5) emerged as a solid foundation for distinguishing between classes defined as and
and studying
-approximation algorithms. One methodology can be traced back to the Ancient Greek times, and is based on the ‘find and discover principle’, now known as ‘heuristic search’ (§2.13), which has experienced a phenomenal growth in the late 1980s and early 1990s. This is a major development since these methodologies provide the best way to reduce not only the risk of getting stuck at poor local optima, but also have the power to yield practical solutions for complex discrete and global optimisation problems that could not have been solved otherwise. A methodology that is free from restrictions of linearity and convexity is the study of multi-stage process, as given in §2.9.
The next category includes statistics and decision-based tools and also covers 10 of the 24 subsections. For example, business analytics (§2.3), decision analysis (§2.8) and visualisation (§2.24), though they previously existed under different names, have grown significantly while retaining their simplicity. Machine learning, including artificial intelligence (§2.1), which borrowed its principles from heuristic search and statistics, has taken off very rapidly in teaching, research and applications. This is mainly due to computer power, sophisticated algorithms, freely available computer languages such as R and Python, and their ability to handle massive amount of data that are now easily available to the public. Other older topics, though still relevant and widely applicable, have also seen a surge in new developments. These include queueing (§2.17), forecasting (§2.10), control theory (§2.6), and game theory (§2.11). Given the uncertainty and risk involved in many decisions, risk analysis (§2.18) is evolving fast so as to handle such environments alongside computer simulation (§2.19), especially discrete event simulation. The latter, which has a wide spectrum of applications in both the private and public sectors, has recently been enriched by incorporating multi-objective optimisation within its evaluation component.
The last category covers the remaining four subsections. Although some of these research areas existed in other fields such as system engineering in the 1950s, they have become contemporary OR topics especially in the UK in the late 1970s. Soft OR and problem structuring methods (§2.20) question the problem definition and aim to involve stakeholders for a better understanding, with system thinking (§2.23) analysing the interactions between people, machines and systems while also questioning the system boundaries. A related area is system dynamics (§2.22) where the dynamism is incorporated throughout and found to suit better applications with limited but plausible scaling. An interesting, though relatively recent OR area, but with a long history rooted in social psychology, is behavioural OR (§2.2), where people’s behaviour and culture are incorporated into the decision making process. Although the methodologies included in this category usually do not directly aim to solve problems, they can be complementary to the harder OR techniques.
The second section covers applications that have been, since the very beginning, strongly interconnected with the development of OR methodologies. This section is very rich in examples coming from many fields. For the sake of brevity, we will not refer to each subsection individually but mention just a few. By reading the section it is evident that, on the one hand OR provides appropriate modelling and solution tools to practical problems that arise in the real world and are nowadays crucial in the design and management of most systems, from healthcare and other public services, to transportation and manufacturing. On the other hand, the complexity and size of practical problems has always stimulated the progress of OR towards more efficient and flexible techniques which are capable to cope with the challenges posed by the applications. This mutual and virtuous connection is well reflected by the richness of the Applications section of this work. It highlights not only the traditional areas which saw tremendous research efforts and successful implementations, as the traditional fields of transportation, manufacturing, cutting and packing, and inventory management, but also relatively new and interesting sectors such as sports and education.
It is worth noting that in the Applications section (§3), several dimensions of OR impact in the real world clearly emerge. The first one is the broad range of fields to which OR techniques have already successfully been applied and offer an even larger potential yet to be exploited. These range from vertical sectors, such as supply chain management, disaster relief and recovery, or military applications, where a wide array of problems are defined and solved through appropriate and varied methodologies, to more horizontal domains which may impact several vertical sectors, like vehicle routing or facility location, for which highly specialised methods have been developed. The second dimension is related to the great variety of methodologies applied to the different contexts. These span the whole tool set of OR, including exact and heuristic methods developed to solve specific optimisation problems, to techniques created to handle uncertainty and multi-criteria and, more recently, integrating artificial intelligence methods. Indeed, the great improvements achieved in the last decades in integer and nonlinear programming now allow to effectively model and solve many problems arising at the operational and tactical levels, where data are more available and reliable. The uncertainty in the data and the modelling typical of strategic decisions are successfully handled by a variety of methodologies that have proven to be effective in the solution of real applications which are well reviewed in this work. A third very interesting dimension is represented by the development of new broad research perspectives which may have a strong impact in all fields of OR and are deeply motivated by applications. An excellent example is the inclusion of fairness and ethics in optimisation which, on the one hand allow for considering important issues favouring the acceptability and usability of the results, and on the other hand pose new methodological challenges.
As a general conclusion, thanks to the advances in computer technology, the availability of massive amount of live data, and novel developments, in both optimisation and statistics, effective optimisation software, powerful machine learning techniques and visualisation tools now exist to solve problems that were considered practically unsolvable just a decade ago. Applications have always been a main driver for OR development, and the successes achieved increase the appetite for further improvements.
In the more classical area of exact and heuristic techniques, there is clearly a need to improve the capability of handling efficiently large and very large-scale instances to cope with more complex and demanding scenarios. This increase in scale is not only generated by the need to solve larger problems, but also to incorporate various steps of the planning processes into integrated and more comprehensive methods. A field that still deserves further research efforts is the consideration of uncertainty in OR methods. Important methodological obstacles have yet to be surmounted and there is clearly a need for the development of simple and pragmatic methods, possibly resulting from the integration of artificial intelligence techniques, which can be applied to the solution of large-scale problems arising in several important application domains. However, it is also worth stressing that these advances, though they are welcome, may suffer from shortcomings, such as the local optimality trap, biased data, and impractical assumptions. These hidden aspects could yield poor outcomes on which academics and practitioners ought to keep an open eye.
Disclaimer
The views expressed in this paper are those of the authors and do not necessarily reflect the views of their affiliated institutions and organisations.
| List of acronyms | ||
| 1D | = | One-Dimensional |
| 2D | = | Two-Dimensional |
| 2DKP | = | Two-Dimensional Knapsack Problem |
| 2S-SPR | = | Two-Stage Stochastic Programming with Recourse |
| 3D | = | Three-Dimensional |
| ABM | = | Agent Based Modelling |
| ABS | = | Agent Based Simulation |
| ADP | = | Approximate Dynamic Programming |
| AFS | = | Airport Flight Scheduling |
| AHD | = | Attended Home Delivery |
| AHP | = | Analytic Hierarchy Process |
| AI | = | Artificial Intelligence |
| ANN | = | Artificial Neural Network |
| ANT | = | Actor Network Theory |
| AoA | = | Activity-on-Arc |
| AoN | = | Activity-on-Node |
| AOR | = | Airline Operations Recovery |
| AP | = | Assignment Problem |
| ARIMA | = | AutoRegressive Integrated Moving Average (model) |
| AR | = | Assurance Region |
| AR | = | Action Research |
| ARIMAX | = | AutoRegressive Integrated Moving Average with eXogenous variables (model) |
| AS | = | Autonomous System |
| ASP | = | Airline Schedule Planning |
| ATFM | = | Air Traffic Flow Management |
| B2B | = | Business-To-Business |
| B2C | = | Business-To-Consumer |
| B&B | = | Branch-and-Bound |
| B&C | = | Branch-and-Cut |
| B&P | = | Branch-and-Price |
| BN | = | Bayesian Network |
| BOR | = | Behavioural OR |
| BPP | = | Bin Packing Problem |
| C&P | = | Cutting and Packing |
| CBOR | = | Community-Based Operations Research |
| CDEA | = | Centralised DEA |
| CDM | = | Central Decision Maker or Collaborative Decision-Making |
| CLD | = | Causal Loop Diagram |
| CLSC | = | Closed-Loop Supply Chains |
| CM | = | Cellular Manufacturing |
| CNN | = | Convolutional Neural Network |
| CO | = | Combinatorial Optimisation |
| CODP | = | Customer Order decoupling point |
| ConFL | = | Connected Facility Location Problem |
| COR | = | Community Operational Research |
| CPM | = | Critical Path Method |
| CRPS | = | Continuous Ranked Probability Score |
| CST | = | Critical Systems Thinking |
| CSW | = | Common Set of Weights |
| CVaR | = | Conditional Value at Risk |
| CVRP | = | Capacitated Vehicle Routing Problem |
| DBN | = | Dynamic Bayesian Network |
| DC | = | Distribution Centre |
| DCT | = | Daily Contact Testing |
| DDF | = | Directional Distance Function |
| DEA | = | Data Envelopment Analysis |
| DEF | = | Deterministic Equivalent Formulation |
| DES | = | Discrete Event Simulation |
| DfT | = | Department for Transport |
| DHSC | = | Department of Health and Social Care |
| DMU | = | Decision Making Unit |
| DNDEA | = | Dynamic Network DEA |
| DNN | = | Deep Neural Network |
| DP | = | Dynamic Programming |
| DPSIR | = | Drivers, Pressures, State, Impact and Response |
| DS | = | Data Science |
| DSS | = | Decision Support Systems |
| EAT | = | Efficiency Analysis Trees |
| ED | = | Emergency Department |
| EMSR | = | Expected Marginal Seat Revenue |
| EOQ | = | Economic Order Quantity |
| ERP | = | Enterprise Resource Planning |
| ESICUP | = | EURO Special Interest Group on Cutting and Packing |
| EURO | = | European Operational Research Societies |
| EVP | = | Expected Value of Possession |
| FAM | = | Fleet Assignment Model |
| FIFO | = | First-In-First-Out |
| FMS | = | Flexible Manufacturing Systems |
| FPTAS | = | Fully Polynomial-Time Approximation Scheme |
| FSF | = | Full-State Feedback |
| FSO | = | Fixed-sum output |
| FTU | = | Facilities-Transformation-Usage (framework) |
| GIS | = | Geographic Information Systems |
| GLM | = | Generalised Linear Model |
| GMB | = | Group Model Building |
| GNN | = | Graphical Neural Network |
| GORS | = | Government Operational Research Service |
| GP | = | Gaussian Process |
| GPS | = | Global Positioning System |
| GPU | = | Graphics Processing Unit |
| GRASP | = | Greedy Randomised Adaptive Search Procedure |
| HJB | = | Hamilton-Jacobi-Bellman |
| HMT | = | His Majesty’s Treasury |
| HL | = | Humanitarian Logistics |
| HORAF | = | Heads of OR and Analytics Forum |
| IAM | = | Integrated Assessment Model |
| ICU | = | Intensive Care Unit |
| IGP | = | Interior Gateway Protocol |
| IHIP | = | Intangibility, Heterogeneity, Inseparability, and Perishability |
| IID | = | Independently and Identically Distributed |
| INFORMS | = | Institute for Management Science and Operations Research |
| INRC | = | International Nurse Rostering Competition |
| ILP | = | Integer Linear Problem |
| ILP | = | Integer Linear Programming |
| IoT | = | Internet of Things |
| IP | = | Integer Programming |
| IRP | = | Inventory-Routing Problem |
| JIT-MS | = | Just-In-Time Material System |
| KP | = | Knapsack Problem |
| LASSO | = | Least Absolute Shrinkage and Selection Operator |
| LCSA | = | Life Cycle Sustainability Assessment |
| LEAR | = | LASSO-Estimated AutoRegressive (model) |
| LP | = | Linear Programming |
| LQG | = | Linear Quadratic Gaussian |
| MAE | = | Mean Absolute Error |
| MAPE | = | Mean Absolute Percentage Error |
| MASE | = | Mean Absolute Scaled Error |
| MAUT | = | Multi-Attribute Utility Theory |
| MAVT | = | Multi-Attribute Value Theory |
| MBM | = | Market Based Measure |
| MC | = | Maximum Clique or Minimum Cut (problem) |
| MCDA | = | Multi-Criteria Decision Analysis |
| MCF | = | Minimum Cost Flow (problem) |
| MDP | = | Markov Decision Process |
| MF | = | Maximum Flow (problem) |
| MILP | = | Mixed-Integer Linear Programming |
| MINLP | = | Mixed-Integer NonLinear Programming |
| MIMO | = | Multi-Input-Multi-Output |
| MIP | = | Mixed-Integer Programming |
| ML | = | Machine Learning |
| MLPI | = | Malmquist Luenberger Productivity Indicator |
| MPC | = | Model Predictive Control |
| MPI | = | Malmquist Productivity Index |
| MRP | = | Material Requirement Planning |
| MRP | = | Multi-level Regression Post-stratification |
| NBEATS | = | Neural Basis Expansion Analysis for interpretable Time Series forecasting |
| NDEA | = | Network DEA |
| NDP | = | Neural Dynamic Programming |
| NFL | = | National Football League |
| NHS | = | National Health Service |
| NGO | = | Non-Governmental Organisation |
| OM | = | Operations Management |
| ONS | = | Office for National Statistics |
| OR | = | Operational (or Operations) Research |
| PA | = | Portfolio Analysis |
| PATAT | = | Practice and Theory of Automated Timetabling |
| PCR | = | Polymerase Chain Reaction |
| PERT | = | Project Evaluation and Review Technique |
| PESP | = | Periodic Event Scheduling Problem |
| PID | = | Proportional Integral Derivative |
| POMDP | = | Partially Observable Markov Decision Process |
| PPS | = | Production Possibility Set |
| PRA | = | Probabilistic Risk Assessment |
| PSM | = | Problem Structuring Method |
| PTAS | = | Polynomial-Time Approximation Scheme |
| QRA | = | Quantile Regression Averaging or Quantitative Risk Assessment |
| R&D | = | Research and Development |
| RCPSP | = | Resource-Constrained Project Scheduling Problem |
| RES | = | Renewable Energy Sources |
| RFID | = | Radio-Frequency IDentification |
| RINS | = | Relaxation-Induced Neighbourhood Search |
| RL | = | Reinforcement Learning or Reverse Logistics |
| RM | = | Revenue Management |
| RMSE | = | Root Mean Squared Error |
| RNN | = | Recurrent Neural Network |
| SAA | = | Sample Average Approximation |
| SARF | = | Social Amplification of Risk Framework |
| SAT | = | SATisfiability (problem) |
| SCA | = | Strategic Choice Approach |
| SCM | = | Supply Chain Management |
| SD | = | Systems Dynamics |
| SDM | = | Structured Decision Making |
| SFA | = | Stochastic Frontier Analysis |
| SI | = | Systemic Intervention |
| SIS | = | Schools Infection Survey |
| SISO | = | Single-Input-Single-Output |
| SODA | = | Strategic Options Development and Analysis |
| SR | = | Segment Routing |
| SRCPSP | = | Stochastic Resource-Constrained Project Scheduling Problem |
| SSM | = | Soft Systems Methodology |
| SST | = | Shortest Spanning Trees |
| STP | = | Steiner Tree Problem (in graphs) |
| SVF | = | Support Vector Frontiers |
| SVM | = | Support Vector Machine |
| TE | = | Traffic Engineering |
| TFP | = | Total Factor Productivity |
| TPS | = | Toyota Production System |
| TSP | = | Travelling Salesman Problem |
| TTP | = | Travelling Tournament Problem |
| UDE | = | UnDesirable Effects |
| UFLP | = | Uncapacitated Facility Location Problem |
| VaR | = | Value at Risk |
| VAR | = | Vector AutoRegressive (model) |
| VMI | = | Vendor Managed Inventory |
| VPP | = | Virtual Power Plant |
| VRP | = | Vehicle Routing Problems |
| VSM | = | Viable Systems Model or Value Stream Map |
| VSS | = | Value of Stochastic Solution |
| VUCA | = | Volatile, Uncertain, Complex and Ambiguous |
| WHO | = | World Health Organisation |
Acknowledgements
Fotios Petropoulos would like to thank all the co-authors of this article for their very enthusiastic response and participation in this initiave. He is also indebted to his lead advisor for this project, Gilbert Laporte, as well as Christos Vasilakis, Güneş Erdoğan, Stephen Disney and Maria Battarra for their help and suggestions. Finally, Fotios is grateful to John Boylan and the other Editors-in-Chief of the Journal of the Operational Research Society for inviting this paper to be part of the 75th issue of the journal. Fotios dedicates this article to Professor John Boylan: John, your kindness will always be remembered.
Maria Battarra’s work reported in this paper was undertaken as part of the Made Smarter Innovation: Centre for People-Led Digitalisation, at the University of Bath, University of Nottingham, and Loughborough University.
David Canca’s work was supported by the University of Sevilla, the Regional Government of Andalucia (Spain) and the European Regional Development Fund (ERDF) under grant US-1381656.
Laurent Charlin and Andrea Lodi would like to thank Didier Chételat and Mizu Nishikawa-Toomey for reading and commenting on drafts of their subsection (§2.1) and the CIFAR AI Chair and the CERC programs for funding.
Salvatore Greco wishes to acknowledge the support of the Ministero dell’Istruzione, dell’Universita e dellaRicerca (MIUR) - PRIN 2017, project “Multiple Criteria Decision Analysis and Multiple Criteria Decision Theory”, grant 2017CY2NCA.
Katherine Kent and Sam Rose thank Mithu Norris for the help and coordination with §3.10 but also Emma Hickman and Ffion Lelii for their contribution.
Silvano Martello, Paolo Toth and Daniele Vigo were supported by Air Force Office of Scientific Research under Grants no. FA8655-20-1-7012, FA8655-20-1-7019, FA9550-17-1-0234 and FA8655-21-1-7046.
Dimitrios Sotiros’s work was partially supported by the National Science Center (NCN, Poland) grant no. 2020/37/B/HS4/03125.
Greet Vanden Berghe and Sanja Petrovic acknowledge the advice provided by Andrea Schaerf (University of Udine).
Rafał Weron’s work was partially supported by the National Science Center (NCN, Poland) grant no. 2018/30/A/HS4/00444.
Disclosure statement
No potential conflict of interest was reported by the authors.
Notes
1 This section was written by Gilbert Laporte.
2 This subsection was written by Laurent Charlin and Andrea Lodi.
3 This subsection was written by L. Alberto Franco and Raimo P. Hämäläinen.
4 We use the term ‘intervention’ to describe a structured process comprised of designed OR-related activities such as, for example, modelling, model use, data collection, interviews, meetings, workshops, and presentations.
5 To date, the practice of studying OR-supported intervention as a system of interest has been somewhat overlooked by behavioural modellers, with the notable exception of behavioural forecasting researchers; see §2.10, and also Arvan et al. (Citation2019) and Petropoulos et al. (Citation2016).
6 It should be noted that a variance approach could also be implemented through field research designs where pre and post intervention measures of key variables are used to assess changes in behaviour or surrogates of behaviour. Studies adopting this approach are common in the System Dynamics field (see, for example, Scott et al., Citation2013).
9 This subsection was written by John E. Boylan.
10 This subsection was written by Silvano Martello and Paolo Toth.
11 This subsection was written by Ulrich Pferschy and Clemens Thielen.
12 This subsection was written by Xun Wang.
13 This subsection was written by Sebastián Lozano.
14 This subsection was written by Matthias Ehrgott and Salvatore Greco.
15 This subsection was written by Dong Li and Li Ding.
16 This subsection was written by Fotios Petropoulos.
17 This subsection was written by Georges Zaccour.
18 This subsection was written by Ivana Ljubić.
20 akira.ruc.dk/∼keld/research/LKH/
23 This subsection was written by Ceyda Oğuz and İstenç Tarhan.
24 This subsection was written by Jean-Marie Bourjolly.
25 This subsection was written by Adam N. Letchford and Andrea Lodi.
26 This subsection was written by E. Alper Yıldırım.
27 This subsection was written by Hayriye Ayhan and Tuğçe Işık.
28 This subsection was written by Louis Anthony Cox, Jr.
29 For example, https://www.sra.org/risk-analysis-introduction/
30 This subsection was written by Christine S.M. Currie.
33 Henceforth in this subsection we just refer to PSMs to avoid the obvious dual of ‘Hard OR’ and therefore to manufacture, or at least to continue to propagate, an unhelpful distinction. We retain its use here for signposting.
34 This subsection was written by Mike Yearworth and Leroy White.
35 This subsection was written by Haitao Li.
36 Decision problems with incomplete information about random parameter’s probability distribution go beyond the scope of this review.
37 This subsection was written by Martin Kunc and John D.W. Morecroft.
38 This subsection was written by Gerald Midgley.
39 This subsection was written by Martin J. Eppler.
40 This subsection was written by Bo Chen.
41 This subsection was written by Amanda J. Gregory.
42 https://www.theorsociety.com/get-involved/pro-bono-or/, accessed 2023-01-19
43 https://www.theorsociety.com/get-involved/society-groups/special-interest-groups-and-networks/or-in-the-third-sector/, accessed 2023-01-19
44 https://connect.informs.org/probonoanalytics/home, accessed 2023-02-08
45 This subsection was written by Julia A. Bennell.
47 This subsection was written by Bahar Y. Kara and Özlem Karsu.
48 This subsection was written by Charlotte Köhler and Tom Van Woensel.
49 https://bit.ly/3dfiwDW, 2022-08-08
50 https://bit.ly/3SzAWzf, 2022-08-08
51 https://bit.ly/3B1H1ww, 2022-09-09
52 This subsection was written by Jill Johnes.
53 This subsec fn-type="endnote"tion was written by Judit Lienert.
54 This subsection was written by John N. Hooker.
55 This subsection was written by Michèle Breton.
56 VaR is a quantile of the distribution of investment losses over a specified period, while CVaR is the amount of the expected losses, conditional to being above the VaR threshold
57 This subsection was written by Katherine Kent and Sam Rose.
58 This subsection was written by Christos Vasilakis.
59 This subsection was written by Jing-Sheng Song.
60 This subsection was written by Sibel A. Alumur.
61 This subsection was written by Janny Leung and Yong-Hong Kuo.
62 This subsection was written by Kathryn E. Stecke and Xuying Zhao.
63 This subsection was written by Kai Virtanen and Raimo P. Hämäläinen.
64 This subsection was written by Emel Aktas.
65 This subsection was written by Cihan Tugrul Cicek and Güneş Erdoğan.
66 This subsection was written by Dimitrios Sotiros and Rafał Weron.
67 This subsection was written by Willy Herroelen and Erik Demeulemeester.
68 This subsection was written by Arne K. Strauss and Jens Frische.
69 This subsection was written by Jan Holmström and Lauri Saarinen.
70 This subsection was written by Ian G. McHale.
71 This subsection was written by Stephen M. Disney.
72 This subsection was written by Akshay Mutha.
73 This subsection was written by Bernard Fortz.
74 https://www-public.imtbs-tsp.eu/∼maigron/RIR_Stats/RIR_Delegations/World/ASN-ByNb.html
76 This subsection was written by Greet Vanden Berghe and Sanja Petrovic.
77 The 25th anniversary of PATAT conferences had to be postponed till 2022, due to the COVID-19 pandemic.
80 This subsection was written by David Canca.
81 This subsection was written by Harilaos N. Psaraftis.
82 This subsection was written by Virginie Lurkin and Vikrant Vaze.
83 This subsection was written by Mike Hewitt.
84 This subsection was written by Claudia Archetti and Maria Battarra.
85 This section was written by Daniele Vigo and Said Salhi.
References
- Aardal, K., Bixby, R., Hurkens, C., Lenstra, A., Smeltink, J., 2000. Market split and basis reduction: Towards a solution of the Cornuéjols-Dawande instances. INFORMS Journal on Computing, 12, 192–202. https://doi.org/10.1287/ijoc.12.3.192.12635
- Abadi, M., Agarwal, A., Barham, P., Brevdo, E., Chen, Z., Citro, C., Corrado, G. S., Davis, A., Dean, J., Devin, M., Ghemawat, S., Goodfellow, I., Harp, A., Irving, G., Isard, M., Jia, Y., Jozefowicz, R., Kaiser, L., Kudlur, M., Levenberg, J., Mané, D., Monga, R., Moore, S., Murray, D., Olah, C., Schuster, M., Shlens, J., Steiner, B., Sutskever, I., Talwar, K., Tucker, P., Vanhoucke, V., Vasudevan, V., Viégas, F., Vinyals, O., Warden, P., Wattenberg, M., Wicke, M., Yu, Y., Zheng, X., 2015. TensorFlow: Large-scale machine learning on heterogeneous systems . Software available from tensorflow.org.
- Abbas, A. E., Tambe, M., von Winterfeldt, D., 2017. Improving homeland security decisions. Cambridge University Press.
- Abbey, J. D., Blackburn, J., Guide, V. D. R., 2015. Optimal pricing for new and remanufactured products. Journal of Operations Management, 36, 130–146. https://doi.org/10.1016/j.jom.2015.03.007
- Abbey, J. D., Kleber, R., Souza, G. C., Voigt, G., 2017. The role of perceived quality risk in pricing remanufactured products. Production and Operations Management, 26 (1), 100–115. https://doi.org/10.1111/poms.12628
- Abbott, M., Doucouliagos, C., 2009. Competition and efficiency: Overseas students and technical efficiency in Australian and New Zealand universities. Education Economics, 17 (1), 31–57. https://doi.org/10.1080/09645290701773433
- Accorsi, L., Lodi, A., Vigo, D., 2022. Guidelines for the computational testing of machine learning approaches to vehicle routing problems. Operations Research Letters, 50 (2), 229–234. https://doi.org/10.1016/j.orl.2022.01.018
- Accorsi, L., Vigo, D., 2021. A fast and scalable heuristic for the solution of large-scale capacitated vehicle routing problems. Transportation Science, 55 (4), 832–856. https://doi.org/10.1287/trsc.2021.1059
- Acito, F., Khatri, V., 2014. Business analytics: Why now and what next? Business Horizons, 57 (5), 565–570. https://doi.org/10.1016/j.bushor.2014.06.001
- Ackermann, F., Eden, C., 2011. Making strategy: Mapping out strategic success (2nd ed.). SAGE.
- Ackermann, F., Howick, S., 2022. Experiences of mixed method or practitioners: Moving beyond a technical focus to insights relating to modelling teams. Journal of the Operational Research Society, 73 (9), 1905–1918. https://doi.org/10.1080/01605682.2021.1970486
- Ackoff, R. L., 1956. The development of operations research as a science. Operations Research, 4 (3), 265–295. https://doi.org/10.1287/opre.4.3.265
- Ackoff, R. L., 1970. A black ghetto’s research on a university. Operations Research, 18 (5), 761–771. https://doi.org/10.1287/opre.18.5.761
- Ackoff, R. L., 1977. Optimization + objectivity = optout. European Journal of Operational Research, 1 (1), 1–7. https://doi.org/10.1016/S0377-2217(77)81003-5
- Ackoff, R. L., 1979a. The future of operational research is past. Journal of the Operational Research Society, 30 (2), 93–104. https://doi.org/10.2307/3009290
- Ackoff, R. L., 1979b. Resurrecting the future of operational research. Journal of the Operational Research Society, 30 (3), 189–199. https://doi.org/10.2307/3009600
- Ackoff, R. L., 1981. Creating the corporate future: Plan or be planned for. Wiley.
- Acworth, P. A., Broadie, M., Glasserman, P., 1998. A comparison of some Monte Carlo and quasi Monte Carlo techniques for option pricing. In Niederreiter, H., Hellekalek, P., Larcher, G., Zinterhof, P. (Eds.), Monte Carlo and Quasi-Monte carlo methods 1996 (pp. 1–18). Springer-Verlag.
- Adouani, Y., Jarboui, B., Masmoudi, M., 2022. A matheuristic for the 0–1 generalized quadratic multiple knapsack problem. Optimization Letters, 16, 37–58. https://doi.org/10.1007/s11590-019-01503-z
- Afsharian, M., Podinovski, V. V., 2018. A linear programming approach to efficiency evaluation in nonconvex metatechnologies. European Journal of Operational Research, 268 (1), 268–280. https://doi.org/10.1016/j.ejor.2018.01.013
- Afzali, H. H. A., Karnon, J., Gray, J., 2012. A critical review of model-based economic studies of depression: Modelling techniques, model structure and data sources. PharmacoEconomics, 30 (6), 461–482. https://doi.org/10.2165/11590500-000000000-00000
- Agarwal, R., Ergun, Ö., 2008. Ship scheduling and network design for cargo routing in liner shipping. Transportation Science, 42 (2), 175–196. https://doi.org/10.1287/trsc.1070.0205
- Agasisti, T., 2016. Cost structure, productivity and efficiency of the Italian public higher education industry 2001–2011. International Review of Applied Economics, 30 (1), 48–68. https://doi.org/10.1080/02692171.2015.1070130
- Agatz, N., Campbell, A., Fleischmann, M., Savelsbergh, M., 2011. Time slot management in attended home delivery. Transportation Science, 45 (3), 435–449. https://doi.org/10.1287/trsc.1100.0346
- Agatz, N., Campbell, A. M., Fleischmann, M., Van Nunen, J., Savelsbergh, M., 2013. Revenue management opportunities for internet retailers. Journal of Revenue and Pricing Management, 12 (2), 128–138. https://doi.org/10.1057/rpm.2012.51
- Agatz, N., Fleischmann, M., Van Nunen, J. A., 2008. E-fulfillment and multi-channel distribution–A review. European Journal of Operational Research, 187 (2), 339–356. https://doi.org/10.1016/j.ejor.2007.04.024
- Aghezzaf, E., 2005. Capacity planning and warehouse location in supply chains with uncertain demands. Journal of the Operational Research Society, 56 (4), 453–462. https://doi.org/10.1057/palgrave.jors.2601834
- Agrawal, S., Avadhanula, V., Goyal, V., Zeevi, A., 2019. MNL-bandit: A dynamic learning approach to assortment selection. Operations Research, 67 (5), 1453–1485. https://doi.org/10.1287/opre.2018.1832
- Ahuja, R. K., Magnanti, T. L., Orlin, J. B., 1993. Network flows: Theory, algorithms, and applications. Prentice Hall.
- Aigner, D., Lovell, C. A. K., Schmidt, P., 1977. Formulation and estimation of stochastic frontier production function models. Journal of Econometrics, 6 (1), 21–37. https://doi.org/10.1016/0304-4076(77)90052-5
- AIMMS. 2022. AIMMS. https://www.aimms.com/
- Akçalı, E., Çetinkaya, S., Üster, H., 2009. Network design for reverse and closed-loop supply chains: An annotated bibliography of models and solution approaches. Networks, 53 (3), 231–248. https://doi.org/10.1002/net.20267
- Akhmedov, M., Kwee, I., Montemanni, R., 2016. A divide and conquer matheuristic algorithm for the prize-collecting steiner tree problem. Computers & Operations Research, 70, 18–25. https://doi.org/10.1016/j.cor.2015.12.015
- Akhtar, S., Scarf, P., Rasool, Z., 2015. Rating players in test match cricket. Journal of the Operational Research Society, 66 (4), 684–695. https://doi.org/10.1057/jors.2014.30
- Al Hajj Hassan, L., Hewitt, M., Mahmassani, H. S., 2022. Daily load planning under different autonomous truck deployment scenarios. Transportation Research Part E: Logistics and Transportation Review, 166, 102885. https://doi.org/10.1016/j.tre.2022.102885
- Al-Kanj, L., Nascimento, J., Powell, W. B., 2020. Approximate dynamic programming for planning a ride-hailing system using autonomous fleets of electric vehicles. European Journal of Operational Research, 284 (3), 1088–1106. https://doi.org/10.1016/j.ejor.2020.01.033
- Albano, A., Sapuppo, G., 1980. Optimal allocation of two-dimensional irregular shapes using heuristic search methods. IEEE Transactions on Systems, Man, and Cybernetics, 10 (5), 242–248. https://doi.org/10.1109/TSMC.1980.4308483
- Albayrak Ünal, Ö., Erkayman, B., Usanmaz, B., 2023. Applications of artificial intelligence in inventory management: A systematic review of the literature. Archives of Computational Methods in Engineering, 30 (4), 2605–2625. https://doi.org/10.1007/s11831-022-09879-5
- Alexander, C., 1992. The Kalai–Smorodinsky bargaining solution in wage negotiations. Journal of the Operational Research Society, 43, 779–786. https://doi.org/10.2307/2583096
- Alfandari, L., Ljubić, I., da Silva, M. D. M., 2022. A tailored benders decomposition approach for last-mile delivery with autonomous robots. European Journal of Operational Research, 299 (2), 510–525. https://doi.org/10.1016/j.ejor.2021.06.048
- Alfieri, A., Groot, R., Kroon, L., Schrijver, A., 2006. Efficient circulation of railway rolling stock. Transportation Science, 40 (3), 378–391. https://doi.org/10.1287/trsc.1060.0155
- Algaba, A., Ardia, D., Bluteau, K., Borms, S., Boudt, K., 2020. Econometrics meets sentiment: An overview of methodology and applications. Journal of Economic Surveys, 34 (3), 512–547. https://doi.org/10.1111/joes.12370
- Ali, S., Ramos, A. G., Carravilla, M. A., Oliveira, J. F., 2022. On-line three-dimensional packing problems: A review of off-line and on-line solution approaches. Computers & Industrial Engineering, 168, 108122. https://doi.org/10.1016/j.cie.2022.108122
- Allen, R., Athanassopoulos, A., Dyson, R. G., Thanassoulis, E., 1997. Weights restrictions and value judgements in data envelopment analysis: Evolution, development and future directions. Annals of Operations Research, 73, 13–34.
- Allon, G., Van Mieghem, J. A., 2010. Global dual sourcing: Tailored base-surge allocation to near- and offshore production. Management Science, 56 (1), 110–124. https://doi.org/10.1287/mnsc.1090.1099
- Almgren, R., Chriss, N., 2001. Optimal execution of portfolio transactions. Journal of Risk, 3, 5–40. https://doi.org/10.21314/JOR.2001.041
- Altay, N., Green III, W. G., 2006. OR/MS research in disaster operations management. European Journal of Operational Research, 175 (1), 475–493. https://doi.org/10.1016/j.ejor.2005.05.016
- Altay, N., Labonte, M., 2014. Challenges in humanitarian information management and exchange: Evidence from Haiti. Disasters, 38 (s1), S50–S72. https://doi.org/10.1111/disa.12052
- Altın, A., Fortz, B., Thorup, M., Ümit, H., 2013. Intra-domain traffic engineering with shortest path routing protocols. Annals of Operations Research, 204 (1), 65–95. https://doi.org/10.1007/s10479-012-1270-7
- Alumur, S., Kara, B. Y., 2008. Network hub location problems: The state of the art. European Journal of Operational Research, 190, 1–21. https://doi.org/10.1016/j.ejor.2007.06.008
- Alumur, S. A., Campbell, J. F., Contreras, I., Kara, B. Y., Marianov, V., O’Kelly, M. E., 2021. Perspectives on modeling hub location problems. European Journal of Operational Research, 291 (1), 1–17. https://doi.org/10.1016/j.ejor.2020.09.039
- Alvarez, J. F., Tsilingiris, P., Engebrethsen, E. S., Kakalis, N. M. P., 2011. Robust fleet sizing and deployment for industrial and independent bulk ocean shipping companies. INFOR: Information Systems and Operational Research, 49 (2), 93–107. https://doi.org/10.3138/infor.49.2.093
- Álvarez-Miranda, E., Salgado-Rojas, J., Hermoso, V., Garcia-Gonzalo, J., Weintraub, A., 2020. An integer programming method for the design of multi-criteria multi-action conservation plans. Omega, 92, 102147. https://doi.org/10.1016/j.omega.2019.102147
- Alvarez-Valdes, R., Martinez, A., Tamarit, J. M., 2013. A branch & bound algorithm for cutting and packing irregularly shaped pieces. International Journal of Production Economics, 145 (2), 463–477. https://doi.org/10.1016/j.ijpe.2013.04.007
- Alyahyan, E., Düstegör, D., 2020. Predicting academic success in higher education: Literature review and best practices. International Journal of Educational Technology in Higher Education, 17, 3. https://doi.org/10.1186/s41239-020-0177-7
- Amazon Last Mile Routing. 2021. Research challenge. Retrieved September 14, 2021, from https://routingchallenge.mit.edu/
- Anandalingam, G., 1987. Asymmetric players and bargaining for profit shares in natural resource development. Management Science, 33 (8), 1048–1057. https://doi.org/10.1287/mnsc.33.8.1048
- Andersen, D. F., Vennix, J. A. M., Richardson, G. P., Rouwette, E. A. J. A., 2007. Group model building: Problem structuring, policy simulation and decision support. Journal of the Operational Research Society, 58 (5), 691–694. https://doi.org/10.1057/palgrave.jors.2602339
- Anderson, E., Chen, B., Shao, L., 2017. Supplier competition with option contracts for discrete blocks of capacity. Operations Research, 65 (4), 952–967. https://doi.org/10.1287/opre.2017.1593
- Anderson, E., Chen, B., Shao, L., 2022. Capacity games with supply function competition. Operations Research, 70 (4), 1969–1983. https://doi.org/10.1287/opre.2021.2221
- Andersson, F., Mausser, H., Rosen, D., Uryasev, S., 2001. Credit risk optimization with conditional value-at-risk criterion. Mathematical Programming, 89 (2), 273–291. https://doi.org/10.1007/PL00011399
- Andersson, H., Duesund, J. M., Fagerholt, K., 2011. Ship routing and scheduling with cargo coupling and synchronization constraints. Computers & Industrial Engineering, 61 (4), 1107–1116. https://doi.org/10.1016/j.cie.2011.07.001
- Andersson, H., Fagerholt, K., Hobbesland, K., 2015. Integrated maritime fleet deployment and speed optimization: Case study from RoRo shipping. Computers & Operations Research, 55, 233–240. https://doi.org/10.1016/j.cor.2014.03.017
- Andras, V., 2010. Omnet++. In Klaus, W., Mesut, G., James, G. (Eds.), Modeling and tools for network simulation (pp. 35–59). Springer.
- Angelelli, E., Mansini, R., Speranza, M. G., 2010. Kernel search: A general heuristic for the multi-dimensional knapsack problem. Computers & Operations Research, 37 (11), 2017–2026. https://doi.org/10.1016/j.cor.2010.02.002
- Angelus, A., 2023. Generalizations of the clark-scarf model and analysis. In Song, J.-S. (Ed.), Research handbook on inventory management. Edward Elgar Publishing.
- Annabi, A., Breton, M., François, P., 2012. Resolution of financial distress under chapter 11. Journal of Economic Dynamics and Control, 36 (12), 1867–1887. https://doi.org/10.1016/j.jedc.2012.06.004
- Antunes, D., Vaze, V., Antunes, A. P., 2019. A robust pairing model for airline crew scheduling. Transportation Science, 53 (6), 1751–1771. https://doi.org/10.1287/trsc.2019.0897
- Aparicio, J., Crespo-Cebada, E., Pedraja-Chaparro, F., Santín, D., 2017. Comparing school ownership performance using a pseudo-panel database: A Malmquist-type index approach. European Journal of Operational Research, 256 (2), 533–542. https://doi.org/10.1016/j.ejor.2016.06.030
- Aparicio, J., Ruiz, J. L., Sirvent, I., 2007. Closest targets and minimum distance to the Pareto-efficient frontier in DEA. Journal of Productivity Analysis, 28 (3), 209–218. https://doi.org/10.1007/s11123-007-0039-5
- Applegate, D., Bixby, R., Chvátal, V., Cook, W., 2007. The traveling salesman problem: A computational study. Princeton University Press.
- Applegate, D. L., Bixby, R. E., Chvátal, V., Cook, W. J., 2011. The traveling salesman problem. Princeton University Press.
- Arana-Jiménez, M., Sánchez-Gil, M. C., Lozano, S., Younesi, A., 2022. Efficiency assessment using fuzzy production possibility set and enhanced Russell Graph measure. Computational and Applied Mathematics, 41 (2), 79. https://doi.org/10.1007/s40314-022-01780-y
- Araújo, A. M., Santos, D., Marques, I., Barbosa-Povoa, A., 2020. Blood supply chain: A two-stage approach for tactical and operational planning. OR Spectrum, 43, 1023–1053. https://doi.org/10.1007/s00291-020-00600-1
- Archetti, C., Bertazzi, L., 2021. Recent challenges in routing and inventory routing: E-commerce and last-mile delivery. Networks, 77 (2), 255–268. https://doi.org/10.1002/net.21995
- Archetti, C., Bertazzi, L., Laporte, G., Speranza, M. G., 2007. A branch-and-cut algorithm for a vendor-managed inventory-routing problem. Transportation Science, 41 (3), 382–391. https://doi.org/10.1287/trsc.1060.0188
- Archetti, C., Boland, N., Speranza, M. G., 2017. A matheuristic for the multivehicle inventory routing problem. INFORMS Journal on Computing, 29 (3), 377–387. https://doi.org/10.1287/ijoc.2016.0737
- Archetti, C., Corberán, A., Plana, I., Sanchis, J. M., Speranza, M. G., 2015. A matheuristic for the team orienteering arc routing problem. European Journal of Operational Research, 245, 392–401. https://doi.org/10.1016/j.ejor.2015.03.022
- Argyris, N., Karsu, Ö., Yavuz, M., 2022. Fair resource allocation: Using welfare-based dominance constraints. European Journal of Operational Research, 297 (2), 560–578. https://doi.org/10.1016/j.ejor.2021.05.003
- Ariely, D., Simonson, I., 2003. Buying, bidding, playing, or competing? value assessment and decision dynamics in online auctions. Journal of consumer psychology: The official journal of the Society for Consumer Psychology, 13 (1), 113–123. https://doi.org/10.1207/153276603768344834
- Aringhieri, R., Bruni, M. E., Khodaparasti, S., van Essen, J. T., 2017. Emergency medical services and beyond: Addressing new challenges through a wide literature review. Computers & Operations Research, 78, 349–368. https://doi.org/10.1016/j.cor.2016.09.016
- Arnold, F., Sörensen, K., 2019. What makes a VRP solution good? The generation of problem-specific knowledge for heuristics. Computers & Operations Research, 106, 280–288. https://doi.org/10.1016/j.cor.2018.02.007
- Arnold, P., Peeters, D., Thomas, I., 2004. Modelling a rail/road intermodal transportation system. Transportation Research Part E: Logistics and Transportation Review, 40 (3), 255–270. https://doi.org/10.1016/j.tre.2003.08.005
- Arrow, K. J., Harris, T., Marschak, J., 1951. Optimal inventory policy. Econometrica, 19 (3), 250–272. https://doi.org/10.2307/1906813
- Arrow, K. J., Karlin, S., Scarf, H. E., 1958. Studies in the mathematical theory of inventory and production. Stanford University Press.
- Artzner, P., Delbaen, F., Eber, J.-M., Heath, D., 1999. Coherent measures of risk. Mathematical Finance, 9 (3), 203–228. https://doi.org/10.1111/1467-9965.00068
- Arvan, M., Fahimnia, B., Reisi, M., Siemsen, E., 2019. Integrating human judgement into quantitative forecasting methods: A review. Omega, 86, 237–252. https://doi.org/10.1016/j.omega.2018.07.012
- Asghari, M., Jaber, M. Y., Mirzapour Al-e-hashem, S. M. J., 2023. Coordinating vessel recovery actions: Analysis of disruption management in a liner shipping service. European Journal of Operational Research, 307 (2), 627–644. https://doi.org/10.1016/j.ejor.2022.08.039
- Asmuni, H., Burke, E. K., Garibaldi, J. M., McCollum, B., Parkes, A. J., 2009. An investigation of fuzzy multiple heuristic orderings in the construction of university examination timetables. Computers & Operations Research, 36 (4), 981–1001. https://doi.org/10.1016/j.cor.2007.12.007
- Åström, K. J., 2012. Introduction to stochastic control theory. Courier Corporation.
- Åström, K. J., Kumar, P. R., 2014. Control: A perspective. Automatica, 50 (1), 3–43. https://doi.org/10.1016/j.automatica.2013.10.012
- Åström, K. J., Wittenmark, B., 2013. Adaptive control. Courier Corporation.
- Atan, Z., Ahmadi, T., Stegehuis, C., de Kok, T., Adan, I., 2017. Assemble-to-order systems: A review. European Journal of Operational Research, 261 (3), 866–879. https://doi.org/10.1016/j.ejor.2017.02.029
- Atasu, A., Sarvary, M., Van Wassenhove, L. N., 2008. Remanufacturing as a marketing strategy. Management Science, 54 (10), 1731–1746. https://doi.org/10.1287/mnsc.1080.0893
- Athanasopoulos, G., Gamakumara, P., Panagiotelis, A., Hyndman, R. J., Affan, M., 2020. Hierarchical forecasting. In P. Fuleky (Ed.), Macroeconomic forecasting in the era of big data: Theory and practice (pp. 689–719). Springer.
- Atkinson, S., Gary, M. S., 2016. Mergers and acquisitions: Modeling decision making in integration projects. In M. Kunc, J. Malpass, & L. White (Eds.), Behavioral operational research: Theory, methodology and practice (pp. 319–336). Palgrave Macmillan.
- Ausiello, G., Crescenzi, P., Gambosi, G., Kann, V., Marchetti-Spaccamela, A., Protasi, M., 1999. Complexity and approximation: Combinatorial optimization problems and their approximability properties. Springer.
- Aven, T., 2015. Risk analysis. John Wiley & Sons.
- Aven, T., 2020. Three influential risk foundation papers from the 80s and 90s: Are they still state-of-the-art? Reliability Engineering & System Safety, 193, 106680. https://doi.org/10.1016/j.ress.2019.106680
- Aviv, Y., 2003. A time-series framework for supply-chain inventory management. Operations Research, 51 (2), 210–227. https://doi.org/10.1287/opre.51.2.210.12780
- Axsäter, S., 1993. Continuous review policies for multi-level inventory systems with stochastic demand. Handbooks in Operations Research and Management Science, 4, 175–197.
- Axsäter, S., 1996. Using the deterministic EOQ formula in stochastic inventory control. Management Science, 42 (6), 830–834. https://doi.org/10.1287/mnsc.42.6.830
- Axsäter, S., 2003. Supply chain operations: Serial and distribution inventory systems. In S. C. Graves, A. G. de Kok (Eds.), Handbooks in operations research and management science (Vol. 11., pp. 525–559). Elsevier.
- Axsäter, S., 2006. Inventory control. Springer.
- Axsäter, S., Rosling, K., 1993. Installation vs. echelon stock policies for multilevel inventory control. Management Science, 39 (10), 1274–1280. https://doi.org/10.1287/mnsc.39.10.1274
- Ayhan, H., Baccelli, F., 2001. Expansions for joint laplace transform of stationary waiting times in (max,+)-linear systems with poisson input. Queueing Systems, 37 (1), 291–328.
- Ayhan, H., Palmowski, Z., Schegel, S., 2004. Cyclic queueing networks with subexponential service trimes. Journal of Applied Probability, 41 (3), 291–301. https://doi.org/10.1239/jap/1091543426
- Azoury, K. S., 1985. Bayes solution to dynamic inventory models under unknown demand distribution. Management Science, 31 (9), 1150–1160. https://doi.org/10.1287/mnsc.31.9.1150
- Baar, T., Brucker, P., Knust, S., 1999. Tabu search algorithms and lower bounds for the resource-constrained project scheduling problem. In S. Voß, S. Martello, I. H. Osman., C. Roucairol (Eds.), Meta-heuristics: Advances and trends in local search paradigms for optimization (pp. 1–18). Springer US.
- Babich, V., Birge, J. R., et al., 2021. The interface of finance, operations, and risk management. Foundations and Trends® in Technology, Information and Operations Management, 15 (1–2), 1–203. https://doi.org/10.1561/0200000101
- Babich, V., Hilary, G., 2020. OM Forum—Distributed ledgers and operations: What operations management researchers should know about blockchain technology. Manufacturing & Service Operations Management, 22 (2), 223–240. https://doi.org/10.1287/msom.2018.0752
- Baboolal, K., Griffiths, J. D., Knight, V. A., Nelson, A. V., Voake, C., Williams, J. E., 2012. How efficient can an emergency unit be? A perfect world model. Emergency Medicine Journal, 29 (12), 972–977. https://doi.org/10.1136/emermed-2011-200101
- Baccelli, F., Cohen, G., Olsder, G. J., Quadrat, J.-P., 1992. Synchronization and linearity: An algebra for discrete event systems. John Wiley & Sons Ltd.
- Baccelli, F., Hasenfuss, S., Schmidt, V., 1997. Transient and stationary waiting times in (max,+)-linear systems with poisson input. Queueing Systems, 26 (3), 301–342. https://doi.org/10.1023/A:1019141510202
- Baccelli, F., Schlegel, S., Schmidt, V., 1999. Asymptotics of stochastic networks with subexponential service times. Queueing Systems, 33, 205–232. https://doi.org/10.1023/A:1019176129224
- Baccelli, F., Schmidt, V., 1996. Taylor series expansions for poisson-driven (max,+)-linear systems. The Annals of Applied Probability, 6 (1), 138–185.
- Bacciotti, A., Rosier, L., 2005. Liapunov functions and stability in control theory. Springer Science & Business Media.
- Başar, T., Haurie, A., Zaccour, G., 2018. Nonzero-sum differential games. In T. Başar & G. Zaccour (Eds.), Handbook of dynamic game theory (pp. 61–110). Springer.
- Başar, T., Olsder, G., 1999. Dynamic noncooperative game theory (2nd ed.). SIAM.
- Bailey, N. T. J., 1952. A study of queues and appointment systems in hospital out-patient departments, with special reference to waiting-times. Journal of the Royal Statistical Society, 14 (2), 185–199. https://doi.org/10.1111/j.2517-6161.1952.tb00112.x
- Baker, R. D., McHale, I. G., 2015. Deterministic evolution of strength in multiple comparisons models: Who is the greatest golfer? Scandinavian Journal of Statistics, Theory and Applications, 42 (1), 180–196. https://doi.org/10.1111/sjos.12101
- Bakir, I., Erera, A., Savelsbergh, M., 2021. Motor carrier service network design. In T. G. Crainic, M. Gendreau, B. Gendron, B. (Eds.), Network design with applications to transportation and logistics (pp. 427–467). Springer.
- Bakshi, N., Pinker, E., 2018. Public warnings in counterterrorism operations: Managing the “Cry-Wolf” effect when facing a strategic adversary. Operations Research, 66 (4), 977–993. https://doi.org/10.1287/opre.2018.1721
- Balakrishnan, A., Altinkemer, K., 1992. Using a hop-constrained model to generate alternative communication network design. ORSA Journal on Computing, 4 (2), 192–205. https://doi.org/10.1287/ijoc.4.2.192
- Balas, E., 1965. An additive algorithm for solving linear programs with zero-one variables. Operations Research, 13, 517–546. https://doi.org/10.1287/opre.13.4.517
- Balas, E., 1971. Intersection cuts—A new type of cutting planes for integer programming. Operations Research, 19, 19–39. https://doi.org/10.1287/opre.19.1.19
- Balas, E., 1975. Facets of the knapsack polytope. Mathematical Programming, 8, 146–164. https://doi.org/10.1007/BF01580440
- Balas, E., 1979. Disjunctive programming. Annals of Discrete Mathematics, 5, 3–51.
- Balas, E., Ceria, S., Cornuéjols, G., 1993. A lift-and-project cutting plane algorithm for mixed 0–1 programs. Mathematical Programming, 58, 295–324. https://doi.org/10.1007/BF01581273
- Balas, E., Ceria, S., Cornuéjols, G., 1996a. Mixed 0-1 programming by lift-and-project in a branch-and-cut framework. Management Science, 42, 1229–1246. https://doi.org/10.1287/mnsc.42.9.1229
- Balas, E., Ceria, S., Cornuéjols, G., Natraj, N., 1996b. Gomory cuts revisited. Operations Research Letters, 19, 1–9. https://doi.org/10.1016/0167-6377(96)00007-7
- Balas, E., Martin, C., 1980. Pivot and complement—A heuristic for 0-1 programming. Management Science, 26, 86–96. https://doi.org/10.1287/mnsc.26.1.86
- Balcik, B., Beamon, B. M., 2008. Facility location in humanitarian relief. International Journal of Logistics, 11 (2), 101–121. https://doi.org/10.1080/13675560701561789
- Baldacci, R., Hadjiconstantinou, E., Mingozzi, A., 2004. An exact algorithm for the capacitated vehicle routing problem based on a two-commodity network flow formulation. Operations Research, 52 (5), 723–738. https://doi.org/10.1287/opre.1040.0111
- Baldacci, R., Mingozzi, A., Roberti, R., 2011. New route relaxation and pricing strategies for the vehicle routing problem. Operations Research, 59 (5), 1269–1283. https://doi.org/10.1287/opre.1110.0975
- Ballestín, F., 2007a. A genetic algorithm for the resource renting problem with minimum and maximum time lags. In C. Cotta & J. Hemert (Eds.), Evolutionary computation in combinatorial optimization (pp. 25–35). Springer.
- Ballestín, F., 2007b. When it is worthwhile to work with the stochastic RCPSP? Journal of Scheduling, 10 (3), 153–166. https://doi.org/10.1007/s10951-007-0012-1
- Ballestín, F., Leus, R., 2009. Resource-constrained project scheduling for timely project completion with stochastic activity durations. Production and Operations Management, 18 (4), 459–474. https://doi.org/10.1111/j.1937-5956.2009.01023.x
- Balon, S., Skivée, F., Leduc, G., 2006. How well do traffic engineering objective functions meet TE requirements? In Proceedings of IFIP Networking 2006 (Vol. 3976, pp. 75–86). Springer LNCS.
- Bandi, C., Bertsimas, D., 2014. Robust option pricing. European Journal of Operational Research, 239 (3), 842–853. https://doi.org/10.1016/j.ejor.2014.06.002
- Bandi, C., Gupta, D., 2020. Operating room staffing and scheduling. Manufacturing & Service Operations Management, 22 (5), 958–974. https://doi.org/10.1287/msom.2019.0781
- Banerjee, D., Erera, A. L., Toriello, A., 2022. Fleet sizing and service region partitioning for same-day delivery systems. Transportation Science, 56 (5), 1327–1347. https://doi.org/10.1287/trsc.2022.1125
- Banker, R. D., Charnes, A., Cooper, W. W., 1984. Some models for estimating technical and scale inefficiencies in data envelopment analysis. Management Science, 30 (9), 1078–1092. https://doi.org/10.1287/mnsc.30.9.1078
- Banker, R. D., Morey, R. C., 1986. Efficiency analysis for exogenously fixed inputs and outputs. Operations Research, 34 (4), 513–521. https://doi.org/10.1287/opre.34.4.513
- Banks, D., Gallego, V., Naveiro, R., Ríos Insua, D., 2022. Adversarial risk analysis: An overview. Wiley Interdisciplinary Reviews: Computational Statistics, 14, 1530.
- Banks, J., Carson, J., Nelson, B. L., Nicol, D., 2004. Discrete-event system simulation (4th ed.) .Prentice Hall.
- Barbosa-Póvoa, A. P., da Silva, C., Carvalho, A., 2018. Opportunities and challenges in sustainable supply chain: An operations research perspective. European Journal of Operational Research, 268 (2), 399–431. https://doi.org/10.1016/j.ejor.2017.10.036
- Bardossy, M., Raghavan, S., 2010. Dual-based local search for the connected facility location and related problems. INFORMS Journal on Computing, 22, 584–602. https://doi.org/10.1287/ijoc.1090.0375
- Barnhart, C., Farahat, A., Lohatepanont, M., 2009. Airline fleet assignment with enhanced revenue modeling. Operations Research, 57 (1), 231–244. https://doi.org/10.1287/opre.1070.0503
- Barnhart, C., Fearing, D., Vaze, V., 2014. Modeling passenger travel and delays in the national air transportation system. Operations Research, 62 (3), 580–601. https://doi.org/10.1287/opre.2014.1268
- Barnhart, C., Kniker, T. S., Lohatepanont, M., 2002. Itinerary-based airline fleet assignment. Transportation Science, 36 (2), 199–217. https://doi.org/10.1287/trsc.36.2.199.566
- Barnhart, C., Schneur, R. R., 1996. Air network design for express shipment service. Operations Research, 44 (6), 852–863. https://doi.org/10.1287/opre.44.6.852
- Barocas, S., Hardt, M., Narayanan, A., 2019. Fairness and machine learning: Limitations and opportunities. fairmlbook.org, http://www.fairmlbook.org.
- Barrena, E., Canca, D., Coelho, L. C., Laporte, G., 2014a. Exact formulations and algorithm for the train timetabling problem with dynamic demand. Computers & Operations Research, 44, 66–74. https://doi.org/10.1016/j.cor.2013.11.003
- Barrena, E., Canca, D., Coelho, L. C., Laporte, G., 2014b. Single-line rail rapid transit timetabling under dynamic passenger demand. Transportation Research Part B: Methodological, 70, 134–150. https://doi.org/10.1016/j.trb.2014.08.013
- Baryannis, G., Validi, S., Dani, S., Antoniou, G., 2019. Supply chain risk management and artificial intelligence: State of the art and future research directions. International Journal of Production Research, 57 (7), 2179–2202. https://doi.org/10.1080/00207543.2018.1530476
- Baskett, F., Chandy, K. M., Muntz, R. R., Palacios, F. G., 1975. Open, closed, and mixed networks of queues with different classes of customers. Journal of the ACM, 22 (2), 248–260. https://doi.org/10.1145/321879.321887
- Basole, R., Bendoly, E., Chandrasekaran, A., Linderman, K., 2022. Visualization in operations management research. INFORMS Journal on Data Science, 1 (2), 172–187. https://doi.org/10.1287/ijds.2021.0005
- Bates, J. M., Granger, C. W., 1969. The combination of forecasts. Journal of the Operational Research Society, 20 (4), 451–468. https://doi.org/10.2307/3008764
- Bates, T., Cobo, C., Mariño, O., Wheeler, S., 2020. Can artificial intelligence transform higher education? International Journal of Educational Technology in Higher Education, 17 (1), 1–12. https://doi.org/10.1186/s41239-020-00218-x
- Baxter, A. E., Wilborn Lagerman, H. E., Keskinocak, P., 2020. Quantitative modeling in disaster management: A literature review. IBM Journal of Research and Development, 64 (1/2), 3:1–3:13. https://doi.org/10.1147/JRD.2019.2960356
- Bayram, V., Yaman, H., 2018. Shelter location and evacuation route assignment under uncertainty: A Benders decomposition approach. Transportation Science, 52 (2), 416–436. https://doi.org/10.1287/trsc.2017.0762
- Bazaraa, M. S., Sherali, H. D., Shetty, C. M., 2005. Nonlinear programming – Theory and algorithms (3rd ed.). Wiley.
- Beamon, B. M., 1999. Designing the green supply chain. Logistics Information Management, 12 (6), 332–342. https://doi.org/10.1108/09576059910284159
- Beasley, J. E., 1990. OR-Library: Distributing test problems by electronic mail. Journal of the Operational Research Society, 41 (11), 1069–1072. https://doi.org/10.2307/2582903
- Beer, S., 1966. Decision and control. Wiley.
- Beer, S., 1981. Brain of the firm (2nd ed.). Wiley.
- Beham, A., 2020. SimSharp. https://github.com/heal-research/SimSharp
- Behl, A., Dutta, P., 2019. Humanitarian supply chain management: A thematic literature review and future directions of research. Annals of Operations Research, 283 (1), 1001–1044. https://doi.org/10.1007/s10479-018-2806-2
- Bell, D., Raiffa, H., Tversky, A., 1988. Descriptive, normative, and prescriptive interactions in decision making. Cambridge University Press.
- Bell, E., Davison, J., 2013. Visual management studies: Empirical and theoretical approaches. International Journal of Management Reviews, 15 (2), 167–184. https://doi.org/10.1111/j.1468-2370.2012.00342.x
- Bell, P. C., O’Keefe, R. M., 1995. An experimental investigation into the efficacy of visual interactive simulation. Management Science, 41 (6), 1018–1038. https://doi.org/10.1287/mnsc.41.6.1018
- Bell, S., 2012. DPSIR = A problem structuring method? An exploration from the “Imagine” approach. European Journal of Operational Research, 222 (2), 350–360. https://doi.org/10.1016/j.ejor.2012.04.029
- Bell, W. J., Dalberto, L. M., Fisher, M. L., Greenfield, A. J., Jaikumar, R., Kedia, P., Mack, R. G., Prutzman, P. J., 1983. Improving the distribution of industrial gases with an on-line computerized routing and scheduling optimizer. Interfaces, 13 (6), 4–23. https://doi.org/10.1287/inte.13.6.4
- Bellenguez, O., Brauner, N., Tsoukiàs, A., 2023. Is there an ethical operational research practice? and what this implies for our research? EURO Journal on Decision Processes, 11, 100029. https://doi.org/10.1016/j.ejdp.2023.100029
- Bellman, R., 1953. An introduction to the theory of dynamic programming. Tech. rep., RAND Corp Santa Monica CA.
- Bellman, R., 1957. Dynamic programming. Princeton University Press.
- Bellmore, M., Nemhauser, G. L., 1968. The traveling salesman problem: A survey. Operations Research, 16 (3), 538–558. https://doi.org/10.1287/opre.16.3.538
- Belobaba, P., Odoni, A., Barnhart, C., 2015. The global airline industry (2nd ed.). John Wiley & Sons.
- Belobaba, P. P., 1987a. Air travel demand and airline seat inventory management [Thesis]. Massachusetts Institute of Technology.
- Belobaba, P. P., 1987b. Survey paper—airline yield management an overview of seat inventory control. Transportation Science, 21 (2), 63–73. https://doi.org/10.1287/trsc.21.2.63
- Belotti, P., Berthold, T., Bonami, P., Cafieri, S., Margot, F., Megaw, C., Vigerske, S., Wächter, A., 2009. Couenne. https://projects.coin-or.org/Couenne
- Belton, V., Stewart, T., 2002. Multiple criteria decision analysis: An integrated approach. Springer-Verlag.
- Ben-Ameur, H., Breton, M., Karoui, L., L’Ecuyer, P., 2007. A dynamic programming approach for pricing options embedded in bonds. Journal of Economic Dynamics and Control, 31 (7), 2212–2233. https://doi.org/10.1016/j.jedc.2006.06.007
- Ben-Ameur, H., Breton, M., L’Ecuyer, P., 2002. A dynamic programming procedure for pricing American-style Asian options. Management Science, 48 (5), 625–643. https://doi.org/10.1287/mnsc.48.5.625.7803
- Ben-Tal, A., El Ghaoui, L., Nemirovski, A., 2009. Robust optimization. Princeton University Press.
- Ben-Tal, A., Golany, B., Nemirovski, A., Vial, J.-P., 2005. Retailer-supplier flexible commitments contracts: A robust optimization approach. Manufacturing & Service Operations Management, 7 (3), 248–271. https://doi.org/10.1287/msom.1050.0081
- Ben-Tal, A., Nemirovski, A., 2002. Robust optimization – Methodology and applications. Mathematical Programming, 92 (3), 453–480. https://doi.org/10.1007/s101070100286
- Benders, J. F., 1962. Partitioning procedures for solving mixed-variables programming problems. Numerische Mathematik, 4 (1), 238–252. https://doi.org/10.1007/BF01386316
- Benders, J. F., 2005. Partitioning procedures for solving mixed-variables programming problems. Computational Management Science, 2 (1), 3–19. https://doi.org/10.1007/s10287-004-0020-y
- Bendoly, E., Clark, S., 2016. Visual analytics for management: Translational science and applications in practice. Routledge.
- Bengio, Y., Lodi, A., Prouvost, A., 2021. Machine learning for combinatorial optimization: A methodological tour d’horizon. European Journal of Operational Research, 290 (2), 405–421. https://doi.org/10.1016/j.ejor.2020.07.063
- Bennell, J. A., Cabo, M., Martínez-Sykora, A., 2018. A beam search approach to solve the convex irregular bin packing problem with guillotine cuts. European Journal of Operational Research, 270 (1), 89–102. https://doi.org/10.1016/j.ejor.2018.03.029
- Bennell, J. A., Oliveira, J. F., 2008. The geometry of nesting problems: A tutorial. European Journal of Operational Research, 184 (2), 397–415. https://doi.org/10.1016/j.ejor.2006.11.038
- Bennell, J. A., Oliveira, J. F., 2009. A tutorial in irregular shape packing problems. Journal of the Operational Research Society, 60 (1), S93–S105. https://doi.org/10.1057/jors.2008.169
- Bennis, W. G., Nanus, B., 1985. Leaders: Strategies for taking charge. Harper & Row.
- Benson, H., Sağlam, Ü., 2013. Mixed-integer second-order cone programming: A survey. In H. Topaloglu (Ed.), Theory driven by influential applications (pp. 13–36). INFORMS.
- Bergmeir, C., Benítez, J. M., 2012. On the use of cross-validation for time series predictor evaluation. Information Sciences, 191, 192–213. https://doi.org/10.1016/j.ins.2011.12.028
- Berkey, J. O., Wang, P. Y., 1987. Two-dimensional finite bin-packing algorithms. Journal of the Operational Research Society, 38 (5), 423–429. https://doi.org/10.2307/2582731
- Bernhard, P., 2005. The robust control approach to option pricing and interval models: An overview. In M. Breton & H. Ben-Ameur (Eds.), Numerical methods in finance (pp. 91–108). Springer.
- Bertsekas, D., 2012a. Dynamic programming and optimal control (Vol. I). Athena Scientific.
- Bertsekas, D., 2012b. Dynamic programming and optimal control (Volume II: Approximate dynamic programming). Athena Scientific.
- Bertsekas, D., Tsitsiklis, J. N., 1996. Neuro-dynamic programming. Athena Scientific.
- Bertsekas, D. P., 2016. Nonlinear programming (3rd ed.). Athena Scientific.
- Bertsekas, D. P., Tsitsiklis, J. N., Wu, C., 1997. Rollout algorithms for combinatorial optimization. Journal of Heuristics, 3 (3), 245–262. https://doi.org/10.1023/A:1009635226865
- Bertsimas, D., Brown, D. B., Caramanis, C., 2011a. Theory and applications of robust optimization. SIAM Review, 53 (3), 464–501. https://doi.org/10.1137/080734510
- Bertsimas, D., De Boer, S., 2005. Simulation-based booking limits for airline revenue management. Operations Research, 53 (1), 90–106. https://doi.org/10.1287/opre.1040.0164
- Bertsimas, D., Lo, A. W., 1998. Optimal control of execution costs. Journal of Financial Markets, 1 (1), 1–50. https://doi.org/10.1016/S1386-4181(97)00012-8
- Bertsimas, D., Lulli, G., Odoni, A., 2011b. An integer optimization approach to large-scale air traffic flow management. Operations Research, 59 (1), 211–227. https://doi.org/10.1287/opre.1100.0899
- Bertsimas, D., Mourtzinou, G., 1997. Transient laws of non-stationary queueing systems and their applications. Queueing Systems, 25 (1), 115–155.
- Bertsimas, D., Nakazato, D., 1995. The distributional Little’s law and its applications. Operations Research, 43 (2), 298–310. https://doi.org/10.1287/opre.43.2.298
- Bertsimas, D., Patterson, S. S., 1998. The air traffic flow management problem with enroute capacities. Operations Research, 46 (3), 406–422. https://doi.org/10.1287/opre.46.3.406
- Berwick, D. M., 2005. The John Eisenberg lecture: Health services research as a citizen in improvement. Health Services Research, 40 (2), 317–336. https://doi.org/10.1111/j.1475-6773.2005.0n359.x
- Besiou, M., Pedraza-Martinez, A. J., Van Wassenhove, L. N., 2018. OR applied to humanitarian operations. European Journal of Operational Research, 269 (2), 397–405. https://doi.org/10.1016/j.ejor.2018.02.046
- Besiou, M., Van Wassenhove, L. N., 2021. System dynamics for humanitarian operations revisited. Journal of Humanitarian Logistics and Supply Chain Management, 11 (4), 599–608. https://doi.org/10.1108/JHLSCM-06-2021-0048
- Bestuzheva, K., Besançon, M., Chen, W.-K., Chmiela, A., Donkiewicz, T., van Doornmalen, J., Eifler, L., Gaul, O., Gamrath, G., Gleixner, A., Gottwald, L., Graczyk, C., Halbig, K., Hoen, A., Hojny, C., van der Hulst, R., Koch, T., Lübbecke, M., Maher, S. J., Matter, F., Mühmer, E., Müller, B., Pfetsch, M. E., Rehfeldt, D., Schlein, S., Schlösser, F., Serrano, F., Shinano, Y., Sofranac, B., Turner, M., Vigerske, S., Wegscheider, F., Wellner, P., Weninger, D., Witzig, J., 2021. The SCIP Optimization Suite 8.0. https://www.scipopt.org/
- Böðvarsdóttir, E. B., Smet, P., Vanden Berghe, G., Stidsen, T. J., 2021. Achieving compromise solutions in nurse rostering by using automatically estimated acceptance thresholds. European Journal of Operational Research, 292 (3), 980–995. https://doi.org/10.1016/j.ejor.2020.11.017
- Better, M., Glover, F., 2011. Simulation optimization in risk management. In J. J. Cochran, L. A. Cox Jr., P. Keskinocak, J. P. Kharoufeh, J. C. Smith (Eds.), Wiley encyclopedia of operations research and management science (pp. 1–9). John Wiley & Sons.
- Beullens, P., Van Oudheusden, D., Van Wassenhove, L. N., 2004. Collection and vehicle routing issues in reverse logistics. In R. Dekker, M. Fleischmann, K. Inderfurth, L. N. Van Wassenhove (Eds.), Reverse logistics: Quantitative models for closed-loop supply chains (pp. 95–134). Springer.
- Bezanson, J., Edelman, A., Karpinski, S., Shah., V. B., 2017. Julia: A fresh approach to numerical computing. SIAM Review, 59, 65–98. https://doi.org/10.1137/141000671
- Bhatia, R., Hao, F., Kodialam, M., Lakshman, T., 2015. Optimized network traffic engineering using segment routing. In 2015 IEEE Conference on Computer Communications (INFOCOM) (pp. 657–665).
- Bi, X., Zhang, Q., Fan, K., Tang, S., Guan, H., Gao, X., Cui, Y., Ma, Y., Wu, Q., Hao, Y., Ning, N., Liu, C., 2021. Risk culture and COVID-19 protective behaviors: A cross-sectional survey of residents in china. Frontiers in Public Health, 9, 686705. https://doi.org/10.3389/fpubh.2021.686705
- Bielecki, T. R., Cialenco, I., Pitera, M., 2017. A survey of time consistency of dynamic risk measures and dynamic performance measures in discrete time: LM-measure perspective. Probability Uncertainty and Quantitative Risk, 2 (3).
- Bijvank, M., Huh, W. T., Janakiraman, G., 2023. Lost-sales inventory systems. In J.-S. Song (Ed.) Research handbook on inventory management. Edward Elgar Publishing.
- Billionnet, A., 2013. Mathematical optimization ideas for biodiversity conservation. European Journal of Operational Research, 231 (3), 514–534. https://doi.org/10.1016/j.ejor.2013.03.025
- Bimpikis, K., Markakis, M. G., 2016. Inventory pooling under heavy-tailed demand. Management Science, 62 (6), 1800–1813. https://doi.org/10.1287/mnsc.2015.2204
- Binmore, K., Rubinstein, A., Wolinsky, A., 1986. The Nash bargaining solution in economic modeling. RAND Journal of Economics, 17, 176–188. https://doi.org/10.2307/2555382
- Birge, J. R., 1982. The value of the stochastic solution in stochastic linear programs with fixed recourse. Mathematical Programming, 24 (1), 314–325. https://doi.org/10.1007/BF01585113
- Birge, J. R., 1985. Decomposition and partitioning methods for multistage stochastic linear programs. Operations Research, 33 (5), 989–1007. https://doi.org/10.1287/opre.33.5.989
- Birge, J. R., Louveaux, F., 2011. Introduction to stochastic programming. Springer.
- Bischoff, J., Kaddoura, I., Maciejewski, M., Nagel, K., 2018. Simulation-based optimization of service areas for pooled ride-hailing operators. Procedia Computer Science, 130, 816–823. https://doi.org/10.1016/j.procs.2018.04.069
- Bixby, R., Boyd, E., Indovina, R., 1992. MIPLIB: A test set of mixed integer programming problems. SIAM News, 25, 16.
- Black, L. J., Andersen, D. F., 2012. Using visual representations as boundary objects to resolve conflict in collaborative model-building approaches. Systems Research and Behavioral Science, 29 (2), 194–208. https://doi.org/10.1002/sres.2106
- Blackwell, A. F., Phaal, R., Eppler, M., Crilly, N., 2008. Strategy roadmaps: New forms, new practices. In G. Stapleton, J. Howse, J. Lee (Eds.), Diagrammatic representation and inference (pp. 127–140). Springer.
- Blanchet, J., Chen, L., Zhou, X. Y., 2022. Distributionally robust mean-variance portfolio selection with wasserstein distances. Management Science, 68 (9), 6382–6410. https://doi.org/10.1287/mnsc.2021.4155
- Bland, R. G., 1977. New finite pivoting rules for the simplex method. Mathematics of Operations Research, 2 (2), 103–107. https://doi.org/10.1287/moor.2.2.103
- Bland, R. G., Goldfarb, D., Todd, M. J., 1981. Feature article—The ellipsoid method: A survey. Operations Research, 29 (6), 1039–1091. https://doi.org/10.1287/opre.29.6.1039
- Błażewicz, J., Ecker, K., Pesch, E., Schmidt, G., Weglarz, J., 2001. Scheduling computer and manufactoring processes. Springer.
- Błażewicz, J., Ecker, K., Pesch, E., Schmidt, G., Weglarz, J., 2007. Handbook on scheduling: From theory to applications. Springer.
- Bley, A., Fortz, B., Gourdin, E., Holmberg, K., Klopfenstein, O., Pióro, M., Tomaszewski, A., Ümit, H., 2009. Optimization of OSPF routing in IP networks. In A. Koster, X. Muñoz (Eds.), Graphs and algorithms in communication networks (pp. 199–240). Springer.
- Bloomfield, P., Cox, D., 1972. A low traffic approximation for queues. Journal of Applied Probability, 9 (4), 832–840. https://doi.org/10.2307/3212619
- Blum, C., Roli, A., 2003. Metaheuristics in combinatorial optimization: Overview and conceptual comparison. ACM Computing Surveys (CSUR), 35 (3), 268–308. https://doi.org/10.1145/937503.937505
- Blum, L., Cucker, F., Shub, M., Smale, S., 1998. Complexity and real computation. Springer.
- Blumenfeld, D. E., Burns, L. D., Diltz, J. D., Daganzo, C. F., 1985. Analyzing trade-offs between transportation, inventory and production costs on freight networks. Transportation Research Part B: Methodological, 19 (5), 361–380. https://doi.org/10.1016/0191-2615(85)90051-7
- Board, J., Sutcliffe, C., Ziemba, W. T., 2003. Applying operations research techniques to financial markets. Interfaces, 33 (2), 12–24. https://doi.org/10.1287/inte.33.2.12.14465
- Boginski, V., Pasiliao, E. L., Shen, S., 2015. Special issue on optimization in military applications. Optimization Letters, 9 (8), 1475–1476. https://doi.org/10.1007/s11590-015-0966-4
- Boland, N., Hewitt, M., Marshall, L., Savelsbergh, M., 2017. The continuous-time service network design problem. Operations Research, 65 (5), 1303–1321. https://doi.org/10.1287/opre.2017.1624
- Boland, N., Hewitt, M., Marshall, L., Savelsbergh, M., 2019. The price of discretizing time: A study in service network design. EURO Journal on Transportation and Logistics, 8 (2), 195–216. https://doi.org/10.1007/s13676-018-0119-x
- Bommasani, R., Hudson, D. A., Adeli, E., Altman, R., Arora, S., von Arx, S., Bernstein, M. S., Bohg, J., Bosselut, A., Brunskill, E., Brynjolfsson, E., Buch, S., Card, D., Castellon, R., Chatterji, N. S., Chen, A. S., Creel, K. A., Davis, J., Demszky, D., Donahue, C., Doumbouya, M., Durmus, E., Ermon, S., Etchemendy, J., Ethayarajh, K., Fei-Fei, L., Finn, C., Gale, T., Gillespie, L. E., Goel, K., Goodman, N. D., Grossman, S., Guha, N., Hashimoto, T., Henderson, P., Hewitt, J., Ho, D. E., Hong, J., Hsu, K., Huang, J., Icard, T. F., Jain, S., Jurafsky, D., Kalluri, P., Karamcheti, S., Keeling, G., Khani, F., Khattab, O., Koh, P. W., Krass, M. S., Krishna, R., Kuditipudi, R., Kumar, A., Ladhak, F., Lee, M., Lee, T., Leskovec, J., Levent, I., Li, X. L., Li, X., Ma, T., Malik, A., Manning, C. D., Mirchandani, S. P., Mitchell, E., Munyikwa, Z., Nair, S., Narayan, A., Narayanan, D., Newman, B., Nie, A., Niebles, J. C., Nilforoshan, H., Nyarko, J. F., Ogut, G., Orr, L., Papadimitriou, I., Park, J. S., Piech, C., Portelance, E., Potts, C., Raghunathan, A., Reich, R., Ren, H., Rong, F., Roohani, Y. H., Ruiz, C., Ryan, J., R’e, C., Sadigh, D., Sagawa, S., Santhanam, K., Shih, A., Srinivasan, K. P., Tamkin, A., Taori, R., Thomas, A. W., Tramèr, F., Wang, R. E., Wang, W., Wu, B., Wu, J., Wu, Y., Xie, S. M., Yasunaga, M., You, J., Zaharia, M. A., Zhang, M., Zhang, T., Zhang, X., Zhang, Y., Zheng, L., Zhou, K., Liang, P., 2021. On the opportunities and risks of foundation models . arXiv:2108.07258.
- Bonami, P., Biegler, L., Conn, A., Cornuéjols, G., Grossmann, I., Laird, C., Lee, J., Lodi, A., Margot, F., Sawaya, N., Waechter, A., 2005. An algorithmic framework for convex mixed integer nonlinear programs. https://projects.coin-or.org/Bonmin
- Bordignon, S., Bunn, D. W., Lisi, F., Nan, F., 2013. Combining day-ahead forecasts for British electricity prices. Energy Economics, 35, 88–103. https://doi.org/10.1016/j.eneco.2011.12.001
- Borůvka, O., 1926. O jistém problému minimálním (pp. 37–58). Práce Moravsk’e Přírodovědecké Společnosti.
- Bortfeldt, A., Wäscher, G., 2013. Constraints in container loading – A state-of-the-art review. European Journal of Operational Research, 229 (1), 1–20. https://doi.org/10.1016/j.ejor.2012.12.006
- Boschetti, M. A., Maniezzo, V., 2022. Matheuristics: Using mathematics for heuristic design. 4OR - A Quarterly Journal of Operations Research, 20 (2), 173–208. https://doi.org/10.1007/s10288-022-00510-8
- Bouleimen, K., Lecocq, H., 2003. A new efficient simulated annealing algorithm for the resource-constrained project scheduling problem and its multiple mode version. European Journal of Operational Research, 149 (2), 268–281. https://doi.org/10.1016/S0377-2217(02)00761-0
- Boute, R., Disney, S. M., Gijsbrechts, J., Mieghem, J. A. V., 2022. Dual sourcing and smoothing under non-stationary demand time series: Re-shoring with SpeedFactories. Management Science, 68, 1039–1057. https://doi.org/10.1287/mnsc.2020.3951
- Bowen, K. (Ed.), 1995. In at the deep end: MSc student projects in community operational research. Community Operational Research Unit Publications.
- Box, George, E. P., Jenkins, Gwilym, 1976. Time series analysis forecasting and control. Holden-Day.
- Boxma, O., Cohen, J., 2000. The single server queue: Heavy tails and heavy traffic. In K. Park & W. Willinger (Eds.), Self-similar network traffic and performance evaluation (pp. 143–169). Wiley Online Library.
- Boyd, A., Geerling, T., Gregory, W. J., Kagan, C., Midgley, G., Murray, P., Walsh, M. P., 2007. Systemic evaluation: A participative, multi-method approach. Journal of the Operational Research Society, 58 (10), 1306–1320. https://doi.org/10.1057/palgrave.jors.2602281
- Boykov, Y., Kolmogorov, V., 2004. An experimental comparison of min-cut/max-flow algorithms for energy minimization in vision. IEEE Transactions on Pattern Analysis and Machine Intelligence, 26 (9), 1124–1137. https://doi.org/10.1109/TPAMI.2004.60
- Boysen, N., Fliedner, M., Jaehn, F., Pesch, E., 2012. Shunting yard operations: Theoretical aspects and applications. European Journal of Operational Research, 220, 1–14. https://doi.org/10.1016/j.ejor.2012.01.043
- Brailsford, S., Schmidt, B., 2003. Towards incorporating human behaviour in models of health care systems: An approach using discrete event simulation. European Journal of Operational Research, 150 (1), 19–31. https://doi.org/10.1016/S0377-2217(02)00778-6
- Brailsford, S. C., Lattimer, V. A., Tarnaras, P., Turnbull, J. C., 2004. Emergency and on-demand health care: Modelling a large complex system. Journal of the Operational Research Society, 55 (1), 34–42. https://doi.org/10.1057/palgrave.jors.2601667
- Bramson, M., 1998. State space collapse with application to heavy traffic limits for multiclass queueing networks. Queueing Systems, 30 (1), 89–140.
- Branke, J., Corrente, S., Greco, S., Słowiński, R., Zielniewicz, P., 2016. Using Choquet integral as preference model in interactive evolutionary multiobjective optimization. European Journal of Operational Research, 250 (3), 884–901. https://doi.org/10.1016/j.ejor.2015.10.027
- Branke, J., Deb, K., Miettinen, K., Slowiński, R. (Eds.), 2008. Multiobjective optimization: Interactive and evolutionary approaches. Vol. 5252 of Lecture notes in computer science. Springer-Verlag.
- Brans, J.-P., Gallo, G., 2007. Ethics in OR/MS: Past, present and future. Annals of Operations Research, 153 (1), 165–178. https://doi.org/10.1007/s10479-007-0177-1
- Brax, S. A., Visintin, F., 2017. Meta-model of servitization: The integrative profiling approach. Industrial Marketing Management, 60, 17–32. https://doi.org/10.1016/j.indmarman.2016.04.014
- Breiman, L., 2001. Random forests. Machine Learning, 45 (1), 5–32. https://doi.org/10.1023/A:1010933404324
- Bresciani, S., Eppler, M. J., 2015. The pitfalls of visual representations: A review and classification of common errors made while designing and interpreting visualizations. SAGE Open, 5 (4), 2158244015611451. https://doi.org/10.1177/2158244015611451
- Bresciani, S., Eppler, M. J., 2018. The collaborative dimensions of argument maps: A socio-visual approach. Semiotica, 2018 (220), 199–216. https://doi.org/10.1515/sem-2015-0140
- Breton, M., 2018. Dynamic games in finance. In J.-C. Duan, W. K. Härdle, J. E. Gentle (Eds.), Handbook of dynamic game theory (pp. 827–863). Springer.
- Breton, M., Marzouk, O., 2018. Evaluation of counterparty risk for derivatives with early-exercise features. Journal of Economic Dynamics and Control, 88, 1–20. https://doi.org/10.1016/j.jedc.2018.01.014
- Brettel, M., Friederichsen, N., Keller, M., Rosenberg, M., 2014. How virtualization, decentralization and network building change the manufacturing landscape: An industry 4.0 perspective. International Journal of Mechanical, Industrial Science and Engineering, 8 (1), 37–44.
- Brezavšček, A., Bach, M. P., Baggia, A., 2017. Markov analysis of students’ performance and academic progress in higher education. Organizacija, 50 (2), 83–95. https://doi.org/10.1515/orga-2017-0006
- Briskorn, D., Drexl, A., Spieksma, F. C. R., 2010. Round robin tournaments and three index assignments. 4OR - A Quarterly Journal of Operations Research, 8 (4), 365–374. https://doi.org/10.1007/s10288-010-0123-y
- Broadie, M., 2012. Assessing golfer performance on the PGA TOUR. Interfaces, 42 (2), 146–165. https://doi.org/10.1287/inte.1120.0626
- Broadie, M., Chernov, M., Sundaresan, S., 2007. Optimal debt and equity values in the presence of Chapter 7 and Chapter 11. The Journal of Finance, 62 (3), 1341–1377. https://doi.org/10.1111/j.1540-6261.2007.01238.x
- Brooks-Pollock, E., Danon, L., Jombart, T., Pellis, L., 2021. Modelling that shaped the early COVID-19 pandemic response in the UK. Philosophical Transactions of the Royal Society of London. Series B, Biological Sciences, 376 (1829), 20210001. https://doi.org/10.1098/rstb.2021.0001
- Brotcorne, L., Laporte, G., Semet, F., 2003. Ambulance location and relocation models. European Journal of Operational Research, 147 (3), 451–463. https://doi.org/10.1016/S0377-2217(02)00364-8
- Brouer, B. D., Alvarez, J. F., Plum, C. E. M., Pisinger, D., Sigurd, M. M., 2014. A base integer programming model and benchmark suite for Liner-Shipping network design. Transportation Science, 48 (2), 281–312. https://doi.org/10.1287/trsc.2013.0471
- Brown, G., Carlyle, M., Diehl, D., Kline, J., Wood, K., 2005. A two-sided optimization for theater ballistic missile defense. Operations Research, 53 (5), 745–763. https://doi.org/10.1287/opre.1050.0231
- Brown, G. G., Dell, R. F., Newman, A. M., 2004. Optimizing military capital planning. Interfaces, 34 (6), 415–425. https://doi.org/10.1287/inte.1040.0107
- Brown, R. G., 1956. Exponential smoothing for predicting demand. Little.
- Browne, J., Dubois, D., Sethi, S., Rathmill, K., Stecke, K., 1984. Classification of flexible manufacturing systems. The FMS Magazine, 2 (2), 114–117.
- Brucker, P., Knust, S., Schoo, A., Thiele, O., 1998. A branch and bound algorithm for the resource-constrained project scheduling problem. European Journal of Operational Research, 107 (2), 272–288. https://doi.org/10.1016/S0377-2217(97)00335-4
- Brumelle, S. L., McGill, J. I., 1993. Airline seat allocation with multiple nested fare classes. Operations Research, 41 (1), 127–137. https://doi.org/10.1287/opre.41.1.127
- Brumelle, S. L., McGill, J. I., Oum, T. H., Sawaki, K., Tretheway, M., 1990. Allocation of airline seats between stochastically dependent demands. Transportation Science, 24 (3), 183–192. https://doi.org/10.1287/trsc.24.3.183
- Bryant, J. W., 1978. Modelling for natural resource utilization analysis. Journal of the Operational Research Society, 29 (7), 667–676. https://doi.org/10.2307/3009844
- Buhaug, H., 2002. Long waiting lists in hospitals. BMJ, 324 (7332), 252–253. https://doi.org/10.1136/bmj.324.7332.252
- Bulut, A., Xu, Y., Ralphs, T., Vigerske, S., 2019. Discrete conic optimization solver. https://projects.coin-or.org/Disco
- Buraimo, B., Forrest, D., McHale, I. G., Tena, J. D., 2020. Unscripted drama: Soccer audience response to suspense, surprise, and shock. Economic Inquiry, 58 (2), 881–896. https://doi.org/10.1111/ecin.12874
- Burdett, E. L., Kozan, E., 2009. Techniques for inserting additional trains into existing timetables. Transportation Research Part B: Methodological, 43 (8–9), 821–836. https://doi.org/10.1016/j.trb.2009.02.005
- Burger, K., White, L., Yearworth, M., 2019. Developing a smart operational research with hybrid practice theories. European Journal of Operational Research, 277 (3), 1137–1150. https://doi.org/10.1016/j.ejor.2019.03.027
- Burk, R. C., Parnell, G. S., 2011. Portfolio decision analysis: Lessons from military applications. In A. Salo, J. Keisler, A. Morton (Eds.), Portfolio decision analysis: Improved methods for resource allocation (pp. 333–357). Springer.
- Burkard, R., Dell’Amico, M., Martello, S., 2012. Assignment problems (revised reprint). SIAM.
- Burkard, R., Derigs, U., 1980. Assignment and matching problems: Solution methods with FORTRAN programs. Springer-Verlag.
- Burke, E. K., Bykov, Y., 2008. A late acceptance strategy in hill-climbing for exam timetabling problems. In Proceedings of the International Conference of the Practice and Theory of Automated Timetabling (PATAT 2008) (pp. 1–7).
- Burke, E. K., Curtois, T., 2014. New approaches to nurse rostering benchmark instances. European Journal of Operational Research, 237, 71–81. https://doi.org/10.1016/j.ejor.2014.01.039
- Burke, E. K., De Causmaecker, P., Vanden Berghe, G., Van Landeghem, H., 2004a. The state of the art of nurse rostering. Journal of Scheduling, 7 (6), 441–499. https://doi.org/10.1023/B:JOSH.0000046076.75950.0b
- Burke, E. K., Kendall, G., Whitwell, G., 2004b. A new placement heuristic for the orthogonal Stock-Cutting problem. Operations Research, 52 (4), 655–671. https://doi.org/10.1287/opre.1040.0109
- Burke, E. K., MacCarthy, B. L., Petrovic, S., Qu, R., 2006. Multiple-retrieval case-based reasoning for course timetabling problems. Journal of the Operational Research Society, 57 (2), 148–162. https://doi.org/10.1057/palgrave.jors.2601970
- Burke, E. K., Petrovic, S., 2002. Recent research directions in automated timetabling. European Journal of Operational Research, 140 (2), 266–280. https://doi.org/10.1016/S0377-2217(02)00069-3
- Burman, D. Y., Smith, D. R., 1983. A light-traffic theorem for multi-server queues. Mathematics of Operations Research, 8 (1), 15–25. https://doi.org/10.1287/moor.8.1.15
- Burney, N. A., Johnes, J., Al-Enezi, M., Al-Musallam, M., 2013. The efficiency of public schools: The case of Kuwait. Education Economics, 21 (4), 360–379. https://doi.org/10.1080/09645292.2011.595580
- Büsing, C., Kadatz, D., Cleophas, C., 2019. Capacity uncertainty in airline revenue management: Models, algorithms, and computations. Transportation Science, 53 (2), 383–400. https://doi.org/10.1287/trsc.2018.0829
- Bussieck, M. R., Lindner, T., Lubbecke, M. E., 2004. A fast algorithm for near cost optimal line plans. Mathematical Methods of Operations Research, 59, 205–220. https://doi.org/10.1007/s001860300332
- Bussieck, M. R., Winter, T., Zimmerman, U. T., 1997. Discrete optimization in public rail trainsport. Mathematical Programming, 79, 415–444. https://doi.org/10.1007/BF02614327
- Butcher, B., Huang, V. S., Robinson, C., Reffin, J., Sgaier, S. K., Charles, G., Quadrianto, N., 2021. Causal datasheet for datasets: An evaluation guide for Real-World data analysis and data collection design using bayesian networks. Frontiers in Artificial Intelligence, 4, 612551. https://doi.org/10.3389/frai.2021.612551
- Büyüktahtakın, İ. E., Haight, R. G., 2018. A review of operations research models in invasive species management: State of the art, challenges, and future directions. Annals of Operations Research, 271 (2), 357–403. https://doi.org/10.1007/s10479-017-2670-5
- Bykov, Y., Petrovic, S., 2016. A step counting hill climbing algorithm applied to university examination timetabling. Journal of Scheduling, 19, 479–492. https://doi.org/10.1007/s10951-016-0469-x
- Büyüktahtakin, I. E., Feng, Z., Szidarovszky, F., 2014. A multi-objective optimization approach for invasive species control. Journal of the Operational Research Society, 65 (11), 1625–1635. https://doi.org/10.1057/jors.2013.104
- Bynum, M. L., Hackebeil, G. A., Hart, W. E., Laird, C. D., Nicholson, B. L., Siirola, J. D., Watson, J.-P., Woodruff, D. L., 2021. Pyomo–optimization modeling in Python (3rd ed., Vol. 67). Springer Science & Business Media. http://www.pyomo.org/
- Cabrera, D., Cabrera, L., Midgley, G., 2023. The four waves of systems thinking. In D. Cabrera, L. Cabrera, G. Midgley (Eds.), Routledge handbook of systems thinking. Routledge.
- Cabrera, D., Cabrera, L., Powers, E., 2015. A unifying theory of systems thinking with psychosocial applications. Systems Research and Behavioral Science, 32 (5), 534–545. https://doi.org/10.1002/sres.2351
- Cacchiani, V., Caprara, A., Galli, L., Kroon, L., Maróti, G., 2008a. Recoverable robustness for railway rolling stock planning. In M. Fischetti & P. Widmayer, P. (Eds.), 8th Workshop on Algorithmic Approaches for Transportation Modeling, Optimization, and Systems (ATMOS’08). Vol. 9 of OpenAccess Series in Informatics (OASIcs) (pp. 9–10). Schloss Dagstuhl–Leibniz-Zentrum fuer Informatik.
- Cacchiani, V., Caprara, A., Galli, L., Kroon, L., Maróti, G., Toth, P., 2012. Railway rolling stock planning: Robustness against large disruptions. Transportation Science, 46 (2), 217–232. https://doi.org/10.1287/trsc.1110.0388
- Cacchiani, V., Caprara, A., Toth, P., 2008b. A column generation approach to train timetabling on a corridor. 4OR - A Quarterly Journal of Operations Research, 6 (2), 125–142. https://doi.org/10.1007/s10288-007-0037-5
- Cacchiani, V., Caprara, A., Toth, P., 2010. Scheduling extra freight trains on railway networks. Transportation Research Part B: Methodological, 44 (2), 215–231. https://doi.org/10.1016/j.trb.2009.07.007
- Cacchiani, V., Iori, M., Locatelli, A., Martello, S., 2022a. Knapsack problems – An overview of recent advances. Part I: Single knapsack problems. Computers & Operations Research, 143, 105692. https://doi.org/10.1016/j.cor.2021.105692
- Cacchiani, V., Iori, M., Locatelli, A., Martello, S., 2022b. Knapsack problems – An overview of recent advances. Part II: Multiple, multidimensional, and quadratic knapsack problems. Computers & Operations Research, 143, 105693. https://doi.org/10.1016/j.cor.2021.105693
- Cachon, G. P., Lariviere, M. A., 2005. Supply chain coordination with revenue-sharing contracts: Strengths and limitations. Management Science, 51 (1), 30–44. https://doi.org/10.1287/mnsc.1040.0215
- Cadarso, L., Vaze, V., 2022. Passenger-centric integrated airline schedule and aircraft recovery. Transportation Science, 56 (6), 1410–1431. https://doi.org/10.1287/trsc.2022.1141
- Cadarso, L., Vaze, V., Barnhart, C., Marín, Á., 2017. Integrated airline scheduling: Considering competition effects and the entry of the high speed rail. Transportation Science, 51 (1), 132–154. https://doi.org/10.1287/trsc.2015.0617
- Çalık, H., Labbé, M., Yaman, H., 2019. p-center problems. In G. Laporte, S. Nickel, F. Saldanha da Gama (Eds.), Location science (pp. 51–65). Springer.
- Callon, M., 1981. Struggles and negotiations to define what is problematic and what is not. In K. D. Knorr, R. Krohn, R. Whitley (Eds.), The social process of scientific investigation (pp. 197–219). Springer Netherlands.
- Calmon, A. P., Graves, S. C., 2017. Inventory management in a consumer electronics closed-loop supply chain. Manufacturing & Service Operations Management, 19 (4), 568–585. https://doi.org/10.1287/msom.2017.0622
- Calmon, A. P., Graves, S. C., Lemmens, S., 2021. Warranty matching in a consumer electronics Closed-Loop supply chain. Manufacturing & Service Operations Management, 23 (5), 1314–1331. https://doi.org/10.1287/msom.2020.0889
- Camacho, E. F., Bordons, C., 2013. Model predictive control. Springer.
- Campbell, A. M., Savelsbergh, M., 2006. Incentive schemes for attended home delivery services. Transportation Science, 40 (3), 327–341. https://doi.org/10.1287/trsc.1050.0136
- Campbell, A. M., Savelsbergh, M. W., 2005. Decision support for consumer direct grocery initiatives. Transportation Science, 39 (3), 313–327. https://doi.org/10.1287/trsc.1040.0105
- Campbell, B. M., Sayer, J. A., 2003. Integrated natural resources management: Linking productivity, the environment and development. CABI Publishing.
- Canca, D., Andrade-Pineda, J. L., De-los Santos, A., Calle, M., 2018. The railway rapid transit frequency setting problem with speed-dependent operation costs. Transportation Research Part B: Methodological, 117 (A), 494–519. https://doi.org/10.1016/j.trb.2018.09.013
- Canca, D., Barrena, E., Algaba, E., Zarzo, A., 2014. Design and analysis of demand-adapted railway timetables. Journal of Advanced Transportation, 48 (2), 119–137. https://doi.org/10.1002/atr.1261
- Canca, D., Barrena, E., De-Los-Santos, A., Andrade-Pineda, J. L., 2016. Setting lines frequency and capacity in dense railway rapid transit networks with simultaneous passenger assignment. Transportation Research Part B: Methodological, 93(A), 251–267. https://doi.org/10.1016/j.trb.2016.07.020
- Canca, D., De-Los-Santos, A., Laporte, G., Mesa, J. A., 2017. An adaptive neighborhood search metaheuristic for the integrated railway rapid transit network design and line planning problem. Computers & Operations Research, 78, 1–14. https://doi.org/10.1016/j.cor.2016.08.008
- Canca, D., De-Los-Santos, A., Laporte, G., Mesa, J. A., 2019. Integrated railway rapid transit network design and line-planning problem with maximum profit. Transportation Research Part E: Logistics and Transportation Review, 127, 1–30. https://doi.org/10.1016/j.tre.2019.04.007
- Canca, D., Zarzo, A., 2017. Design of energy-efficient timetables in two-way railway rapid transit lines. Transportation Research Part B: Methodological, 102, 142–161. https://doi.org/10.1016/j.trb.2017.05.012
- Cao, A., Lan, J., Xie, X., Chen, H., Zhang, X., Zhang, H., Wu, Y., 2022. Team-builder: Toward more effective lineup selection in soccer. IEEE Transactions on Visualization and Computer Graphics. https://doi.org/10.1109/TVCG.2022.3207147
- Cappart, Q., Chételat, D., Khalil, E. B., Lodi, A., Morris, C., Veličković, P., 2021. Combinatorial optimization and reasoning with graph neural networks. In Z.-H. Zhou (Ed.), Proceedings of the Thirtieth International Joint Conference on Artificial Intelligence, IJCAI-21 . International Joint Conferences on Artificial Intelligence Organization (pp. 4348–4355). survey Track.
- Caprara, A., Carvalho, M., Lodi, A., Woeginger, G. J., 2014. A study on the computational complexity of the bilevel knapsack problem. SIAM Journal on Optimization, 24 (2), 823–838. https://doi.org/10.1137/130906593
- Caprara, A., Fischetti, M., Toth, P., 2002. Modeling and solving the train timetabling problem. Operations Research, 50 (5), 851–861. https://doi.org/10.1287/opre.50.5.851.362
- Caprara, A., Kroon, L., Monaci, M., Peeters, M., Toth, P., 2007. Passenger railway optimization. In C. Barnhart & G. Laporte (Eds.), Handbooks in operations research and management science (Vol. 14). Transportation (pp. 129–187). Elsevier.
- Caprara, A., Monaci, M., Toth, P., 2003. Models and algorithms for a staff scheduling problem. Mathematical Programming, 98 (1), 445–476. https://doi.org/10.1007/s10107-003-0413-7
- Caprara, A., Toth, P., Vigo, D., Fischetti, M., 1998. Modeling and solving the crew rostering problem. Operations Research, 46 (6), 820–830. https://doi.org/10.1287/opre.46.6.820
- Cardaliaguet, P., Lehalle, C.-A., 2018. Mean field game of controls and an application to trade crowding. Mathematics and Financial Economics, 12 (3), 335–363. https://doi.org/10.1007/s11579-017-0206-z
- Cardoen, B., Demeulemeester, E., Beliën, J., 2010. Operating room planning and scheduling: A literature review. European Journal of Operational Research, 201 (3), 921–932. https://doi.org/10.1016/j.ejor.2009.04.011
- Caro, F., Gallien, J., 2012. Clearance pricing optimization for a fast-fashion retailer. Operations Research, 60 (6), 1404–1422. https://doi.org/10.1287/opre.1120.1102
- Carraro, C., Haurie, A., 1996. Operations research and environmental management. Kluwer Academic.
- Carter, M. W., Laporte, G., Lee, S. Y., 1996. Examination timetabling: Algorithmic strategies and applications. Journal of the Operational Research Society, 74, 373–383. https://doi.org/10.2307/3010580
- Cassady, R., 1967. Auctions and auctioneering. University of California Press.
- Castelnovo, A., Crupi, R., Greco, G., Regoli, D., Penco, I. G., Cosentini, A. C., 2022. A clarification of the nuances in the fairness metrics landscape. Scientific Reports, 12, article 4209. https://doi.org/10.1038/s41598-022-07939-1
- Castillo-Salazar, A. J., Landa-Silva, D., Qu, R., 2016. Workforce scheduling and routing problems: Literature survey and computational study. Annals of Operations Research, 239, 39–67. https://doi.org/10.1007/s10479-014-1687-2
- Cataldo, A., Ferrer, J.-C., Miranda, J., Rey, P. A., Sauré, A., 2017. An integer programming approach to curriculum-based examination timetabling. Annals of Operations Research, 258 (2), 369–393. https://doi.org/10.1007/s10479-016-2321-2
- Caulkins, J. P., Eelman, E., Ratnatunga, M., Schaarsmith, D., 2008. Operations research and public policy for Africa: Harnessing the revolution in management science instruction. International Transactions in Operational Research, 15, 151–171. https://doi.org/10.1111/j.1475-3995.2008.00628.x
- Cavaliere, F., Bendotti, E., Fischetti, M., 2022. An integrated local-search/set-partitioning refinement heuristic for the capacitated vehicle routing problem. Mathematical Programming Computation, 14, 749–779. https://doi.org/10.1007/s12532-022-00224-2
- Cavallo, B., Ishizaka, A., Olivieri, M. G., Squillante, M., 2019. Comparing inconsistency of pairwise comparison matrices depending on entries. Journal of the Operational Research Society, 70 (5), 842–850. https://doi.org/10.1080/01605682.2018.1464427
- Ceder, A., Wilson, N. H., 1986. Bus network design. Transportation Research Part B: Methodological, 20 (4), 331–344. https://doi.org/10.1016/0191-2615(86)90047-0
- Cegan, J. C., Filion, A. M., Keisler, J. M., Linkov, I., 2017. Trends and applications of multi-criteria decision analysis in environmental sciences: Literature review. Environment Systems and Decisions, 37 (2), 123–133. https://doi.org/10.1007/s10669-017-9642-9
- Cela, E., 2013. The quadratic assignment problem: Theory and algorithms. Springer Science & Business Media.
- Çelik, M., 2016. Network restoration and recovery in humanitarian operations: Framework, literature review, and research directions. Surveys in Operations Research and Management Science, 21 (2), 47–61. https://doi.org/10.1016/j.sorms.2016.12.001
- Çelik, M., Ergun, Ö., Johnson, B., Keskinocak, P., Lorca, Á., Pekgün, P., Swann, J., 2012. Humanitarian logistics. In P. B. Mirchandani (Ed.), New directions in informatics, optimization, logistics, and production. INFORMS TutORials in operations research (pp. 18–49). INFORMS.
- Celikbilek, C., Süer, G. A., 2015. Cellular design-based optimisation for manufacturing scheduling and transportation mode decisions. Asian Journal of Management Science and Applications, 2 (2), 107–129. https://doi.org/10.1504/AJMSA.2015.075321
- Cervone, D., D’Amour, A., Bornn, L., Goldsberry, K., 2016. A multiresolution stochastic process model for predicting basketball possession outcomes. Journal of the American Statistical Association, 111 (514), 585–599. https://doi.org/10.1080/01621459.2016.1141685
- Ceschia, S., Dang, N., De Causmaecker, P., Haspeslagh, S., Schaerf, A., 2019. The second international nurse rostering competition. Annals of Operations Research, 274 (1), 171–186. https://doi.org/10.1007/s10479-018-2816-0
- Ceschia, S., Di Gaspero, L., Schaerf, A., 2022. Educational timetabling: Problems, benchmarks, and state-of-the-art results. European Journal of Operational Research, https://doi.org/10.1016/j.ejor.2022.07.011
- Chae, Y., Horesh, R., Hwang, Y., Lee, Y., 2016. Artificial neural network model for forecasting sub-hourly electricity usage in commercial buildings. Energy and Buildings, 111, 184–194. https://doi.org/10.1016/j.enbuild.2015.11.045
- Chambers, R. G., Färe, R., Grosskopf, S., 1996. Productivity growth in APEC countries. Pacific Economic Review, 1 (3), 181–190. https://doi.org/10.1111/j.1468-0106.1996.tb00184.x
- Chang, H. S., Hu, J., Fu, M. C., Marcus, S. I., 2007. Simulation-based algorithms for Markov decision processes. Springer.
- Chang, Y., Keblis, M. F., Li, R., Iakovou, E., White, C. C., 2022. Misinformation and disinformation in modern warfare. Operations Research, 70 (3), 1577–1597. https://doi.org/10.1287/opre.2021.2253
- Chao, H.-P., Wilson, R., 2002. Multi-dimensional procurement auctions for power reserves: Robust incentive-compatible scoring and settlement rules. Journal of Regulatory Economics, 22 (2), 161–183.
- Chao, X., Chen, B., Zhang, H., 2023. Online learning in inventory and pricing optimization. In J.-S. Song (Ed.), Research handbook on inventory management. Edward Elgar Publishing.
- Charnes, A., Cooper, W. W., 1962. Programming with linear fractional functionals. Naval Research Logistics Quarterly, 9, 181–186. https://doi.org/10.1002/nav.3800090303
- Charnes, A., Cooper, W. W., Rhodes, E., 1978. Measuring the efficiency of decision making units. European Journal of Operational Research, 2 (6), 429–444. https://doi.org/10.1016/0377-2217(78)90138-8
- Charnes, A., Cooper, W. W., Symonds, G. H., 1958. Cost horizons and certainty equivalents: An approach to stochastic programming of heating oil. Management Science, 4 (3), 235–263. https://doi.org/10.1287/mnsc.4.3.235
- Chazelle. 1983. The bottomn-left bin-packing heuristic: An efficient implementation. IEEE Transactions on Computers, C-32 (8), 697–707. https://doi.org/10.1109/TC.1983.1676307
- Checkland, P., 1981. Systems thinking, systems practice. Wiley.
- Checkland, P., 1983. O.R. and the systems movement: Mappings and conflicts. Journal of the Operational Research Society, 34 (8), 661–675. https://doi.org/10.2307/2581700
- Checkland, P., 1985. From optimizing to learning: A development of systems thinking for the 1990s. Journal of the Operational Research Society, 36 (9), 757–767. https://doi.org/10.2307/2582164
- Checkland, P., 1989. Soft systems methodology. In J. Rosenhead (Ed.), Rational analysis for a problematic world: Problem structuring methods for complexity, uncertainty, and conflict (pp. 71–100). Wiley.
- Checkland, P., 2006. Reply to Eden and Ackermann: Any future for problem structuring methods? Journal of the Operational Research Society, 57 (7), 769–771. https://doi.org/10.1057/palgrave.jors.2602111
- Checkland, P., Poulter, J., 2006. Learning for action: A short definitive account of soft systems methodology, and its use for practitioners, teachers and students. Wiley.
- Checkland, P., Scholes, J., 1990. Soft systems methodology in action. Wiley.
- Chekuri, C., Goldberg, A. V., Karger, D. R., Levine, M. S., Stein, C., 1997. Experimental study of minimum cut algorithms. In M. E. Saks (Ed.), Proceedings of the Eighth Annual ACM-SIAM Symposium on Discrete Algorithms , 5–7 January 1997, New Orleans, Louisiana, USA (pp. 324–333). ACM/SIAM.
- Chen, D.-S., Batson, R., Dang, Y., 2011. Applied integer programming. Wiley.
- Chen, F., Drezner, Z., Ryan, J. K., Simchi-Levi, D., 2000. Quantifying the bullwhip effect in a simple supply chain: The impact of forecasting, lead times, and information. Management Science, 46 (3), 436–443. https://doi.org/10.1287/mnsc.46.3.436.12069
- Chen, F., Song, J.-S., 2001. Optimal policies for multiechelon inventory problems with markov-modulated demand. Operations Research, 49 (2), 226–234. https://doi.org/10.1287/opre.49.2.226.13528
- Chen, F., Zheng, Y.-S., 1994. Lower bounds for multi-echelon stochastic inventory systems. Management Science, 40 (11), 1426–1443. https://doi.org/10.1287/mnsc.40.11.1426
- Chen, H., 1995. Fluid approximations and stability of multiclass queueing networks: Work-conserving disciplines. The Annals of Applied Probability, 5 (3), 637–665. https://doi.org/10.1214/aoap/1177004699
- Chen, H., Yao, D. D., 2001. Fundamentals of queueing networks: Performance, asymptotics, and optimization. Springer.
- Chen, L., Wandelt, S., Dai, W., Sun, X., 2022. Scalable vertiport hub location selection for air taxi operations in a metropolitan region. INFORMS Journal on Computing, 34 (2), 834–856. https://doi.org/10.1287/ijoc.2021.1109
- Chen, L., Wang, Y.-M., 2022. Data envelopment analysis cross-efficiency method of non-homogeneous decision-making units. Journal of the Operational Research Society, https://doi.org/10.1080/01605682.2022.2056535
- Chen, L.-W., Sharma, P., Tseng, Y.-C., 2013. Dynamic traffic control with fairness and throughput optimization using vehicular communications. IEEE Journal on Selected Areas in Communications, 31, 504–512. https://doi.org/10.1109/JSAC.2013.SUP.0513045
- Chen, T., Guestrin, C., 2016. XGBoost: A scalable tree boosting system. In Proceedings of the 22nd ACM SIGKDD International Conference on Knowledge Discovery and Data Mining. KDD ‘16 . ACM, New York, NY, USA (pp. 785–794).
- Chen, V., Hooker, J. N., 2022a. Combining leximax fairness and efficiency in an optimization model. European Journal of Operational Research, 299, 235–248. https://doi.org/10.1016/j.ejor.2021.08.036
- Chen, V., Hooker, J. N., 2022b. A guide to formulating fairness in optimization models. Annals of Operations Research.
- Chen, Y. F., Disney, S. M., 2007. The myopic order-up-to policy with a proportional feedback controller. International Journal of Production Research, 45 (2), 351–368. https://doi.org/10.1080/00207540600579532
- Cheung, W. C., Simchi-Levi, D., 2017. Thompson sampling for online personalized assortment optimization problems with multinomial logit choice models. SSRN Electronic Journal, 3075658. https://doi.org/10.2139/ssrn.3075658
- Cheung, W. C., Simchi-Levi, D., 2023. Statistical learning in inventory management. In J.-S. Song (Ed.), Research handbook on inventory management. Edward Elgar Publishing.
- Chi, E. H., 2000. A taxonomy of visualization techniques using the data state reference model. In Proceedings of the IEEE Symposium on Information Vizualization 2000 (INFOVIS 2000) . IEEE Computer Society, USA (pp. 69–75).
- Chierici, A., Cordone, R., Maja, R., 2004. The demand-dependent optimization of regular train timetable. Electronic Notes in Discrete Mathematics, 17, 99–104. https://doi.org/10.1016/j.endm.2004.03.017
- Childers, T. L., Houston, M. J., 1984. Conditions for a picture-superiority effect on consumer memory. The Journal of Consumer Research, 11 (2), 643–654. https://doi.org/10.1086/209001
- Chintapalli, P., Disney, S. M., Tang, C. S., 2017. Coordinating supply chains via advance-order discounts, minimum order quantities, and delegations. Production and Operations Management, 26 (12), 2175–2186. https://doi.org/10.1111/poms.12751
- Choi, T. M., 2020. Supply chain financing using blockchain: Impacts on supply chains selling fashionable products. Annals of Operations Research. https://doi.org/10.1007/s10479-020-03615-7
- Choi, T.-M., Wen, X., Sun, X., Chung, S.-H., 2019. The mean-variance approach for global supply chain risk analysis with air logistics in the blockchain technology era. Transportation Research Part E: Logistics and Transportation Review, 127, 178–191. https://doi.org/10.1016/j.tre.2019.05.007
- Chopra, S., Rao, M. R., 1994. The Steiner tree problem I: Formulations, compositions and extension of facets. Mathematical Programming, 64 (1), 209–229. https://doi.org/10.1007/BF01582573
- Chothani, R. G., Patel, N. A., Dekavadiya, A. H., Patel, P. R., 2015. A review of online auction and its pros and cons. International Journal of Advance Engineering and Research Development, 2 (1), 8–11.
- Chouldechova, A., 2017. Fair prediction with disparate impact: A study of bias in recidivism prediction instruments. Big data, 5 (2), 153–163. https://doi.org/10.1089/big.2016.0047
- Chouman, M., Crainic, T. G., 2021. Freight railroad service network design. In T. G. Crainic, M. Gendreau, B. Gendron (Eds.), Network design with applications to transportation and logistics (pp. 383–426). Springer.
- Chowdhury, R., Gregory, A. J., Queah, M., 2023. Creative and flexible deployment of systems methodologies for child rights and child protection through (the conceptual lens of) holistic flexibility. Systems Research and Behavioral Science, 40 (4). https://doi.org/10.1002/sres.2955
- Christiaens, J., Vanden Berghe, G., 2020. Slack induction by string removals for vehicle routing problems. Transportation Science, 54 (2), 417–433. https://doi.org/10.1287/trsc.2019.0914
- Christiansen, M., Fagerholt, K., Flatberg, T., Haugen, Ø., Kloster, O., Lund, E. H., 2011. Maritime inventory routing with multiple products: A case study from the cement industry. European Journal of Operational Research, 208 (1), 86–94. https://doi.org/10.1016/j.ejor.2010.08.023
- Christiansen, M., Fagerholt, K., Nygreen, B., Ronen, D., 2013. Ship routing and scheduling in the new millennium. European Journal of Operational Research, 228 (3), 467–483. https://doi.org/10.1016/j.ejor.2012.12.002
- Christiansen, M., Hellsten, E., Pisinger, D., Sacramento, D., Vilhelmsen, C., 2020. Liner shipping network design. European Journal of Operational Research, 286 (1), 1–20. https://doi.org/10.1016/j.ejor.2019.09.057
- Christofides, N., 1975. Graph theory: An algorithmic approach. Academic Press.
- Christofides, N., Mingozzi, A., Toth, P., Sandi, C. (Eds.), 1979. Combinatorial optimization. Wiley.
- Christofides, N., Whitlock, C., 1981. Network synthesis with connectivity constraints —A survey. In J. Brans (Ed.), Operational research ’81 (pp. 705–723). North-Holland.
- Chu, Z., Xu, Z., Li, H., 2019. New heuristics for the RCPSP with multiple overlapping modes. Computers & Industrial Engineering, 131, 146–156. https://doi.org/10.1016/j.cie.2019.03.044
- Churchman, C., 1979. The systems approach (2nd ed.).
- Churchman, C. W., 1970. Operations research as a profession. Management Science, 17 (2), B37–B53. https://doi.org/10.1287/mnsc.17.2.B37
- Churchman, C. W., Ackoff, R., Arnoff, E. L., 1957. Introduction to operations research. Wiley.
- Chvátal, V., 1973. Edmonds polytopes and a hierarchy of combinatorial problems. Discrete Mathematics, 4, 305–337. https://doi.org/10.1016/0012-365X(73)90167-2
- Chvátal, V., 1983. Linear programming. W. H. Freeman.
- Ciampi, A., Dyachenko, A., Cole, M., McCusker, J., 2011. Delirium superimposed on dementia: Defining disease states and course from longitudinal measurements of a multivariate index using latent class analysis and hidden Markov chains. International Psychogeriatrics, 23 (10), 1659–1670. https://doi.org/10.1017/S1041610211000871
- Cinelli, M., Coles, S. R., Kirwan, K., 2014. Analysis of the potentials of multi criteria decision analysis methods to conduct sustainability assessment. Ecological Indicators, 46, 138–148. https://doi.org/10.1016/j.ecolind.2014.06.011
- Cinelli, M., Kadziński, M., Gonzalez, M., Słowiński, R., 2020. How to support the application of multiple criteria decision analysis? Let us start with a comprehensive taxonomy. Omega, 96, 102261. https://doi.org/10.1016/j.omega.2020.102261
- Cioppa, T. M., Lucas, T. W., Sanchez, S. M., 2004. Military applications of agent-based simulations. In R. G. Ingalis, M. D. Rossetti, J. S. Smith, & B. A. Peters (Eds.), Proceedings of the 2004 Winter Simulation Conference , 2004 (Vol. 1. p. 180).
- Claeskens, G., Magnus, J. R., Vasnev, A. L., Wang, W., 2016. The forecast combination puzzle: A simple theoretical explanation. International Journal of Forecasting, 32 (3), 754–762. https://doi.org/10.1016/j.ijforecast.2015.12.005
- Clark, A. J., Scarf, H., 1960. Optimal policies for a multi-echelon inventory problem. Management Science, 6 (4), 475–490. https://doi.org/10.1287/mnsc.6.4.475
- Clarke, G., Wright, J., 1964. Scheduling of vehicles from a central depot to a number of delivery points. Operations Research, 12, 568–581. https://doi.org/10.1287/opre.12.4.568
- Claßen, G., Koster, A. M. C. A., Coudert, D., Nepomuceno, N., 2014. Chance-Constrained optimization of reliable fixed broadband wireless networks. INFORMS Journal on Computing, 26 (4), 893–909. https://doi.org/10.1287/ijoc.2014.0605
- Clautiaux, F., Carlier, J., Moukrim, A., 2007. A new exact method for the two-dimensional orthogonal packing problem. European Journal of Operational Research, 183 (3), 1196–1211. https://doi.org/10.1016/j.ejor.2005.12.048
- Clemen, R., 1996. Making hard decisions: An Introduction to decision analysis.
- Cleophas, C., Ehmke, J. F., 2014. When are deliveries profitable? Business & Information Systems Engineering, 6 (3), 153–163. https://doi.org/10.1007/s12599-014-0321-9
- Coates, D., Parshakov, P., 2022. The wisdom of crowds and transfer market values. European Journal of Operational Research, 301 (2), 523–534. https://doi.org/10.1016/j.ejor.2021.10.046
- Cobacho, B., Caballero, R., González, M., Molina, J., 2010. Planning federal public investment in mexico using multiobjective decision making. Journal of the Operational Research Society, 61 (9), 1328–1339. https://doi.org/10.1057/jors.2009.101
- Cochrane, J., 2009. Asset pricing: Revised edition. Princeton University Press.
- Coelho, L. C., Cordeau, J.-F., Laporte, G., 2014. Heuristics for dynamic and stochastic inventory-routing. Computers & Operations Research, 52, 55–67. https://doi.org/10.1016/j.cor.2014.07.001
- Coffman Jr., G. E., Garey, M. R., Johnson, D. S., Tarjan, R. E., 1980. Performance bounds for level-oriented two-dimensional packing algorithms. SIAM Journal on Computing, 9 (4), 808–826. https://doi.org/10.1137/0209062
- COIN-OR Foundation, Inc., 2022. The computational infrastructure for operations research. https://www.coin-or.org/
- Colapinto, C., Jayaraman, R., Ben Abdelaziz, F., La Torre, D., 2020. Environmental sustainability and multifaceted development: Multi-criteria decision models with applications. Annals of Operations Research, 293 (2), 405–432. https://doi.org/10.1007/s10479-019-03403-y
- Comi, A., Bischof, N., Eppler Martin, J., 2014. Beyond projection: Using collaborative visualization to conduct qualitative interviews. Qualitative Research in Organizations and Management: An International Journal, 9 (2), 110–133. https://doi.org/10.1108/QROM-05-2012-1074
- Conforti, M., Cornuéjols, G., Zambelli, G., 2014. Integer programming. Springer.
- Congram, R. K., Potts, C. N., van de Velde, S. L., 2002. An iterated dynasearch algorithm for the single-machine total weighted tardiness scheduling problem. INFORMS Journal on Computing, 14 (1), 52–67. https://doi.org/10.1287/ijoc.14.1.52.7712
- Contreras, I., 2020. A review of the literature on DEA models under common set of weights. Journal of Modelling in Management, 15 (4), 1277–1300. https://doi.org/10.1108/JM2-02-2019-0043
- Contreras, I., Fernández, E., 2012. General network design: A unified view of combined location and network design problems. European Journal of Operational Research, 219, 680–697. https://doi.org/10.1016/j.ejor.2011.11.009
- Cook, S. A., 1971. The complexity of theorem-proving procedures. In Proceedings of the 3rd ACM Symposium on the Theory of Computing (STOC) (pp. 151–158). https://doi.org/10.1145/800157.805047
- Cook, S. L., 1973. Operational research, social well-being and the zero growth concept. Omega, 1 (6), 647–667. https://doi.org/10.1016/0305-0483(73)90084-4
- Cook, S. L., 1984. Operational research, social well-being and the zero growth concept. In K. Bowen, A. Cook, M. Luck (Eds.), The writings of Steve Cook (pp. 34–51). Operational Research Society.
- Cook, W., Cunningham, W., Pulleyblank, W., Schrijver, A., 1998. Combinatorial optimization. Wiley.
- Cook, W., Held, S., Helsgaun, K., 2021. Constrained local search for last-mile routing. arXiv:2112.15192.
- Cook, W. D., Liang, L., Zhu, J., 2010. Measuring performance of two-stage network structures by DEA: A review and future perspective. Omega, 38 (6), 423–430. https://doi.org/10.1016/j.omega.2009.12.001
- Cook, W. D., Tone, K., Zhu, J., 2014. Data envelopment analysis: Prior to choosing a model. Omega, 44, 1–4. https://doi.org/10.1016/j.omega.2013.09.004
- Cook, W. D., Zhu, J., 2014. Data envelopment analysis: A handbook of modeling internal structure and network. Springer.
- Cook, W. J., 2011. In pursuit of the traveling salesman. Princeton University Press.
- Cooper, R. B., 1972. Introduction to queueing theory. Macmillan.
- Cooper, W. W., Seiford, L. M., Tone, K., 2007. Data envelopment analysis: A comprehensive text with models, applications, references and DEA-solver software. Springer.
- Cooper, W. W., Seiford, L. M., Zhu, J., 2011. Handbook on data envelopment analysis. Springer.
- Corbett-Davies, S., Pierson, E., Feller, A., Goel, S., Huq, A., 2017. Algorithmic decision making and the cost of fairness. In Proceedings of the 23rd ACM SIGKDD International Conference on Knowledge Discovery and Data Mining . KDD ‘17. Association for Computing Machinery, New York, NY, USA (pp. 797–806). https://doi.org/10.1145/3097983.3098095
- Cordeau, J.-F., Laporte, G., 2005. Tabu search heuristics for the vehicle routing problem. In R. Sharda, S. Voß, C. Rego, & B. Alidaee, (Eds.), Metaheuristic optimization via memory and evolution: Tabu search and scatter search (pp. 145–163). Springer US,
- Cordeau, J.-F., Soumis, F., Desrosiers, J., 2000. A Benders decomposition approach for the locomotive and car assignment problem. Transportation Science, 34 (2), 133–149. https://doi.org/10.1287/trsc.34.2.133.12308
- Cordeau, J.-F., Stojković, G., Soumis, F., Desrosiers, J., 2001. Benders decomposition for simultaneous aircraft routing and crew scheduling. Transportation Science, 35 (4), 375–388. https://doi.org/10.1287/trsc.35.4.375.10432
- Córdoba, J.-R., Midgley, G., 2006. Broadening the boundaries: An application of critical systems thinking to IS planning in Colombia. Journal of the Operational Research Society, 57 (9), 1064–1080. https://doi.org/10.1057/palgrave.jors.2602081
- Corlu, C. G., Akcay, A., Xie, W., 2020. Stochastic simulation under input uncertainty: A review. Operations Research Perspectives, 7, 100162. https://doi.org/10.1016/j.orp.2020.100162
- Cormen, T. H., Leiserson, C. E., Rivest, R. L., Stein, C., 2022. Introduction to algorithms (4th ed.). MIT Press.
- Cormen, T. H., Stein, C., Leiserson, C. E., Rivest, R. L., 2009. Introduction to algorithms (3rd ed.). MIT Press.
- Cornuéjols, G., 2008. Valid inequalities for mixed integer linear programs. Mathematical Programming, 112, 3–44. https://doi.org/10.1007/s10107-006-0086-0
- Cornuéjols, G., Dawande, M., 1999. A class of hard small 0-1 programs. INFORMS Journal on Computing, 11, 205–210. https://doi.org/10.1287/ijoc.11.2.205
- Cornuejols, G., Tütüncü, R., 2006. Optimization methods in finance. Cambridge University Press.
- Cortazar, G., Schwartz, E. S., Salinas, M., 1998. Evaluating environmental investments: A real options approach. Management Science, 44 (8), 1059–1070. https://doi.org/10.1287/mnsc.44.8.1059
- Costa, A. M., 2005. A survey on benders decomposition applied to fixed-charge network design problems. Computers & Operations Research, 32 (6), 1429–1450. https://doi.org/10.1016/j.cor.2003.11.012
- Costa, M. T., Gomes, A. M., Oliveira, J. F., 2009. Heuristic approaches to large-scale periodic packing of irregular shapes on a rectangular sheet. European Journal of Operational Research, 192 (1), 29–40. https://doi.org/10.1016/j.ejor.2007.09.012
- Council for Science and Technology. 2020. Achieving net zero carbon emissions through a whole systems approach. https://www.gov.uk/government/publications/achieving-net-zero-carbon-emissions-through-a-whole-systems-approach, Retrieved January 12, 2023.
- Cowell, F. A., 2000. Measurement of inequality. In A. B. Atkinson & F. Bourguignon (Eds.), Handbook of income distribution (Vol. 1, pp. 89–166). Elsevier.
- Cox, J. C., Ross, S. A., Rubinstein, M., 1979. Option pricing: A simplified approach. Journal of Financial Economics, 7 (3), 229–263. https://doi.org/10.1016/0304-405X(79)90015-1
- Cox, Jr, L. A., 2020. Answerable and unanswerable questions in risk analysis with open-world novelty. Risk Analysis, 40 (S1), 2144–2177. https://doi.org/10.1111/risa.13553
- Cox, Jr, L. A., Popken, D. A., Sun, R. X., 2018. Causal analytics for applied risk analysis. Springer.
- Craig, J. D., Winchester, N., 2021. Predicting the national football league potential of college quarterbacks. European Journal of Operational Research, 295 (2), 733–743. https://doi.org/10.1016/j.ejor.2021.03.013
- Crainic, T. G., Ferland, J.-A., Rousseau, J.-M., 1984. A tactical planning model for rail freigth transportation. Transportation Science, 18 (2), 165–184. https://doi.org/10.1287/trsc.18.2.165
- Crainic, T. G., Florian, M., Léal, J. E., 1990. A model for the strategic planning of national freight transportation by rail. Transportation Science, 24 (1), 1–24. https://doi.org/10.1287/trsc.24.1.1
- Crainic, T. G., Fu, X., Gendreau, M., Rei, W., Wallace, S. W., 2011. Progressive hedging-based metaheuristics for stochastic network design. Networks, 58 (2), 114–124. https://doi.org/10.1002/net.20456
- Crainic, T. G., Gendreau, M., 2021. Heuristics and metaheuristics for fixed-charge network design. In T. G. Crainic, M. Gendreau, & B. Gendron (Eds.), Network design with applications to transportation and logistics (pp. 91–138). Springer.
- Crainic, T. G., Gendreau, M., Gendron, B., 2021a. Fixed-charge network design problems. In T. G. Crainic, M. Gendreau, & B. Gendron (Eds.), Network design with applications to transportation and logistics (pp. 15–28). Springer.
- Crainic, T. G., Gendreau, M., Gendron, B., 2021b. Network design with applications to transportation and logistics. Springer.
- Crainic, T. G., Gendron, B., 2021. Exact methods for fixed-charge network design. In T. G. Crainic, M. Gendreau, & B. Gendron (Eds.), Network design with applications to transportation and logistics (pp. 29–89). Springer.
- Crainic, T. G., Hewitt, M., Maggioni, F., Rei, W., 2021c. Partial benders decomposition: General methodology and application to stochastic network design. Transportation Science, 55 (2), 414–435. https://doi.org/10.1287/trsc.2020.1022
- Crainic, T. G., Hewitt, M., Rei, W., 2014. Scenario grouping in a progressive hedging-based meta-heuristic for stochastic network design. Computers & Operations Research, 43, 90–99. https://doi.org/10.1016/j.cor.2013.08.020
- Crainic, T. G., Hewitt, M., Toulouse, M., Vu, D. M., 2016. Service network design with resource constraints. Transportation Science, 50 (4), 1380–1393. https://doi.org/10.1287/trsc.2014.0525
- Crainic, T. G., Hewitt, M., Toulouse, M., Vu, D. M., 2018. Scheduled service network design with resource acquisition and management. EURO Journal on Transportation and Logistics, 7 (3), 277–309. https://doi.org/10.1007/s13676-017-0103-x
- Crama, Y., Rezaei, M., Savelsbergh, M., Van Woensel, T., 2022. Stochastic inventory routing for perishable products. Transportation Science, 52 (3), 526–546. https://doi.org/10.1287/trsc.2017.0799
- CreateASoft Inc., 2022. SimCAD. https://www.createasoft.com/simcad-pro-healthcare-simulation-software
- Creemers, S., Demeulemeester, E., Van de Vonder, S., 2014. A new approach for quantitative risk analysis. Annals of Operations Research, 213 (1), 27–65. https://doi.org/10.1007/s10479-013-1355-y
- Cressman, R., 2003. Evolutionary dynamics and extensive form games. MIT Press.
- Crouhy, M., Galai, D., Mark, R., 2000. A comparative analysis of current credit risk models. Journal of Banking & Finance, 24 (1–2), 59–117. https://doi.org/10.1016/S0378-4266(99)00053-9
- Crowder, H., Johnson, E., Padberg, M., 1983. Solving large-scale 0-1 linear programming problems. Discrete Mathematics, 31, 803–834. https://doi.org/10.1287/opre.31.5.803
- Crowe, S., Utley, M., 2022. Praxis in healthcare OR: An empirical behavioural OR study. Journal of the Operational Research Society, 73 (7), 1444–1456. https://doi.org/10.1080/01605682.2021.1919036
- Crowe, S., Vasilakis, C., Skeen, A., Storr, P., Grove, P., Gallivan, S., Utley, M., 2014. Examining the feasibility of using a modelling tool to assess resilience across a health-care system and assist with decisions concerning service reconfiguration. Journal of the Operational Research Society, 65 (10), 1522–1532. https://doi.org/10.1057/jors.2013.102
- Cui, T. H., Wu, Y., 2018. Incorporating behavioral factors into operations theory. In The handbook of behavioral operations (pp. 89–119). Wiley.
- Currie, C. S. M., Fowler, J. W., Kotiadis, K., Monks, T., Onggo, B. S., Robertson, D. A., Tako, A. A., 2020. How simulation modelling can help reduce the impact of COVID-19. Journal of Simulation, 14 (2), 83–97. https://doi.org/10.1080/17477778.2020.1751570
- Daduna, H., 2001. Queueing networks with discrete time scaling. Springer-Verlag.
- Dagkakis, G., Heavey, C., 2016. A review of open source discrete event simulation software for operations research. Journal of Simulation, 10 (3), 193–206. https://doi.org/10.1057/jos.2015.9
- Dahl, H., Meeraus, A., Zenios, S. A., 1993a. Some financial optimization models: I. Risk Management. In S. A. Zenios (Ed.), Financial optimization (pp. 3–36). Cambridge University Press.
- Dahl, H., Meeraus, A., Zenios, S. A., 1993b. Some financial optimization models: II. Financial Engineering. In S. A. Zenios (Ed.), Financial optimization (pp. 37–71). Cambridge University Press.
- Dai, J. G., 1995. On positive Harris recurrence of multiclass queueing networks: A unified approach via fluid limit models. The Annals of Applied Probability, 5 (1), 49–77. https://doi.org/10.1214/aoap/1177004828
- Dai, J. G., Meyn, S. P., 1995. Stability and convergence of moments for multiclass queueing networks via fluid limit models. IEEE Transactions on Automatic Control, 40 (11), 1889–1904. https://doi.org/10.1109/9.471210
- Daley, D., Rolski, T., 1992. Light traffic approximations in many-server queues. Advances in Applied Probability, 24 (1), 202–218. https://doi.org/10.2307/1427736
- Dammon, R. M., Spatt, C. S., Zhang, H. H., 2001. Optimal consumption and investment with capital gains taxes. The Review of Financial Studies, 14 (3), 583–616. https://doi.org/10.1093/rfs/14.3.583
- Damodaran, S. K., Wagner, N., 2020. Modeling and simulation to support cyber defense. The Journal of Defense Modeling and Simulation, 17 (1), 3–4. https://doi.org/10.1177/1548512919856543
- Dando, M. R., Bennett, P. G., 1981. A Kuhnian crisis in management science? Journal of the Operational Research Society, 32 (2), 91–103. https://doi.org/10.2307/2581256
- Danna, E., Rothberg, E., Le Pape, C., 2005. Exploring relaxation induced neighborhoods to improve MIP solutions. Mathematical Programming, 102, 71–90. https://doi.org/10.1007/s10107-004-0518-7
- Dantzig, G., 1960. On the significance of solving linear programming problems with some integer variables. Econometrica, 28, 30–44. https://doi.org/10.2307/1905292
- Dantzig, G., Fulkerson, R., Johnson, S., 1954. Solution of a large-scale traveling-salesman problem. Journal of the Operations Research Society of America, 2 (4), 393–410. https://doi.org/10.1287/opre.2.4.393
- Dantzig, G., Ramser, J., 1959. The truck dispatching problem. Management Science, 6, 80–91. https://doi.org/10.1287/mnsc.6.1.80
- Dantzig, G. B., 1951. Maximization of a linear function of variables subject to linear inequalities. In T. C. Koopmans (Ed.), Activity analysis of production and allocation (pp. 339–347). Wiley.
- Dantzig, G. B., 1955. Linear programming under uncertainty. Management Science, 1 (3/4), 197–206. https://doi.org/10.1287/mnsc.1.3-4.197
- Dantzig, G. B., 1963. Linear programming and extensions. Princeton University Press, Princeton.
- Dantzig, G. B., 1982. Reminiscences about the origins of linear programming. Operations Research Letters, 1 (2), 43–48. https://doi.org/10.1016/0167-6377(82)90043-8
- Dantzig, G. B., 1990. Origins of the simplex method. In S. G. Nash (Ed.), A history of scientific computing (pp. 141–151). Association for Computing Machinery.
- Dantzig, G. B., 1991. Linear programming. In J. K. Lenstra, A. H. Rinnooy Kan, & A. Schrijver (Eds.), History of mathematical programming: A collection of personal reminiscences. CWI.
- Dantzig, G. B., Fulkerson, D. R., 1955. On the max flow min cut theorem of networks. Tech. Rep., RAND Corporation.
- Dantzig, G. B., Infanger, G., 1991. Large-scale stochastic linear programs: Importance sampling and benders decomposition. Tech. Rep. ADA234962, Systems Optimization Laboratoty, Stanford University.
- Daraio, C., Simar, L., 2007. Conditional nonparametric frontier models for convex and nonconvex technologies: A unifying approach. Journal of Productivity Analysis, 28 (1), 13–32. https://doi.org/10.1007/s11123-007-0049-3
- Daraio, C., Simar, L., Wilson, P. W., 2018. Central limit theorems for conditional efficiency measures and tests of the ‘separability’ condition in non-parametric, two-stage models of production. The Econometrics Journal, 21 (2), 170–191. https://doi.org/10.1111/ectj.12103
- D’Ariano, A., Meng, L., Centulio, G., Corman, F., 2019. Integrated stochastic optimization approaches for tactical scheduling of trains and railway infrastructure maintenance. Computers & Industrial Engineering, 127, 1315–1335. https://doi.org/10.1016/j.cie.2017.12.010
- Dasgupta, D., Akhtar, Z., Sen, S., 2022. Machine learning in cybersecurity: A comprehensive survey. The Journal of Defense Modeling and Simulation, 19 (1), 57–106. https://doi.org/10.1177/1548512920951275
- Daskin, M., 1995. Network and discrete location: Models, algorithms, and applications. Wiley.
- Datta, S., 1995. A decision support system for micro-watershed management in India. Journal of the Operational Research Society, 46 (5), 592–603. https://doi.org/10.2307/2584533
- Davenport, T. H., 2013. Analytics 3.0. Harvard Business Review. https://hbr.org/2013/12/analytics-30
- Davenport, T. H., Harris, J. G., 2007. Competing on analytics: The new science of winning. Harvard Business Press.
- Davenport, T. H., Harris, J. G., Morison, R., 2010. Analytics at work: Smarter decisions, better results. Harvard Business Press.
- Davies, J., Mabin, V. J., Balderstone, S. J., 2005. The theory of constraints: A methodology apart?—A comparison with selected OR/MS methodologies. Omega, 33 (6), 506–524. https://doi.org/10.1016/j.omega.2004.07.015
- Davis, M. H., Panas, V. G., Zariphopoulou, T., 1993. European option pricing with transaction costs. SIAM Journal on Control and Optimization, 31 (2), 470–493. https://doi.org/10.1137/0331022
- Davis, P. K., Bracken, P., 2022. Artificial intelligence for wargaming and modeling. The Journal of Defense Modeling and Simulation. https://doi.org/10.1177/15485129211073126
- Davtalab-Olyaie, M., Mahmudi-Baram, H., Asgharian, M., 2023. Measuring individual efficiency and unit influence in centrally managed systems. Annals of Operations Research, 321, 139–164. https://doi.org/10.1007/s10479-022-04676-6
- Davydenko, A., Fildes, R., 2013. Measuring forecasting accuracy: The case of judgmental adjustments to SKU-level demand forecasts. International Journal of Forecasting, 29 (3), 510–522. https://doi.org/10.1016/j.ijforecast.2012.09.002
- Dayarian, I., Savelsbergh, M., 2020. Crowdshipping and same-day delivery: Employing in-store customers to deliver online orders. Production and Operations Management, 29 (9), 2153–2174. https://doi.org/10.1111/poms.13219
- Dayarian, I., Savelsbergh, M., Clarke, J.-P., 2020. Same-day delivery with drone resupply. Transportation Science, 54 (1), 229–249. https://doi.org/10.1287/trsc.2019.0944
- De Baets, S., Harvey, N., 2020. Using judgment to select and adjust forecasts from statistical models. European Journal of Operational Research, 284 (3), 882–895. https://doi.org/10.1016/j.ejor.2020.01.028
- de Brito, M. M., Evers, M., 2016. Multi-criteria decision-making for flood risk management: A survey of the current state of the art. Natural Hazards and Earth System Sciences, 16, 1019–1033. https://doi.org/10.5194/nhess-16-1019-2016
- De Causmaecker, P., Vanden Berghe, G., 2011. A categorisation of nurse rostering problems. Journal of Scheduling, 14, 3–16. https://doi.org/10.1007/s10951-010-0211-z
- de Figueiredo, J. N., Mayerle, S. F., 2008. Designing minimum-cost recycling collection networks with required throughput. Transportation Research Part E: Logistics and Transportation Review, 44 (5), 731–752. https://doi.org/10.1016/j.tre.2007.04.002
- de Finetti, B., 1937. La prévision: ses lois logiques, ses sources subjectives. In: Annales de l’Institut Henri Poincaré (Vol. 7. pp. 1–68).
- de Gooyert, V., Rouwette, E., van Kranenburg, H., Freeman, E., 2017. Reviewing the role of stakeholders in operational research: A stakeholder theory perspective. European Journal of Operational Research, 262 (2), 402–410. https://doi.org/10.1016/j.ejor.2017.03.079
- de Jomini, A.-H., 1862. The art of war. J.B. Lippincott.
- de Keizer, M., Akkerman, R., Grunow, M., Bloemhof, J. M., Haijema, R., van der Vorst, J. G. A. J., 2017. Logistics network design for perishable products with heterogeneous quality decay. European Journal of Operational Research, 262 (2), 535–549. https://doi.org/10.1016/j.ejor.2017.03.049
- de Kok, A. d., Graves, S. C., 2003. Supply chain management: Design, coordination and operation. Elsevier.
- de Oliveira, L., de Souza, C. C., Yunes, T., 2015. On the complexity of the traveling umpire problem. Theoretical Computer Science, 562, 101–111. https://doi.org/10.1016/j.tcs.2014.09.037
- De Reyck, B., Herroelen, W., 1998. A branch-and-bound procedure for the resource-constrained project scheduling problem with generalized precedence relations. European Journal of Operational Research, 111 (1), 152–174. https://doi.org/10.1016/S0377-2217(97)00305-6
- De Reyck, B., Herroelen, W., 1999. The multi-mode resource-constrained project scheduling problem with generalized precedence relations. European Journal of Operational Research, 119 (2), 538–556. https://doi.org/10.1016/S0377-2217(99)00151-4
- de Treville, S., Antonakis, J., 2006. Could lean production job design be intrinsically motivating? Contextual, configurational, and levels-of-analysis issues. Journal of Operations Management, 24 (2), 99–123. https://doi.org/10.1016/j.jom.2005.04.001
- de Werra, D., Asratian, A. S., Durand, S., 2002. Complexity of some special types of timetabling problems. Journal of Scheduling, 5, 171–183. https://doi.org/10.1002/jos.97
- De Witte, K., López-Torres, L., 2017. Efficiency in education: A review of literature and a way forward. Journal of the Operational Research Society, 68 (4), 339–363. https://doi.org/10.1057/jors.2015.92
- Deb, K., 2001. Multi-objective optimization using evolutionary algorithms. John Wiley & Sons.
- Debels, D., De Reyck, B., Leus, R., Vanhoucke, M., 2006. A hybrid scatter search/electromagnetism meta-heuristic for project scheduling. European Journal of Operational Research, 169 (2), 638–653. https://doi.org/10.1016/j.ejor.2004.08.020
- Debo, L. G., Savaskan, R. C., Van Wassenhove, L. N., 2004. Coordination in Closed-Loop supply chains. In R. Dekker, M. Fleischmann, K. Inderfurth, L. N. Van Wassenhove (Eds.), Reverse logistics: Quantitative models for closed-loop supply chains (pp. 295–311). Springer.
- Debo, L. G., Toktay, L. B., Van Wassenhove, L. N., 2005. Market segmentation and product technology selection for remanufacturable products. Management Science, 51 (8), 1193–1205. https://doi.org/10.1287/mnsc.1050.0369
- Dejonckheere, J., Disney, S. M., Lambrecht, M. R., Towill, D. R., 2003. Measuring and avoiding the bullwhip effect: A control theoretic approach. European Journal of Operational Research, 147 (3), 567–590. https://doi.org/10.1016/S0377-2217(02)00369-7
- Dejonckheere, J., Disney, S. M., Lambrecht, M. R., Towill, D. R., 2004. The impact of information enrichment on the bullwhip effect in supply chains: A control engineering perspective. European Journal of Operational Research, 153 (3), 727–750. https://doi.org/10.1016/S0377-2217(02)00808-1
- Delen, D., Ram, S., 2018. Research challenges and opportunities in business analytics. Journal of Business Analytics, 1 (1), 2–12. https://doi.org/10.1080/2573234X.2018.1507324
- Della Croce, F., Grosso, A., Salassa, F., 2014. A matheuristic approach for the two-machine total completion time flow shop problem. Annals of Operations Research, 213 (1), 67–78. https://doi.org/10.1007/s10479-011-0928-x
- Dellnitz, A., 2022. Big data efficiency analysis: Improved algorithms for data envelopment analysis involving large datasets. Computers & Operations Research, 137, 105553. https://doi.org/10.1016/j.cor.2021.105553
- Demassey, S., 2008. Mathematical programming formulations and lower bounds. In C. Artigues, S. Demassey, E. Néron (Eds.), Resource-constrained project scheduling – Models, algorithms, extensions and applications (pp. 49–62). ISTE.
- Demeulemeester, E., 1995. Minimizing resource availability costs in time-limited project networks. Management Science, 41 (10), 1590–1598. https://doi.org/10.1287/mnsc.41.10.1590
- Demeulemeester, E., Herroelen, W., 1992. A branch-and-bound procedure for the multiple resource-constrained project scheduling problem. Management Science, 38 (12), 1803–1818. https://doi.org/10.1287/mnsc.38.12.1803
- Demeulemeester, E., Herroelen, W., 2011. Robust project scheduling. Foundations and Trends® in Technology, Information and Operations Management, 3 (3–4), 201–376. https://doi.org/10.1561/0200000021
- Demeulemeester, E. L., Herroelen, W., 2002. Project scheduling: A research handbook. Springer Science & Business Media.
- Demeulemeester, E. L., Herroelen, W. S., 1996. An efficient optimal solution procedure for the preemptive resource-constrained project scheduling problem. European Journal of Operational Research, 90 (2), 334–348. https://doi.org/10.1016/0377-2217(95)00358-4
- Demeulemeester, E. L., Herroelen, W. S., 1997. A branch-and-bound procedure for the generalized resource-constrained project scheduling problem. Operations Research, 45 (2), 201–212. https://doi.org/10.1287/opre.45.2.201
- den Boer, J., Lambrechts, W., Krikke, H., 2020. Additive manufacturing in military and humanitarian missions: Advantages and challenges in the spare parts supply chain. Journal of Cleaner Production, 257, 120301. https://doi.org/10.1016/j.jclepro.2020.120301
- Department for Transport. 2022. Road goods vehicles travelling to europe (RORO). https://www.gov.uk/government/statistical-data-sets/road-goods-vehicles-travelling-to-europe.Retrieved January 12, 2023.
- Desaulniers, G., Desrosiers, J., Dumas, Y., Solomon, M. M., Soumis, F., 1997. Daily aircraft routing and scheduling. Management Science, 43 (6), 841–855. https://doi.org/10.1287/mnsc.43.6.841
- Desaulniers, G., Desrosiers, J., Solomon, M. (Eds.), 2006. Column generation. Springer.
- Desaulniers, G., Desrosiers, J., Solomon, M. M., 2002. Accelerating strategies in column generation methods for vehicle routing and crew scheduling problems. In C. Ribeiro & P. Hansen (Eds.), Essays and surveys in metaheuristics (pp. 309–324). Springer.
- Desrosiers, J., Lübbecke, M., 2005. A primer in column generation. In: G. Desaulniers, J. Desrosiers, M. Solomon (Eds.), Column generation (pp. 1–32). Springer US.
- Dettmer, H. W., 1997. Goldratt’s theory of constraints: A systems approach to continuous improvement. ASQC Quality Press.
- Deutsch, A. R., Lustfield, R., Jalali, M. S., 2022. Community-based system dynamics modelling of stigmatized public health issues: Increasing diverse representation of individuals with personal experiences. Systems Research and Behavioral Science, 39 (4), 734–749. https://doi.org/10.1002/sres.2807
- DeValve, L., Song, J.-S., Wei, Y., 2023. Assemble-to-order systems. In J.-S. Song (Ed.), Research handbook on inventory management. Edward Elgar Publishing.
- DHL. 2013. Logistics trend radar. DHL. https://www.dhl.com/content/dam/Campaigns/InnovationDay_2013/90310673_HI-RES.PDF
- Diaz-Balteiro, L., González-Pachón, J., Romero, C., 2017. Measuring systems sustainability with multi-criteria methods: A critical review. European Journal of Operational Research, 258 (2), 607–616. https://doi.org/10.1016/j.ejor.2016.08.075
- Dieterich, W., Mendoza, C., Brennan, T., 2016. COMPAS risk scales: Demonstrating accuracy equity and predictive parity. Tech. Rep., Northpointe Inc. Research Department, 8 July.
- Dietrich, B., Escudero, L., Chance, F., 1993. Efficient reformulation for 0-1 programs—methods and computational results. Discrete Applied Mathematics, 42, 147–175. https://doi.org/10.1016/0166-218X(93)90044-O
- Dignum, V., 2019. Responsible artificial intelligence: How to develop and use ai in a responsible way (1st ed.). Springer.
- Dijkstra, E. W., 1959. A note on two problems in connexion with graphs. Numerische Mathematik, 1, 269–271. https://doi.org/10.1007/BF01386390
- Dillenburger, S. P., Jordan, J. D., Cochran, J. K., 2019. Pareto-optimality for lethality and collateral risk in the airstrike multi-objective problem. Journal of the Operational Research Society, 70 (7), 1051–1064. https://doi.org/10.1080/01605682.2018.1487818
- DIMACS. 2021. Implementation challenge: Vehicle routing. Retrieved September 14, 2021, from http://dimacs.rutgers.edu/programs/challenge/vrp/.
- Dimopoulou, M., Miliotis, P., 2001. Implementation of a university course and examination timetabling system. European Journal of Operational Research, 130 (1), 202–213. https://doi.org/10.1016/S0377-2217(00)00052-7
- Ding, L., Glazebrook, K. D., Kirkbride, C., 2008. Allocation models and heuristics for the outsourcing of repairs for a dynamic warranty population. Management Science, 54 (3), 594–607. https://doi.org/10.1287/mnsc.1070.0750
- Dinic, E., 1970. An algorithm for the solution of the max-flow problem with the polynomial estimation. Doklady Akademii Nauk SSSR, 194 (4), 1277–1280.
- Dinitz, Y., 2006. Dinitz’ algorithm: The original version and Even’s version. In O. Goldreich, A. L. Rosenberg, & A. L. Selman (Eds.), Theoretical computer science, essays in memory of Shimon even Vol. 3895 of Lecture Notes in Computer Science (pp. 218–240). Springer.
- Dixit, A. K., Pindyck, R. S., 2009. The options approach to capital investment. In T. Siesfeld, J. Cefola, D. Neef (Eds.), The economic impact of knowledge (pp. 325–340). Routledge.
- Dixon, M. F., Halperin, I., Bilokon, P., 2020. Machine learning in finance. Springer.
- Dixon, M. J., Coles, S. G., 1997. Modelling association football scores and inefficiencies in the football betting market. Journal of the Royal Statistical Society. Series C, Applied statistics, 46 (2), 265–280. https://doi.org/10.1111/1467-9876.00065
- Dönmez, Z., Kara, B. Y., Özlem Karsu, da Gama, F. S., 2021. Humanitarian facility location under uncertainty: Critical review and future prospects. Omega, 102, 102393. https://doi.org/10.1016/j.omega.2021.102393
- Doganis, P., Aggelogiannaki, E., Sarimveis, H., 2008. A combined model predictive control and time series forecasting framework for production-inventory systems. International Journal of Production Research, 46 (24), 6841–6853. https://doi.org/10.1080/00207540701523058
- Dong, L., Shi, D., Zhang, F., 2016. 3D printing vs. traditional flexible technology: Implications for manufacturing strategy. Working Paper, St. Louis, MO: Washington University.
- Dong, Y., Xu, K., 2002. A supply chain model of vendor managed inventory. Transportation Research Part E: Logistics and Transportation Review, 38 (2), 75–95. https://doi.org/10.1016/S1366-5545(01)00014-X
- Donohue, K., Özer, Ö., Zheng, Y., 2020. Behavioral operations: Past, present, and future. Manufacturing & Service Operations Management, 22 (1), 191–202. https://doi.org/10.1287/msom.2019.0828
- Douglas, M., Wildavsky, A., 1983. Risk and culture: An essay on the selection of technological and environmental dangers. University of California Press.
- Doukas, H., Nikas, A., 2020. Decision support models in climate policy. European Journal of Operational Research, 280 (1), 1–24. https://doi.org/10.1016/j.ejor.2019.01.017
- Downey, R. G., Fellows, M. R., 1999. Parameterized complexity. Springer.
- Doyle, J., Green, R., 1994. Efficiency and cross-efficiency in DEA: Derivations, meanings and uses. The Journal of the Operational Research Society, 45 (5), 567–578. https://doi.org/10.2307/2584392
- Drexl, A., Knust, S., 2007. Sports league scheduling: Graph- and resource-based models. Omega, 35 (5), 465–471. https://doi.org/10.1016/j.omega.2005.08.002
- Drexl, M., 2012. Synchronization in vehicle routing—A survey of vrps with multiple synchronization constraints. Transportation Science, 46 (3), 297–316. https://doi.org/10.1287/trsc.1110.0400
- Dreyfus, S. E., 1969. An appraisal of some shortest-path algorithms. Operations Research, 17 (3), 395–412. https://doi.org/10.1287/opre.17.3.395
- Dreyfus, S. E., Law, A. M., 1977. The art and theory of dynamic programming. Academic Press.
- Drezner, Z., Hamacher, H. (Eds.), 2004. Facility location: Applications and theory. Springer.
- Duan, L., Xiong, Y., 2015. Big data analytics and business analytics. Journal of Management Analytics, 2 (1), 1–21. https://doi.org/10.1080/23270012.2015.1020891
- Dubitzky, W., Lopes, P., Davis, J., Berrar, D., 2019. The open international soccer database for machine learning. Machine Learning, 108 (1), 9–28. https://doi.org/10.1007/s10994-018-5726-0
- Duckworth, F. C., Lewis, A. J., 1998. A fair method for resetting the target in interrupted one-day cricket matches. Journal of the Operational Research Society, 49 (3), 220–227. https://doi.org/10.2307/3010471
- Dunbar, M., Froyland, G., Wu, C.-L., 2012. Robust airline schedule planning: Minimizing propagated delay in an integrated routing and crewing framework. Transportation Science, 46 (2), 204–216. https://doi.org/10.1287/trsc.1110.0395
- Dunning, I., Huchette, J., Lubin, M., 2017. JuMP: A modeling language for mathematical optimization. SIAM Review, 59 (2), 295–320. https://doi.org/10.1137/15M1020575
- Durán, G., 2021. Sports scheduling and other topics in sports analytics: A survey with special reference to Latin America. Top, 29 (1), 125–155. https://doi.org/10.1007/s11750-020-00576-9
- Duran, S., Gutierrez, M. A., Keskinocak, P., 2011. Pre-positioning of emergency items for CARE International. Interfaces, 41 (3), 223–237. https://doi.org/10.1287/inte.1100.0526
- Dutta, P., 1995. A folk theorem for stochastic games. Journal of Economic Theory, 66, 1–32. https://doi.org/10.1006/jeth.1995.1030
- Dutton, J. M., Walton, R. E., 1964. Operational research and the behavioural sciences. Operations Research Quarterly, 15 (3), 207–217. https://doi.org/10.2307/3007208
- Dwork, C., Hardt, M., Pitassi, T., Reingold, O., Zemel, R., 2012. Fairness through awareness. In Proceedings of the 3rd Innovations in Theoretical Computer Science Conference (pp. 214–226). https://doi.org/10.1145/2090236.2090255
- Dyckhoff, H., 1990. A typology of cutting and packing problems. European Journal of Operational Research, 44 (2), 145–159. https://doi.org/10.1016/0377-2217(90)90350-K
- Dyer, J. S., 1990. Remarks on the analytic hierarchy process. Management Science, 36 (3), 249–258. https://doi.org/10.1287/mnsc.36.3.249
- Dyson, R. G., 2000. Strategy, performance and operational research. Journal of the Operational Research Society, 51 (1), 5–11. https://doi.org/10.2307/253942
- Dyson, R. G., O’Brien, F. A., Shah, D. B., 2021. Soft OR and practice: The contribution of the founders of operations research. Operations Research, 69 (3), 727–738. https://doi.org/10.1287/opre.2020.2051
- Dzidonu, C. K., Foster, F. G., 1993. Prolegomena to or modelling of the global environment-development problem. Journal of the Operational Research Society, 44 (4), 321–331. https://doi.org/10.2307/2584410
- Easton, K., Nemhauser, G., Trick, M., 2001. The traveling tournament problem description and benchmarks. In T. Walsh (Ed.), Principles and practice of constraint programming—CP 2001: 7th International Conference, CP 2001 Paphos, Cyprus, 2001 Proceedings (pp. 580–584). Springer.
- Eden, C., 1989. Using cognitive mapping for strategic options development and analysis (SODA). In J. Rosenhead (Ed.), Rational analysis for a problematic world: Problem structuring methods for complexity, uncertainty, and conflict (pp. 21–42). Wiley.
- Eden, C., Ackermann, F., 2004. Cognitive mapping expert views for policy analysis in the public sector. European Journal of Operational Research, 152 (3), 615–630. https://doi.org/10.1016/S0377-2217(03)00061-4
- Eden, C., Ackermann, F., 2006. Where next for problem structuring methods. Journal of the Operational Research Society, 57 (7), 766–768. https://doi.org/10.1057/palgrave.jors.2602090
- Ederer, N., 2015. Evaluating capital and operating cost efficiency of offshore wind farms: A DEA approach. Renewable and Sustainable Energy Reviews, 42 (1), 1034–1046. https://doi.org/10.1016/j.rser.2014.10.071
- Edgeworth, F. Y., 1888. The mathematical theory of banking. Journal of the Royal Statistical Society, 51 (1), 113–127.
- Edmonds, J., 1965a. Maximum matching and a polyhedron with 0,1-vertices. Journal of Research of the National Bureau of Standards, 69B (1 and 2), 125. https://doi.org/10.6028/jres.069B.013
- Edmonds, J., 1965b. Paths, trees, and flowers. Canadian Journal of Mathematics. Journal Canadien de Mathematiques, 17, 449–467. https://doi.org/10.4153/CJM-1965-045-4
- Edmonds, J., Karp, R. M., 1972. Theoretical improvements in algorithmic efficiency for network flow problems. Journal of the ACM, 19 (2), 248–264. https://doi.org/10.1145/321694.321699
- Edwards, W., Barron, F., 1994. SMARTS and SMARTER: Improved simple methods for multiattribute utility measurement. Organizational Behavior and Human Decision Processes, 60 (3), 306–325. https://doi.org/10.1006/obhd.1994.1087
- Edwards, W., Miles, R., von Winterfeldt, D., 2007. Advances in decision analysis: From foundations to applications. Cambridge University Press, .
- Egerváry, E., 1931. Matrixok kombinatorius tulajdonságairol. Matematikai és Fizikai Lapok, 38, 16–28.
- Ehmke, J. F., Campbell, A. M., 2014. Customer acceptance mechanisms for home deliveries in metropolitan areas. European Journal of Operational Research, 233 (1), 193–207. https://doi.org/10.1016/j.ejor.2013.08.028
- Ehrgott, M., 2005. Multicriteria optimization (2nd ed.). Springer Verlag.
- Ehrhardt, R., 1984. (s, s) policies for a dynamic inventory model with stochastic lead times. Operations Research, 32 (1), 121–132. https://doi.org/10.1287/opre.32.1.121
- Eiselt, H., Marianov, V. (Eds.), 2011. Foundations of location analysis. In International series in operations research & management science. Springer.
- Eiselt, H., Marianov, V. (Eds.), 2015. Applications of location analysis. In International series in operations research & management science. Springer.
- Eisenbrand, F., Grandoni, F., Rothvoß, T., Schäfer, G., 2010. Connected facility location via random facility sampling and core detouring. Journal of Computer and System Sciences, 76, 709–726. https://doi.org/10.1016/j.jcss.2010.02.001
- El-Taha, M., Stidham, >Jr, S., 1999. Sample-path analysis of queueing systems. Kluwer Academic Publishers.
- Elçi, Ö., Hooker, J. N., Zhang, P., 2022. Structural properties of equitable and efficient distributions. Tech. Rep., Carnegie Mellon University, submitted.
- Eliashberg, J., Winkler, R. L., 1981. Risk sharing and group decision making. Management Science, 27 (11), 1221–1235. https://doi.org/10.1287/mnsc.27.11.1221
- Emeç, U., Çatay, B., Bozkaya, B., 2016. An adaptive large neighborhood search for an e-grocery delivery routing problem. Computers & Operations Research, 69, 109–125. https://doi.org/10.1016/j.cor.2015.11.008
- Emmeche, C., Køppe, S., Stjernfelt, F., 1997. Explaining emergence: Towards an ontology of levels. Journal for General Philosophy of Science, 28 (1), 83–117. https://doi.org/10.1023/A:1008216127933
- Engwerda, J., 2005. LQ dynamic optimization and differential games. John Wiley & Sons.
- Eppen, G. D., 1979. Note—effects of centralization on expected costs in a multi-location newsboy problem. Management Science, 25 (5), 498–501. https://doi.org/10.1287/mnsc.25.5.498
- Eppler, M. J., Aeschimann, M., 2009. A systematic framework for risk visualization in risk management and communication. Risk Management: An International Journal, 11 (2), 67–89. https://doi.org/10.1057/rm.2009.4
- Eppler, M. J., Burkhard, R., 2008. Knowledge visualization. In E. Jennex (Ed.), Knowledge management: concepts, methodologies, tools, and applications (pp. 987–999). IGI Global.
- Eppler, M. J., Kernbach, S., 2016. Dynagrams: Enhancing design thinking through dynamic diagrams. Design Studies, 47, 91–117. https://doi.org/10.1016/j.destud.2016.09.001
- Eppler, M. J., Platts, K. W., 2009. Visual strategizing: The systematic use of visualization in the strategic-planning process. Long Range Planning, 42 (1), 42–74. https://doi.org/10.1016/j.lrp.2008.11.005
- Epure, M., Kerstens, K., Prior, D., 2011. Bank productivity and performance groups: A decomposition approach based upon the Luenberger productivity indicator. European Journal of Operational Research, 211 (3), 630–641. https://doi.org/10.1016/j.ejor.2011.01.041
- Erdoğan, G., Stylianou, N., Vasilakis, C., 2019. An open source decision support system for facility location analysis. Decision Support Systems, 125, 113116. https://doi.org/10.1016/j.dss.2019.113116
- Erdoğan, G., 2017. An open source spreadsheet solver for vehicle routing problems. Computers & Operations Research, 84, 62–72. https://doi.org/10.1016/j.cor.2017.02.022
- Erera, A., Hewitt, M., Savelsbergh, M., Zhang, Y., 2013. Improved load plan design through integer programming based local search. Transportation Science, 47 (3), 412–427. https://doi.org/10.1287/trsc.1120.0441
- Erkut, E., Neuman, S., 1989. Analytical models for locating undesirable facilities. European Journal of Operational Research, 40 (3), 275–291. https://doi.org/10.1016/0377-2217(89)90420-7
- Erlang, A. K., 1909. The theory of probabilities and telephone conversations. Nyt Tidsskrift for Matematik B, 20, 33–39.
- Ernst, A. T., Jiang, H., Krishnamoorthy, M., Sier, D., 2004. Staff scheduling and rostering: A review of applications, methods and models. European Journal of Operational Research, 153, 3–27. https://doi.org/10.1016/S0377-2217(03)00095-X
- Esmail, B. A., Geneletti, D., 2018. Multi-criteria decision analysis for nature conservation: A review of 20 years of applications. Methods in Ecology and Evolution, 9 (1), 42–53. https://doi.org/10.1111/2041-210X.12899
- Espejo, R., Harnden, R., 1989. The viable system model: Interpretations and applications of Stafford Beer’s VSM. Wiley.
- Essid, H., Ouellette, P., Vigeant, S., 2010. Measuring efficiency of Tunisian schools in the presence of quasi-fixed inputs: A bootstrap data envelopment analysis approach. Economics of Education Review, 29 (4), 589–596. https://doi.org/10.1016/j.econedurev.2009.10.014
- Esteve, M., Aparicio, J., Rabasa, A., Rodriguez-Sala, J. J., 2020. Efficiency analysis trees: A new methodology for estimating production frontiers through decision trees. Expert Systems with Applications, 162, 113783. https://doi.org/10.1016/j.eswa.2020.113783
- EURO Meets NeurIPS 2022. 2022. Vehicle routing competition. Retrieved September 14, 2021. http://www.verolog.eu/.
- Eveborn, P., Rönnqvist, M., Einarsdóttir, H., Eklund, M., Lidén, K., Almroth, M., 2009. Operations research improves quality and efficiency in home care. Interfaces, 39 (1), 18–34. https://doi.org/10.1287/inte.1080.0411
- EWG PATAT. 1996. EURO working group on automated timetabling. Retrieved October 9, 2022. https://patat.cs.kuleuven.be
- Ewing, P. L., Tarantino, W., Parnell, G. S., 2006. Use of decision analysis in the army base realignment and closure (BRAC) 2005 military value analysis. Decision Analysis, 3 (1), 33–49. https://doi.org/10.1287/deca.1060.0062
- Facsimile Simulation Library. 2021. Facsimile. https://github.com/facsimile/facsimile
- Fagerholt, K., Laporte, G., Norstad, I., 2010. Reducing fuel emissions by optimizing speed on shipping routes. Journal of the Operational Research Society, 61 (3), 523–529. https://doi.org/10.1057/jors.2009.77
- Fagerholt, K., Ronen, D., 2013. Bulk ship routing and scheduling: Solving practical problems may provide better results. Maritime Policy & Management, 40 (1), 48–64. https://doi.org/10.1080/03088839.2012.744481
- Fairbrother, J., Zografos, K. G., Glazebrook, K. D., 2020. A slot-scheduling mechanism at congested airports that incorporates efficiency, fairness, and airline preferences. Transportation Science, 54 (1), 115–138. https://doi.org/10.1287/trsc.2019.0926
- Fairley, M., Scheinker, D., Brandeau, M. L., 2019. Improving the efficiency of the operating room environment with an optimization and machine learning model. Health Care Management Science, 22 (4), 756–767. https://doi.org/10.1007/s10729-018-9457-3
- Fan, H., Sundaresan, S. M., 2000. Debt valuation, renegotiation, and optimal dividend policy. The Review of Financial Studies, 13 (4), 1057–1099. https://doi.org/10.1093/rfs/13.4.1057
- Fang, S.-C., Puthenpura, S., 1993. Linear optimization and extensions: Theory and algorithms. Prentice Hall.
- Farahani, R. Z., Miandoabchi, E., Szeto, W. Y., Rashidi, H., 2013. A review of urban transportation network design problems. European Journal of Operational Research, 229 (2), 281–302. https://doi.org/10.1016/j.ejor.2013.01.001
- Farahani, R. Z., Ruiz, R., Van Wassenhove, L. N., 2023. Introduction to the special issue on the role of operational research in future epidemics/pandemics. European Journal of Operational Research, 304 (1), 1–8. https://doi.org/10.1016/j.ejor.2022.07.019[PMC] URL https://www.sciencedirect.com/science/article/pii/S0377221722005720
- Färe, R., Grosskopf, S., 2000. Network DEA. Socio-Economic Planning Sciences, 34 (1), 35–49. https://doi.org/10.1016/S0038-0121(99)00012-9
- Färe, R., Grosskopf, S., Lindgren, B., Roos, P., 1992. Productivity changes in Swedish pharamacies 1980–1989: A non-parametric Malmquist approach. Journal of Productivity Analysis, 3 (1), 85–101. https://doi.org/10.1007/BF00158770
- Fasolo, B., Bana e Costa, C. A., 2014. Tailoring value elicitation to decision makers’ numeracy and fluency: Expressing value judgments in numbers or words. Omega, 44, 83–90. https://doi.org/10.1016/j.omega.2013.09.006
- Fatnassi, E., Chaouachi, J., Klibi, W., 2015. Planning and operating a shared goods and passengers on-demand rapid transit system for sustainable city-logistics. Transportation Research Part B: Methodological, 81, 440–460. https://doi.org/10.1016/j.trb.2015.07.016
- Fauske, M. F., Hoff, E. Ø., 2016. From F-16 to F-35: Optimizing the training of pilots in the Royal Norwegian Air Force. Interfaces, 46 (4), 326–333. https://doi.org/10.1287/inte.2016.0850
- Federgruen, A., 1993. Centralized planning models for multi-echelon inventory systems under uncertainty. Handbooks in Operations Research and Management Science, 4, 133–173.
- Federgruen, A., Prastacos, G., Zipkin, P. H., 1986. An allocation and distribution model for perishable products. Operations Research, 34 (1), 75–82. https://doi.org/10.1287/opre.34.1.75
- Federgruen, A., Zipkin, P., 1984a. A combined vehicle routing and inventory allocation problem. Operations Research, 32 (5), 1019–1037. https://doi.org/10.1287/opre.32.5.1019
- Federgruen, A., Zipkin, P., 1984b. Computational issues in an infinite-horizon, multiechelon inventory model. Operations Research, 32 (4), 818–836. https://doi.org/10.1287/opre.32.4.818
- Federgruen, A., Zipkin, P., 1986a. An inventory model with limited production capacity and uncertain demands I. The average-cost criterion. Mathematics of Operations Research, 11 (2), 193–207. https://doi.org/10.1287/moor.11.2.193
- Federgruen, A., Zipkin, P., 1986b. An inventory model with limited production capacity and uncertain demands II. The discounted-cost criterion. Mathematics of Operations Research, 11 (2), 208–215. https://doi.org/10.1287/moor.11.2.208
- Feitzinger, E., Lee, H. L., 1997. Mass customization at Hewlett-Packard: The power of postponement. Harvard Business Review, 75 (1), 116–121.
- Feller, W., 1957a. An introduction to probability theory and its applications (Vol. I). Wiley.
- Feller, W., 1957b. An introduction to probability theory and its applications (Vol. II). Wiley.
- Feng, Y., Gallego, G., 1995. Optimal starting times for end-of-season sales and optimal stopping times for promotional fares. Management Science, 41 (8), 1371–1391. https://doi.org/10.1287/mnsc.41.8.1371
- Fenger, J., Halsnaes, K., Larsen, H., Schroll, H., Vidal, V., 1991. Environment, energy and natural resources management in the Baltic Sea region. Nordic Council of Ministers.
- Ferguson, M., Guide, Jr, V. D., Koca, E., Souza, G. C., 2009. The value of quality grading in remanufacturing. Production and Operations Management, 18 (3), 300–314. https://doi.org/10.1111/j.1937-5956.2009.01033.x
- Ferguson, M. E., Souza, G. C., 2010. Closed-loop supply chains: New developments to improve the sustainability of business practices. CRC Press.
- Ferguson, N., Laydon, D., Nedjati Gilani, G Imai, N., Ainslie, K., Baguelin, M., Bhatia, S., Boonyasiri, A., Cucunuba Perez, Z., Cuomo-Dannenburg, G., Dighe, A., Dorigatti, I., Fu, H., Gaythorpe, K., Green, W., Hamlet, A., Hinsley, W., Okell, L., Van Elsland, S., Thompson, H., Verity, R., Volz, E., Wang, H., Wang, Y., Walker, P., Walters, C., Winskill, P., Whittaker, C., Donnelly, C., Riley, S., Ghani, A., 2020. Report 9: Impact of non-pharmaceutical interventions (NPIs) to reduce COVID19 mortality and healthcare demand. Tech. Rep., Imperial College London.
- Fernández, E., Landete, M., 2019. Fixed-charge facility location problems. In G. Laporte, S. Nickel, F. Saldanha da Gama (Eds.), Location science (pp. 67–98). Springer.
- Fernández, J., Bornn, L., Cervone, D., 2021. A framework for the fine-grained evaluation of the instantaneous expected value of soccer possessions. Machine Learning, 110 (6), 1389–1427. https://doi.org/10.1007/s10994-021-05989-6
- Ferrer, G., Whybark, D. C., 2001. Material planning for a remanufacturing facility. Production and Operations Management, 10 (2), 112–124. https://doi.org/10.1111/j.1937-5956.2001.tb00073.x
- Ferrer, J. M., Martín-Campo, F. J., Ortuño, M. T., Pedraza-Martínez, A. J., Tirado, G., Vitoriano, B., 2018. Multi-criteria optimization for last mile distribution of disaster relief aid: Test cases and applications. European Journal of Operational Research, 269 (2), 501–515. https://doi.org/10.1016/j.ejor.2018.02.043
- Ferretti, V., Montibeller, G., 2019. An integrated framework for environmental Multi-Impact spatial risk analysis. Risk Analysis, 39 (1), 257–273. https://doi.org/10.1111/risa.12942
- Ferretti, V., Pluchinotta, I., Tsoukiàs, A., 2019. Studying the generation of alternatives in public policy making processes. European Journal of Operational Research, 273 (1), 353–363. https://doi.org/10.1016/j.ejor.2018.07.054
- Fiacco, A. V., McCormick, G. P., 1968. Nonlinear programming: Sequential unconstrained minimization technique. Wiley.
- Figueira, J., Greco, S., Roy, B., Słowiński, R., 2013. An overview of ELECTRE methods and their recent extensions. Journal of Multi-Criteria Decision Analysis, 20 (1–2), 61–85. https://doi.org/10.1002/mcda.1482
- Figueira, J., Mousseau, V., Roy, B., 2016. ELECTRE methods. In S. Greco, M. Ehrgott, J. R. Figueira (Eds.), Multiple criteria decision analysis (pp. 155–185). Springer-Verlag.
- Fildes, R., Goodwin, P., Lawrence, M., Nikolopoulos, K., 2009. Effective forecasting and judgmental adjustments: An empirical evaluation and strategies for improvement in supply-chain planning. International Journal of Forecasting, 25 (1), 3–23. https://doi.org/10.1016/j.ijforecast.2008.11.010
- Fildes, R., Goodwin, P., Önkal, D., 2019. Use and misuse of information in supply chain forecasting of promotion effects. International Journal of Forecasting, 35 (1), 144–156. https://doi.org/10.1016/j.ijforecast.2017.12.006
- Fildes, R., Ranyard, J. C., 1997. Success and survival of operational research Groups-A review. Journal of the Operational Research Society, 48 (4), 336–360. https://doi.org/10.2307/3010262
- Filsfils, C., Kumar Nainar, N., Pignataro, C., Camilo Cardona, J., François, P., 2015. The segment routing architecture. In IEEE Global Communications Conference (GLOBECOM) (pp. 1–6).
- Fioole, P.-J., Kroon, L., Maróti, G., Schrijver, A., 2006. A rolling stock circulation model for combining and splitting of passenger trains. European Journal of Operational Research, 174 (2), 1281–1297. https://doi.org/10.1016/j.ejor.2005.03.032
- Firoozi, D., Caines, P. E., 2017. The execution problem in finance with major and minor traders: A mean field game formulation. In J. Apaloo & B. Viscolani (Eds.), Annals of the international society of dynamic games (ISDG): Advances in dynamic and mean field games (Vol. 15, pp. 107–130). Birkhäuser.
- Fischetti, M., Glover, F., Lodi, A., 2005. The feasibility pump. Mathematical Programming, 104, 91–104. https://doi.org/10.1007/s10107-004-0570-3
- Fischetti, M., Leitner, M., Ljubić, I., Luipersbeck, M., Monaci, M., Resch, M., Salvagnin, D., Sinnl, M., 2017a. Thinning out Steiner trees: A node-based model for uniform edge costs. Mathematical Programming Computation, 9 (2), 203–229. https://doi.org/10.1007/s12532-016-0111-0
- Fischetti, M., Ljubić, I., Sinnl, M., 2017b. Redesigning benders decomposition for large-scale facility location. Management Science, 63 (7), 2146–2162. https://doi.org/10.1287/mnsc.2016.2461
- Fischetti, M., Lodi, A., 2003. Local branching. Mathematical Programming, 98, 23–47. https://doi.org/10.1007/s10107-003-0395-5
- Fisher, M., 1997. What is the right supply chain for your product? Harvard Business Review March–April, 105–116.
- Fisher, M., Gallino, S., Li, J., 2018. Competition-based dynamic pricing in online retailing: A methodology validated with field experiments. Management Science, 64 (6), 2496–2514. https://doi.org/10.1287/mnsc.2017.2753
- Fisher, M. L., 1981. The Lagrangian relaxation method for solving integer programming problems. Management Science, 27 (1), 1–18. https://doi.org/10.1287/mnsc.27.1.1
- Fleckenstein, D., Klein, R., Steinhardt, C., 2022. Recent advances in integrating demand management and vehicle routing: A methodological review. European Journal of Operational Research.
- Fleischmann, M., 2003. Reverse logistics network structures and design. In V. D. R. Guide & L. N. Van Wassenhove (Eds.), Business aspects of closed-loop supply chains. Carnegie Mellon University Press.
- Fleischmann, M., Bloemhof-Ruwaard, J. M., Beullens, P., Dekker, R., 2004. Reverse logistics network design. In R. Dekker, M. Fleischmann, K. Inderfurth, L. N. Van Wassenhove (Eds.), Reverse logistics: Quantitative models for closed-loop supply chains (pp. 65–94). Springer-Verlag.
- Flood, M., 1956. The traveling-salesman problem. Operations Research, 4 (1), 61–75. https://doi.org/10.1287/opre.4.1.61
- Flood, R. L., Jackson, M. C., 1991a. Creative problem solving: Total systems intervention. Wiley.
- Flood, R. L., Jackson, M. C. (Eds.), 1991b. Critical systems thinking: directed readings. Wiley.
- Flood, R. L., Romm, N. R. A., 1996. Critical systems thinking: Current research and practice. Plenum.
- Fone, D., Hollinghurst, S., Temple, M., Round, A., Lester, N., Weightman, A., Roberts, K., Coyle, E., Bevan, G., Palmer, S., 2003. Systematic review of the use and value of computer simulation modelling in population health and health care delivery. Journal of Public Health Medicine, 25 (4), 325–335. https://doi.org/10.1093/pubmed/fdg075
- Ford, L. R., Fulkerson, D. R., 1957. A simple algorithm for finding the maximum network flows and an application to the hitchcock problem. Canadian Journal of Mathematics, 9, 210–218. https://doi.org/10.4153/CJM-1957-024-0
- Ford, L. R., Fulkerson, D. R., 1962. Flows in networks. Princeton University Press.
- Forest, J., Vigerske, S., Ralphs, T., Hafer, L., Gambini, H., Matthew Saltzman, S., Kristjansson, B., King, A., 2022. CLP. https://projects.coin-or.org/Clp
- Forrest, D., Simmons, R., 2002. Outcome uncertainty and attendance demand in sport: The case of English soccer. Journal of the Royal Statistical Society. Series D (The Statistician), 51 (2), 229–241. https://doi.org/10.1111/1467-9884.00314
- Forrest, J., Ralphs, T., Santos, H., Vigerske, S., Hafer, L., Kristjansson, B., Straver, E., Lubin, M., Brito, S., Saltzman, M., Pitrus, B., Matsushima, H., 2022. CBC. https://projects.coin-or.org/Bcp
- Forrester, J. W., 1958. Industrial dynamics—A major breakthrough for decision makers. Harvard Business Review, 36 (4), 37–66.
- Forrester, J. W., 1961. Industrial dynamics. MIT Press.
- Fortz, B., 2011. Applications of meta-heuristics to traffic engineering in IP networks. International Transactions in Operational Research, 18 (2), 131–147. https://doi.org/10.1111/j.1475-3995.2010.00776.x
- Fortz, B., 2015. Location problems in telecommunications. In G. Laporte, S. Nickel, & F. Saldanha da Gama (Eds.), Location science (pp. 537–554). Springer.
- Fortz, B., 2021. Topology-constrained network design. In T. G. Crainic, M. Gendreau, & B. Gendron (Eds.), Network design with applications to transportation and logistics (pp. 187–208). Springer.
- Fortz, B., Labbé, M., 2006. Design of survivable networks. In M. Resende & P. Pardalos (Eds.), Handbook of optimization in telecommunications (pp. 367–389). Springer.
- Fortz, B., Labbé, M., Maffioli, F., 2000. Solving the two-connected network with bounded meshes problem. Operations Research, 48 (6), 866–877. https://doi.org/10.1287/opre.48.6.866.12390
- Fortz, B., Thorup, M., 2000. Internet traffic engineering by optimizing OSPF weights. In Proceedings of the 19th IEEE Conference on Computer Communications (INFOCOM) (pp. 519–528).
- Foss, S., Korshunov, D., 2012. On large delays in multi-server queues with heavy tails. Mathematics of Operations Research, 37 (2), 201–218. https://doi.org/10.1287/moor.1120.0539
- Foulds, L. R., 1983. The heuristic problem-solving approach. Journal of the Operational Research Society, 34 (10), 927–934. https://doi.org/10.2307/2580891
- Fourier, J. B. J., 1826a. Analyse des travaux de l’Académie Royale des Sciences, pendant l’année 1823. Partie mathématique, Histoire de l’Académie Royale des Sciences de l’Institut de France, 6, xxix–xli.
- Fourier, J. B. J., 1826b. Solution d’une question particuliére du calcul des inégalités. Nouveau Bulletin des Sciences par la Société Philomatique de Paris, 99–100.
- Fox, W. P., Burks, R., 2019. Applications of operations research and management science for military decision making. Springer.
- Fragapane, G., De Koster, R., Sgarbossa, F., Strandhagen, J. O., 2021. Planning and control of autonomous mobile robots for intralogistics: Literature review and research agenda. European Journal of Operational Research, 294 (2), 405–426. https://doi.org/10.1016/j.ejor.2021.01.019
- Francis, R., McGinnis, L., White, J., 2004. Facility layout and location: An analytical approach. In Prentice-Hall international series in industrial and systems engineering. Prentice Hall.
- Franco, C., Herazo-Padilla, N., Castañeda, J. A., 2022. A queueing network approach for capacity planning and patient scheduling: A case study for the COVID-19 vaccination process in colombia. Vaccine, 40 (49), 7073–7086. https://doi.org/10.1016/j.vaccine.2022.09.079
- Franco, L. A., Hämäläinen, R. P., 2016a. Feature cluster: Behavioural operational research. European Journal of Operational Research, 249 (3), 791–1073. https://doi.org/10.1016/j.ejor.2015.10.034
- Franco, L. A., 2013. Rethinking soft OR interventions: Models as boundary objects. European Journal of Operational Research, 231 (3), 720–733.
- Franco, L. A., Cushman, M., Rosenhead, J., 2004. Project review and learning in the construction industry: Embedding a problem structuring method within a partnership context. European Journal of Operational Research, 152 (3), 586–601. https://doi.org/10.1016/S0377-2217(03)00059-6
- Franco, L. A., Greiffenhagen, C., 2018. Making OR practice visible: Using ethnomethodology to analyse facilitated modelling workshops. European Journal of Operational Research, 265 (2), 673–684. https://doi.org/10.1016/j.ejor.2017.08.016
- Franco, L. A., Hämäläinen, R. P., 2016. Behavioural operational research: Returning to the roots of the OR profession. European Journal of Operational Research, 249 (3), 791–795. https://doi.org/10.1016/j.ejor.2015.10.034
- Franco, L. A., Hämäläinen, R. P., Rouwette, E. A. J. A., Leppänen, I., 2021. Taking stock of behavioural OR: A review of behavioural studies with an intervention focus. European Journal of Operational Research, 293 (2), 401–418. https://doi.org/10.1016/j.ejor.2020.11.031
- Franco, L. A., Montibeller, G., 2010. Facilitated modelling in operational research. European Journal of Operational Research, 205 (3), 489–500. https://doi.org/10.1016/j.ejor.2009.09.030
- Franco, L. A., Rouwette, E. A. J. A., 2022. Problem structuring methods: Taking stock and looking ahead. In S. Salhi & J. Boylan (Eds.), The Palgrave handbook of operations research (pp. 735–780). Springer.
- Franco, L. A., Rouwette, E. A. J. A., Korzilius, H., 2016b. Different paths to consensus? The impact of need for closure on model-supported group conflict management. European Journal of Operational Research, 249 (3), 878–889. https://doi.org/10.1016/j.ejor.2015.06.056
- Frangioni, A., Gendron, B., 2021. Piecewise linear cost network design. In T. G. Crainic, M. Gendreau, & B. Gendron (Eds.), Network design with applications to transportation and logistics (pp. 167–185). Springer.
- Franke, M., 2017. Network design strategies. In P. J. Bruce, Y. Gao, & J. M. C. King (Eds.), Airline operations (pp. 44–60). Routledge.
- Franses, P. H., van Dijk, D., Opschoor, A., 2014. Time series models for business and economic forecasting. Cambridge University Press.
- Fraunholz, C., Kraft, E., Keles, D., Fichtner, W., 2021. Advanced price forecasting in agent-based electricity market simulation. Applied Energy, 290, 116688. https://doi.org/10.1016/j.apenergy.2021.116688
- Färe, R., Grosskopf, S., Logan, J., 1983. The relative efficiency of Illinois electric utilities. Resources and Energy, 5 (4), 349–367. https://doi.org/10.1016/0165-0572(83)90033-6
- Färe, R., Grosskopf, S., Tyteca, D., 1996. An activity analysis model of the environmental performance of firms—Application to fossil-fuel-fired electric utilities. Ecological Economics, 18 (2), 161–175. https://doi.org/10.1016/0921-8009(96)00019-5
- Freeman, S. (Ed.), 2003. The Cambridge companion to rawls. Cambridge University Press.
- Fregonara, E., Curto, R., Grosso, M., Mellano, P., Rolando, D., Tulliani, J.-M., 2013. Environmental technology, materials science, architectural design, and real estate market evaluation: A multidisciplinary approach for energy-efficient buildings. Journal of Urban Technology, 20 (4), 57–80. https://doi.org/10.1080/10630732.2013.855512
- French, S., 2022. From soft to hard elicitation. Journal of the Operational Research Society, 73 (6), 1181–1197. https://doi.org/10.1080/01605682.2021.1907244
- French, S., Geldermann, J., 2005. The varied contexts of environmental decision problems and their implications for decision support. Environmental Science & Policy, 8 (4), 378–391. https://doi.org/10.1016/j.envsci.2005.04.008
- Friend, J., 1989. The strategic choice approach. In J. Rosenhead (Ed.), Rational analysis for a problematic world: Problem structuring methods for complexity, uncertainty, and conflict (pp. 121–158). Wiley.
- Friesl, M., Lenten, L. J. A., Libich, J., Stehlík, P., 2017. In search of goals: Increasing ice hockey’s attractiveness by a sides swap. Journal of the Operational Research Society, 68 (9), 1006–1018. https://doi.org/10.1057/s41274-017-0243-2
- Fritzson, P., Pop, A., Abdelhak, K., Ashgar, A., Bachmann, B., Braun, W., Bouskela, D., Braun, R., Buffoni, L., Casella, F., Castro, R., Franke, R., Fritzson, D., Gebremedhin, M., Heuermann, A., Lie, B., Mengist, A., Mikelsons, L., Moudgalya, K., Ochel, L., Palanisamy, A., Ruge, V., Schamai, W., Sjölund, M., Thiele, B., Tinnerholm, J., Östlund, P., 2020. The OpenModelica integrated environment for modeling, simulation, and model-based development. Modeling, Identification and Control, 41 (4), 241–295. https://doi.org/10.4173/mic.2020.4.1
- Fu, M. C., Glover, F. W., April, J., 2005. Simulation optimization: A review, new developments, and applications. In M. E. Kuhl, N. M. Steiger, F. B. Armstrong, J. A. Joines (Eds.), Proceedings of the Winter Simulation Conference , 2005 (pp. 1–13).
- Fügener, A., Hans, E. W., Kolisch, R., Kortbeek, N., Vanberkel, P. T., 2014. Master surgery scheduling with consideration of multiple downstream units. European Journal of Operational Research, 239 (1), 227–236. https://doi.org/10.1016/j.ejor.2014.05.009
- Fukasawa, R., Longo, H., Lysgaard, J., Poggi, M., 2006. Robust branch-and-cut-and-price for the capacitated vehicle routing problem. Mathematical Programming, 106 (3), 491–511. https://doi.org/10.1007/s10107-005-0644-x
- Fukuda, Y., 1964. Optimal policies for the inventory problem with negotiable leadtime. Management Science, 10 (4), 690–708. https://doi.org/10.1287/mnsc.10.4.690
- Fukuyama, H., Weber, W. L., 2009. A directional slacks-based measure of technical inefficiency. Socio-Economic Planning Sciences, 43 (4), 274–287. https://doi.org/10.1016/j.seps.2008.12.001
- Gaalman, G., 2006. Bullwhip reduction for ARMA demand: The proportional order-up-to policy versus the full-state-feedback policy. Automatica, 42 (8), 1283–1290. https://doi.org/10.1016/j.automatica.2006.04.017
- Gaalman, G., Disney, S. M., Wang, X., 2022. When bullwhip increases in the lead time: An eigenvalue analysis of ARMA demand. International Journal of Production Economics, 250, 108623. https://doi.org/10.1016/j.ijpe.2022.108623
- Gács, P., Lovász, L., 1981. Khachiyan’s algorithm for linear programming. In H. König, B. Korte, & K. Ritter (Eds.), Mathematical programming at Oberwolfach (pp. 61–68). Springer Berlin Heidelberg.
- Gaillard, P., Goude, Y., Nedellec, R., 2016. Additive models and robust aggregation for GEFCom2014 probabilistic electric load and electricity price forecasting. International Journal of Forecasting, 32 (3), 1038–1050. https://doi.org/10.1016/j.ijforecast.2015.12.001
- Galán, J. J., Carrasco, R. A., LaTorre, A., 2022. Military applications of machine learning: A bibliometric perspective. Science in China, Series A: Mathematics, 10 (9), 1397.
- Galbreth, M. R., Blackburn, J. D., 2006. Optimal acquisition and sorting policies for remanufacturing. Production and Operations Management, 15 (3), 384–392. https://doi.org/10.1111/j.1937-5956.2006.tb00252.x
- Galiullina, A., Mutlu, N., Kinable, J., Van Woensel, T., 2022. Demand steering in a last-mile delivery problem with multiple delivery channels. Working paper.
- Gallego, G., Moon, I., 1993. The distribution free newsboy problem: Review and extensions. Journal of the Operational Research Society, 44 (8), 825–834. https://doi.org/10.2307/2583894
- Gallego, G., Topaloğlu, H., 2019. Revenue management and pricing analytics. In International series in operations research & management science (Vol. 279). Springer.
- Gallego, G., van Ryzin, G., 1994. Optimal dynamic pricing of inventories with stochastic demand over finite horizons. Management Science, 40 (8), 999–1020. https://doi.org/10.1287/mnsc.40.8.999
- Gallego, G., van Ryzin, G., 1997. A multiproduct dynamic pricing problem and its applications to network yield management. Operations Research, 45 (1), 24–41. https://doi.org/10.1287/opre.45.1.24
- Gamrath, G., Koch, T., Maher, S. J., Rehfeldt, D., Shinano, Y., 2017. SCIP-Jack—A solver for STP and variants with parallelization extensions. Mathematical Programming Computation, 9 (2), 231–296. https://doi.org/10.1007/s12532-016-0114-x
- Gan, G., Lee, H.-S., 2022. Measuring group performance based on metafrontier. Journal of the Operational Research Society, 73 (10), 2261–2274. https://doi.org/10.1080/01605682.2021.1973351
- Gao, W., Darvishan, A., Toghani, M., Mohammadi, M., Abedinia, O., Ghadimi, N., 2019. Different states of multi-block based forecast engine for price and load prediction. International Journal of Electrical Power and Energy Systems, 104, 423–435. https://doi.org/10.1016/j.ijepes.2018.07.014
- García, S., Marín, A., 2019. Covering location problems. In G. Laporte, S. Nickel, & F. Saldanha da Gama (Eds.), Location science (pp. 99–119). Springer.
- Gardner, E. S., 2006. Exponential smoothing: The state of the art – Part II. International Journal of Forecasting, 22 (4), 637–666. https://doi.org/10.1016/j.ijforecast.2006.03.005
- Gardner, K., Righter, R., 2020. Product forms for FCFS queueing models with arbitrary server-job compatibilities: An overview. Queueing Systems, 96 (1), 3–51. https://doi.org/10.1007/s11134-020-09668-6
- Garey, M., Johnson, D., 1979. Computers and intractability: A guide to the theory of NP-completeness. W.H. Freeman and Company.
- Garfinkel, R., Nemhauser, G., 1972. Integer programming. John Wiley&Sons.
- Garrett, B., 2014. 3D printing: New economic paradigms and strategic shifts. Global Policy, 5 (1), 70–75. https://doi.org/10.1111/1758-5899.12119
- Gary, M. S., Kunc, M., Morecroft, J. D. W., Rockart, S. F., 2008. System dynamics and strategy. System Dynamics Review, 24 (4), 407–429. https://doi.org/10.1002/sdr.402
- Gasse, M., Chetelat, D., Ferroni, N., Charlin, L., Lodi, A., 2019. Exact combinatorial optimization with graph convolutional neural networks. In H. Wallach, H. Larochelle, A. Beygelzimer, F. d’ Alché-Buc, E. Fox, & R. Garnett (Eds.), Advances in neural information processing systems (Vol. 32). Curran Associates, Inc.
- Gaur, V., Fisher, M. L., 2004. A periodic inventory routing problem at a supermarket chain. Operations Research, 52 (6), 813–822. https://doi.org/10.1287/opre.1040.0150
- Gautam, N., 2012. Analysis of queues: Methods and applications. CRC Press.
- Gauthier, D., 1983. Morals by agreement. Oxford University Press.
- Geis, J. P., Parnell, G. S., Newton, H., Bresnick, T., 2011. Blue horizons study assesses future capabilities and technologies for the United States Air Force. Interfaces, 41 (4), 338–353. https://doi.org/10.1287/inte.1110.0556
- Geldermann, J., Bertsch, V., Treitz, M., French, S., Papamichail, K. N., Hämäläinen, R. P., 2009. Multi-criteria decision support and evaluation of strategies for nuclear remediation management. Omega, 37 (1), 238–251. https://doi.org/10.1016/j.omega.2006.11.006
- Gendreau, M., Ghiani, G., Guerriero, E., 2015. Time-dependent routing problems: A review. Computers & Operations Research, 64, 189–197. https://doi.org/10.1016/j.cor.2015.06.001
- Gendreau, M., Jabali, O., Rei, W., 2016. 50th anniversary invited article—Future research directions in stochastic vehicle routing. Transportation Science, 50 (4), 1163–1173. https://doi.org/10.1287/trsc.2016.0709
- Gendreau, M., Potvin, J.-Y., 2010. Handbook of metaheuristics (Vol. 2). Springer.
- Geng, X., Xie, L., 2019. Data-driven decision making in power systems with probabilistic guarantees: Theory and applications of chance-constrained optimization. Annual Reviews in Control, 47, 341–363. https://doi.org/10.1016/j.arcontrol.2019.05.005
- Gentili, M., Mirchandani, P. B., Agnetis, A., Ghelichi, Z., 2022. Locating platforms and scheduling a fleet of drones for emergency delivery of perishable items. Computers & Industrial Engineering, 168, 108057. https://www.sciencedirect.com/science/article/pii/S0360835222001279https://doi.org/10.1016/j.cie.2022.108057
- Georgantas, A., Doumpos, M., Zopounidis, C., 2021. Robust optimization approaches for portfolio selection: A comparative analysis. Annals of Operations Research. https://doi.org/10.1007/s10479-021-04177-y
- Gettinger, J., Kiesling, E., Stummer, C., Vetschera, R., 2013. A comparison of representations for discrete multi-criteria decision problems. Decision Support Systems, 54 (2), 976–985. https://doi.org/10.1016/j.dss.2012.10.023
- Ghamlouche, I., Crainic, T. G., Gendreau, M., 2003. Cycle-based neighbourhoods for fixed-charge capacitated multicommodity network design. Operations Research, 51 (4), 655–667. https://doi.org/10.1287/opre.51.4.655.16098
- Ghelichi, Z., Gentili, M., Mirchandani, P. B., 2021. Logistics for a fleet of drones for medical item delivery: A case study for louisville, ky. Computers & Operations Research, 135, 105443. https://www.sciencedirect.com/science/article/pii/S0305054821001970https://doi.org/10.1016/j.cor.2021.105443
- Giacco, G. L., Carillo, D., D’Ariano, A., Pacciarelli, D., Marín, A., 2014. Short-term rail rolling stock rostering and maintenance scheduling. Transportation Research Procedia, 3, 651–659. https://doi.org/10.1016/j.trpro.2014.10.044
- Gilbert, E. G., 1963. Controllability and observability in multivariable control systems. Journal of the Society for Industrial and Applied Mathematics, Series A: Control, 1 (2), 128–151. https://doi.org/10.1137/0301009
- Gilboa, I., Minardi, S., Samuelson, L., 2017. Cases and scenarios in decisions under uncertainty. HEC Paris Research Paper No. ECO/SCD-2017-1200, 1–49.
- Gilbreth, F. B., 1911. Motion study: A method for increasing the efficiency of the workman. D. Van Nostrand Company.
- Gillies, D., 1953. Some theorems on n-person games [Ph.D. thesis]. Princeton University.
- Gilmore, P. C., Gomory, R. E., 1965. Multistage cutting stock problems of two and more dimensions. Operations Research, 13 (1), 94–120. https://doi.org/10.1287/opre.13.1.94
- Gini, C., 1912. Variabilità e mutabilità. P. Cuppini, reprinted 1955. In E. Pizetti abd& T. Salvemini (Eds.), Memorie di metodologica statistica. Libreria Eredi Virgilio Veschi.
- Giovannini, M., Psaraftis, H. N., 2019. The profit maximizing liner shipping problem with flexible frequencies: Logistical and environmental considerations. Flexible Services and Manufacturing Journal, 31 (3), 567–597. https://doi.org/10.1007/s10696-018-9308-z
- Glaize, A., Duenas, A., Di Martinelly, C., Fagnot, I., 2019. Healthcare decision-making applications using multicriteria decision analysis: A scoping review. Journal of Multi-criteria Decision Analysis, 26 (1–2), 62–83. https://doi.org/10.1002/mcda.1659
- Glasgow, S. M., Perkins, Z. B., Tai, N. R. M., Brohi, K., Vasilakis, C., 2018. Development of a discrete event simulation model for evaluating strategies of red blood cell provision following mass casualty events. European Journal of Operational Research, 270 (1), 362–374. https://doi.org/10.1016/j.ejor.2018.03.008
- Glazebrook, K. D., Hodge, D. J., Kirkbride, C., Minty, R., 2014. Stochastic scheduling: A short history of index policies and new approaches to index generation for dynamic resource allocation. Journal of Scheduling, 17 (5), 407–425. https://doi.org/10.1007/s10951-013-0325-1
- Gleixner, A., Hendel, G., Gamrath, G., et al., 2021. MIPLIB 2017: Data-driven compilation of the 6th mixed-integer programming library. Mathematical Programming Computation, 13, 443–490. https://doi.org/10.1007/s12532-020-00194-3
- Glen, J. J., 1997. An infinite horizon mathematical programming model of a multicohort single species fishery. Journal of the Operational Research Society, 48 (11), 1095–1104. https://doi.org/10.2307/3010305
- Glickman, M. E., 2001. Dynamic paired comparison models with stochastic variances. Journal of Applied Statistics, 28 (6), 673–689. https://doi.org/10.1080/02664760120059219
- Glover, F., 1977. Heuristics for integer programming using surrogate constraints. Decision Sciences, 8 (1), 156–166. https://doi.org/10.1111/j.1540-5915.1977.tb01074.x
- Glover, F., 1986. Future paths for integer programming and links to artificial intelligence. Computers & Operations Research, 13 (5), 533–549. https://doi.org/10.1016/0305-0548(86)90048-1
- Glover, F., 1990. Tabu search: A tutorial. Interfaces, 20 (4), 74–94. https://doi.org/10.1287/inte.20.4.74
- Glover, F., 1998. A template for scatter search and path relinking. In J. K. Hao, E. Lutton, E. Ronald, M. Schoenauer, D. Snyers (Eds.), Lecture notes in computer science. Vol. 1363 of Lecture notes in computer science (pp. 1–51). Springer.
- Glover, F., Laguna, M., 1997. Tabu search. Springer US.
- Glover, F. W., Kochenberger, G. A., 2003. Handbook of metaheuristics. Springer Science & Business Media.
- Gneiting, T., Raftery, A. E., 2007. Strictly proper scoring rules, prediction, and estimation. Journal of the American Statistical Association, 102 (477), 359–378. https://doi.org/10.1198/016214506000001437
- Goemans, M. X., 1994. The Steiner tree polytope and related polyhedra. Mathematical Programming, 63 (1), 157–182. https://doi.org/10.1007/BF01582064
- Goemans, M. X., Olver, N., Rothvoß, T., Zenklusen, R., 2012. Matroids and integrality gaps for hypergraphic Steiner tree relaxations. In H. J. Karloff & T. Pitassi (Eds.), Proceedings of the 44th Symposium on Theory of Computing Conference , STOC 2012, May 19–22, 2012. ACM, New York, USA (pp. 1161–1176). https://doi.org/10.1145/2213977.2214081
- Goldberg, A. V., Hed, S., Kaplan, H., Kohli, P., Tarjan, R. E., Werneck, R. F., 2015. Faster and more dynamic maximum flow by incremental breadth-first search. In N. Bansal & I. Finocchi (Eds.), Algorithms - ESA 2015 - 23rd Annual European Symposium, Patras, Greece, September 14–16, 2015, Proceedings. Vol. 9294 of Lecture Notes in Computer Science. Springer (pp. 619–630).
- Goldberg, A. V., Tarjan, R. E., 1988. A new approach to the maximum-flow problem. Journal of the ACM, 35 (4), 921–940. https://doi.org/10.1145/48014.61051
- Goldberg, A. V., Tarjan, R. E., 2014. Efficient maximum flow algorithms. Communications of the ACM, 57 (8), 82–89. https://doi.org/10.1145/2628036
- Golden, B., Raghavan, S., Wasil, E. (Eds.), 2008. The vehicle routing problem: Latest advances and new challenges. Springer.
- Goldfarb, D., Todd, M. J., 1989. Chapter II linear programming. In G. L. Nemhauser, A. H. G. Rinnooy Kan, & M. J. Todd (Eds.), Handbooks in operations research and management science (Vol. 1, pp. 73–170). Elsevier.
- Goldratt, E. M., 1997. Critical chain. North River Press.
- Gollowitzer, S., Ljubić, I., 2011. MIP models for connected facility location: A theoretical and computational study. Computers & Operations Research, 38, 435–449. https://doi.org/10.1016/j.cor.2010.07.002
- Gomes, D., Saúde, J., 2014. Mean field games models—A brief survey. Dynamic Games and Applications, 4, 110–154. https://doi.org/10.1007/s13235-013-0099-2
- Gomes, L. F. A. M., Lima, M. M. P. P. 1991. Todim: Basics and application to multicriteria ranking of projects with environmental impact. Foundations of Computing and Decision Sciences, 16 (3–4), 1–16.
- Gómez-Rocha, J. E., Hernández-Gress, E. S., 2022. A stochastic programming model for multi-product aggregate production planning using valid inequalities. NATO Advanced Science Institutes series E: Applied sciences, 12 (19), 9903. https://doi.org/10.3390/app12199903
- Gomory, R., 1958. Outline of an algorithm for integer solutions to linear programs. Bulletin of the American Mathematical Society, 64, 275–278. https://doi.org/10.1090/S0002-9904-1958-10224-4
- Gomory, R., 1960. An algorithm for the mixed integer problem. Tech. Rep. RM-2597, RAND Corporation.
- Gomory, R., 1969. Some polyhedra related to combinatorial problems. Linear Algebra and its Applications, 2, 451–558. https://doi.org/10.1016/0024-3795(69)90017-2
- Gomory, R. E., Hu, T. C., 1961. Multi-terminal network flows. Journal of the Society for Industrial and Applied Mathematics, 9 (4), 551–570. https://doi.org/10.1137/0109047
- Goodchild, A. V., Daganzo, C. F., 2007. Crane double cycling in container ports: Planning methods and evaluation. Transportation Research Part B: Methodological, 41 (8), 875–891. https://doi.org/10.1016/j.trb.2007.02.006
- Goodfellow, I., Bengio, Y., Courville, A., 2016. Deep learning. MIT Press.
- Goodson, J. C., Ohlmann, J. W., Thomas, B. W., 2013. Rollout policies for dynamic solutions to the multivehicle routing problem with stochastic demand and duration limits. Operations Research, 61 (1), 138–154. https://doi.org/10.1287/opre.1120.1127
- Google. 2022. OR-tools. https://developers.google.com/optimization
- Goossens, J.-W., van Hoesel, S., Kroon, L., 2006. On solving multi-type railway line planning problems. European Journal of Operational Research, 168 (2), 403–424. https://doi.org/10.1016/j.ejor.2004.04.036
- Gopalan, R., Talluri, K. T., 1998. The aircraft maintenance routing problem. Operations Research, 46 (2), 260–271. https://doi.org/10.1287/opre.46.2.260
- Gordon, W. J., Newell, G. F., 1967. Cyclic queuing systems with restricted length queues. Operations Research, 15 (2), 266–277. https://doi.org/10.1287/opre.15.2.266
- Gorissen, B. L., Yanıkoğlu, İ., den Hertog, D., 2015. A practical guide to robust optimization. Omega, 53, 124–137. https://doi.org/10.1016/j.omega.2014.12.006
- Gouveia, L., 1998. Using variable redefinition for computing lower bounds for minimum spanning and Steiner trees with hop constraints. INFORMS Journal on Computing, 10, 180–188. https://doi.org/10.1287/ijoc.10.2.180
- Govindan, K., Jafarian, A., Khodaverdi, R., Devika, K., 2014. Two-echelon multiple-vehicle location–routing problem with time windows for optimization of sustainable supply chain network of perishable food. International Journal of Production Economics, 152, 9–28. https://doi.org/10.1016/j.ijpe.2013.12.028
- Graefe, A., Armstrong, J. S., 2011. Comparing face-to-face meetings, nominal groups, Delphi and prediction markets on an estimation task. International Journal of Forecasting, 27 (1), 183–195. https://doi.org/10.1016/j.ijforecast.2010.05.004
- Grass, E., Fischer, K., 2016. Two-stage stochastic programming in disaster management: A literature survey. Surveys in Operations Research and Management Science, 21 (2), 85–100. https://doi.org/10.1016/j.sorms.2016.11.002
- Graves, G. W., McBride, R. D., Gershkoff, I., Anderson, D., Mahidhara, D., 1993a. Flight crew scheduling. Management Science, 39 (6), 736–745. https://doi.org/10.1287/mnsc.39.6.736
- Graves, S. C., Kan, A. R., Zipkin, P. H., 1993b. Logistics of production and inventory (Vol. 4). Elsevier.
- Greco, S., Matarazzo, B., Slowinski, R., 2001. Rough sets theory for multicriteria decision analysis. European Journal of Operational Research, 129 (1), 1–47. https://doi.org/10.1016/S0377-2217(00)00167-3
- Greco, S., Ehrgott, M., Figueira, J. (Eds.), 2016. Multiple criteria decision analysis: State of the art surveys. In International series in operations research and management science (Vol. 233). Springer-Verlag.
- Green, K. C., Armstrong, J. S., 2007. Structured analogies for forecasting. International Journal of Forecasting, 23 (3), 365–376. https://doi.org/10.1016/j.ijforecast.2007.05.005
- Green, T. R. G., Blandford, A. E., Church, L., Roast, C. R., Clarke, S., 2006. Cognitive dimensions: Achievements, new directions, and open questions. Journal of Visual Languages & Computing, 17 (4), 328–365. https://doi.org/10.1016/j.jvlc.2006.04.004
- Greenberg, M., Cox, A., Bier, V., Lambert, J., Lowrie, K., North, W., Siegrist, M., Wu, F., 2020. Risk analysis: Celebrating the accomplishments and embracing ongoing challenges. Risk Analysis, 40 (S1), 2113–2127. https://doi.org/10.1111/risa.13487
- Greenberg, M., Cox, Jr, L. A., 2021. Plutonium disposition: Using and explaining complex risk-related methods. Risk Analysis, 41 (12), 2186–2195. https://doi.org/10.1111/risa.13734
- Gregory, A., Ronan, M., 2015. Insights into the development of strategy from a complexity perspective. Journal of the Operational Research Society, 66 (4), 627–636. https://doi.org/10.1057/jors.2014.27
- Gregory, A. J., Atkins, J. P., Midgley, G., Hodgson, A. M., 2020. Stakeholder identification and engagement in problem structuring interventions. European Journal of Operational Research, 283 (1), 321–340. https://doi.org/10.1016/j.ejor.2019.10.044
- Gregory, A. J., Jackson, M. C., 1992a. Evaluating organizations: A systems and contingency approach. Systems Practice, 5 (1), 37–60. https://doi.org/10.1007/BF01060046
- Gregory, A. J., Jackson, M. C., 1992b. Evaluation methodologies: A system for use. Journal of the Operational Research Society, 43 (1), 19–28. https://doi.org/10.2307/2583695
- Gregory, R., Failing, L., Harstone, M., Long, G., McDaniels, T., Ohlson, D., 2012. Structured decision making: A practical guide to environmental management choices. Wiley.
- Gregory, W. J., 2000. Transforming self and society: A “critical appreciation” model. Systemic Practice and Action Research, 13 (4), 475–501. https://doi.org/10.1023/A:1009541430809
- Grieco, L., Utley, M., Crowe, S., 2021. Operational research applied to decisions in home health care: A systematic literature review. Journal of the Operational Research Society, 72 (9), 1960–1991. https://doi.org/10.1080/01605682.2020.1750311
- Grinsztajn, L., Oyallon, E., Gaël, V., 2022. Why do tree-based models still outperform deep learning on typical tabular data? In: Advances in neural information processing systems (Vol. 35). Curran Associates, Inc.
- Groop, J., Ketokivi, M., Gupta, M., Holmström, J., 2017. Improving home care: Knowledge creation through engagement and design. Journal of Operations Management, 53–56, 9–22. https://doi.org/10.1016/j.jom.2017.11.001
- Gross, C. N., Brunner, J. O., Blobner, M., 2019. Hospital physicians can’t get no long-term satisfaction–An indicator for fairness in preference fulfillment on duty schedules. Health Care Management Science, 22 (4), 691–708. https://doi.org/10.1007/s10729-018-9452-8
- Gross, D., Harris, C. M., 1974. Fundamentals of queueing theory. Wiley.
- Grötschel, M., Lovász, L., Schrijver, A., 1981. The ellipsoid method and its consequences in combinatorial optimization. Combinatorica, 1, 169–197. https://doi.org/10.1007/BF02579273
- Grötschel, M., Lovász, L., Schrijver, A., 1988. Geometric algorithms and combinatorial optimization. Springer.
- Grötschel, M., Monma, C., 1990. Integer polyhedra arising from certain design problems with connectivity constraints. SIAM Journal on Discrete Mathematics, 3, 502–523. https://doi.org/10.1137/0403043
- Grubbström, R. W., 1967. On the application of the Laplace transform to certain economic problems. Management Science, 13 (7), 558–567. https://doi.org/10.1287/mnsc.13.7.558
- Grus, J., 2019. Data science from scratch: First principles with Python. O’Reilly Media.
- Gschwind, T., Irnich, S., 2016. Dual inequalities for stabilized column generation revisited. INFORMS Journal on Computing, 28 (1), 175–194. https://doi.org/10.1287/ijoc.2015.0670
- Gu, S., Kelly, B., Xiu, D., 2020. Empirical asset pricing via machine learning. The Review of Financial Studies, 33 (5), 2223–2273. https://doi.org/10.1093/rfs/hhaa009
- Gu, Z., Nemhauser, G., Savelsbergh, M., 1998. Lifted cover inequalities for 0-1 integer programs: Computation. INFORMS Journal on Computing, 10, 427–437. https://doi.org/10.1287/ijoc.10.4.427
- Gu, Z., Nemhauser, G. L., Savelsbergh, M. W., 1999. Lifted flow cover inequalities for mixed 0-1 integer programs. Mathematical Programming, 85 (3), 439–467. https://doi.org/10.1007/s101070050067
- Guide, V. D. R., Souza, G. C., Van Wassenhove, L. N., Blackburn, J., 2006. Time value of commercial product returns. Management Science, 52 (8), 1200–1214. https://doi.org/10.1287/mnsc.1060.0522
- Guide, V. D. R., Teunter, R. H., Van Wassenhove, L. N., 2003. Matching demand and supply to maximize profits from remanufacturing. Manufacturing & Service Operations Management, 5 (4), 303–316. https://doi.org/10.1287/msom.5.4.303.24883
- Guide, V. D. R., Van Wassenhove, L. N., 2003. Business aspects of closed-loop supply chains. Carnegie Mellon University Press.
- Guide, Jr, V. D. R., Li, J., 2010. The potential for cannibalization of new products sales by remanufactured products. Decision Sciences, 41 (3), 547–572. https://doi.org/10.1111/j.1540-5915.2010.00280.x
- Guihaire, V., Hao, J.-K., 2008. Transit network design and scheduling: A global review. Transportation Research Part A: Policy and Practice, 42 (10), 1251–1273.
- Guikema, S., 2020. Artificial intelligence for natural hazards risk analysis: Potential, challenges, and research needs. Risk Analysis, 40 (6), 1117–1123. https://doi.org/10.1111/risa.13476
- Guo, P., Xiao, B., Li, J., 2012. Unconstraining methods in revenue management systems: Research overview and prospects. Advances in Operations Research, 2012. https://doi.org/10.1155/2012/270910
- Gurobi. 2022. Gurobi. https://www.gurobi.com/
- Gusfield, D., 1990. Very simple methods for all pairs network flow analysis. SIAM Journal on Computing, 19 (1), 143–155. https://doi.org/10.1137/0219009
- Gutiérrez-Jarpa, G., Obreque, C., Laporte, G., Marianov, V., 2013. Rapid transit network design for optimal cost and origin-destination demand capture. Computers & Operations Research, 40, 3000–3009. https://doi.org/10.1016/j.cor.2013.06.013
- Gutin, G., Punnen, A. (Eds.), 2006. The traveling salesman problem and its variations. Kluwer.
- Haase, K., Müller, S., 2013. Management of school locations allowing for free school choice. Omega, 41 (5), 847–855. https://doi.org/10.1016/j.omega.2012.10.008
- Habermas, J., 1972. Knowledge and human interests (J. J. Shapiro, Tran.). Heinemann.
- Hadley, G., Within, T., 1963. Analysis of inventory systems. Prentice-Hall.
- Haeringer, G., 2018. Market design: Auctions and matching. MIT Press.
- Hahler, S., Fleischmann, M., 2017. Strategic grading in the product acquisition process of a reverse supply chain. Production and Operations Management, 26 (8), 1498–1511. https://doi.org/10.1111/poms.12699
- Hakes, J. K., Sauer, R. D., 2006. An economic evaluation of the moneyball hypothesis. The Journal of Economic Perspectives, 20 (3), 173–186. https://doi.org/10.1257/jep.20.3.173
- Hakimi, S. L., 1965. Optimum distribution of switching centers in a communication network and some related graph theoretic problems. Operations Research, 13 (3), 462–475. https://doi.org/10.1287/opre.13.3.462
- Halfin, S., Whitt, W., 1981. Heavy-traffic limits for queues with many exponential servers. Operations Research, 29 (3), 567–588. https://doi.org/10.1287/opre.29.3.567
- Halkos, G. E., Tzeremes, N. G., Kourtzidis, S. A., 2014. A unified classification of two-stage DEA models. Surveys in Operations Research and Management Science, 19 (1), 1–16. https://doi.org/10.1016/j.sorms.2013.10.001
- Hall, A. D., 1962. A methodology for systems engineering. Van Nostrand.
- Halvorsen-Weare, E. E., Fagerholt, K., 2011. Robust supply vessel planning. In Network optimization (pp. 559–573). Springer.
- Hämäläinen, R. P., 2015. Behavioural issues in environmental modelling – The missing perspective. Environmental Modelling & Software, 73, 244–253. https://doi.org/10.1016/j.envsoft.2015.08.019
- Hämäläinen, R. P., Lahtinen, T. J., 2016. Path dependence in operational research–How the modeling process can influence the results. Operations Research Perspectives, 3, 14–20. https://doi.org/10.1016/j.orp.2016.03.001
- Hämäläinen, R. P., Luoma, J., Saarinen, E., 2013. On the importance of behavioral operational research: The case of understanding and communicating about dynamic systems. European Journal of Operational Research, 228 (3), 623–634. https://doi.org/10.1016/j.ejor.2013.02.001
- Hammant, J., Disney, S. M., Childerhouse, P., Naim, M. M., 1999. Modelling the consequences of a strategic supply chain initiative of an automotive aftermarket operation. International Journal of Physical Distribution & Logistics Management, 29 (9), 535–550. https://doi.org/10.1108/09600039910287501
- Hammond, P. J., 1992. Harsanyi’s utilitarian theorem: A simpler proof and some ethical connotations. In R. Selten (Ed.), Rational interaction: Essays in honor of John C. Harsanyi (pp. 305–319). Springer.
- Hane, C. A., Barnhart, C., Johnson, E. L., Marsten, R. E., Nemhauser, G. L., Sigismondi, G., 1995. The fleet assignment problem: Solving a large-scale integer program. Mathematical Programming, 70 (1), 211–232. https://doi.org/10.1007/BF01585938
- Hanea, A. M., Christophersen, A., Alday, S., 2022. Bayesian networks for risk analysis and decision support. Risk Analysis, 42 (6), 1149–1154. https://doi.org/10.1111/risa.13938
- Hansen, P., Mladenović, N., 1999. An introduction to variable neighborhood search. In S. Voß, S. Martello, I. H. Osman, C. Roucairol (Eds.), Meta-Heuristics: Advances and trends in local search paradigms for optimization (pp. 433–458). Springer. https://doi.org/10.1007/978-1-4615-5775-3_30
- Hao, J., Orlin, J. B., 1994. A faster algorithm for finding the minimum cut in a directed graph. Journal of Algorithms, 17 (3), 424–446. https://doi.org/10.1006/jagm.1994.1043
- Harchol-Balter, M., 2013. Performance modeling and design of computer systems: Queueing theory in action. Cambridge University Press.
- Hardt, M., Price, E., Srebro, N. 2016. Equality of opportunity in supervised learning. In Proceedings of 30th International Conference on Neural Information Processing (pp. 3323–3331).
- Hargreaves, J. R., Langan, S. M., Oswald, W. E., Halliday, K. E., Sturgess, J., Phelan, J., Nguipdop-Djomo, P., Ford, B., Allen, E., Sundaram, N., Ireland, G., Poh, J., Ijaz, S., Diamond, I., Rourke, E., Dawe, F., Judd, A., Warren-Gash, C., Clark, T. G., Glynn, J. R., Edmunds, W. J., Bonell, C., Mangtani, P., Ladhani, S. N. 2022. Epidemiology of SARS-CoV-2 infection among staff and students in a cohort of english primary and secondary schools during 2020-2021. The Lancet regional health. Europe, 21, 100471. https://doi.org/10.1016/j.lanepe.2022.100471
- Harju, M., Liesiö, J., Virtanen, K., 2019. Spatial multi-attribute decision analysis: Axiomatic foundations and incomplete preference information. European Journal of Operational Research, 275 (1), 167–181. https://doi.org/10.1016/j.ejor.2018.11.013
- Harper, A., Pitt, M., De Prez, M., Dumlu, Z. Ö., Vasilakis, C., Forte, P., Wood, R., 2021. A demand and capacity model for home-based intermediate care: Optimizing the ‘step down’ pathway. In 2021 Winter Simulation Conference (WSC) (pp. 1–12). https://doi.org/10.1109/WSC52266.2021.9715468
- Harris, F. W., 1913. How many parts to make at once. Factory, The Magazine of Management, 10 (2), 135–136, 152.
- Harris, F. W., 1990. How many parts to make at once. Operations Research, 38 (6), 947–950. https://doi.org/10.1287/opre.38.6.947
- Harrison, J. M., 1985. Brownian motion and stochastic flow systems. Wiley.
- Harsanyi, J., 1967. Games with incomplete information played by “Bayesian” players, Part I. Management Science, 14 (3), 159–182. https://doi.org/10.1287/mnsc.14.3.159
- Harsanyi, J., 1968a. Games with incomplete information played by “Bayesian” players, Part II. Management Science, 14 (5), 320–334. https://doi.org/10.1287/mnsc.14.5.320
- Harsanyi, J., 1968b. Games with incomplete information played by “Bayesian” players, Part III. Management Science, 14 (7), 486–502. https://doi.org/10.1287/mnsc.14.7.486
- Harsanyi, J. C., 1977. Rational behavior and bargaining equilibrium in games and social situations. Cambridge University Press.
- Hartert, R., Vissicchio, S., Schaus, P., Bonaventure, O., Filsfils, C., Telkamp, T., Francois, P., 2015. A declarative and expressive approach to control forwarding paths in carrier-grade networks. ACM SIGCOMM Computer Communication Review, 45 (4), 15–28. https://doi.org/10.1145/2829988.2787495
- Hartmann, S., 2001. Project scheduling with multiple modes: A genetic algorithm. Annals of Operations Research, 102 (1), 111–135. https://doi.org/10.1023/A:1010902015091
- Hartmann, S., 2002. A self-adapting genetic algorithm for project scheduling under resource constraints. Naval Research Logistics, 49 (5), 433–448. https://doi.org/10.1002/nav.10029
- Hartmann, S., Briskorn, D., 2010. A survey of variants and extensions of the resource-constrained project scheduling problem. European Journal of Operational Research, 207 (1), 1–14. https://doi.org/10.1016/j.ejor.2009.11.005
- Hartmann, S., Drexl, A., 1998. Project scheduling with multiple modes: A comparison of exact algorithms. Networks. An International Journal, 32 (4), 283–297. https://doi.org/10.1002/(SICI)1097-0037(199812)32:4<283::AID-NET5>3.0.CO;2-I
- Harwood, S., 2019. Whither is problem structuring methods (PSMs)? Journal of the Operational Research Society, 70 (8), 1391–1392. https://doi.org/10.1080/01605682.2018.1502628
- Hasbrouck, J., 1995. One security, many markets: Determining the contributions to price discovery. Journal of Finance, 50 (4), 1175–1199. https://doi.org/10.1111/j.1540-6261.1995.tb04054.x
- Haspeslagh, S., De Causmaecker, P., Schaerf, A., Stølevik, M., 2014. The first international nurse rostering competition 2010. Annals of Operations Research, 218, 221–236. https://doi.org/10.1007/s10479-012-1062-0
- Hastie, T., Tibshirani, R., Wainwright, M., 2015. Statistical learning with sparsity: The lasso and generalizations. CRC Press.
- Hattori, T., Jamasb, T., Pollitt, M., 2005. Electricity distribution in the UK and Japan: A comparative efficiency analysis 1985–1998. The Energy Journal, 26 (2), 23–47. https://doi.org/10.5547/ISSN0195-6574-EJ-Vol26-No2-2
- Haug, A. A., Blackburn, V. C., 2017. Government secondary school finances in New South Wales: Accounting for students’ prior achievements in a two-stage DEA at the school level. Journal of Productivity Analysis, 48 (1), 69–83. https://doi.org/10.1007/s11123-017-0502-x
- Haurie, A., Pohjola, M., 1987. Efficient equilibria in a differential game of capitalism. Journal of Economic Dynamics and Control, 11 (1), 65–78. https://doi.org/10.1016/0165-1889(87)90024-8
- Haurie, A., Tolwinski, B., 1985. Definition and properties of cooperative equilibria in a two-player game of infinite duration. Journal of Optimization Theory and Applications, 46, 525–534. https://doi.org/10.1007/BF00939157
- Hausken, K., 2018. A cost–benefit analysis of terrorist attacks. Defence and Peace Economics, 29 (2), 111–129. https://doi.org/10.1080/10242694.2016.1158440
- Hax, A. C., Meal, H. C., 1973. Hierarchical integration of production planning and scheduling. Massachusetts Institute of Technology, Sloan School of Management 656–673.
- He, F., Yang, J., Li, M., 2018. Vehicle scheduling under stochastic trip times: An approximate dynamic programming approach. Transportation Research Part C: Emerging Technologies, 96, 144–159. https://doi.org/10.1016/j.trc.2018.09.010
- Helsgaun, K., 2000. An effective implementation of the Lin-Kernighan traveling salesman heuristic. European Journal of Operational Research, 126 (1), 106–130. https://doi.org/10.1016/S0377-2217(99)00284-2
- Hemmelmayr, V., Doerner, K. F., Hartl, R. F., Savelsbergh, M. W. P., 2009. Delivery strategies for blood product supplies. OR Spectrum, 31, 707–725. https://doi.org/10.1007/s00291-008-0134-7
- Hermans, L. M., Thissen, W. A. H., 2009. Actor analysis methods and their use for public policy analysts. European Journal of Operational Research, 196 (2), 808–818. https://doi.org/10.1016/j.ejor.2008.03.040
- Herrmann, J., 2012. Handbook of operations research for homeland security. Springer.
- Herroelen, W., 2007. Generating robust project baseline schedules. In T. Klastorin (Ed.), OR tools and applications: Glimpses of future technologies. INFORMS TutORials in Operations Research. INFORMS (pp. 124–144).
- Herroelen, W., Leus, R., 2001. On the merits and pitfalls of critical chain scheduling. Journal of Operations Management, 19 (5), 559–577. https://doi.org/10.1016/S0272-6963(01)00054-7
- Herroelen, W., Leus, R., 2005. Project scheduling under uncertainty: Survey and research potentials. European Journal of Operational Research, 165 (2), 289–306. https://doi.org/10.1016/j.ejor.2004.04.002
- Herron, R., Mendiwelso-Bendek, Z., 2018. Supporting self-organised community research through informal learning. European Journal of Operational Research, 268 (3), 825–835. https://doi.org/10.1016/j.ejor.2017.08.009
- Hewitt, M., 2019. Enhanced dynamic discretization discovery for the continuous time load plan design problem. Transportation Science, 53 (6), 1731–1750. https://doi.org/10.1287/trsc.2019.0890
- Hewitt, M., Crainic, T. G., Nowak, M., Rei, W., 2019. Scheduled service network design with resource acquisition and management under uncertainty. Transportation Research Part B: Methodological, 128, 324–343. https://doi.org/10.1016/j.trb.2019.08.008
- Hewitt, M., Nemhauser, G. L., Savelsbergh, M. W., 2010. Combining exact and heuristic approaches for the capacitated fixed-charge network flow problem. INFORMS Journal on Computing, 22 (2), 314–325. https://doi.org/10.1287/ijoc.1090.0348
- Hewitt, M., Rei, W., Wallace, S. W., 2021. Stochastic network design. In T. G. Crainic, M. Gendreau, B. Gendron (Eds.), Network design with applications to transportation and logistics (pp. 283–315). Springer.
- Heydenreich, B., Müller, R., Uetz, M., Vohra, R. V., 2009. Characterization of revenue equivalence. Econometrica, 77 (1), 307–316.
- Hickman, B. R., 2010. On the pricing rule in electronic auctions. International Journal of Industrial Organization, 28 (5), 423–433. https://doi.org/10.1016/j.ijindorg.2009.10.006
- Hifi, M., M’Hallah, R., 2009. A literature review on circle and sphere packing problems: Models and methodologies. Advances in Operations Research, 2009, 150624. https://doi.org/10.1155/2009/150624
- Higgins, A. J., Miller, C. J., Archer, A. A., Ton, T., Fletcher, C. S., McAllister, R. R., 2010. Challenges of operations research practice in agricultural value chains. Journal of the Operational Research Society, 61 (6), 964–973. https://doi.org/10.1057/jors.2009.57
- Higle, J. L., Sen, S., 1991. Stochastic decomposition: An algorithm for two-stage linear programs with recourse. Mathematics of Operations Research, 16 (3), 650–669. https://doi.org/10.1287/moor.16.3.650
- Hill, R. R., 2020. Modern data analytics for the military operational researcher. In N. Scala & J. Howard (Eds.), Handbook of military and defense operations research (pp. 3–18). CRC Press.
- Hindle, G. A., Vidgen, R., 2018. Developing a business analytics methodology: A case study in the foodbank sector. European Journal of Operational Research, 268 (3), 836–851. https://doi.org/10.1016/j.ejor.2017.06.031
- Hines, P., Holweg, M., Rich, N., 2004. Learning to evolve: A review of contemporary lean thinking. International Journal of Operations & Production Management, 24 (10), 994–1011. https://doi.org/10.1108/01443570410558049
- Hines, P., Rich, N., 1997. The seven value stream mapping tools. International Journal of Operations & Production Management, 17, 46–64. https://doi.org/10.1108/01443579710157989
- Hitchcock, F. L., 1941. The distribution of a product from several sources to numerous localities. Journal of Mathematics and Physics, 20 (1-4), 224–230. https://doi.org/10.1002/sapm1941201224
- Hjortsø, C. N., 2004. Enhancing public participation in natural resource management using soft OR—An application of strategic option development and analysis in tactical forest planning. European Journal of Operational Research, 152 (3), 667–683. https://doi.org/10.1016/S0377-2217(03)00065-1
- Hochbaum, D. S. (Ed.), 1997. Approximation algorithms for NP-hard problems. PWS Publishing Co.
- Hochbaum, D. S., 2008. The pseudoflow algorithm: A new algorithm for the maximum-flow problem. Operations Research, 56 (4), 992–1009. https://doi.org/10.1287/opre.1080.0524
- Hochbaum, D. S., Orlin, J. B., 2013. Simplifications and speedups of the pseudoflow algorithm. Networks, 61 (1), 40–57. https://doi.org/10.1002/net.21467
- Hodson, D. D., Hill, R. R., 2014. The art and science of live, virtual, and constructive simulation for test and analysis. The Journal of Defense Modeling and Simulation, 11 (2), 77–89. https://doi.org/10.1177/1548512913506620
- Hofbauer, J., Sigmund, K., 1998. Evolutionary games and population dynamics. Cambridge University Press.
- Hoffman, K., Padberg, M., 1991. Improving LP-representations of zero-one linear programs for branch-and-cut. ORSA Journal on Computing, 3, 121–134. https://doi.org/10.1287/ijoc.3.2.121
- Hoffman, M. D., Blei, D. M., Wang, C., Paisley, J., 2013. Stochastic variational inference. Journal of Machine Learning Research, 14 (1), 1303–1347.
- Holguín-Veras, J., Pérez, N., Jaller, M., Van Wassenhove, L. N., Aros-Vera, F., 2013. On the appropriate objective function for post-disaster humanitarian logistics models. Journal of Operations Management, 31 (5), 262–280. https://doi.org/10.1016/j.jom.2013.06.002
- Holland, J. H., 1975. Adaptation in natural and artificial systems: An introductory analysis with applications to biology, control, and artificial intelligence. University of Michigan Press.
- Hollyman, R., Petropoulos, F., Tipping, M. E., 2021. Understanding forecast reconciliation. European Journal of Operational Research, 294 (1), 149–160. https://doi.org/10.1016/j.ejor.2021.01.017
- Holmström, J., Brax, S., Ala-Risku, T., 2010. Comparing provider-customer constellations of visibility-based service. Journal of Service Management, 21 (5), 675–692. https://doi.org/10.1108/09564231011079093
- Holmström, J., Ketokivi, M., Hameri, A.-P., 2009. Bridging practice and theory: A design science approach. Decision Sciences, 40 (1), 65–87. https://doi.org/10.1111/j.1540-5915.2008.00221.x
- Holsapple, C., Lee-Post, A., Pakath, R., 2014. A unified foundation for business analytics. Decision Support Systems, 64, 130–141. https://doi.org/10.1016/j.dss.2014.05.013
- Holt, C. C., 2004. Forecasting seasonals and trends by exponentially weighted moving averages. International Journal of Forecasting, 20 (1), 5–10. https://doi.org/10.1016/j.ijforecast.2003.09.015
- Holweg, M., 2007. The genealogy of lean production. Journal of Operations Management, 25 (2), 420–437. https://doi.org/10.1016/j.jom.2006.04.001
- Holweg, M., Disney, S. M., Holmström, J., Småros, J., 2005. Supply chain collaboration: Making sense of the strategy continuum. European Management Journal, 23 (2), 170–181. https://doi.org/10.1016/j.emj.2005.02.008
- Holzmann, T., Smith, J. C., 2021. The shortest path interdiction problem with randomized interdiction strategies: Complexity and algorithms. Operations Research, 69 (1), 82–99. https://doi.org/10.1287/opre.2020.2023
- Hong, L. J., Nelson, B. L., 2009. A brief introduction to optimization via simulation. In M. D. Rossetti, R. R. Hill, B. Johansson, A. Dunkin, R. G. Ingalls (Eds.), Proceedings of the 2009 Winter Simulation Conference (pp. 75–85). IEEE Piscataway.
- Hong, T., 2014. Energy forecasting: Past, present, and future. Foresight, 32, 43–48.
- Hong, T., Fan, S., 2016. Probabilistic electric load forecasting: A tutorial review. International Journal of Forecasting, 32, 914–938. https://doi.org/10.1016/j.ijforecast.2015.11.011
- Hong, T., Pinson, P., Wang, Y., Weron, R., Yang, D., Zareipour, H., 2020. Energy forecasting: A review and outlook. IEEE Open Access Journal of Power and Energy, 7, 376–388. https://doi.org/10.1109/OAJPE.2020.3029979
- Hooghiemstra, J. S., Kroon, L. G., Odijk, M. A., Salomon, M., Zwaneveld, P. J., 1999. Decision support systems support the search for win-win solutions in railway network design. Interfaces, 29 (2), 15–32. https://doi.org/10.1287/inte.29.2.15
- Hooker, J. N., Williams, H. P., 2012. Combining equity and utilitarianism in a mathematical programming model. Management Science, 58, 1682–1693. https://doi.org/10.1287/mnsc.1120.1515
- Hoos, I. R., 1972. Systems analysis in public policy: A critique. University of California Press.
- Hoot, N. R., LeBlanc, L. J., Jones, I., Levin, S. R., Zhou, C., Gadd, C. S., Aronsky, D., 2008. Forecasting emergency department crowding: A discrete event simulation. Annals of Emergency Medicine, 52 (2), 116–125. https://doi.org/10.1016/j.annemergmed.2007.12.011
- Hoover, E. M., 1936. The measurement of industrial localization. Review of Economics and Statistics, 18, 162–171. https://doi.org/10.2307/1927875
- Hopper, E., Turton, B. C. H., 2001. An empirical investigation of meta-heuristic and heuristic algorithms for a 2D packing problem. European Journal of Operational Research, 128 (1), 34–57. https://doi.org/10.1016/S0377-2217(99)00357-4
- Howard, R., 1966. Decision analysis: Applied decision theory. In D. B. Hertz & J. Melese (Ed.), Proceedings of the Fourth International Conference on Operational Research (pp. 55–71). John Wiley & Sons.
- Howick, S., Ackermann, F., Walls, L., Quigley, J., Houghton, T., 2017. Learning from mixed OR method practice: The NINES case study. Omega, 69, 70–81. https://doi.org/10.1016/j.omega.2016.08.003
- Hu, W., Toriello, A., Dessouky, M., 2018. Integrated inventory routing and freight consolidation for perishable goods. European Journal of Operational Research, 271 (2), 548–560. https://doi.org/10.1016/j.ejor.2018.05.034
- Huang, I. B., Keisler, J., Linkov, I., 2011. Multi-criteria decision analysis in environmental sciences: Ten years of applications and trends. The Science of The Total Environment, 409 (19), 3578–3594. https://doi.org/10.1016/j.scitotenv.2011.06.022
- Huang, M., Caines, P., Malhamé, R., 2003. Individual and mass behaviour in large population stochastic wireless power control problems: Centralized and Nash equilibrium solutions. In Proceedings of the 42nd IEEE Conference on Decision and Control , Maui, Hawaii (pp. 98–103).
- Huang, M., Caines, P., Malhamé, R., 2007. Large-population cost coupled LQG problems with nonuniform agents: Individual-mass behavior and decentralized epsilon-Nash equilibria. IEEE Transactions on Automatic Control, 52, 1560–1571. https://doi.org/10.1109/TAC.2007.904450
- Huang, M., Malhamé, R., Caines, P., 2006. Large population stochastic dynamic games: Closed-loop McKean-Vlasov systems and the Nash certainty equivalence principle. Communications in Information & Systems, 6, 221–252. https://doi.org/10.4310/CIS.2006.v6.n3.a5
- Huang, M., Smilowitz, K., Balcik, B., 2012. Models for relief routing: Equity, efficiency and efficacy. Transportation Research Part E: Logistics and Transportation Review, 48 (1), 2–18. https://doi.org/10.1016/j.tre.2011.05.004
- Huang, X., Jaimungal, S., Nourian, M., 2019. Mean-field game strategies for optimal execution. Applied Mathematical Finance, 26 (2), 153–185. https://doi.org/10.1080/1350486X.2019.1603183
- Huangfu, Q., Hall, J. A. J., 2018. Parallelizing the dual revised simplex method. Mathematical Programming Computation, 10, 119–142. https://doi.org/10.1007/s12532-017-0130-5
- Hubicka, K., Marcjasz, G., Weron, R., 2019. A note on averaging day-ahead electricity price forecasts across calibration windows. IEEE Transactions on Sustainable Energy, 10 (1), 321–323. https://doi.org/10.1109/TSTE.2018.2869557
- Hughes, L., Dwivedi, Y. K., Misra, S. K., Rana, N. P., Raghavan, V., Akella, V., 2019. Blockchain research, practice and policy: Applications, benefits, limitations, emerging research themes and research agenda. International Journal of Information Management, 49, 114–129. https://doi.org/10.1016/j.ijinfomgt.2019.02.005
- Hughes, L., Dwivedi, Y. K., Rana, N. P., Williams, M. D., Raghavan, V., 2022. Perspectives on the future of manufacturing within the industry 4.0 era. Production Planning & Control, 33 (2–3), 138–158. https://doi.org/10.1080/09537287.2020.1810762
- Hughes, W. P., 1995. A salvo model of warships in missile combat used to evaluate their staying power. Naval Research Logistics, 42 (2), 267–289. https://doi.org/10.1002/1520-6750(199503)42:2<267::AID-NAV3220420209>3.0.CO;2-Y
- Huisman, D., Kroon, L. G., Lentink, R. M., Vromans, M. J. C. M., 2005. Operations research in passenger railway transportation. Statistica Neerlandica, 59 (4), 467–497. https://doi.org/10.1111/j.1467-9574.2005.00303.x
- Hunt, V. M., Jacobi, S. K., Gannon, J. J., Zorn, J. E., Moore, C. T., Lonsdorf, E. V., 2016. A decision support tool for adaptive management of native prairie ecosystems. Interfaces, 46 (4), 334–344. https://doi.org/10.1287/inte.2015.0822
- Hunter, J. D., 2007. Matplotlib: A 2D graphics environment. Computing in Science & Engineering, 9 (3), 90–95. https://doi.org/10.1109/MCSE.2007.55
- Hunter, S. R., Applegate, E. A., Arora, V., Chong, B., Cooper, K., Rincón-Guevara, O., Vivas-Valencia, C., 2019. An introduction to multiobjective simulation optimization. ACM Transactions on Modeling and Computer Simulation, 29 (1). https://doi.org/10.1145/3299872
- Hussain, K., Mohd Salleh, M. N., Cheng, S., Shi, Y., 2019. Metaheuristic research: A comprehensive survey. Artificial Intelligence Review, 52 (4), 2191–2233. https://doi.org/10.1007/s10462-017-9605-z
- Hussein, A., Gaber, M. M., Elyan, E., Jayne, C., 2017. Imitation learning: A survey of learning methods. ACM Computing Surveys, 50 (2), 1–35. https://doi.org/10.1145/3054912
- Hvattum, L. M., Arntzen, H., 2010. Using ELO ratings for match result prediction in association football. International Journal of Forecasting, 26 (3), 460–470. https://doi.org/10.1016/j.ijforecast.2009.10.002
- Hwang, C., Yoon, K., 1981. Multiple attribute decision making: Methods and applications. Springer-Verlag.
- Hwang, F., Richards, D., Winter, P., 1992. The Steiner tree problem. No. 53 in annals of discrete mathematics. North-Holland.
- Hyndman, R., Athanasopoulos, G., Bergmeir, C., Caceres, G., Chhay, L., Kuroptevand, K. O’Hara-Wild, M., Petropoulos, F., Razbash, S., Wang, E., Yasmeen, F., Reid, D., Shaub, D., Carza, F., Team, R. C., Ihaka, R., Wang, X., Tang, Y., Zhou, Z., 2022. forecast: Forecasting functions for time series and linear models. R package version 8.17.
- Hyndman, R. J., Athanasopoulos, G., 2021. Forecasting: Principles and practice (3rd ed.). OTexts.
- Hyndman, R. J., Khandakar, Y., 2008. Automatic time series forecasting: The forecast package for R. Journal of Statistical Software, 27 (3), 1–22. https://doi.org/10.18637/jss.v027.i03
- Hyndman, R. J., Koehler, A. B., 2006. Another look at measures of forecast accuracy. International Journal of Forecasting, 22 (4), 679–688. https://doi.org/10.1016/j.ijforecast.2006.03.001
- Hyndman, R. J., Koehler, A. B., Ord, J. K., Snyder, R. D., 2008. Forecasting with exponential smoothing: The state space approach. Springer Verlag.
- Hyndman, R. J., Koehler, A. B., Snyder, R., Grose, S., 2002. A state space framework for automatic forecasting using exponential smoothing methods. International Journal of Forecasting, 18 (3), 439–454. https://doi.org/10.1016/S0169-2070(01)00110-8
- Ibarra-Rojas, O. J., Delgado, F., Giesen, R., Muñoz, J. C., 2015. Planning, operation, and control of bus transport systems: A literature review. Transportation Research Part B: Methodological, 77, 38–75. https://doi.org/10.1016/j.trb.2015.03.002
- IBM. 2022. ILOG CPLEX Optimization Studio. https://www.ibm.com/uk-en/products/ilog-cplex-optimization-studio
- Iglehart, D., Karlin, S., 1960. Optimal policy for dynamic inventory process with non-stationary stochastic demands. Tech. Rep., Stanford University, Applied Mathematics and Statistics Labs.
- Iglehart, D. L., 1965. Limiting diffusion approximations for the many server queue and the repairman problem. Journal of Applied Probability, 2 (2), 429–441. https://doi.org/10.2307/3212203
- IMO. 2018. Resolution MEPC.304(72), Initial IMO Strategy on reduction of GHG emissions from ships. Tech. Rep. MEPC 72/17/Add.1, Annex 11, International Maritime Organization.
- Inderfurth, K., de Kok, A. G., Flapper, S. D. P., 2001. Product recovery in stochastic remanufacturing systems with multiple reuse options. European Journal of Operational Research, 133 (1), 130–152. https://doi.org/10.1016/S0377-2217(00)00188-0
- Inderfurth, K., Flapper, S. D. P., Lambert, A. J. D., Pappis, C. P., Voutsinas, T. G., 2004. Production planning for product recovery management. In R. Dekker, M. Fleischmann, K. Inderfurth, & L. N. Van Wassenhove (Eds.), Reverse logistics: Quantitative models for closed-loop supply chains (pp. 249–274). Springer.
- Inderfurth, K., Jensen, T., 1999. Analysis of MRP policies with recovery options. In U. Leopold-Wildburger, G. Feichtinger, and K.-P. Kistner (Eds.), Modelling and decisions in economics: Essays in honor of Franz Ferschl. (pp. 189–228). Physica-Verlag HD.
- INFORMS. 2022. Certified analytics professional (CAP). www.certifiedanalytics.org, Retrieved November 1, 2022, from
- InsightMaker. 2016. InsightMaker. https://github.com/scottfr/simulation
- Institute for Apprenticeships & Technical Education. 2021. Operational research specialist. Retrieved December 9, 2021, from https://www.instituteforapprenticeships.org/apprenticeship-standards/operational-research-specialist-v1-0
- Iori, M., de Lima, V. L., Martello, S., Miyazawa, F. K., Monaci, M., 2021. Exact solution techniques for two-dimensional cutting and packing. European Journal of Operational Research, 289 (2), 399–415. https://doi.org/10.1016/j.ejor.2020.06.050
- Irnich, S., Desaulniers, G., 2005. Shortest path problems with resource constraints. In G. Desaulniers, J. Desrosiers, M. Solomon (Eds.), Column generation (pp. 33–65). Springer US.
- Irohara, T., Kuo, Y.-H., Leung, J. M. Y., 2013. From preparedness to recovery: A tri-level programming model for disaster relief planning. In D. Pacino, S. Voß, R. M. Jensen (Eds.), Computational logistics (pp. 213–228). Springer.
- Isaacs, R., 1975. Differential games (2nd ed.). Kruger.
- Ismail, A., Pham, H., 2019. Robust Markowitz mean-variance portfolio selection under ambiguous covariance matrix. Mathematical Finance, 29 (1), 174–207. https://doi.org/10.1111/mafi.12169
- Israr, A., Ali, Z. A., Alkhammash, E. H., Jussila, J. J., 2022. Optimization methods applied to motion planning of unmanned aerial vehicles: A review. Drones, 6 (5), 126. https://doi.org/10.3390/drones6050126
- Ivan, S., Yin, Y., 2017. The benefits of 3D printing for supply chains in the context of industry 4.0: Cases from automotive industry. Working Paper, Kyoto: Doshisha University.
- Ivanov, D., Dolgui, A., Sokolov, B., 2017. A dynamic approach to multi-stage job shop scheduling in an industry 4.0-based flexible assembly system. In H. Lödding, R. Riedel, K.-D. Thoben, G. von Cieminski, D. Kiritsis, D. (Eds.), Advances in production management systems. The path to intelligent, collaborative and sustainable manufacturing (pp. 475–482). Springer.
- Ivanov, D., Dolgui, A., Sokolov, B., Werner, F., Ivanova, M., 2016. A dynamic model and an algorithm for short-term supply chain scheduling in the smart factory industry 4.0. International Journal of Production Research, 54 (2), 386–402. https://doi.org/10.1080/00207543.2014.999958
- JaamSim Development Team. 2016. JaamSim: Discrete-event simulation software. http://jaamsim.com
- Jackson, J. R., 1957. Networks of waiting lines. Operations Research, 5 (4), 518–521. https://doi.org/10.1287/opre.5.4.518
- Jackson, J. R., 1963. Jobshop-like queueing systems. Management Science, 10 (1), 131–142. https://doi.org/10.1287/mnsc.10.1.131
- Jackson, M. C., 1982. The nature of soft systems thinking: The work of Churchman, Ackoff and Checkland. Journal of Applied Systems Analysis, 9, 17–29.
- Jackson, M. C., 1985. Social systems theory and practice: The nees for a critical approach. International Journal of General Systems, 10 (2–3), 135–151. https://doi.org/10.1080/03081078508934877
- Jackson, M. C., 1991. Systems methodology for the management sciences. Plenum.
- Jackson, M. C., 2000. Systems approaches to management. Kluwer/Plenum.
- Jackson, M. C., 2003. Systems thinking: Creative holism for managers. Wiley.
- Jackson, M. C., 2004. Community operational research: Purposes, theory and practice. In G. Midgley & A. E. Ochoa-Arias (Eds.), Community operational research: OR and systems thinking for community development (pp. 57–74). Springer.
- Jackson, M. C., 2006. Beyond problem structuring methods: Reinventing the future of OR/MS. Journal of the Operational Research Society 57 (7), 868–878. https://doi.org/10.1057/palgrave.jors.2602093
- Jackson, M. C., 2019. Critical systems thinking and the management of complexity. John Wiley & Sons.
- Jackson, M. C., Keys, P., 1984. Towards a system of systems methodologies. Journal of the Operational Research Society, 35 (6), 473–486. https://doi.org/10.2307/2581795
- Jackson, M. C., Keys, P., Cropper, S. A. (Eds.), 1989. OR and the social sciences. Plenum Press.
- Jacquet-Lagreze, E., Siskos, J., 1982. Assessing a set of additive utility functions for multicriteria decision-making, the UTA method. European Journal of Operational Research, 10 (2), 151–164. https://doi.org/10.1016/0377-2217(82)90155-2
- Jacquillat, A., Odoni, A. R., 2015. An integrated scheduling and operations approach to airport congestion mitigation. Operations Research, 63 (6), 1390–1410. https://doi.org/10.1287/opre.2015.1428
- Jadin, M., Aubry, F., Schaus, P., Bonaventure, O., 2019. CG4SR: Near optimal traffic engineering for segment routing with column generation. In IEEE INFOCOM 2019 - IEEE Conference on Computer Communications (pp. 1333–1341). https://doi.org/10.1109/INFOCOM.2019.8737424
- Jaehn, F., Michaelis, S., 2016. Shunting of trains in succeeding yards. Computers & Industrial Engineering, 102, 1–9. https://doi.org/10.1016/j.cie.2016.10.006
- Jaehn, F., Rieder, J., Wiehl, A., 2015. Minimizing delays in a shunting yard. OR Spectrum, 37, 407–429. https://doi.org/10.1007/s00291-015-0391-1
- Jain, R., Chiu, D. M., Hawe, W., 1984. A quantitative measure of fairness and discrimination for resource allocation in shared computer systems. Tech. Rep. TR–301, Eastern Research Laboratory, DEC, Hudson, MA.
- Jaiswal, N. K., 2012. Military operations research: Quantitative decision making. Springer.
- Janczura, J., Wójcik, E., 2022. Dynamic short-term risk management strategies for the choice of electricity market based on probabilistic forecasts of profit and risk measures. The German and the Polish market case study. Energy Economics, 110, 106015. https://doi.org/10.1016/j.eneco.2022.106015
- Jarník, V., 1930. O jistém problému minimálním (z dopisupanu O. Borůvkovi). Práce Moravsk’e Přírodovědecké Společnosti, VI (4), 57–63.
- Jaśkiewicz, A., Nowak, A., 2018a. Nonzero-sum stochastic games. In T. Başar & G. Zaccour (Eds.), Handbook of dynamic game theory (pp. 281–344). Springer.
- Jaśkiewicz, A., Nowak, A., 2018b. Zero-sum stochastic games. In T. Başar & G. Zaccour (Eds.), Handbook of dynamic game theory (pp. 1–65). Springer.
- Jauch, L. R., Glueck, W. F., 1975. Evaluation of university professors’ research performance. Management Science, 22 (1), 66–75. https://doi.org/10.1287/mnsc.22.1.66
- Jenkins, G., 1969. The systems approach. Journal of Systems Engineering, 1, 3–49.
- Jenkins, P. R., Robbins, M. J., Lunday, B. J., 2021. Approximate dynamic programming for military medical evacuation dispatching policies. INFORMS Journal on Computing, 33 (1), 2–26. https://doi.org/10.1287/ijoc.2019.0930
- Jenkins, S. P., Van Kerm, P., 2011. The measurement of economic inequality. In B. Nolan, W. Salverda, & T. M. Smeeding (Eds.), The Oxford handbook of economic inequality (pp. 40–68). Oxford University Press.
- Jepsen, M., Petersen, B., Spoorendonk, S., Pisinger, D., 2008. Subset-row inequalities applied to the vehicle-routing problem with time windows. Operations Research, 56 (2), 497–511. https://doi.org/10.1287/opre.1070.0449
- Jia, J., Xu, S. H., Guide, Jr, V. D. R., 2016. Addressing supply–demand imbalance: Designing efficient remanufacturing strategies. Production and Operations Management, 25 (11), 1958–1967. https://doi.org/10.1111/poms.12598
- Jünger, M., Thienel, S., 2000. The ABACUS system for branch-and-cut-and-price algorithms in integer programming and combinatorial optimization. Software: Practice and Experience, 30 (11), 1325–1352. https://doi.org/10.1002/1097-024X(200009)30:11<1325::AID-SPE342>3.0.CO;2-T
- Jnitova, V., Elsawah, S., Ryan, M., 2017. Review of simulation models in military workforce planning and management context. The Journal of Defense Modeling and Simulation, 14 (4), 447–463. https://doi.org/10.1177/1548512917704525
- John, S., Naim, M. M., Towill, D. R., 1994. Dynamic analysis of a WIP compensated decision support system. International Journal of Manufacturing Systems Design, 1, 283–297.
- Johnes, G., Johnes, J., 2016. Costs, efficiency, and economies of scale and scope in the english higher education sector. Oxford Review of Economic Policy, 32 (4), 596–614. https://doi.org/10.1093/oxrep/grw023
- Johnes, G., Johnes, J., Thanassoulis, E., Lenton, P., Emrouznejad, A., 2005. An exploratory analysis of the cost structure of higher education in England. Tech. Rep. 641, Department for Education and Skills, London.
- Johnes, G., Schwarzenberger, A., 2011. Differences in cost structure and the evaluation of efficiency: The case of German universities. Education Economics, 19 (5), 487–499. https://doi.org/10.1080/09645291003726442
- Johnes, J., 1996. Performance assessment in higher education in Britain. European Journal of Operational Research, 89 (1), 18–33. https://doi.org/10.1016/S0377-2217(96)90048-X
- Johnes, J., 2006. Data envelopment analysis and its application to the measurement of efficiency in higher education. Economics of Education Review, 25 (3), 273–288. https://doi.org/10.1016/j.econedurev.2005.02.005
- Johnes, J., 2014. Efficiency and mergers in english higher education 1996/97 to 2008/9: Parametric and non-parametric estimation of the multi-input multi-output distance function. Manchester School, 82 (4), 465–487. https://doi.org/10.1111/manc.12030
- Johnes, J., 2022. Applications of production economics in education. In S. C. Ray, R. Chambers, & S. C. Kumbhakar (Eds.), Handbook of production economics: Survey of applications (pp. 1193–1239). Springer.
- Johnes, J., Johnes, G., 2013. Efficiency in the higher education sector: A technical exploration. Department for Business Innovation and Skills – BIS Research Paper 113.
- Johnes, J., Taylor, J., 1990. Performance indicators in higher education: UK universities. Society for Research into Higher Education.
- Johnson, D. S., Lenstra, J. K., Rinnooy Kan, A. H. G., 1978. The complexity of the network design problem. Networks, 8 (4), 279–285. https://doi.org/10.1002/net.3230080402
- Johnson, M. P. (Ed.), 2012a. Community-based operations research: Decision modeling for local impact and diverse populations. In International series in operations research & management science (Vol. 167). Springer.
- Johnson, M. P., 2012b. Community-based operations research: Introduction, theory, and applications. In M. P. Johnson (Ed.), Community-based operations research: Decision modeling for local impact and diverse populations. Vol. 167 of International Series in Operations Research & Management Science (pp. 3–36). Springer.
- Johnson, M. P., Midgley, G., Wright, J., Chichirau, G., 2018. Community operational research: Innovations, internationalization and agenda-setting applications. European Journal of Operational Research, 268 (3), 761–770. https://doi.org/10.1016/j.ejor.2018.03.004
- Johnson, M. P., Smilowitz, K., 2012. What is community-based OR? In M. P. Johnson (Ed.), Community-based operations research: decision modeling for local impact and diverse populations. Vol. 167 of International Series in Operations Research & Management Science (pp. 37–65). Springer.
- Jondrow, J., Knox Lovell, C. A., Materov, I. S., Schmidt, P., 1982. On the estimation of technical inefficiency in the stochastic frontier production function model. Journal of Econometrics, 19 (2), 233–238. https://doi.org/10.1016/0304-4076(82)90004-5
- Jones, S., Eden, C., 1981. O.R. in the community. Journal of the Operational Research Society, 32 (5), 335–345. https://doi.org/10.2307/2581551
- Jotrao, S., Batta, R., 2021. Time-constrained UAV path planning in 3D network for maximim information gain. Military Operations Research, 26 (3), 5–25. https://doi.org/10.5711/1082598326305
- Jun, J. B., Jacobson, S. H., Swisher, J. R., 1999. Application of discrete-event simulation in health care clinics: A survey. Journal of the Operational Research Society, 50 (2), 109–123. https://doi.org/10.2307/3010560
- Jung, K. S., Pinedo, M., Sriskandarajah, C., Tiwari, V., 2019. Scheduling elective surgeries with emergency patients at shared operating rooms. Production and Operations Management, 28 (6), 1407–1430. https://doi.org/10.1111/poms.12993
- Jünger, M., Reinelt, G., Rinaldi, G., 1995. The traveling salesman problem. In M. O. Ball, T. L. Magnanti, C. L. Monma, & G. L. Nemhauser (Eds.), Handbooks in operations research and management science (Vol. 7, pp. 225–330). Elsevier.
- Jünger, M., Rinaldi, G., Thienel, S., 2000. Practical performance of efficient minimum cut algorithms. Algorithmica, 26 (1), 172–195. https://doi.org/10.1007/s004539910009
- Jury, E. I., Paynter, H., 1975. Inners and stability of dynamic systems. The American Society of Mechanical Engineers (ASME).
- Kaelbling, L. P., Littman, M. L., Cassandra, A. R., 1998. Planning and acting in partially observable stochastic domains. Artificial Intelligence, 101 (1), 99–134. https://doi.org/10.1016/S0004-3702(98)00023-X
- Kagel, J. H., 2020. Auctions: A survey of experimental research. In J. H. Kagel & A. E. Roth (Eds.), The handbook of experimental economics (pp. 501–586). Princeton University Press.
- Kahneman, D., 2011. Thinking, fast and slow. Penguin.
- Kaipia, R., Holmström, J., Småros, J., Rajala, R., 2017. Information sharing for sales and operations planning: Contextualized solutions and mechanisms. Journal of Operations Management, 52, 15–29. https://doi.org/10.1016/j.jom.2017.04.001
- Käki, A., Kemppainen, K., Liesiö, J., 2019. What to do when decision-makers deviate from model recommendations? empirical evidence from hydropower industry. European Journal of Operational Research, 278 (3), 869–882. https://doi.org/10.1016/j.ejor.2019.04.021
- Kalai, E., Smorodinsky, M., 1975. Other solutions to Nash’s bargaining problem. Econometrica, 43, 513–518. https://doi.org/10.2307/1914280
- Kalman, R. E., 1960. A new approach to linear filtering and prediction problems. Journal of Basic Engineering, 82, 35–45. https://doi.org/10.1115/1.3662552
- Kandakoglu, A., Frini, A., Ben Amor, S., 2019. Multicriteria decision making for sustainable development: A systematic review. Journal of Multi-Criteria Decision Analysis, 26 (5–6), 202–251. https://doi.org/10.1002/mcda.1682
- Kantorovich, L. V., 1960. Mathematical methods of organizing and planning production. Management Science, 6 (4), 366–422. https://doi.org/10.1287/mnsc.6.4.366
- Kantorovitch, L., 1958. On the translocation of masses. Management Science, 5 (1), 1–4. https://doi.org/10.1287/mnsc.5.1.1
- Kao, C., 2014. Network data envelopment analysis: A review. European Journal of Operational Research, 239 (1), 1–16. https://doi.org/10.1016/j.ejor.2014.02.039
- Kao, C., 2016. Efficiency decomposition and aggregation in network data envelopment analysis. European Journal of Operational Research, 255 (3), 778–786. https://doi.org/10.1016/j.ejor.2016.05.019
- Kao, C., Liu, S.-T., 2014. Multi-period efficiency measurement in data envelopment analysis: The case of Taiwanese commercial banks. Omega, 47, 90–98. https://doi.org/10.1016/j.omega.2013.09.001
- Kapelko, M., Horta, I. M., Camanho, A. S., Oude Lansink, A., 2015. Measurement of input-specific productivity growth with an application to the construction industry in Spain and Portugal. International Journal of Production Economics, 166, 64–71. https://doi.org/10.1016/j.ijpe.2015.03.030
- Kaplan, E. H., 2010. Terror queues. Operations Research, 58 (4), 773–784. https://doi.org/10.1287/opre.1100.0831
- Kaplan, R. S., 1970. A dynamic inventory model with stochastic lead times. Management Science, 16 (7), 491–507. https://doi.org/10.1287/mnsc.16.7.491
- Kaplan, S., Garrick, B. J., 1981. On the quantitative definition of risk. Risk Analysis, 1 (1), 11–27. https://doi.org/10.1111/j.1539-6924.1981.tb01350.x
- Kapuściński, R., Parker, R. P., 2023. Capacitated inventory systems. In J.-S. Song (Ed.), Research handbook on inventory management. Edward Elgar Publishing.
- Kara, B. Y., Savaşer, S., 2017. Humanitarian logistics. In R. Batta & J. Peng (Eds.), Leading developments from INFORMS communities. INFORMS TutORials in Operations Research (pp. 263–303). INFORMS.
- Karelahti, J., Virtanen, K., Raivio, T., 2007. Near-Optimal missile avoidance trajectories via receding horizon control. Journal of Guidance, Control, and Dynamics, 30 (5), 1287–1298. https://doi.org/10.2514/1.26024
- Karger, D. R., 2000. Minimum cuts in near-linear time. Journal of the ACM, 47 (1), 46–76. https://doi.org/10.1145/331605.331608
- Karger, D. R., Stein, C., 1996. A new approach to the minimum cut problem. Journal of the ACM, 43 (4), 601–640. https://doi.org/10.1145/234533.234534
- Karmarkar, N., 1984. A new polynomial-time algorithm for linear programming. In Proceedings of the Sixteenth Annual ACM Symposium on Theory of Computing . STOC ‘84. Association for Computing Machinery (pp. 302–311). https://doi.org/10.1145/800057.808695
- Karp, R. M., 1972a. Reducibility among combinatorial problems. In R. E. Miller, J. W. Thatcher, & J. D. Bohlinger (Eds.), Complexity of Computer Computations: Proceedings of a Symposium on the Complexity of Computer Computations. The IBM Research Symposia Series (pp. 85–103). Plenum Press.
- Karp, R. M., 1972b. Reducibility among combinatorial problems. In Complexity of computer computations (pp. 85–103). Springer US.
- Karras, T., Laine, S., Aila, T., 2021. A style-based generator architecture for generative adversarial networks. IEEE Transactions on Pattern Analysis and Machine Intelligence, 43 (12), 4217–4228. https://doi.org/10.1109/TPAMI.2020.2970919
- Karsu, O., Kara, B. Y., Selvi, B., 2019. The refugee camp management: A general framework and a unifying decision-making model. Journal of Humanitarian Logistics and Supply Chain Management, 9 (2), 131–150. https://doi.org/10.1108/JHLSCM-01-2018-0007
- Karsu, Ö., Morton, A., 2015. Inequity averse optimization in operational research. European Journal of Operational Research, 245 (2), 343–359. https://doi.org/10.1016/j.ejor.2015.02.035
- Karvetski, C. W., Lambert, J. H., Keisler, J. M., Linkov, I., 2011. Integration of decision analysis and scenario planning for coastal engineering and climate change. IEEE Transactions on Systems, Man, and Cybernetics - Part A: Systems and Humans, 41 (1), 63–73. https://doi.org/10.1109/TSMCA.2010.2055154
- Karzanov, A. V., 1974. Determining the maximal flow in a network by the method of preflows. Soviet Mathematics Doklady, 15, 434–437.
- Kasperson, R. E., Webler, T., Ram, B., Sutton, J., 2022. The social amplification of risk framework: New perspectives. Risk Analysis, 42 (7), 1367–1380. https://doi.org/10.1111/risa.13926
- Katsaliaki, K., Mustafee, N., Dwivedi, Y. K., Williams, T., Wilson, J. M., 2010. A profile of OR research and practice published in Journal of the Operational Research Society. Journal of the Operational Research Society, 61 (1), 82–94. https://doi.org/10.1057/jors.2009.137
- Kavadias, S., Loch, C. H., 2004. Project selection under uncertainty: Dynamically allocating resources to maximize value. Springer Science & Business Media.
- Kazemi Matin, R., Kuosmanen, T., 2009. Theory of integer-valued data envelopment analysis under alternative returns to scale axioms. Omega, 37 (5), 988–995. https://doi.org/10.1016/j.omega.2008.11.002
- Keenan, P. B., Jankowski, P., 2019. Spatial decision support systems: Three decades on. Decision Support Systems, 116, 64–76. https://doi.org/10.1016/j.dss.2018.10.010
- Keeney, R., 1982. Decision analysis: An overview. Operations Research, 30 (5), 803–838. https://doi.org/10.1287/opre.30.5.803
- Keeney, R., 1996a. Value-focused thinking: A path to creative decisionmaking. Harvard University Press.
- Keeney, R., 1996b. Value-focused thinking: Identifying decision opportunities and creating alternatives. European Journal of Operational Research, 92 (3), 537–549. https://doi.org/10.1016/0377-2217(96)00004-5
- Keeney, R., Raiffa, H., 1976. Decisions with multiple objectives: Preferences and value tradeoffs. John Wiley & Sons.
- Kellenbrink, C., Helber, S., 2015. Scheduling resource-constrained projects with a flexible project structure. European Journal of Operational Research, 246 (2), 379–391. https://doi.org/10.1016/j.ejor.2015.05.003
- Keller, L. R., Simon, J., 2019. Preference functions for spatial risk analysis. Risk Analysis, 39 (1), 244–256. https://doi.org/10.1111/risa.12892
- Kellerer, H., Pferschy, U., Pisinger, D., 2004. Knapsack problems. Springer.
- Kelley, J. E., 1961. Critical-path planning and scheduling: Mathematical basis. Operations Research, 9 (3), 296–320. https://doi.org/10.1287/opre.9.3.296
- Kelly, F. P., 1979. Reversibility and stochastic networks. Wiley.
- Kelly, F. P., Maulloo, A. K., Tan, D. K. H., 1998. Rate control for communication networks: Shadow prices, proportional fairness and stability. Journal of the Operational Research Society, 49 (3), 237–252. https://doi.org/10.2307/3010473
- Kemball-Cook, D., Vaughan, J. P., 1983. Operational research in primary health care planning: A theoretical model for estimating the coverage achieved by different distributions of staff and facilities. Bulletin of the World Health Organization, 61 (2), 361–369.
- Kemmer, P., Strauss, A. K., Winter, T., 2012. Dynamic simultaneous fare proration for large-scale network revenue management. Journal of the Operational Research Society, 63 (10), 1336–1350. https://doi.org/10.1057/jors.2011.143
- Keränen, J.-P., 2018. Capability assessment finds a multirole fighter suitable for Finland’s defence. Tech. Rep., Finnish Air Force.
- Kerivin, H., Mahjoub, A. R., 2005. Design of survivable networks: A survey. Networks, 46 (1), 1–21. https://doi.org/10.1002/net.20072
- Kerkhove, L.-P., Vanhoucke, M., Maenhout, B., 2017. On the resource renting problem with overtime. Computers & Industrial Engineering, 111, 303–319. https://doi.org/10.1016/j.cie.2017.07.024
- Kersten, W., Schröder, M., Indorf, M., 2017. Potentials of digitalization for supply chain risk management: An empirical analysis. Betriebswirtschaftliche Aspekte Von Industrie 4.0, 71 (17), 47–74.
- Ketzenberg, M. E., Souza, G. C., Guide, Jr, V. D. R., 2003. Mixed assembly and disassembly operations for remanufacturing. Production and Operations Management, 12 (3), 320–335. https://doi.org/10.1111/j.1937-5956.2003.tb00206.x
- Keys, P., 1998. OR as technology revisited. Journal of the Operational Research Society, 49 (2), 99–108. https://doi.org/10.2307/3009976
- Kharrat, T., McHale, I. G., Peña, J. L., 2020. Plus–minus player ratings for soccer. European Journal of Operational Research, 283 (2), 726–736. https://doi.org/10.1016/j.ejor.2019.11.026
- Kiesel, R., Kusterman, M., 2016. Structural models for coupled electricity markets. Journal of Commodity Markets, 3 (1), 16–38. https://doi.org/10.1016/j.jcomm.2016.07.007
- Kınay, Ö. B., Gzara, F., Alumur, S. A., 2021. Full cover charging station location problem with routing. Transportation Research Part B: Methodological, 144, 1–22. https://doi.org/10.1016/j.trb.2020.12.001
- King, A., 2022. SMI. https://projects.coin-or.org/Smi
- King, V., Rao, S., Tarjan, R., 1994. A faster deterministic maximum flow algorithm. Journal of Algorithms, 17 (3), 447–474. https://doi.org/10.1006/jagm.1994.1044
- Kingman, J. F. C., 1961. The single server queue in heavy traffic. In B. J. Green (Ed.), Mathematical Proceedings of the Cambridge Philosophical Society (Vol. 57, pp. 902–904). Cambridge University Press. https://doi.org/10.1017/S0305004100036094
- Kingman, J. F. C., 1962. On queues in heavy traffic. Journal of the Royal Statistical Society: Series B (Methodological), 24 (2), 383–392. https://doi.org/10.1111/j.2517-6161.1962.tb00465.x
- Kingman, J. F. C., 1965. The heavy traffic approximation in the theory of queues. In W. L. Smith & W. E. Wilkinson (Eds.), Proceedings of the Symposium on Congestion Theory (Vol. 2). University of North Carolina Press.
- Kingston, A., Comas-Herrera, A., Jagger, C., 2018a. Forecasting the care needs of the older population in England over the next 20 years: Estimates from the population ageing and care simulation (PACSim) modelling study. The Lancet Public Health, 3 (9), e447–e455. https://doi.org/10.1016/S2468-2667(18)30118-X
- Kingston, J. H., Post, G., Vanden Berghe, G., 2018b. A unifed nurse rostering model based on XHSTT. In Proceedings of the 12th International Conference of the Practice and Theory of Automated Timetabling (Vol. 12. pp. 81–96).
- Kirby, M. W., 2003. Operational research in war and peace: The British experience from 1930s to 1970. Imperial College Press and The Operational Research Society.
- Kirjavainen, T., 2012. Efficiency of Finnish general upper secondary schools: An application of stochastic frontier analysis with panel data. Education Economics, 20 (4), 343–364. https://doi.org/10.1080/09645292.2010.510862
- Kirkpatrick, S., Gelatt Jr, C. D., Vecchi, M. P., 1983. Optimization by simulated annealing. Science, 220 (4598), 671–680. https://doi.org/10.1126/science.220.4598.671
- Klapp, M. A., Erera, A. L., Toriello, A., 2020. Request acceptance in same-day delivery. Transportation Research Part E: Logistics and Transportation Review, 143, 102083. https://doi.org/10.1016/j.tre.2020.102083
- Klee, V., Minty, G. J., 1972. How good is the simplex algorithm? In O. Shisha (Ed.), Inequalities III (pp. 159–175). Academic Press.
- Klein, J. H., Connell, N. A. D., Meyer, E., 2007. Operational research practice as storytelling. Journal of the Operational Research Society, 58 (12), 1535–1542. https://doi.org/10.1057/palgrave.jors.2602277
- Klein, R., Koch, S., Steinhardt, C., Strauss, A. K., 2020. A review of revenue management: Recent generalizations and advances in industry applications. European Journal of Operational Research, 284 (2), 397–412. https://doi.org/10.1016/j.ejor.2019.06.034
- Klein, R., Mackert, J., Neugebauer, M., Steinhardt, C., 2018. A model-based approximation of opportunity cost for dynamic pricing in attended home delivery. OR Spectrum, 40 (4), 969–996. https://doi.org/10.1007/s00291-017-0501-3
- Klein, R., Neugebauer, M., Ratkovitch, D., Steinhardt, C., 2019. Differentiated time slot pricing under routing considerations in attended home delivery. Transportation Science, 53 (1), 236–255. https://doi.org/10.1287/trsc.2017.0738
- Kleinberg, J., Tardos, E., 2006. Algorithm design. Addison Wesley.
- Kleinrock, L., 1975a. Queueing systems, Volume 1: Theory. Wiley Intersciences.
- Kleinrock, L., 1975b. Queueing systems, Volume 2: Computer applications. Wiley Intersciences.
- Kleywegt, A. J., Shapiro, A., Homem-de Mello, T., 2002. The sample average approximation method for stochastic discrete optimization. SIAM Journal on Optimization, 12 (2), 479–502. https://doi.org/10.1137/S1052623499363220
- Kline, A., Ahner, D., Hill, R., 2019. The weapon-target assignment problem. Computers & Operations Research, 105, 226–236. https://doi.org/10.1016/j.cor.2018.10.015
- Klinke, A., Renn, O., 2021. The coming of age of risk governance. Risk Analysis, 41 (3), 544–557. https://doi.org/10.1111/risa.13383
- Ko, T., Lee, J., Ryu, D., 2018. Blockchain technology and manufacturing industry: Real-time transparency and cost savings. Sustainability, 10 (11), 4274. https://doi.org/10.3390/su10114274
- Koch, S., Klein, R., 2020. Route-based approximate dynamic programming for dynamic pricing in attended home delivery. European Journal of Operational Research, 287 (2), 633–652. https://doi.org/10.1016/j.ejor.2020.04.002
- Kohavi, R., Rothleder, N. J., Simoudis, E., 2002. Emerging trends in business analytics. Communications of the ACM, 45 (8), 45–48. https://doi.org/10.1145/545151.545177
- Köhler, C., Campbell, A. M., Ehmke, J. F., 2022. Data-driven customer acceptance for attended home delivery. Working paper.
- Köhler, C., Ehmke, J. F., Campbell, A. M., 2020. Flexible time window management for attended home deliveries. Omega, 91, 102023. https://doi.org/10.1016/j.omega.2019.01.001
- Köhler, C., Haferkamp, J., 2019. Evaluation of delivery cost approximation for attended home deliveries. Transportation Research Procedia, 37, 67–74. https://doi.org/10.1016/j.trpro.2018.12.167
- Kohtamäki, M., Baines, T., Rabetino, R., Bigdeli, A. Z., 2018. Practices in servitization. In M. Kohtamäki, T. Baines, R. Rabetino, A. Z. Bigdeli (Eds.), Practices and tools for servitization: Managing service transition (1–21). Springer.
- Kolassa, S., 2011. Combining exponential smoothing forecasts using Akaike weights. International Journal of Forecasting, 27 (2), 238–251. https://doi.org/10.1016/j.ijforecast.2010.04.006
- Kolassa, S., 2020. Why the “best” point forecast depends on the error or accuracy measure. International Journal of Forecasting, 36 (1), 208–211. https://doi.org/10.1016/j.ijforecast.2019.02.017
- Köllerström, J., 1974. Heavy traffic theory for queues with several servers. I. Journal of Applied Probability, 11 (3), 544–552. https://doi.org/10.2307/3212698
- Komarudin, De Feyter, T., Guerry, M.-A., Vanden Berghe, G., 2020. The extended roster quality staffing problem: Addressing roster quality variation within a staffing planning period. Journal of Scheduling, 23, 253–264. https://doi.org/10.1007/s10951-020-00654-7
- König, D., 1916. Über graphen und ihre anwendungen (in German). Mathematische Annalen, 77, 453–465. https://doi.org/10.1007/BF01456961
- Konings, R., 2003. Network design for intermodal barge transport. Transportation Research Record, 1820 (1), 17–25. https://doi.org/10.3141/1820-03
- Koopmans, T. C., 1949. Optimum utilization of the transportation system. Econometrica, 17, 136–146. https://doi.org/10.2307/1907301
- Kordzadeh, N., Ghasemaghaei, M., 2022. Algorithmic bias: Review, synthesis, and future research directions. European Journal of Information Systems, 31 (3), 388–409. https://doi.org/10.1080/0960085X.2021.1927212
- Korte, B., Vygen, J., 2008. Combinatorial optimization: Theory and algorithms (3rd ed.). Springer.
- Koster, A. M. C. A., Schmidt, D. R., 2021. Robust network design. In T. G. Crainic, M. Gendreau, B. Gendron (Eds.), Network design with applications to transportation and logistics (pp. 317–343). Springer.
- Kotary, J., Fioretto, F., Hentenryck, P. V., Wilder, B., 2021. End-to-end constrained optimization learning: A survey. In Z. Zhou (Ed.), Proceedings of the Thirtieth International Joint Conference on Artificial Intelligence , IJCAI 2021, Virtual Event/Montreal, Canada, 19–27 August 2021. ijcai.org (pp. 4475–4482).
- Kotiadis, K., Mingers, J., 2006. Combining PSMs with hard OR methods: The philosophical and practical challenges. Journal of the Operational Research Society, 57 (7), 856–867. https://doi.org/10.1057/palgrave.jors.2602147
- Koutsandreas, D., Spiliotis, E., Petropoulos, F., Assimakopoulos, V., 2022. On the selection of forecasting accuracy measures. Journal of the Operational Research Society, 73 (5), 937–954. https://doi.org/10.1080/01605682.2021.1892464
- Kovács, G., Falagara Sigala, I., 2021. Lessons learned from humanitarian logistics to manage supply chain disruptions. Journal of Supply Chain Management, 57 (1), 41–49. https://doi.org/10.1111/jscm.12253
- Kovács, P., 2015. Minimum-cost flow algorithms: An experimental evaluation. Optimization Methods and Software, 30 (1), 94–127. https://doi.org/10.1080/10556788.2014.895828
- Krawczyk, J., Petkov, V., 2018. Multistage games. In T. Başar & G. Zaccour (Eds.), Handbook of dynamic game theory (pp. 157–213). Springer.
- Kress, G. R., Van Leeuwen, T., 2006. Reading images: The grammar of visual design. Routledge.
- Krijkamp, E. M., Alarid-Escudero, F., Enns, E. A., Jalal, H. J., Hunink, M. G. M., Pechlivanoglou, P., 2018. Microsimulation modeling for health decision sciences using R: A tutorial. Medical Decision Making, 38 (3), 400–422. https://doi.org/10.1177/0272989X18754513
- Krishna, V., 2010. Auction theory. Elsevier.
- Kristiansen, O. S., Sandberg, U., Hansen, C., Jensen, M. S., Friederich, J., Lazarova-Molnar, S. (Eds.). 2022. Experimental comparison of open source discrete-event simulation frameworks. In Simulation tools and techniques. SIMUtools 2021. Lecture notes of the institute for computer sciences, social informatics and telecommunications engineering (Vol. 424, pp. 315–330). Springer.
- Król, K., Zdonek, D., 2020. Analytics maturity models: An overview. Information. An International Interdisciplinary Journal, 11 (3), 142. https://doi.org/10.3390/info11030142
- Kronqvist, J., Bernal, D., Lundell, A., Grossmann, I., 2019. A review and comparison of solvers for convex MINLP. Optimization and Engineering, 20, 397–455. https://doi.org/10.1007/s11081-018-9411-8
- Kroon, L., Huisman, D., Abbink, E., Fioole, P. J., Fischetti, M., Maróti, G., Schrijver, A., Steenbeek, A., Ybema, R., 2009. The new Dutch timetable: The OR revolution. Interfaces, 39 (1), 6–17. https://doi.org/10.1287/inte.1080.0409
- Kroon, L. G., Lentink, R. M., Schrijver, A., 2008. Shunting of passenger train units: An integrated approach. Transportation Science, 42, 436–449. https://doi.org/10.1287/trsc.1080.0243
- Kruskal, J., 1957. On the shortest spanning subtree of a graph and the traveling salesman problem. Proceedings of the American Mathematical Society, 7, 48–50. https://doi.org/10.1090/S0002-9939-1956-0078686-7
- Küçükyavuz, S., Sen, S., 2017. An introduction to two-stage stochastic mixed-integer programming. In R. Batta & J. Peng (Eds.), Leading developments from INFORMS communities. INFORMS TutORials in operations research (pp. 1–27). INFORMS.
- Kuhn, H., 1955. The Hungarian method for the assignment problem. Naval Research Logistics Quarterly, 2, 83–97. https://doi.org/10.1002/nav.3800020109
- Kuhn, H., 1956. Variants of the Hungarian method for the assignment problem. Naval Research Logistics Quarterly, 3, 253–258. https://doi.org/10.1002/nav.3800030404
- Kumar, S., Swaminathan, J. M., 2003. Diffusion of innovations under supply constraints. Operations Research, 51 (6), 866–879. https://doi.org/10.1287/opre.51.6.866.24918
- Kunc, M., 2017a. System dynamics: A soft and hard approach to modelling. In W. K. V. Chan, A. D’Ambrogio, G. Zacharewicz, N. Mustafee, G. Wainer, & E. Page (Eds.), Proceedings of the 2017 Winter Simulation Conference, Las Vegas, NV (pp. 597–606).
- Kunc, M., 2017b. System dynamics: Soft and hard operational research. Springer.
- Kunc, M., Harper, P., Katsikopoulos, K., 2020. A review of implementation of behavioural aspects in the application of OR in healthcare. Journal of the Operational Research Society, 71 (7), 1055–1072. https://doi.org/10.1080/01605682.2018.1489355
- Kunc, M., Malpass, J., White, L., 2016. Behavioral operational research: Theory, methodology and practice. Springer.
- Kunc, M., Mortenson, M. J., Vidgen, R., 2018. A computational literature review of the field of system dynamics from 1974 to 2017. Journal of Simulation, 12 (2), 115–127. https://doi.org/10.1080/17477778.2018.1468950
- Künnen, J. R., Strauss, A. K., 2022. The value of flexible flight-to-route assignments in pre-tactical air traffic management. Transportation Research Part B: Methodological, 160, 76–96. https://doi.org/10.1016/j.trb.2022.04.004
- Kunnumkal, S., Topaloglu, H., 2009. A stochastic approximation method for the single-leg revenue management problem with discrete demand distributions. Mathematical Methods of Operations Research, 70 (3), 477–504. https://doi.org/10.1007/s00186-008-0278-x
- Kunnumkal, S., Topaloglu, H., 2010. A new dynamic programming decomposition method for the network revenue management problem with customer choice behavior. Production and Operations Management, 19 (5), 575–590. https://doi.org/10.1111/j.1937-5956.2009.01118.x
- Kunz, N., Van Wassenhove, L. N., Besiou, M., Hambye, C., Kovacs, G., 2017. Relevance of humanitarian logistics research: Best practices and way forward. International Journal of Operations & Production Management, 37 (11), 1585–1599. https://doi.org/10.1108/IJOPM-04-2016-0202
- Kuosmanen, T., 2005. Weak disposability in nonparametric production analysis with undesirable outputs. American Journal of Agricultural Economics, 87 (4), 1077–1082. https://doi.org/10.1111/j.1467-8276.2005.00788.x
- Kusner, M. J., Loftus, J., Russell, C., Silva, R., 2017. Counterfactual fairness. In I. Guyon, U. Von Luxburg, S. Bengio, H. Wallach, R. Fergus, S. Vishwanathan, R. Garnett (Eds.), Proceedings of Advances in Neural Information Processing Systems 30 (NIPS 2017). Curran Associates, Inc.
- Labbé, M., Violin, A., 2016. Bilevel programming and price setting problems. Annals of Operations Research, 240, 141–169. https://doi.org/10.1007/s10479-015-2016-0
- Laborie, P., Nuijten, W., 2008. Constraint programming formulations and propagation algorithms. In C. Artigues, S. Demassey, E. Néron (Eds.), Resource-constrained project scheduling (pp. 63–72). ISTE.
- Lad’anyi, L., 2004. BCP. https://projects.coin-or.org/Bcp
- Lago, J., De Ridder, F., De Schutter, B., 2018. Forecasting spot electricity prices: Deep learning approaches and empirical comparison of traditional algorithms. Applied Energy, 221, 386–405. https://doi.org/10.1016/j.apenergy.2018.02.069
- Lago, J., Marcjasz, G., De Schutter, B., Weron, R., 2021. Forecasting day-ahead electricity prices: A review of state-of-the-art algorithms, best practices and an open-access benchmark. Applied Energy, 293, 116983. https://doi.org/10.1016/j.apenergy.2021.116983
- Laguna, M., Martí, R., 2013. Heuristics. In S. I. Gass & M. C. Fu (Eds.), Encyclopedia of operations research and management science (pp. 695–703). Springer.
- Lahtinen, T. J., Hämäläinen, R. P., Liesiö, J., 2017. Portfolio decision analysis methods in environmental decision making. Environmental Modelling & Software, 94, 73–86. https://doi.org/10.1016/j.envsoft.2017.04.001
- Lai, X., Wu, L., Wang, K., Wang, F., 2022. Robust ship fleet deployment with shipping revenue management. Transportation Research Part B: Methodological, 161, 169–196. https://doi.org/10.1016/j.trb.2022.05.005
- Lai, Y.-C., Fan, D.-C., Huang, K.-L., 2015. Optimizing rolling stock assignment and maintenance plan for passenger railway operations. Computers & Industrial Engineering, 85, 284–295. https://doi.org/10.1016/j.cie.2015.03.016
- Lamas-Fernandez, C., Bennell, J. A., Martinez-Sykora, A., 2022. Voxel-based solution approaches to the three-dimensional irregular packing problem. Operations Research, https://doi.org/10.1287/opre.2022.2260
- Lambert, A. J. D., 2003. Disassembly sequencing: A survey. International Journal of Production Research, 41 (16), 3721–3759. https://doi.org/10.1080/0020754031000120078
- Lambrechts, O., Demeulemeester, E., Herroelen, W., 2008. A tabu search procedure for developing robust predictive project schedules. International Journal of Production Economics, 111 (2), 493–508. https://doi.org/10.1016/j.ijpe.2007.02.003
- Lan, S., Clarke, J.-P., Barnhart, C., 2006. Planning for robust airline operations: Optimizing aircraft routings and flight departure times to minimize passenger disruptions. Transportation Science, 40 (1), 15–28. https://doi.org/10.1287/trsc.1050.0134
- Lan, T., Chiang, M., 2011. An axiomatic theory of fairness in resource allocation. Tech. Rep. Princeton University.
- Lan, T., Kao, D., Chiang, M., 2010. An axiomatic theory of fairness in network resource allocation. In 2010 Proceedings of the 30th IEEE International Conference on Computer Communications (INFOCOM) (pp. 1–9).
- Land, A., Doig, A., 1960. An automatic method of solving discrete programming problems. Econometrica, 28, 497–520. https://doi.org/10.2307/1910129
- Lane, D. C., Monefeldt, C., Rosenhead, J. V., 2000. Looking in the wrong place for healthcare improvements: A system dynamics study of an accident and emergency department. Journal of the Operational Research Society, 51 (5), 518–531. https://doi.org/10.2307/254183
- Lane, D. C., Oliva, R., 1998. The greater whole: Towards a synthesis of system dynamics and soft systems methodology. European Journal of Operational Research, 107 (1), 214–235. https://doi.org/10.1016/S0377-2217(97)00205-1
- Lane, D. C., Rouwette, E. A. J. A., 2023. Towards a behavioural system dynamics: Exploring its scope and delineating its promise. European Journal of Operational Research, 306 (2), 777–794. https://doi.org/10.1016/j.ejor.2022.08.017
- Lang, M. A., Cleophas, C., Ehmke, J. F., 2021a. Anticipative dynamic slotting for attended home deliveries. In Operations research forum (Vol. 2, pp. 1–39). Springer. https://doi.org/10.1007/s43069-021-00086-9
- Lang, S., Reggelin, T., Müller, M., Nahhas, A., 2021b. Open-source discrete-event simulation software for applications in production and logistics: An alternative to commercial tools? Procedia Computer Science, 180, 978–987. https://doi.org/10.1016/j.procs.2021.01.349
- Langville, A. N., Meyer, C. D., 2013. Who’s #1?: The science of rating and ranking. Princeton University Press.
- Laporte, G., 1992. The vehicle routing problem: An overview of exact and approximate algorithms. European Journal of Operational Research, 59 (3), 345–358. https://doi.org/10.1016/0377-2217(92)90192-C
- Laporte, G., 2009. Fifty years of vehicle routing. Transportation Science, 43 (4), 408–416. https://doi.org/10.1287/trsc.1090.0301
- Laporte, G., Marín, A., Mesa, J. A., Ortega, F. A., 2007. An integrated methodology for the rapid transit network design problem. In F. Geraets, L. Kroon, A. Schöebel, D. Wagner, & C. Zaroliagis (Eds.), Algorithmic methods for railway optimization. Vol. 4359 of Lecture Notes in Computer Science.(pp. 187–199). Springer.
- Laporte, G., Nickel, S., Saldanha da Gama, F. (Eds.), 2015. Location science. Springer.
- Laporte, G., Pascoal, M. M. B., 2015. Path based algorithms for metro network design. Computers & Operations Research, 62, 78–94. https://doi.org/10.1016/j.cor.2015.04.007
- Laporte, G., Rancourt, M.-È., Rodríguez-Pereira, J., Silvestri, S., 2022. Optimizing access to drinking water in remote areas. Application to Nepal. Computers & Operations Research, 140, 105669. https://doi.org/10.1016/j.cor.2021.105669
- Lariviere, M. A., 2016. OM Forum—Supply chain contracting: Doughnuts to bubbles. Manufacturing & Service Operations Management, 18 (3), 309–313. https://doi.org/10.1287/msom.2015.0567
- Larkin, J. H., Simon, H. A., 1987. Why a diagram is (sometimes) worth ten thousand words. Cognitive Science, 11 (1), 65–100. https://doi.org/10.1111/j.1551-6708.1987.tb00863.x
- Lasry, J., Lions, P., 2006a. Jeux à champ moyen. I–le cas stationnaire. Comptes Rendus Mathématique, 343, 619–625. https://doi.org/10.1016/j.crma.2006.09.019
- Lasry, J., Lions, P., 2006b. Jeux à champ moyen. II–horizon fini et contrôle optimal. Comptes Rendus Mathématique, 343, 679–684. https://doi.org/10.1016/j.crma.2006.09.018
- Lasry, J., Lions, P., 2007. Mean field games. Japanese Journal of Mathematics, 2, 229–260. https://doi.org/10.1007/s11537-007-0657-8
- Latouche, G., Ramaswami, V., 1999. Introduction to matrix analytic methods in stochastic modeling. Society for Industrial and Applied Mathematics.
- Lauwens, B., 2021. SimJulia. https://github.com/BenLauwens/SimJulia.jl
- Lavoie, S., Minoux, M., Odier, E., 1988. A new approach for crew pairing problems by column generation with an application to air transportation. European Journal of Operational Research, 35 (1), 45–58. https://doi.org/10.1016/0377-2217(88)90377-3
- Law. 2003. How to conduct a successful simulation study. In Proceedings of the 2003 Winter Simulation Conference (Vol. 1. pp. 66–70).
- Law, A. M., 2015. Simulation modeling and analysis (5th ed.). McGraw-Hill Education
- Lawler, E., 1976. Combinatorial optimization: Networks and matroids. Holt, Rinehart and Winston.
- Lawler, E. L., Lenstra, J. K., Rinnooy Kan, A. H. G., Shmoys, D. B. (Eds.), 1985. The traveling salesman problem (A guided tour of combinatorial optimization). Wiley, .
- Lawrence, M., Goodwin, P., O’Connor, M., Önkal, D., 2006. Judgmental forecasting: A review of progress over the last 25 years. International Journal of Forecasting, 22 (3), 493–518. https://doi.org/10.1016/j.ijforecast.2006.03.007
- Le Menestrel, M., Van Wassenhove, L. N., 2004. Ethics outside, within, or beyond OR models? European Journal of Operational Research, 153 (2), 477–484. https://doi.org/10.1016/S0377-2217(03)00168-1
- Lebedev, D., Goulart, P., Margellos, K., 2021. A dynamic programming framework for optimal delivery time slot pricing. European Journal of Operational Research, 292 (2), 456–468. https://doi.org/10.1016/j.ejor.2020.11.010
- Lecun, Y., 1989. Generalization and network design strategies. In R. Pfeifer, Z. Schreter, F. Fogelman, L. Steels (Eds.), Connectionism in perspective. Elsevier.
- L’Ecuyer, P., 2009. Quasi-Monte Carlo methods with applications in finance. Finance and Stochastics, 13 (3), 307–349. https://doi.org/10.1007/s00780-009-0095-y
- Lee, B. L., Johnes, J., 2022. Using network DEA to inform policy: The case of the teaching quality of higher education in England. Higher Education Quarterly, 76 (2), 399–421. https://doi.org/10.1111/hequ.12307
- Lee, D. B., 1973. Requiem for Large-Scale models. Journal of the American Institute of Planners, 39 (3), 163–178. https://doi.org/10.1080/01944367308977851
- Lee, H. L., Padmanabhan, V., Whang, S., 1997. Information distortion in a supply chain: The bullwhip effect. Management Science, 43 (4), 546–558. https://doi.org/10.1287/mnsc.43.4.546
- Lee, H. L., So, K. C., Tang, C. S., 2000. The value of information sharing in a two-level supply chain. Management Science, 46 (5), 626–643. https://doi.org/10.1287/mnsc.46.5.626.12047
- Lee, J., Leyffer, S. (Eds.), 2012. Mixed integer nonlinear programming. Springer.
- Lee, S. K., Mogi, G., Li, Z., Hui, K. S., Lee, S. K., Hui, K. N., Park, S. Y., Ha, Y. J., Kim, J. W., 2011. Measuring the relative efficiency of hydrogen energy technologies for implementing the hydrogen economy: An integrated fuzzy AHP/DEA approach. International Journal of Hydrogen Energy, 36 (20), 12655–12663. https://doi.org/10.1016/j.ijhydene.2011.06.135
- Lehtonen, J.-M., Virtanen, K., 2022. Choosing the most economically advantageous tender using a multi-criteria decision analysis approach. Journal of Public Procurement, 22 (2), 164–179. https://doi.org/10.1108/JOPP-06-2021-0040
- Lempert, R. J., Turner, S., 2021. Engaging multiple worldviews with quantitative decision support: A robust decision-making demonstration using the lake model. Risk Analysis, 41 (6), 845–865. https://doi.org/10.1111/risa.13579
- Lenstra, H., 1983. Integer programming with a fixed number of variables. Mathematics of Operations Research, 8, 538–548. https://doi.org/10.1287/moor.8.4.538
- Leontief, W. W., 1936. Quantitative input and output relations in the economic systems of the United States. Review of Economics and Statistics, 18 (3), 105–125. https://doi.org/10.2307/1927837
- Lepenioti, K., Bousdekis, A., Apostolou, D., Mentzas, G., 2020. Prescriptive analytics: Literature review and research challenges. International Journal of Information Management, 50, 57–70. https://doi.org/10.1016/j.ijinfomgt.2019.04.003
- Lettovskỳ, L., Johnson, E. L., Nemhauser, G. L., 2000. Airline crew recovery. Transportation Science, 34 (4), 337–348. https://doi.org/10.1287/trsc.34.4.337.12316
- Leus, R., Herroelen, W., 2004. Stability and resource allocation in project planning. IIE Transactions, 36 (7), 667–682. https://doi.org/10.1080/07408170490447348
- Lev, B., Bloom, J., Gleit, A., Murphy, F., Shoemaker, C., 1987. Strategic planning in energy and natural resources. North-Holland.
- Levin, M., 1994. Action research and critical systems thinking: Two icons carved out of the same log? Systems Practice, 7 (1), 25–41. https://doi.org/10.1007/BF02169163
- Levine, H. A., 2005. Project portfolio management: A practical guide to selecting projects, managing portfolios, and maximizing benefits. Wiley India Pvt. Limited.
- Levitt, T., 1972. Production-line approach to service. Harvard Business Review, 50 (5), 41–52.
- Lewis, M., 2003. Moneyball: The art of winning an unfair game. WW Norton.
- Li, C., Grossmann, I. E., 2021. A review of stochastic programming methods for optimization of process systems under uncertainty. Frontiers of Chemical Engineering in China, 2.
- Li, D., Ding, L., Connor, S., 2020. When to switch? Index policies for resource scheduling in emergency response. Production and Operations Management, 29 (2), 241–262. https://doi.org/10.1111/poms.13105
- Li, D., Ng, W.-L., 2000. Optimal dynamic portfolio selection: Multiperiod mean-variance formulation. Mathematical Finance, 10 (3), 387–406. https://doi.org/10.1111/1467-9965.00100
- Li, D., Pang, Z., 2017. Dynamic booking control for car rental revenue management: A decomposition approach. European Journal of Operational Research, 256 (3), 850–867. https://doi.org/10.1016/j.ejor.2016.06.044
- Li, D., Pang, Z., Qian, L., 2022a. Bid price controls for car rental network revenue management. Production and Operations Management.
- Li, F., Wang, Y., Emrouznejad, A., Zhu, Q., Kou, G., 2021. Allocating a fixed cost across decision-making units with undesirable outputs: A bargaining game approach. Journal of the Operational Research Society, 73 (10), 2309–2325. https://doi.org/10.1080/01605682.2021.1981781
- Li, H., Womer, N. K., 2015. Solving stochastic resource-constrained project scheduling problems by closed-loop approximate dynamic programming. European Journal of Operational Research, 246 (1), 20–33. https://doi.org/10.1016/j.ejor.2015.04.015
- Li, J., 2021. Deterministic mincut in almost-linear time. In Proceedings of the 53rd Annual ACM SIGACT Symposium on Theory of Computing . STOC 2021. Association for Computing Machinery, New York, NY, USA (pp. 384–395). https://doi.org/10.1145/3406325.3451114
- Li, L., Huan, Y., Kunc, M., 2022b. The impact of forum content on data science open innovation performance: A system dynamics-based causal machine learning approach. Working paper, Southampton Business School.
- Li, Q., Yu, P., 2023. Perishable inventory systems. In J.-S. Song (Ed.), Research handbook on inventory management. Edward Elgar Publishing.
- Li, Z., Mutha, A., Ryan, J., Sun, D., 2023. Mechanism design under asymmetric information regarding demand for remanufactured products. Working paper, University of Vermont, Burlington, Vermont, USA.
- Liao, Y., Deschamps, F., Loures, E. d. F. R., Ramos, L. F. P., 2017. Past, present and future of industry 4.0 – A systematic literature review and research agenda proposal. International Journal of Production Research, 55 (12), 3609–3629. https://doi.org/10.1080/00207543.2017.1308576
- Liebchen, C., Möhring, R., 2002. A case study in periodic timetabling. Electronic Notes in Theoretical Computer Science, 66 (6), 1–14. https://doi.org/10.1016/S1571-0661(04)80526-7
- Liesiö, J., Salo, A., Keisler, J. M., Morton, A., 2021. Portfolio decision analysis: Recent developments and future prospects. European Journal of Operational Research, 293 (3), 811–825. https://doi.org/10.1016/j.ejor.2020.12.015
- Lilienfeld, R., 1978. The rise of systems theory: An ideological analysis. Wiley.
- Lilley, R., Whitehead, M., Midgley, G., 2022. Mindfulness and behavioural insights: Reflections on the meditative brain, systems theory and organizational change. Journal of Awareness-Based System Change, 2 (2), 29–57. https://doi.org/10.47061/jasc.v2i2.3857
- Lin, D.-Y., Liu, H.-Y., 2011. Combined ship allocation, routing and freight assignment in tramp shipping. Transportation Research Part E: Logistics and Transportation Review, 47 (4), 414–431. https://doi.org/10.1016/j.tre.2010.12.003
- Lin, S., Kernighan, B. W., 1973. An effective heuristic algorithm for the traveling-salesman problem. Operations Research, 21 (2), 498–516. https://doi.org/10.1287/opre.21.2.498
- Lin, Y., Leung, J. M. Y., Zhang, L., Gu, J.-W., 2020a. Single-item repairable inventory system with stochastic new and warranty demands. Transportation Research Part E: Logistics and Transportation Review, 142, 102035. https://doi.org/10.1016/j.tre.2020.102035
- Lin, Y. H., Wang, Y., He, D., Lee, L. H., 2020b. Last-mile delivery: Optimal locker location under multinomial logit choice model. Transportation Research Part E: Logistics and Transportation Review, 142, 102059. https://doi.org/10.1016/j.tre.2020.102059
- Linderoth, J., Ralphs, T., 2005. Noncommercial software for mixed-integer linear programming. In J. Karlof (Ed.), Integer programming (1st ed., Ch. 10, pp. 1–52). CRC Press.
- Linderoth, J., Shapiro, A., Wright, S., 2006. The empirical behavior of sampling methods for stochastic programming. Annals of Operations Research, 142 (1), 215–241. https://doi.org/10.1007/s10479-006-6169-8
- Lindner, F., Reiner, G., Keil, S., 2022. Review, trends, and opportunities of visualizations in manufacturing and production management: A behavioural operations perspective. In Machuca et al. (Ed.), Proceedings of the 6th World Conference on Production and Operations Management (pp. 546–555).
- Lismont, J., Vanthienen, J., Baesens, B., Lemahieu, W., 2017. Defining analytics maturity indicators: A survey approach. International Journal of Information Management, 37 (3), 114–124. https://doi.org/10.1016/j.ijinfomgt.2016.12.003
- Littlewood, K., 1972. Forecasting and control of passenger bookings. In Airline Group International Federation of Operational Research Societies Proceedings , 1972 (Vol. 12, pp. 95–117).
- Littlewood, K., 2005. Special issue papers: Forecasting and control of passenger bookings. Journal of Revenue and Pricing Management, 4 (2), 111–123. https://doi.org/10.1057/palgrave.rpm.5170134
- Liu, C., Stecke, K. E., Lian, J., Yin, Y., 2014. An implementation framework for seru production. International Transactions in Operational Research, 21 (1), 1–19. https://doi.org/10.1111/itor.12014
- Liu, G., Luo, Y., Schulte, O., Kharrat, T., 2020. Deep soccer analytics: Learning an action-value function for evaluating soccer players. Data Mining and Knowledge Discovery, 34 (5), 1531–1559. https://doi.org/10.1007/s10618-020-00705-9
- Liu, Q., van Ryzin, G., 2008. On the choice-based linear programming model for network revenue management. Manufacturing & Service Operations Management, 10 (2), 288–310. https://doi.org/10.1287/msom.1070.0169
- Ljubić, I., 2007. A hybrid VNS for connected facility location. Lecture Notes in Computer Science, 4771, 157–169.
- Ljubić, I., 2021. Solving Steiner trees: Recent advances, challenges, and perspectives. Networks, 77 (2), 177–204. https://doi.org/10.1002/net.22005
- Lo, H. K., McCord, M. R., 1998. Adaptive ship routing through stochastic ocean currents: General formulations and empirical results. Transportation Research Part A: Policy and Practice, 32 (7), 547–561. https://doi.org/10.1016/S0965-8564(98)00018-4
- Loch, C. H., Wu, Y., 2007. Behavioral operations management. Now Publishers Inc.
- Locoro, A., Fisher, W. P., Mari, L., 2021. Visual information literacy: Definition, construct modeling and assessment. IEEE Access, 9, 71053–71071. https://doi.org/10.1109/ACCESS.2021.3078429
- Lodi, A., Martello, S., Monaci, M., Vigo, D., 2014. Two-dimensional bin packing problems. In V. T. Paschos (Ed.), Paradigms of combinatorial optimization (pp. 107–129). John Wiley & Sons.
- Lodi, A., Zarpellon, G., 2017. On learning and branching: A survey. Top, 25 (2), 207–236. https://doi.org/10.1007/s11750-017-0451-6
- Lohatepanont, M., Barnhart, C., 2004. Airline schedule planning: Integrated models and algorithms for schedule design and fleet assignment. Transportation Science, 38 (1), 19–32. https://doi.org/10.1287/trsc.1030.0026
- Long, K. M., Meadows, G. N., 2018. Simulation modelling in mental health: A systematic review. Journal of Simulation, 12 (1), 76–85. https://doi.org/10.1057/s41273-017-0062-0
- Long, Y., Pan, J., Zhang, Q., Hao, Y., 2017. 3D printing technology and its impact on chinese manufacturing. International Journal of Production Research, 55 (5), 1488–1497. https://doi.org/10.1080/00207543.2017.1280196
- Longstaff, F. A., Schwartz, E. S., 2001. Valuing American options by simulation: A simple least-squares approach. The Review of Financial Studies, 14 (1), 113–147. https://doi.org/10.1093/rfs/14.1.113
- López-Torres, L., Johnes, J., Elliott, C., Polo, C., 2021. The effects of competition and collaboration on efficiency in the UK independent school sector. Economic Modelling, 96, 40–53. https://doi.org/10.1016/j.econmod.2020.12.020
- Lovász, L., Schrijver, A., 1991. Cones of matrices and set-functions and 0–1 optimization. SIAM Journal on Optimization, 1, 166–190. https://doi.org/10.1137/0801013
- Lowe, D., Espinosa, A., Yearworth, M., 2020. Constitutive rules for guiding the use of the viable system model: Reflections on practice. European Journal of Operational Research, 287 (3), 1014–1035. https://doi.org/10.1016/j.ejor.2020.05.030
- Lowe, D., Yearworth, M., 2019. Response to viewpoint: Whither problem structuring methods (PSMs)? Journal of the Operational Research Society, 70 (8), 1393–1395. https://doi.org/10.1080/01605682.2018.1502629
- Lozano, S., 2014. Company-wide production planning using a multiple technology DEA approach. Journal of the Operational Research Society, 65 (5), 723–734. https://doi.org/10.1057/jors.2012.171
- Lozano, S., Villa, G., 2004. Centralized resource allocation using data envelopment analysis. Journal of Productivity Analysis, 22 (1), 143–161. https://doi.org/10.1023/B:PROD.0000034748.22820.33
- Lozano, S., Villa, G., 2005. Determining a sequence of targets in DEA. Journal of the Operational Research Society, 56 (12), 1439–1447. https://doi.org/10.1057/palgrave.jors.2601964
- Lu, H.-P., Yu, H.-J., Lu, S. S. K., 2001. The effects of cognitive style and model type on DSS acceptance: An empirical study. European Journal of Operational Research, 131 (3), 649–663. https://doi.org/10.1016/S0377-2217(00)00107-7
- Lu, J., Chen, W., Ma, Y., Ke, J., Li, Z., Zhang, F., Maciejewski, R., 2017. Recent progress and trends in predictive visual analytics. Frontiers of Computer Science, 11 (2), 192–207. https://doi.org/10.1007/s11704-016-6028-y
- Luck, M., 1984. Working with inner city community organizations. In K. Bowen, A. Cook, & M. Luck (Eds.), The writings of Steve Cook (pp. 77–78). Operational Research Society.
- Luenberger, D. G., Ye, Y., 2016. Linear and nonlinear programming. In International series in operations research & management science (4th ed.). Springer.
- Luis, E., Dolinskaya, I. S., Smilowitz, K. R., 2012. Disaster relief routing: Integrating research and practice. Socio-economic Planning Sciences, 46 (1), 88–97. https://doi.org/10.1016/j.seps.2011.06.001
- Lund, D., Oksendal, B., 1991. Stochastic models and option values: Applications to resources, environment and investment problems. Emerald.
- Lundell, A., Kronqvist, J., Westerlund, T., 2022. The supporting hyperplane optimization toolkit for convex MINLP. Journal of Global Optimization, 84, 1–41. https://doi.org/10.1007/s10898-022-01128-0
- Lustig, I., Dietrich, B., Johnson, C., Dziekan, C., 2010. The analytics journey. Analytics Nov/Dec 2010, 11–18.
- Lysgaard, J., Letchford, A., Eglese, R., 2004. A new branch-and-cut algorithm for the capacitated vehicle routing problem. Mathematical Programming, 100, 423–445. https://doi.org/10.1007/s10107-003-0481-8
- Ma, Y., Zhang, W., Branke, J., 2022. Multi-objective optimisation of multifaceted maintenance strategies for wind farms. Journal of the Operational Research Society, 1–16, https://doi.org/10.1080/01605682.2022.2085066
- Maas, W. J., Lahr, M. M. H., Uyttenboogaart, M., Buskens, E., van der Zee, D.-J. 2022. Expediting workflow in the acute stroke pathway for endovascular thrombectomy in the northern Netherlands: A simulation model. BMJ Open, 12 (4), e056415. https://doi.org/10.1136/bmjopen-2021-056415
- Macal, C. M., 2016. Everything you need to know about agent-based modelling and simulation. Journal of Simulation, 10 (2), 144–156. https://doi.org/10.1057/jos.2016.7
- Macdonald, B., 2012. Adjusted plus-minus for NHL players using ridge regression with goals, shots, Fenwick, and Corsi. Journal of Quantitative Analysis in Sports, 8 (3), 1–24. https://doi.org/10.1515/1559-0410.1447
- Maciejowska, K., Nitka, W., Weron, T., 2021. Enhancing load, wind and solar generation for day-ahead forecasting of electricity prices. Energy Economics, 99, 105273. https://doi.org/10.1016/j.eneco.2021.105273
- Maciejowska, K., Nowotarski, J., 2016. A hybrid model for GEFCom2014 probabilistic electricity price forecasting. International Journal of Forecasting, 32 (3), 1051–1056. https://doi.org/10.1016/j.ijforecast.2015.11.008
- Mackert, J., 2019. Choice-based dynamic time slot management in attended home delivery. Computers & Industrial Engineering, 129, 333–345. https://doi.org/10.1016/j.cie.2019.01.048
- MacQueen, J. B., 1967. Some methods for classification and analysis of multivariate observations. In L. M. L. Cam & J. Neyman (Eds.), Proc. of the fifth Berkeley Symposium on Mathematical Statistics and Probability (Vol. 1, , pp. 281–297). University of California Press.
- Macrina, G., Laporte, G., Guerriero, F., Di Puglia Pugliese, L., 2019. An energy-efficient green-vehicle routing problem with mixed vehicle fleet, partial battery recharging and time windows. European Journal of Operational Research, 276 (3), 971–982. https://doi.org/10.1016/j.ejor.2019.01.067
- Maculan, N., 1987. The Steiner problem in graphs. Annals of Discrete Mathematics, 31, 185–211.
- Magirou, E. F., Psaraftis, H. N., Bouritas, T., 2015. The economic speed of an oceangoing vessel in a dynamic setting. Transportation Research Part B: Methodological, 76, 48–67. https://doi.org/10.1016/j.trb.2015.03.001
- Magnanti, T. L., Wolsey, L. A., 1995. Optimal trees. Handbooks in Operations Research and Management Science, 7, 503–615.
- Magnanti, T. L., Wong, R. T., 1981. Accelerating benders decomposition: Algorithmic enhancement and model selection criteria. Operations Research, 29 (3), 464–484. https://doi.org/10.1287/opre.29.3.464
- Magnanti, T. L., Wong, R. T., 1984. Network design and transportation planning: Models and algorithms. Transportation Science, 18 (1), 1–55. https://doi.org/10.1287/trsc.18.1.1
- Mahar, S., Wright, P. D., 2017. In-store pickup and returns for a dual channel retailer. IEEE Transactions on Engineering Management, 64 (4), 491–504. https://doi.org/10.1109/TEM.2017.2691466
- Maharjan, R., Shrestha, Y., Rakhal, B., Suman, S., Hulst, J., Hanaoka, S., 2020. Mobile logistics hubs prepositioning for emergency preparedness and response in Nepal. Journal of Humanitarian Logistics and Supply Chain Management, 10 (4), 555–572. https://doi.org/10.1108/JHLSCM-01-2020-0004
- Maher, S. J., 2016. Solving the integrated airline recovery problem using column-and-row generation. Transportation Science, 50 (1), 216–239. https://doi.org/10.1287/trsc.2014.0552
- Mahler, V., Girard, R., Kariniotakis, G., 2022. Data-driven structural modeling of electricity price dynamics. Energy Economics, 107, 105811. https://doi.org/10.1016/j.eneco.2022.105811
- Mahmoudi, M., Shirzad, K., Verter, V., 2022. Decision support models for managing food aid supply chains: A systematic literature review. Socio-Economic Planning Sciences, 101255. https://doi.org/10.1016/j.seps.2022.101255
- Maister, D. H., 1976. Centralisation of inventories and the “square root law”. International Journal of Physical Distribution, 6 (3), 124–134. https://doi.org/10.1108/eb014366
- Makhorin, A., 2020. GNU linear programming kit (GLPK). https://www.gnu.org/software/glpk
- Makridakis, S., Hyndman, R. J., Petropoulos, F., 2020a. Forecasting in social settings: The state of the art. International Journal of Forecasting, 36 (1), 15–28. https://doi.org/10.1016/j.ijforecast.2019.05.011
- Makridakis, S., Spiliotis, E., Assimakopoulos, V., 2020b. The M4 competition: 100,000 time series and 61 forecasting methods. International Journal of Forecasting, 36 (1), 54–74. https://doi.org/10.1016/j.ijforecast.2019.04.014
- Malcolm, D. G., Roseboom, J. H., Clark, C. E., Fazar, W., 1959. Application of a technique for research and development program evaluation. Operations Research, 7 (5), 646–669. https://doi.org/10.1287/opre.7.5.646
- Malczewski, J., Jankowski, P., 2020. Emerging trends and research frontiers in spatial multicriteria analysis. International Journal of Geographical Information Science, 34 (7), 1257–1282. https://doi.org/10.1080/13658816.2020.1712403
- Malecki, K. M. C., Keating, J. A., Safdar, N., 2020. Crisis communication and public perception of COVID-19 risk in the era of social media. Clinical Infectious Diseases, 72 (4), 697–702. https://doi.org/10.1093/cid/ciaa758
- Malmquist, S., 1953. Index numbers and indifference surfaces. Trabajos de Estadistica, 4 (2), 209–242. https://doi.org/10.1007/BF03006863
- Mandelbaum, A., Massey, W. A., Reiman, M. I., Rider, B., 1999. Time varying multiserver queues with abandonment and retrials. In Proceedings of the 16th International Teletraffic Conference (Vol. 4. pp. 4–7).
- Mandelbaum, A., Stolyar, A. L., 2004. Scheduling flexible servers with convex delay costs: Heavy-traffic optimality of the generalized c μ-rule. Operations Research, 52 (6), 836–855.
- Manerba, D., Mansini, R., 2014. An effective matheuristic for the capacitated total quantity discount problem. Computers & Operations Research, 41, 1–11. https://doi.org/10.1016/j.cor.2013.07.019
- Mangasarian, O. L., 1994. Nonlinear programming. SIAM.
- Maniezzo, V., Stützle, T., Voß, S., 2021. Matheuristics. Springer.
- Mansikka, H., Virtanen, K., Harris, D., 2019. Dissociation between mental workload, performance, and task awareness in pilots of high performance aircraft. IEEE Transactions on Human-Machine Systems, 49 (1), 1–9. https://doi.org/10.1109/THMS.2018.2874186
- Mansikka, H., Virtanen, K., Harris, D., Jalava, M., 2021a. Measurement of team performance in air combat – have we been underperforming? Theoretical Issues in Ergonomics Science, 22 (3), 338–359. https://doi.org/10.1080/1463922X.2020.1779382
- Mansikka, H., Virtanen, K., Harris, D., Salomäki, J., 2021b. Live–virtual–constructive simulation for testing and evaluation of air combat tactics, techniques, and procedures, Part 1: Assessment framework. The Journal of Defense Modeling and Simulation, 18 (4), 285–293. https://doi.org/10.1177/1548512919886375
- Maoz, M., 2013. How IT should deepen big data analysis to support customer-centricity. Tech. Rep. G00248980, Gartner.
- Mar-Molinero, C., Mingers, J., 2007. An evaluation of the limitations of, and alternatives to, the co-plot methodology. Journal of the Operational Research Society, 58 (7), 874–886. https://doi.org/10.1057/palgrave.jors.2602228
- Marcjasz, G., Narajewski, M., Weron, R., Ziel, F., 2022. Distributional neural networks for electricity price forecasting. arXiv:2207.02832.
- Mardani, A., Zavadskas, E. K., Streimikiene, D., Jusoh, A., Khoshnoudi, M., 2017. A comprehensive review of data envelopment analysis (DEA) approach in energy efficiency. Renewable and Sustainable Energy Reviews, 70 (1), 1298–1322. https://doi.org/10.1016/j.rser.2016.12.030
- Marín, A., Pelegrín, M., 2019. p-median problems. In G. Laporte, S. Nickel, &, F. Saldanha da Gama (Eds.), Location science (pp. 25–50). Springer.
- Markowitz, H., 1952. Portfolio selection. Journal of Finance, 7 (1), 77–91. https://doi.org/10.2307/2975974
- Markowitz, H., Manne, A., 1957. On the solution of discrete programming problems. Econometrica, 25, 84–110. https://doi.org/10.2307/1907744
- Markowitz, H. M., Todd, G. P., 2000. Mean-variance analysis in portfolio choice and capital markets. Wiley.
- Marla, L., Vaaben, B., Barnhart, C., 2017. Integrated disruption management and flight planning to trade off delays and fuel burn. Transportation Science, 51 (1), 88–111. https://doi.org/10.1287/trsc.2015.0609
- Marler, R. T., Arora, J. S., 2004. Survey of multi-objective optimization methods for engineering. Structural and Multidisciplinary Optimization, 26, 369–395. https://doi.org/10.1007/s00158-003-0368-6
- Maróti, G., Kroon, L., 2005. Maintenance routing for train units: The transition model. Transportation Science, 39 (4), 518–525. https://doi.org/10.1287/trsc.1050.0116
- Maróti, G., Kroon, L., 2007. Maintenance routing for train units: The interchange model. Computers & Operations Research, 34 (4), 1121–1140. https://doi.org/10.1016/j.cor.2005.05.026
- Martello, S., 2010. Jeno Egerváry: From the origins of the Hungarian algorithm to satellite communication. Central European Journal of Operations Research, 18, 47–58. https://doi.org/10.1007/s10100-009-0125-z
- Martello, S., Laporte, G., Minoux, M., Ribeiro, C. (Eds.), 1987. Surveys in combinatorial optimization. In Annals of discrete mathematics (Vol. 31). North-Holland.
- Martello, S., Monaci, M., Vigo, D., 2003. An exact approach to the strip-packing problem. INFORMS Journal on Computing, 15 (3), 310–319. https://doi.org/10.1287/ijoc.15.3.310.16082
- Martello, S., Toth, P., 1990. Knapsack problems: Algorithms and computer implementations. Wiley.
- Martí, R., Pardalos, P. M., Resende, M. G. C., 2018. Handbook of heuristics. Springer.
- Martin-Martinez, E., Samsó, R., Houghton, J., Solé, J., 2022. PySD: System dynamics modeling in python. Journal of Open Source Software, 7 (78), 4329. https://doi.org/10.21105/joss.04329
- Martinovic, J., Scheithauer, G., Valério de Carvalho, J. M., 2018. A comparative study of the arcflow model and the one-cut model for one-dimensional cutting stock problems. European Journal of Operational Research, 266 (2), 458–471. https://doi.org/10.1016/j.ejor.2017.10.008
- Marttunen, M., Belton, V., Lienert, J., 2018. Are objectives hierarchy related biases observed in practice? A meta-analysis of environmental and energy applications of Multi-Criteria decision analysis. European Journal of Operational Research, 265 (1), 178–194. https://doi.org/10.1016/j.ejor.2017.02.038
- Marttunen, M., Haag, F., Belton, V., Mustajoki, J., Lienert, J., 2019. Methods to inform the development of concise objectives hierarchies in multi-criteria decision analysis. European Journal of Operational Research, 277 (2), 604–620. https://doi.org/10.1016/j.ejor.2019.02.039
- Marttunen, M., Lienert, J., Belton, V., 2017. Structuring problems for multi-criteria decision analysis in practice: A literature review of method combinations. European Journal of Operational Research, 263 (1), 1–17. https://doi.org/10.1016/j.ejor.2017.04.041
- Martzoukos, S. H., 2009. Real R&D options and optimal activation of two-dimensional random controls. Journal of the Operational Research Society, 60 (6), 843–858. https://doi.org/10.1057/palgrave.jors.2602627
- Mashlakov, A., Kuronen, T., Lensu, L., Kaarna, A., Honkapuro, S., 2021. Assessing the performance of deep learning models for multivariate probabilistic energy forecasting. Applied Energy, 285, 116405. https://doi.org/10.1016/j.apenergy.2020.116405
- Masmoudi, M., Abdelaziz, F. B., 2018. Portfolio selection problem: A review of deterministic and stochastic multiple objective programming models. Annals of Operations Research, 267 (1), 335–352. https://doi.org/10.1007/s10479-017-2466-7
- Masmoudi, M. A., Mancini, S., Baldacci, R., Kuo, Y.-H., 2022. Vehicle routing problems with drones equipped with multi-package payload compartments. Transportation Research Part E: Logistics and Transportation Review, 164, 102757. https://doi.org/10.1016/j.tre.2022.102757
- Mason, R. O., Mitroff, I. I., 1981. Challenging strategic planning assumptions: Theory, cases, and techniques. Wiley.
- Massey, W. A., 1981. Non-stationary queues [Ph.D. thesis]. Stanford University.
- Massey, W. A., Whitt, W., 1998. Uniform acceleration expansions for Markov chains with time-varying rates. Annals of Applied Probability, 8 (4), 1130–1155.
- Mattila, V., Virtanen, K., 2014. Maintenance scheduling of a fleet of fighter aircraft through multi-objective simulation-optimization. Simulation, 90 (9), 1023–1040. https://doi.org/10.1177/0037549714540008
- Mauttone, A., Cancela, H., Urquhart, M. E., 2021. Public transportation. In T. G. Crainic, M. Gendreau, & B. Gendron (Eds.), Network design with applications to transportation and logistics (pp. 539–565). Springer.
- Máximo, V., Nascimento, M., 2021. A hybrid adaptive iterated local search with diversification control to the capacitated vehicle routing problem. European Journal of Operational Research, 294 (3), 1108–1119. https://doi.org/10.1016/j.ejor.2021.02.024
- Mayer, K., Trück, S., 2018. Electricity markets around the world. Journal of Commodity Markets, 9, 77–100. https://doi.org/10.1016/j.jcomm.2018.02.001
- Mazumdar, R., Mason, L., Douligeris, C., 1991. Fairness in network optimal flow control: Optimality of product forms. IEEE Transactions on Communications, 39 (5), 775–782. https://doi.org/10.1109/26.87140
- McAfee, R. P., McMillan, J., 1987. Auctions and bidding. Journal of Economic Literature, 25 (2), 699–738.
- McCloskey, J. F., 1987. British operational research in World War II. Operations Research, 35 (3), 453–470. https://doi.org/10.1287/opre.35.3.453
- McCollum, B., 2002. Integrating human abilities and automated systems for timetabling: A competition using STARK and HuSSH representations. In Proceedings of the International Conference of the Practice and Theory of Automated Timetabling (pp. 265–273).
- McCollum, B., McMullan, P., Burke, E. K., Parkes, A. J., Qu, R., 2007. The second international timetabling competition: Examination timetabling track. Tech. Rep., Technical Report QUB/IEEE/Tech/ITC2007/-Exam/v4. 0/17, Queen’s University.
- McConnell, B. M., Hodgson, T. J., Kay, M. G., King, R. E., Liu, Y., Parlier, G. H., Thoney-Barletta, K., Wilson, J. R., 2021. Assessing uncertainty and risk in an expeditionary military logistics network. Journal of Defense Modeling and Simulation: Applications, Methodology, Technology, 18 (2), 135–156. https://doi.org/10.1177/1548512919860595
- McElfresh, C., Dickerson, J., 2018. Balancing lexicographic fairness and a utilitarian objective with application to kidney exchange. In 32nd AAAI Conference on Artificial Intelligence (pp. 1161–1168). https://doi.org/10.1609/aaai.v32i1.11436
- McEvoy, J., Gilbertz, S. J., Anderson, M. B., Ormerod, K. J., Bergmann, N. T., 2017. Cultural theory of risk as a heuristic for understanding perceptions of oil and gas development in Eastern Montana, USA. The Extractive Industries and Society, 4 (4), 852–859. https://doi.org/10.1016/j.exis.2017.10.004
- McHale, I., Morton, A., 2011. A Bradley-Terry type model for forecasting tennis match results. International Journal of Forecasting, 27 (2), 619–630. https://doi.org/10.1016/j.ijforecast.2010.04.004
- McHale, I. G., Holmes, B., 2022. Estimating transfer fees of professional footballers using advanced performance metrics and machine learning. European Journal of Operational Research, 306 (1), 389–399. https://doi.org/10.1016/j.ejor.2022.06.033
- McKinney, W., 2010. Data structures for statistical computing in Python. In Stéfan van der Walt & Jarrod Millman (Eds.), Proceedings of the 9th Python in Science Conference (pp. 56–61). https://doi.org/10.25080/Majora-92bf1922-00a
- Meeusen, W., van den Broeck, J., 1977. Efficiency estimation from Cobb-Douglas production functions with composed error. International Economic Review, 18 (2), 435–444. https://doi.org/10.2307/2525757
- Mehrabi, N., Morstatter, F., Saxena, N., Lerman, K., Galstyan, A., 2022. A survey on bias and fairness in machine learning. arXiv:1908-09635. https://doi.org/10.1145/3457607
- Melese, F., Richter, A., Solomon, B., 2015. Military cost-benefit analysis: Theory and practice. Routledge.
- Melo, M. T., Nickel, S., Saldanha-Da-Gama, F., 2009. Facility location and supply chain management–A review. European Journal of Operational Research, 196 (2), 401–412. https://doi.org/10.1016/j.ejor.2008.05.007
- Meng, F., Qi, J., Zhang, M., Ang, J., Chu, S., Sim, M., 2015. A robust optimization model for managing elective admission in a public hospital. Operations Research, 63 (6), 1452–1467. https://doi.org/10.1287/opre.2015.1423
- Meng, Q., Wang, S., 2011. Optimal operating strategy for a long-haul liner service route. European Journal of Operational Research, 215 (1), 105–114. https://doi.org/10.1016/j.ejor.2011.05.057
- Menger, K., 1927. Zur allgemeinen Kurventheorie. Fundamenta Mathematicae, 10, 96–115. https://doi.org/10.4064/fm-10-1-96-115
- Meredith, J. R., Mantel, Jr, S. J., 2003. Project management: A managerial approach. John Wiley & Sons.
- Meretoja, A., Keshtkaran, M., Saver, J. L., Tatlisumak, T., Parsons, M. W., Kaste, M., Davis, S. M., Donnan, G. A., Churilov, L., 2014. Stroke thrombolysis: Save a minute, save a day. Stroke, 45 (4), 1053–1058. https://doi.org/10.1161/STROKEAHA.113.002910
- Merkle, D., Middendorf, M., Schmeck, H., 2002. Ant colony optimization for resource-constrained project scheduling. IEEE Transactions on Evolutionary Computation, 6 (4), 333–346. https://doi.org/10.1109/TEVC.2002.802450
- Mertens, J.-F., Neyman, A., 1981. Stochastic games. International Journal of Game Theory, 10, 53–56. https://doi.org/10.1007/BF01769259
- Mertens, J.-F., Sorin, S., Zamir, S., 2015. Repeated games. Cambridge University Press.
- Messner, J., Pinson, P., 2019. Online adaptive lasso estimation in vector autoregressive models for high dimensional wind power forecasting. International Journal of Forecasting, 35 (4), 1485–1498. https://doi.org/10.1016/j.ijforecast.2018.02.001
- Mete, H. O., Zabinsky, Z. B., 2010. Stochastic optimization of medical supply location and distribution in disaster management. International Journal of Production Economics, 126 (1), 76–84. https://doi.org/10.1016/j.ijpe.2009.10.004
- Meyer, R. E., Jancsary, D., Höllerer, M. A., Boxenbaum, E., 2018. The role of verbal and visual text in the process of institutionalization. Academy of Management Review, 43 (3), 392–418. https://doi.org/10.5465/amr.2014.0301
- Michaud, R. O., 1989. The Markowitz optimization enigma: Is ‘optimized’ optimal? Financial Analysts Journal, 45 (1), 31–42. https://doi.org/10.2469/faj.v45.n1.31
- Michna, Z., Disney, S. M., Nielsen, P., 2020. The impact of stochastic lead times on the bullwhip effect under correlated demand and moving average forecasts. Omega, 93, 102033. https://doi.org/10.1016/j.omega.2019.02.002
- Midgley, G., 1992. The sacred and profane in critical systems thinking. Systems Practice, 5 (1), 5–16. https://doi.org/10.1007/BF01060044
- Midgley, G., 1994. Ecology and the poverty of humanism: A critical systems perspective. Systems Research, 11 (4), 67–76. https://doi.org/10.1002/sres.3850110406
- Midgley, G., 2000. Systemic intervention: Philosophy, methodology, and practice. Kluwer/Plenum.
- Midgley, G., Cavana, R. Y., Brocklesby, J., Foote, J. L., Wood, D. R. R., Ahuriri-Driscoll, A., 2013. Towards a new framework for evaluating systemic problem structuring methods. European Journal of Operational Research, 229 (1), 143–154. https://doi.org/10.1016/j.ejor.2013.01.047
- Midgley, G., Johnson, M. P., Chichirau, G., 2018. What is community operational research? European Journal of Operational Research, 268 (3), 771–783. https://doi.org/10.1016/j.ejor.2017.08.014
- Midgley, G., Munlo, I., Brown, M., 1998. The theory and practice of boundary critique: Developing housing services for older people. Journal of the Operational Research Society, 49 (5), 467–478. https://doi.org/10.2307/3009885
- Midgley, G., Ochoa-Arias, A. E., 2004. Visions of community for community OR. In G. Midgley & A. E. Ochoa-Arias, (Eds.), Community operational research: OR and systems thinking for community development (pp. 75–105). Kluwer Academic/Plenum Publishers.
- Midgley, G., Pinzón, L. A., 2011. Boundary critique and its implications for conflict prevention. Journal of the Operational Research Society, 62 (8), 1543–1554. https://doi.org/10.1057/jors.2010.76
- Midgley, G., Rajagopalan, R., 2021. Critical systems thinking, systemic intervention, and beyond. In G. S. Metcalf, K. Kijima, & H. Deguchi (Eds.), Handbook of systems sciences (pp. 107–157). Springer.
- Miettinen, K., 1999. Nonlinear multiobjective optimization. In International series in operations research and management science (Vol. 12). Kluwer Academic Publishers.
- Milgrom, P. R., 1985. The economics of competitive bidding: A selective survey. In L. Hurwicz, D. Schmeidler, H. Sonnenschein (Eds.), Social goals and social organization: essays in memory of Elisha Pazner (pp. 261–289). Cambridge University Press.
- Milgrom, P. R., 1987. Auction theory. In O. Hart, B. Holmstrom, T. Bewley (Eds.), Advances in economic theory: Fifth world congress. Econometric society monographs (pp. 1–32). Cambridge University Press.
- Milgrom, P. R., 2004. Putting auction theory to work. Churchill lectures in economics. Cambridge University Press.
- Min, H., 2010. Artificial intelligence in supply chain management: Theory and applications. International Journal of Logistics Research and Applications, 13 (1), 13–39. https://doi.org/10.1080/13675560902736537
- Mingers, J., 2000. The contribution of critical realism as an underpinning philosophy for OR/MS and systems. Journal of the Operational Research Society, 51 (11), 1256–1270. https://doi.org/10.2307/254211
- Mingers, J., 2011a. Ethics and OR: Operationalising discourse ethics. European Journal of Operational Research, 210 (1), 114–124. https://doi.org/10.1016/j.ejor.2010.11.003
- Mingers, J., 2011b. Soft OR comes of age—but not everywhere! Omega, 39 (6), 729–741. https://doi.org/10.1016/j.omega.2011.01.005
- Mingers, J., 2015. Helping business schools engage with real problems: The contribution of critical realism and systems thinking. European Journal of Operational Research, 242 (1), 316–331. https://doi.org/10.1016/j.ejor.2014.10.058
- Mingers, J., Brocklesby, J., 1997. Multimethodology: Towards a framework for mixing methodologies. Omega, 25 (5), 489–509. https://doi.org/10.1016/S0305-0483(97)00018-2
- Mingers, J., Gill, A., 1997. Multimethodology: Towards theory and practice and mixing and matching methodologies. Wiley.
- Mingers, J., Rosenhead, J., 2004. Problem structuring methods in action. European Journal of Operational Research, 152 (3), 530–554. https://doi.org/10.1016/S0377-2217(03)00056-0
- Mingers, J., White, L., 2010. A review of the recent contribution of systems thinking to operational research and management science. European Journal of Operational Research, 207 (3), 1147–1161. https://doi.org/10.1016/j.ejor.2009.12.019
- Mingers, J. C., 1980. Towards an appropriate social theory for applied systems thinking: Critical theory and soft systems methodology. Journal of Applied Systems Analysis, 7, 41–50.
- Mingers, J. C., 1984. Subjectivism and soft systems methodology – a critique. Journal of Applied Systems Analysis, 11, 85–103.
- Mirchandani, P., Francis, R. (Eds.), 1990. Discrete location theory. Wiley.
- Mirzaei, S., Seifi, A., 2015. Considering lost sale in inventory routing problems for perishable goods. Computers and Industrial Engineering, 87, 213–227. https://doi.org/10.1016/j.cie.2015.05.010
- Miser, H. J., Quade, E. S., 1985. Handbook of systems analysis: Overview of uses, procedures, applications, and practice. North-Holland.
- Miser, H. J., Quade, E. S. (Eds.), 1988. Handbook of systems analysis: Craft issues and procedural choices. Wiley.
- Mishra, D., Parkes, D. C., 2009. Multi-item Vickrey–Dutch auctions. Games and Economic Behavior, 66 (1), 326–347. https://doi.org/10.1016/j.geb.2008.04.007
- Mitchell, S., Kean, A., Mason, A., O’Sullivan, M., Phillips, A., Peschiera, F., 2022. PuLP. https://projects.coin-or.org/pulp
- Mitchell, T. M., 1997. Machine learning. McGraw-hill.
- Mnih, V., Kavukcuoglu, K., Silver, D., Rusu, A. A., Veness, J., Bellemare, M. G., Graves, A., Riedmiller, M., Fidjeland, A. K., Ostrovski, G., Petersen, S., Beattie, C., Sadik, A., Antonoglou, I., King, H., Kumaran, D., Wierstra, D., Legg, S., Hassabis, D., 2015. Human-level control through deep reinforcement learning. Nature, 518 (7540), 529–533. https://doi.org/10.1038/nature14236
- Mo, J., Walrand, J., 2000. Fair end-to-end window-based congestion control. IEEE/ACM Transactions on Networking, 8, 556–567. https://doi.org/10.1109/90.879343
- Moccia, L., Cordeau, J.-F., Gaudioso, M., Laporte, G., 2006. A branch-and-cut algorithm for the quay crane scheduling problem in a container terminal. Naval Research Logistics, 53 (1), 45–59. https://doi.org/10.1002/nav.20121
- Moeller, S., 2010. Characteristics of services: A customer integration perspective uncovers their value. Journal of Services Marketing, 24 (5), 359–368. https://doi.org/10.1108/08876041011060468
- Moghaddam, K. S., DePuy, G. W., 2011. Farm management optimization using chance constrained programming method. Computers and Electronics in Agriculture, 77 (2), 229–237. https://doi.org/10.1016/j.compag.2011.05.006
- Mohiuddin, S., Busby, J., Savović, J., Richards, A., Northstone, K., Hollingworth, W., Donovan, J. L., Vasilakis, C., 2017. Patient flow within UK emergency departments: A systematic review of the use of computer simulation modelling methods. BMJ Open, 7 (5), e015007. https://doi.org/10.1136/bmjopen-2016-015007
- Monks, T., Currie, C. S. M., Onggo, B. S., Robinson, S., Kunc, M., Taylor, S. J. E., 2019. Strengthening the reporting of empirical simulation studies: Introducing the STRESS guidelines. Journal of Simulation, 13 (1), 55–67. https://doi.org/10.1080/17477778.2018.1442155
- Monks, T., Pearson, M., Pitt, M., Stein, K., James, M. A., 2015. Evaluating the impact of a simulation study in emergency stroke care. Operations Research for Health Care, 6, 40–49. https://doi.org/10.1016/j.orhc.2015.09.002
- Monks, T., Pitt, M., Stein, K., James, M., 2012. Maximizing the population benefit from thrombolysis in acute ischemic stroke. Stroke, 43 (10), 2706–2711. https://doi.org/10.1161/STROKEAHA.112.663187
- Monma, C., Shallcross, D., 1989. Methods for designing communications networks with certain two-connected survivability constraints. Operations Research, 37 (4), 531–541. https://doi.org/10.1287/opre.37.4.531
- Montero-Manso, P., Athanasopoulos, G., Hyndman, R. J., Talagala, T. S., 2020. FFORMA: Feature-based forecast model averaging. International Journal of Forecasting, 36 (1), 86–92. https://doi.org/10.1016/j.ijforecast.2019.02.011
- Mor, A., Speranza, M., 2020. Vehicle routing problems over time: A survey. 4OR - A Quarterly Journal of Operations Research, 18, 129–149. https://doi.org/10.1007/s10288-020-00433-2
- Morales, J. M., Conejo, A. J., Madsen, H., Pinson, P., Zugno, M., 2014. Integrating renewables in electricity markets: Operational problems. Springer.
- Morecroft, J. D. W., 2010. Romeo and Juliet in Brazil: Use of metaphorical models for feedback systems thinking. In J. Richmond, L. Stuntz, K. Richmond, & J. Egner (Eds.), Tracing connections: Voices of systems thinkers. ISEE Systems, Inc. and the creative learning exchange (pp. 95–119).
- Morecroft, J. D. W., 2012. Metaphorical models for limits to growth and industrialization. Systems Research and Behavioral Science, 29 (6), 645–666. https://doi.org/10.1002/sres.2143
- Morecroft, J. D. W., 2015. Strategic modelling and business dynamics: A feedback systems approach. John Wiley & Sons.
- Mortenson, M. J., Doherty, N. F., Robinson, S., 2015. Operational research from Taylorism to Terabytes: A research agenda for the analytics age. European Journal of Operational Research, 241 (3), 583–595. https://doi.org/10.1016/j.ejor.2014.08.029
- Morton, T., Pentico, D. W., 1993. Heuristic scheduling systems: With applications to production systems and project management (Vol. 3). Wiley-Interscience.
- Moss, S. J., Vasilakis, C., Wood, R. M., 2022. Exploring financially sustainable initiatives to address out-of-area placements in psychiatric ICUs: A computer simulation study. Journal of Mental Health, 1–9. https://doi.org/10.1080/09638237.2022.2091769
- Mostajabdaveh, M., Gutjahr, W. J., Sibel Salman, F., 2019. Inequity-averse shelter location for disaster preparedness. IISE Transactions, 51 (8), 809–829. https://doi.org/10.1080/24725854.2018.1496372
- Moulin, H., 1988. Axioms of cooperative decision making (1st ed.). Cambridge University Press.
- Muckstadt, J. A., Roundy, R. O., 1993. Analysis of multistage production systems. Handbooks in Operations Research and Management Science, 4, 59–131.
- Muehlheusser, G., Schneemann, S., Sliwka, D., Wallmeier, N., 2018. The contribution of managers to organizational success: Evidence from German soccer. Journal of Sports Economics, 19 (6), 786–819. https://doi.org/10.1177/1527002516674760
- Müller, T., Rudová, H., Müllerová, Z., 2018. University course timetabling and international timetabling competition 2019. In Proceedings of the 12th International Conference of the Practice and Theory of Automated Timetabling (pp. 5–31).
- Müller-Merbach, H., 1981. Heuristics and their design: A survey. European Journal of Operational Research, 8 (1), 1–23. https://doi.org/10.1016/0377-2217(81)90024-2
- Munien, C., Ezugwu, A. E., 2021. Metaheuristic algorithms for one-dimensional bin-packing problems: A survey of recent advances and applications. Journal of Intelligent Systems, 30 (1), 636–663. https://doi.org/10.1515/jisys-2020-0117
- Murphy, K. P., 2022. Probabilistic machine learning: An introduction. MIT Press.
- Murphy, K. P., 2023. Probabilistic machine learning: Advanced topics. MIT Press.
- Murty, K. G., Kabadi, S. N., 1987. Some NP-complete problems in quadratic and nonlinear programming. Mathematical Programming, 39 (2), 117–129. https://doi.org/10.1007/BF02592948
- Musliu, N., 2006. Heuristic methods for automatic rotating workforce scheduling. International Journal of Computational Intelligence Research, 2, 309–326. https://doi.org/10.5019/j.ijcir.2006.69
- Mustajoki, J., Marttunen, M., 2017. Comparison of multi-criteria decision analytical software for supporting environmental planning processes. Environmental Modelling & Software, 93, 78–91. https://doi.org/10.1016/j.envsoft.2017.02.026
- Mutha, A., Bansal, S., 2023. Determining assortments of used products for B2B transactions in reverse supply chain. IISE Transactions. https://doi.org/10.1080/24725854.2022.2159590
- Mutha, A., Bansal, S., Guide, V. D. R., 2016. Managing demand uncertainty through core acquisition in remanufacturing. Production and Operations Management, 25 (8), 1449–1464. https://doi.org/10.1111/poms.12554
- Mutha, A., Bansal, S., Guide, V. D. R., 2019. Selling assortments of used products to third-party remanufacturers. Production and Operations Management, 28 (7), 1792–1817. https://doi.org/10.1111/poms.13004
- Nagamochi, H., Ono, T., Ibaraki, T., 1994. Implementing an efficient minimum capacity cut algorithm. Mathematical Programming, 67, 325–341. https://doi.org/10.1007/BF01582226
- Nahmias, S., 1979. Simple approximations for a variety of dynamic leadtime lost-sales inventory models. Operations Research, 27 (5), 904–924. https://doi.org/10.1287/opre.27.5.904
- Nahmias, S., 2011. Perishable inventory systems. In International series in operations research & management science (Vol. 160). Springer Science & Business Media.
- Narasimhan, R., Swink, M., Kim, S. W., 2006. Disentangling leanness and agility: An empirical investigation. Journal of Operations Management, 24 (5), 440–457. https://doi.org/10.1016/j.jom.2005.11.011
- Nash, J., 1950a. The bargaining problem. Econometrica, 18, 155–162. https://doi.org/10.2307/1907266
- Nash, J., 1950b. Equilibrium points in n-person games. Proceedings of the National Academy of Sciences USA, 36 (1), 48–49. https://doi.org/10.1073/pnas.36.1.48
- Nash, J., 1951. Non-cooperative games. Annals of Mathematics, 54 (2), 286–295. https://doi.org/10.2307/1969529
- National Grid ESO. 2022. Short term operating reserve. Retrieved November 1, 2022, from https://www.nationalgrideso.com/industry-information/balancing-services/ reserve-services/short-term-operating-reserve.
- Naylor, J. B., Naim, M. M., Berry, D., 1999. Leagility: Integrating the lean and agile manufacturing paradigms in the total supply chain. International Journal of Production Economics, 62 (1), 107–118. https://doi.org/10.1016/S0925-5273(98)00223-0
- Nehring, K., 2007. The impossibility of a Paretian rational: A Bayesian perspective. Economics Letters, 96 (1), 45–50. https://doi.org/10.1016/j.econlet.2006.12.008
- Nemhauser, G., Wolsey, L., 1988. Integer and combinatorial optimization. John Wiley & Sons.
- Nesterov, Y. E., Nemirovskii, A., 1994. Interior-point polynomial algorithms in convex programming. In SIAM studies in applied mathematics (Vol. 13). SIAM.
- Neumann, K., Schwindt, C., Zimmermann, J., 2003. Project scheduling with time windows and scarce resources: Temporal and resource-constrained project scheduling with regular and nonregular objective functions. Springer.
- Neumann, K., Zimmermann, J., 2000. Procedures for resource leveling and net present value problems in project scheduling with general temporal and resource constraints. European Journal of Operational Research, 127 (2), 425–443. https://doi.org/10.1016/S0377-2217(99)00498-1
- Neuts, M. F., 1981. Matrix-geometric solutions in stochastic models: An algorithmic approach. In Johns Hopkins series in the mathematical sciences (Vol. 2). Johns Hopkins University Press.
- Neuts, M. F., 1989. Structured stochastic matrices of M/G/1 type and their applications. In Probability: Pure and applied 5. Marcel Dekker.
- Newbold, R. C., 1998. Project management in the fast lane: Applying the theory of constraints. CRC Press.
- Newman, A. M., Rubio, E., Caro, R., Weintraub, A., Eurek, K., 2010. A review of operations research in mine planning. Interfaces, 40 (3), 222–245. https://doi.org/10.1287/inte.1090.0492
- Nicholls, M. G., 2009. The use of markov models as an aid to the evaluation, planning and benchmarking of doctoral programs. Journal of the Operational Research Society, 60 (9), 1183–1190. https://doi.org/10.1057/palgrave.jors.2602639
- Niedermeier, R., 2006. Invitation to fixed-parameter algorithms. Oxford University Press.
- Nifakos, S., Chandramouli, K., Nikolaou, C. K., Papachristou, P., Koch, S., Panaousis, E., Bonacina, S., 2021. Influence of human factors on cyber security within healthcare organisations: A systematic review. Sensors, 21 (15). https://doi.org/10.3390/s21155119
- Nikolopoulos, K., Litsa, A., Petropoulos, F., Bougioukos, V., Khammash, M., 2015. Relative performance of methods for forecasting special events. Journal of Business Research, 68 (8), 1785–1791. https://doi.org/10.1016/j.jbusres.2015.03.037
- Nisan, N., 2007. Introduction to mechanism design. In N. Nisan, T. Roughgarden, E. Tardos, V. V. Vazirani (Eds.), Algorithmic game theory (pp. 209–242). Cambridge University Press.
- Nishihara, M., 2012. Real options with synergies: Static versus dynamic policies. Journal of the Operational Research Society, 63 (1), 107–121. https://doi.org/10.1057/jors.2011.5
- Niu, H., Zhou, X., 2013. Optimizing urban rail timetable under time-dependent demand and oversaturated conditions. Transportation Research Part C: Emerging Technologies, 36, 212–230. https://doi.org/10.1016/j.trc.2013.08.016
- Niu, H., Zhou, X., Gao, R., 2015. Train scheduling for minimizing passenger waiting time with time-dependent demand and skip-stop patterns: Nonlinear integer programming models with linear constraints. Transportation Research Part B: Methodological, 76, 117–135. https://doi.org/10.1016/j.trb.2015.03.004
- Nocedal, J., Wright, S. J., 2006. Numerical optimization. In Springer series in operations research and financial engineering (2nd ed.). Springer.
- Norlund, E. K., Gribkovskaia, I., 2013. Reducing emissions through speed optimization in supply vessel operations. Transportation Research Part D: Transport and Environment, 23, 105–113. https://doi.org/10.1016/j.trd.2013.04.007
- Nowotarski, J., Liu, B., Weron, R., Hong, T., 2016. Improving short term load forecast accuracy via combining sister forecasts. Energy, 98, 40–49. https://doi.org/10.1016/j.energy.2015.12.142
- Nowotarski, J., Weron, R., 2018. Recent advances in electricity price forecasting: A review of probabilistic forecasting. Renewable and Sustainable Energy Reviews, 81, 1548–1568. https://doi.org/10.1016/j.rser.2017.05.234
- Nübel, H., 2001. The resource renting problem subject to temporal constraints. OR Spectrum, 23 (3), 359–381. https://doi.org/10.1007/PL00013357
- Numrich, S. K., Picucci, P. M., 2012. New challenges: Human, social, cultural, and behavioral modeling. In A. Tolk (Ed.), Engineering principles of combat modeling and distributed simulation (pp. 641–667). Wiley.
- Oesterreich, T. D., Anton, E., Teuteberg, F., 2022. What translates big data into business value? A meta-analysis of the impacts of business analytics on firm performance. Information & Management, 59 (6), 103685. https://doi.org/10.1016/j.im.2022.103685
- Office for National Statistics. 2022a. Coronavirus (COVID-19) infection survey: Methods and further information. Tech. Rep., Office for National Statistics.
- Office for National Statistics. 2022b. Coronavirus (COVID-19) latest insights. Tech. Rep. Office for National Statistics.
- Office for National Statistics, 2022c. COVID-19 schools infection survey, England statistical bulletins. Tech. rep. Office for National Statistics.
- Ogata, K., et al., 2010. Modern control engineering (5th ed.). Prentice Hall.
- Ogryczak, W., Luss, H., Pióro, M., Nace, D., Tomaszewski, A., 2014. Fair optimization and networks: A survey. Journal of Applied Mathematics, 2014, 1–25. https://doi.org/10.1155/2014/612018
- Ogryczak, W., Śliwiński, T., 2003. On solving linear programs with the ordered weighted averaging objective. European Journal of Operational Research, 148 (1), 80–91. https://doi.org/10.1016/S0377-2217(02)00399-5
- O’Hanley, J. R., Church, R. L., 2011. Designing robust coverage networks to hedge against worst-case facility losses. European Journal of Operational Research, 209 (1), 23–36. https://doi.org/10.1016/j.ejor.2010.08.030
- Öhman, M., Hiltunen, M., Virtanen, K., Holmström, J., 2021. Frontlog scheduling in aircraft line maintenance: From explorative solution design to theoretical insight into buffer management. Journal of Operations Management, 67 (2), 120–151. https://doi.org/10.1002/joom.1108
- Ohno, T., 1988. Toyota production system: Beyond large-scale production. Productivity Press.
- Olesen, O. B., Petersen, N. C., Podinovski, V. V., 2022. The structure of production technologies with ratio inputs and outputs. Journal of Productivity Analysis, 57 (3), 255–267. https://doi.org/10.1007/s11123-022-00631-6
- Olhager, J., 2010. The role of the customer order decoupling point in production and supply chain management. Computers in Industry, 61 (9), 863–868. https://doi.org/10.1016/j.compind.2010.07.011
- Olivares, K., Challu, C., Marcjasz, G., Weron, R., Dubrawski, A., 2023. Neural basis expansion analysis with exogenous variables: Forecasting electricity prices with NBEATSx. International Journal of Forecasting, 39 (2), 884–900. https://doi.org/10.1016/j.ijforecast.2022.03.001
- Oliveira, J., Ferreira, J., 1990. An improved version of Wang’s algorithm for two-dimensional cutting problems. European Journal of Operational Research, 44 (2), 256–266. https://doi.org/10.1016/0377-2217(90)90361-E
- O’Neil, C., 2016. Weapons of math destruction: How big data increases inequality and threatens democracy. Crown Publishing Group.
- Onggo, B. S., 2019. Symbiotic simulation system (S3) for industry 4.0. In M. Gunal (Ed.), Simulation for industry 4.0: Past, present and future (pp. 153–165). Springer.
- Opricovic, S., Tzeng, G.-H., 2004. Compromise solution by MCDM methods: A comparative analysis of Vikor and Topsis. European Journal of Operational Research, 156 (2), 445–455. https://doi.org/10.1016/S0377-2217(03)00020-1
- Ord, K., Fildes, R., Kourentzes, N., 2017. Principles of business forecasting (2nd ed.). Wessex Press Inc.
- Oreshkin, B., Dudek, G., Pełka, P., Turkina, E., 2021. N-BEATS neural network for mid-term electricity load forecasting. Applied Energy, 293, 116918. https://doi.org/10.1016/j.apenergy.2021.116918
- Orlin, J. B., 1993. A faster strongly polynomial minimum cost flow algorithm. Operations Research, 41 (2), 338–350. https://doi.org/10.1287/opre.41.2.338
- Orlin, J. B., 2013. Max flows in O(nm) time, or better. In D. Boneh, T. Roughgarden, J. Feigenbaum (Eds.), Symposium on Theory of Computing Conference , STOC’13, Palo Alto, CA, USA, June 1–4, 2013 (pp. 765–774).
- Ormerod, R., Yearworth, M., White, L., 2023. Understanding participant actions in OR interventions using practice theories: A research agenda. European Journal of Operational Research, 306 (2), 810–827. https://doi.org/10.1016/j.ejor.2022.08.030
- Ormerod, R. J., 2014a. The mangle of OR practice: Towards more informative case studies of ‘technical’ projects. Journal of the Operational Research Society, 65 (8), 1245–1260. https://doi.org/10.1057/jors.2013.78
- Ormerod, R. J., 2014b. OR competences: The demands of problem structuring methods. EURO Journal on Decision Processes, 2 (3), 313–340. https://doi.org/10.1007/s40070-013-0021-6
- Ormerod, R. J., Ulrich, W., 2013. Operational research and ethics: A literature review. European Journal of Operational Research, 228 (2), 291–307. https://doi.org/10.1016/j.ejor.2012.11.048
- Osborne, M., Rubinstein, A., 1994. A course in game theory. MIT Press.
- Otto, A., Agatz, N., Campbell, J., Golden, B., Pesch, E., 2018. Optimization approaches for civil applications of unmanned aerial vehicles (UAVs) or aerial drones: A survey. Networks, 72 (4), 411–458. https://doi.org/10.1002/net.21818
- Oude Vrielink, R. A., Jansen, E. A., Hans, E. W., van Hillegersberg, J., 2019. Practices in timetabling in higher education institutions: A systematic review. Annals of Operations Research, 275 (1), 145–160. https://doi.org/10.1007/s10479-017-2688-8
- Ovchinnikov, A., 2011. Revenue and cost management for remanufactured products. Production and Operations Management, 20 (6), 824–840. https://doi.org/10.1111/j.1937-5956.2010.01214.x
- Owen, G., 1973. Cutting planes for programs with disjunctive constraints. Journal of Optimization Theory and Applications, 11, 49–55. https://doi.org/10.1007/BF00934290
- Owen, G., 1995. Game theory (3rd ed.). Academic Press.
- Özdemir-Akyıldırım, Ö., Denizel, M., Ferguson, M., 2014. Allocation of returned products among different recovery options through an opportunity cost-based dynamic approach. Decision Sciences, 45 (6), 1083–1116. https://doi.org/10.1111/deci.12100
- Padberg, M., Rinaldi, G., 1987. Optimization of a 532 city symmetric traveling salesman problem by branch-and-cut. Operations Research Letters, 6, 1–7. https://doi.org/10.1016/0167-6377(87)90002-2
- Padberg, M., Rinaldi, G., 1990a. An efficient algorithm for the minimum capacity cut problem. Mathematical Programming, 47, 19–36. https://doi.org/10.1007/BF01580850
- Padberg, M., Rinaldi, G., 1990b. Facet identification for the symmetric traveling salesman polytope. Mathematical Programming, 47, 219–257. https://doi.org/10.1007/BF01580861
- Padberg, M., Rinaldi, G., 1991. A branch-and-cut algorithm for the resolution of large-scale symmetric traveling salesman problems. SIAM Review, 33 (1), 60–100. https://doi.org/10.1137/1033004
- Padberg, M., Sung, T., 1991. An analytical comparison of different formulations of the travelling salesman problem. Mathematical Programming, 52, 315–357. https://doi.org/10.1007/BF01582894
- Padberg, M., Van Roy, T., Wolsey, L., 1984. Valid inequalities for fixed charge problems. Operations Research, 32, 842–861. https://doi.org/10.1287/opre.33.4.842
- Pagel, C., Yates, C. A., 2022. Role of mathematical modelling in future pandemic response policy. BMJ, 378. https://doi.org/10.1136/bmj-2022-070615
- Pahl-Wostl, C., 2007. The implications of complexity for integrated resources management. Environmental Modelling & Software, 22 (5), 561–569. https://doi.org/10.1016/j.envsoft.2005.12.024
- Paivio, A., 1990. Mental representations: A dual coding approach. Oxford University Press.
- Pajor, T., Uchoa, E., Werneck, R. F., 2018. A robust and scalable algorithm for the Steiner problem in graphs. Mathematical Programming Computation, 10 (1), 69–118. https://doi.org/10.1007/s12532-017-0123-4
- Pang, G., Whitt, W., 2010. Two-parameter heavy-traffic limits for infinite-server queues. Queueing Systems, 65 (4), 325–364. https://doi.org/10.1007/s11134-010-9184-z
- Pantuso, G., Fagerholt, K., Hvattum, L. M., 2014. A survey on maritime fleet size and mix problems. European Journal of Operational Research, 235 (2), 341–349. https://doi.org/10.1016/j.ejor.2013.04.058
- Papadimitriou, C., Steiglitz, K., 1982. Combinatorial optimization: Algorithms and complexity. Prentice Hall.
- Papadimitriou, M., Johnes, J., 2019. Does merging improve efficiency? A study of English universities. Studies in Higher Education, 44 (8), 1454–1474. https://doi.org/10.1080/03075079.2018.1450851
- Pardalos, P. M., Vavasis, S. A., 1991. Quadratic programming with one negative eigenvalue is NP-hard. Journal of Global Optimization, 1 (1), 15–22. https://doi.org/10.1007/BF00120662
- Parilina, E., Zaccour, G., 2015. Approximated cooperative equilibria for games played over event trees. Operations Research Letters, 43, 507–513. https://doi.org/10.1016/j.orl.2015.07.006
- Parry, R., Mingers, J., 1991. Community operational research: Its context and its future. Omega, 19 (6), 577–586. https://doi.org/10.1016/0305-0483(91)90008-H
- Partyka, J., Hall, R., 2014. Vehicle routing software survey: Rising customer expectations drive software innovation, integration. OR/MS Today, 41.
- Pastor, J. T., Lovell, C. A. K., 2005. A global Malmquist productivity index. Economics Letters, 88 (2), 266–271. https://doi.org/10.1016/j.econlet.2005.02.013
- Paszke, A., Gross, S., Massa, F., Lerer, A., Bradbury, J., Chanan, G., Killeen, T., Lin, Z., Gimelshein, N., Antiga, L., Desmaison, A., Kopf, A., Yang, E., DeVito, Z., Raison, M., Tejani, A., Chilamkurthy, S., Steiner, B., Fang, L., Bai, J., Chintala, S., 2019. Pytorch: An imperative style, high-performance deep learning library. In Advances in neural information processing systems 32 (NeurIPS 2019) (pp. 8024–8035). Curran Associates, Inc.
- Paucar-Caceres, A., Cavalcanti-Bandos, M. F., Quispe-Prieto, S. C., Huerta-Tantalean, L. N., Werner-Masters, K., 2022. Using soft systems methodology to align community projects with sustainability development in higher education stakeholders’ networks in a Brazilian university. Systems Research and Behavioral Science, 39 (4), 750–764. https://doi.org/10.1002/sres.2818
- Paucar-Caceres, A., Espinosa, A., 2011. Management science methodologies in environmental management and sustainability: Discourses and applications. Journal of the Operational Research Society, 62 (9), 1601–1620. https://doi.org/10.1057/jors.2010.110
- Paucar-Caceres, A., Thorpe, R., 2005. Mapping the structure of MBA programmes: A comparative study of the structure of accredited AMBA programmes in the United Kingdom. Journal of the Operational Research Society, 56 (1), 25–38. https://doi.org/10.1057/palgrave.jors.2601820
- Paul, M., Knust, S., 2015. A classification scheme for integrated staff rostering and scheduling problems. RAIRO-Operations Research, 49 (2), 393–412. https://doi.org/10.1051/ro/2014052
- Pearl, J., 1988. Probabilistic reasoning in intelligent systems: Networks of plausible inference. Morgan Kaufmann.
- Pecin, D., Pessoa, A., Poggi, M., Uchoa, E., 2017. Improved branch-cut-and-price for capacitated vehicle routing. Mathematical Programming Computation, 9 (1), 61–100. https://doi.org/10.1007/s12532-016-0108-8
- Pedraza-Martinez, A. J., Van Wassenhove, L. N., 2016. Empirically grounded research in humanitarian operations management: The way forward. Journal of Operations Management, 45 (1), 1–10. https://doi.org/10.1016/j.jom.2016.06.003
- Pedregosa, F., Varoquaux, G., Gramfort, A., Michel, V., Thirion, B., Grisel, O., Blondel, M., Prettenhofer, P., Weiss, R., Dubourg, V., Vanderplas, J., Passos, A., Cournapeau, D., Brucher, M., Perrot, M., Duchesnay, E., 2011. Scikit-learn: Machine learning in Python. Journal of Machine Learning Research, 12, 2825–2830.
- Peeters, M., Kroon, L., 2008. Circulation of railway rolling stock: A branch-and-price approach. Computers & Operations Research, 35 (2), 538–556. https://doi.org/10.1016/j.cor.2006.03.019
- Peeters, T. L. P. R., Salaga, S., Juravich, M., 2020. Matching and winning? The impact of upper and middle managers on firm performance in major league baseball. Management Science, 66 (6), 2735–2751. https://doi.org/10.1287/mnsc.2019.3323
- Pelletier, S., Jabali, O., Laporte, G., 2016. 50th anniversary invited article—goods distribution with electric vehicles: Review and research perspectives. Transportation Science, 50 (1), 3–22. https://doi.org/10.1287/trsc.2015.0646
- Pellizzoni, L., Ungaro, D., 2000. Technological risk, participation and deliberation. some results from three Italian case studies. Journal of Hazardous Materials, 78 (1–3), 261–280. https://doi.org/10.1016/s0304-3894(00)00226-0
- Perakis, A. N., Papadakis, N. A., 1989. Minimal time vessel routing in a time-dependent environment. Transportation Science, 23 (4), 266–276. https://doi.org/10.1287/trsc.23.4.266
- Perera, H., Davis, J., Swartz, T. B., 2016. Optimal lineups in Twenty20 cricket. Journal of Statistical Computation and Simulation, 86 (14), 2888–2900. https://doi.org/10.1080/00949655.2015.1136629
- Perera, S. C., Sethi, S. P., 2022a. A survey of stochastic inventory models with fixed costs: Optimality of (s, S) and (s, S)-type policies–Continuous-time case. Production and Operations Management, https://doi.org/10.1111/poms.13819
- Perera, S. C., Sethi, S. P., 2022b. A survey of stochastic inventory models with fixed costs: Optimality of (s, S) and (s, S)-type policies–Discrete-time case. Production and Operations Management, https://doi.org/10.1111/poms.13820
- Pessoa, A., Sadykov, R., Uchoa, E., Vanderbeck, F., 2018. Automation and combination of linear-programming based stabilization techniques in column generation. INFORMS Journal on Computing, 30 (2), 339–360. https://doi.org/10.1287/ijoc.2017.0784
- Pessoa, A., Sadykov, R., Uchoa, E., Vanderbeck, F., 2020. A generic exact solver for vehicle routing and related problems. Mathematical Programming, 183 (1), 483–523. https://doi.org/10.1007/s10107-020-01523-z
- Petersen, J. D., Sölveling, G., Clarke, J.-P., Johnson, E. L., Shebalov, S., 2012. An optimization approach to airline integrated recovery. Transportation Science, 46 (4), 482–500. https://doi.org/10.1287/trsc.1120.0414
- Petropoulos, F., Apiletti, D., Assimakopoulos, V., Babai, M. Z., Barrow, D. K., Ben Taieb, S., Bergmeir, C., Bessa, R. J., Bijak, J., Boylan, J. E., Browell, J., Carnevale, C., Castle, J. L., Cirillo, P., Clements, M. P., Cordeiro, C., Cyrino Oliveira, F. L., De Baets, S., Dokumentov, A., Ellison, J., Fiszeder, P., Franses, P. H., Frazier, D. T., Gilliland, M., Gönül, M. S., Goodwin, P., Grossi, L., Grushka-Cockayne, Y., Guidolin, M., Guidolin, M., Gunter, U., Guo, X., Guseo, R., Harvey, N., Hendry, D. F., Hollyman, R., Januschowski, T., Jeon, J., Jose, V. R. R., Kang, Y., Koehler, A. B., Kolassa, S., Kourentzes, N., Leva, S., Li, F., Litsiou, K., Makridakis, S., Martin, G. M., Martinez, A. B., Meeran, S., Modis, T., Nikolopoulos, K., Önkal, D., Paccagnini, A., Panagiotelis, A., Panapakidis, I., Pavía, J. M., Pedio, M., Pedregal, D. J., Pinson, P., Ramos, P., Rapach, D. E., Reade, J. J., Rostami-Tabar, B., Rubaszek, M., Sermpinis, G., Shang, H. L., Spiliotis, E., Syntetos, A. A., Talagala, P. D., Talagala, T. S., Tashman, L., Thomakos, D., Thorarinsdottir, T., Todini, E., Trapero Arenas, J. R., Wang, X., Winkler, R. L., Yusupova, A., Ziel, F., 2022. Forecasting: theory and practice. International Journal of Forecasting, 38 (3), 705–871. https://doi.org/10.1016/j.ijforecast.2021.11.001
- Petropoulos, F., Fildes, R., Goodwin, P., 2016. Do ‘big losses’ in judgmental adjustments to statistical forecasts affect experts’ behaviour? European Journal of Operational Research, 249 (3), 842–852. https://doi.org/10.1016/j.ejor.2015.06.002
- Petropoulos, F., Kourentzes, N., Nikolopoulos, K., Siemsen, E., 2018. Judgmental selection of forecasting models. Journal of Operations Management, 60, 34–46. https://doi.org/10.1016/j.jom.2018.05.005
- Petropoulos, F., Makridakis, S., 2020. Forecasting the novel coronavirus COVID-19. PLoS One, 15 (3), e0231236. https://doi.org/10.1371/journal.pone.0231236
- Petropoulos, F., Siemsen, E., 2022. Forecast selection and representativeness. Management Science. https://doi.org/10.1287/mnsc.2022.4485
- Petrosjan, L., 1977. Stable solutions of differential games with many participants. Viestnik of Leningrad University, 19, 46–52.
- Petrosyan, L., Zaccour, G., 2018. Cooperative differential games with transferable payoffs. In T. Başar & G. Zaccour (Eds.), Handbook of dynamic game theory (pp. 1–38). Springer.
- Petrovic, S., Burke, E., 2004. University timetabling. In J. Y.-T. Leung (Ed.), Handbook of scheduling: Algorithms, models, and performance analysis (p. 45). Chapman and Hall/CRC.
- Petrovic, S., Parkin, J., Wrigley, D., 2020. Personnel scheduling considering employee well-being: Insights from case studies. In Proceedings of the 13th International Conference on the Practice and Theory of Automated Timetabling - PATAT 2021 (Vol. I, pp. 10–23).
- Petrovic, S., Yang, Y., Dror, M., 2007. Case-based selection of initialisation heuristics for metaheuristic examination timetabling. Expert Systems with Applications, 33 (3), 772–785. https://doi.org/10.1016/j.eswa.2006.06.017
- Petruzzi, N. C., Dada, M., 1999. Pricing and the newsvendor problem: A review with extensions. Operations Research, 47 (2), 183–194. https://doi.org/10.1287/opre.47.2.183
- Peykani, P., Farzipoor Saen, R., Seyed Esmaeili, F. S., Gheidar-Kheljani, J., 2021. Window data envelopment analysis approach: A review and bibliometric analysis. Expert Systems, 38 (7), e12721. https://doi.org/10.1111/exsy.12721
- Peykani, P., Mohammadi, E., Saen, R. F., Sadjadi, S. J., Rostamy-Malkhalifeh, M., 2020. Data envelopment analysis and robust optimization: A review. Expert Systems, 37 (4), e12534. https://doi.org/10.1111/exsy.12534
- Phelps, S., Köksalan, M., 2003. An interactive evolutionary metaheuristic for multiobjective combinatorial optimization. Management Science, 49 (12), 1726–1738. https://doi.org/10.1287/mnsc.49.12.1726.25117
- Phillips, P. J., Hahn, C., Fontana, P., Yates, A., Greene, K. K., Broniatowski, D., Przybocki, M. A., 2021. Four principles of explainable artificial intelligence. Retrieved November 29, 2021, from https://tsapps.nist.gov/publication/get_pdf.cfm?pub_id=933399
- Pidd, M., 2009. Tools for Thinking: modelling in management science. Wiley.
- Pillac, V., Guéret, C., Medaglia, A. L., 2013. A parallel matheuristic for the technician routing and scheduling problem. Optimization Letters, 7, 1525–1535. https://doi.org/10.1007/s11590-012-0567-4
- Pillay, N., 2016. A review of hyper-heuristics for educational timetabling. Annals of Operations Research, 239 (1), 3–38. https://doi.org/10.1007/s10479-014-1688-1
- Pinçe, Ç., Ferguson, M., Toktay, B., 2016. Extracting maximum value from consumer returns: Allocating between remarketing and refurbishing for warranty claims. Manufacturing & Service Operations Management, 18 (4), 475–492. https://doi.org/10.1287/msom.2016.0584
- Pinedo, M., 2012. Scheduling. Springer.
- Pinzon-Salcedo, L. A., Torres-Cuello, M. A., 2022. Systems thinking concepts within a collaborative programme evaluation methodology: The Hermes Programme evaluation. Systems Research and Behavioral Science, 39 (4), 708–722. https://doi.org/10.1002/sres.2822
- Pióro, M., Medhi, D., 2004. Routing, flow, and capacity design in communication and computer networks. Morgan Kaufman.
- Pióro, M., Szentesi, A., Harmatos, J., Jüttner, A., 2000. On OSPF related network optimization problems. In 8th IFIP Workshop on Performance Modelling and Evaluation of ATM & IP Networks . Ilkley, UK (pp. 70/1–70/14).
- Pirabán, A., Guerrero, W. J., Labadie, N., 2019. Survey on blood supply chain management: Models and methods. Computers and Operations Research, 112, 104756. https://doi.org/10.1016/j.cor.2019.07.014
- Pirkul, H., 1987. Efficient algorithms for the capacitated concentrator location problem. Computers & Operations Research, 14, 197–208. https://doi.org/10.1016/0305-0548(87)90022-0
- Pishvaee, M. S., Rabbani, M., Torabi, S. A., 2011. A robust optimization approach to closed-loop supply chain network design under uncertainty. Applied Mathematical Modelling, 35 (2), 637–649. https://doi.org/10.1016/j.apm.2010.07.013
- Pisinger, D., Ropke, S., 2007. A general heuristic for vehicle routing problems. Computers & Operations Research, 34 (8), 2403–2435. https://doi.org/10.1016/j.cor.2005.09.012
- Pisinger, D., Sigurd, M., 2007. Using decomposition techniques and constraint programming for solving the two-dimensional bin-packing problem. INFORMS Journal on Computing, 19 (1), 36–51. https://doi.org/10.1287/ijoc.1060.0181
- Plà, L. M., Sandars, D. L., Higgins, A. J., 2014. A perspective on operational research prospects for agriculture. Journal of the Operational Research Society, 65 (7), 1078–1089. https://doi.org/10.1057/jors.2013.45
- Plastria, F., 2002. Continuous covering location problems. In Z. Drezner & H. Hamacher (Eds.), Facility location: Applications and theory (pp. 37–79). Springer.
- Polzin, T., 2003. Algorithms for the Steiner problem in networks [Ph.D. thesis]. Saarland University, Saarbrücken, Germany.
- Polzin, T., Vahdati Daneshmand, S., 2009. Approaches to the Steiner problem in networks. In J. Lerner, D. Wagner, K. A. Zweig (Eds.), Algorithmics of large and complex networks (pp. 81–103). Springer.
- Poole, M. S., 2004. Central issues in the study of change and innovation. In M. S. Poole & A. H. Van de Ven (Eds.), Handbook of organizational change and innovation (pp. 3–31). Oxford University Press.
- Poole, M. S., 2007. Generalization in process theories of communication. Communication Methods and Measures, 1 (3), 181–190. https://doi.org/10.1080/19312450701434979
- Poropudas, J., Virtanen, K., 2010. Game-Theoretic validation and analysis of air combat simulation models. IEEE Transactions on Systems, Man, and Cybernetics - Part A: Systems and Humans, 40 (5), 1057–1070. https://doi.org/10.1109/TSMCA.2010.2044997
- Poropudas, J., Virtanen, K., 2011. Simulation metamodeling with dynamic Bayesian networks. European Journal of Operational Research, 214 (3), 644–655. https://doi.org/10.1016/j.ejor.2011.05.007
- Portela, M. C. A. S., Thanassoulis, E., 2010. Malmquist-type indices in the presence of negative data: An application to bank branches. Journal of Banking & Finance, 34 (7), 1472–1483. https://doi.org/10.1016/j.jbankfin.2010.01.004
- Portela, M. C. S., Camanho, A. S., Borges, D., 2012. Performance assessment of secondary schools: The snapshot of a country taken by DEA. Journal of the Operational Research Society, 63 (8), 1098–1115. https://doi.org/10.1057/jors.2011.114
- Porteus, E. L., 1990. Stochastic inventory theory. In D. P. Heyman & M. J. Sobel (Eds.), Stochastic models. Vol. 2 of Handbooks in Operations Research and Management Science (pp. 605–652). Elsevier.
- Porteus, E. L., 2002. Foundations of stochastic inventory theory. Stanford University Press.
- Post, G., Ahmadi, S., Daskalaki, S., Kingston, J. H., Kyngas, J., Nurmi, C., Ranson, D., 2012. An XML format for benchmarks in high school timetabling. Annals of Operations Research, 194, 385–397. https://doi.org/10.1007/s10479-010-0699-9
- Post, G., Di Gaspero, L., Kingston, J. H., McCollum, B., Schaerf, A., 2016. The third international timetabling competition. Annals of Operations Research, 239, 69–75. https://doi.org/10.1007/s10479-013-1340-5
- Post, G., Kingston, J. H., Ahmadi, S., Daskalaki, S., Gogos, C., Kyngas, J., Nurmi, C., Musliu, N., Pillay, N., Santos, H., Schaerf, A., 2014. XHSTT: An XML archive for high school timetabling problems in different countries. Annals of Operations Research, 218, 295–301. https://doi.org/10.1007/s10479-011-1012-2
- Posta, M., Ferland, J. A., Michelon, P., 2014. An exact cooperative method for the uncapacitated facility location problem. Mathematical Programming Computation, 6 (3), 199–231. https://doi.org/10.1007/s12532-014-0065-z
- Pouwels, K. B., House, T., Pritchard, E., Robotham, J. V., Birrell, P. J., Gelman, A., Vihta, K.-D., Bowers, N., Boreham, I., Thomas, H., Lewis, J., Bell, I., Bell, J. I., Newton, J. N., Farrar, J., Diamond, I., Benton, P., Walker, A. S. 2021. Community prevalence of SARS-CoV-2 in England from April to November, 2020: Results from the ONS coronavirus infection survey. The Lancet. Public Health, 6 (1), e30–e38. https://doi.org/10.1016/S2468-2667(20)30282-6
- Powell, W. B., 2011. Approximate dynamic programming: Solving the curses of dimensionality. Wiley.
- Powell, W. B., Sheffi, Y., 1983. The load planning problem of motor carriers: Problem description and a proposed solution approach. Transportation Research Part A: General, 17 (6), 471–480. https://doi.org/10.1016/0191-2607(83)90167-X
- Powell, W. B., Sheffi, Y., 1989. Design and implementation of an interactive optimization system for network design in the motor carrier industry. Operations Research, 37, 12–29. https://doi.org/10.1287/opre.37.1.12
- Power, D. J., Heavin, C., McDermott, J., Daly, M., 2018. Defining business analytics: An empirical approach. Journal of Business Analytics, 1 (1), 40–53. https://doi.org/10.1080/2573234X.2018.1507605
- Pöyhönen, M., Vrolijk, H., Hämäläinen, R. P., 2001. Behavioral and procedural consequences of structural variation in value trees. European Journal of Operational Research, 134 (1), 216–227. https://doi.org/10.1016/S0377-2217(00)00255-1
- Prékopa, A., 2013. Stochastic programming. Springer Science & Business Media.
- Prim, R., 1957. Shortest connection networks and some generalizations. Bell System Technical Journal, 36, 1389–1401. https://doi.org/10.1002/j.1538-7305.1957.tb01515.x
- Prömel, H., Steger, A., 2012. The Steiner tree problem: A tour through graphs, algorithms, and complexity. Springer.
- Pruhs, K., Woeginger, G. J., 2007. Approximation schemes for a class of subset selection problems. Theoretical Computer Science, 382 (2), 151–156. https://doi.org/10.1016/j.tcs.2007.03.006
- Psaraftis, H. N., Kontovas, C. A., 2010. Balancing the economic and environmental performance of maritime transportation. Transportation Research Part D: Transport and Environment, 15 (8), 458–462. https://doi.org/10.1016/j.trd.2010.05.001
- Psaraftis, H. N., Kontovas, C. A., 2013. Speed models for energy-efficient maritime transportation: A taxonomy and survey. Transportation Research Part C: Emerging Technologies, 26, 331–351. https://doi.org/10.1016/j.trc.2012.09.012
- Psaraftis, H. N., Kontovas, C. A., 2014. Ship speed optimization: Concepts, models and combined speed-routing scenarios. Transportation Research Part C: Emerging Technologies, 44, 52–69. https://doi.org/10.1016/j.trc.2014.03.001
- Pulleyblank, W., Dietrich, B., Forrest, J., Lougee-Heimer, R., 2000. Open source for optimization software. In: International Symposium for Mathematical Programming (ISMP) .
- Puterman, M. L., 2014. Markov decision processes: Discrete stochastic dynamic programming. Wiley.
- Pyrgiotis, N., Malone, K. M., Odoni, A., 2013. Modelling delay propagation within an airport network. Transportation Research Part C: Emerging Technologies, 27, 60–75. https://doi.org/10.1016/j.trc.2011.05.017
- Qi, X., 2015. Disruption management for liner shipping. In C.-Y. Lee & Q. Meng (Eds.), Handbook of ocean container transport logistics: Making global supply chains effective (pp. 231–249). Springer.
- Qi, Y., Harrod, S., Psaraftis, H. N., Lang, M., 2022. Transport service selection and routing with carbon emissions and inventory costs consideration in the context of the belt and road initiative. Transportation Research Part E: Logistics and Transportation Review, 159, 102630. https://doi.org/10.1016/j.tre.2022.102630
- Qin, Y., Wang, R., Vakharia, A. J., Chen, Y., Seref, M. M., 2011. The newsvendor problem: Review and directions for future research. European Journal of Operational Research, 213 (2), 361–374. https://doi.org/10.1016/j.ejor.2010.11.024
- Qu, R., Pham, N., Bai, R., Kendall, G., 2015. Hybridising heuristics within an estimation distribution algorithm for examination timetabling. Applied Intelligence, 42 (4), 679–693. https://doi.org/10.1007/s10489-014-0615-0
- Queiroga, E., Sadykov, R., Uchoa, E., 2021. A popmusic matheuristic for the capacitated vehicle routing problem. Computers & Operations Research, 136, 105475. https://doi.org/10.1016/j.cor.2021.105475
- Queiroga, E., Sadykov, R., Uchoa, E., Vidal, T., 2022. 10,000 optimal CVRP solutions for testing machine learning based heuristics. In AAAI-22 Workshop on Machine Learning for Operations Research (ML4OR) (pp. 1–2).
- Raack, C., Koster, A. M., Orlowski, S., Wessäly, R., 2011. On cut-based inequalities for capacitated network design polyhedra. Networks, 57 (2), 141–156. https://doi.org/10.1002/net.20395
- Rad, S. R., Roy, O., 2021. Deliberation, single-peakedness, and coherent aggregation. The American Political Science Review, 115 (2), 629–648. https://doi.org/10.1017/S0003055420001045
- Rahmaniani, R., Crainic, T. G., Gendreau, M., Rei, W., 2017. The Benders decomposition algorithm: A literature review. European Journal of Operational Research, 259 (3), 801–817. https://doi.org/10.1016/j.ejor.2016.12.005
- Rajagopalan, R., 2020. Immersive systemic knowing: Advancing systems thinking beyond rational analysis. Springer.
- Ralphs, T., Bulut, A., Vigerske, S., 2022. GiMPy. https://projects.coin-or.org/Gimpy
- Ralphs, T. K., Guzelsoy, M., 2005. The Symphony callable library for mixed integer programming. In B. Golden, S. Raghavan, E. Wasil (Eds.), The next wave in computing, optimization, and decision technologies (pp. 61–76). Springer US.
- Ram Mohan Rao, P., Murali Krishna, S., Siva Kumar, A. P., 2018. Privacy preservation techniques in big data analytics: A survey. Journal of Big Data, 5 (1), 1–12. https://doi.org/10.1186/s40537-018-0141-8
- Ramsey, F. P., 1931. Truth and probability. In R. B. Braithwaite(Ed.), The foundations of mathematics and other logical essays (Ch. 7, pp. 156–198). Routledge and Kegan Paul.
- Rancourt, M., Cordeau, J., Laporte, G., Watkins, B., 2015. Tactical network planning for food aid distribution in kenya. Computers & Operations Research, 56, 68–83. https://doi.org/10.1016/j.cor.2014.10.018
- Ranyard, J., Hopes, J., Murray, E., 2021. Reinvigorating soft OR for practitioners: Report to HORAF. 63rd Conference of the UK Operational Research Society (OR63) .
- Ranyard, J. C., Fildes, R., Hu, T.-I., 2015. Reassessing the scope of OR practice: The influences of problem structuring methods and the analytics movement. European Journal of Operational Research, 245 (1), 1–13. https://doi.org/10.1016/j.ejor.2015.01.058
- Rasmussen, C. E., Williams, C. K. I., 2005. Gaussian processes for machine learning. The MIT Press.
- Rasmussen, R. V., Trick, M. A., 2008. Round robin scheduling – A survey. European Journal of Operational Research, 188 (3), 617–636. https://doi.org/10.1016/j.ejor.2007.05.046
- Rawls, C. G., Turnquist, M. A., 2010. Pre-positioning of emergency supplies for disaster response. Transportation Research Part B: Methodological, 44 (4), 521–534. https://doi.org/10.1016/j.trb.2009.08.003
- Rawls, C. G., Turnquist, M. A., 2011. Pre-positioning planning for emergency response with service quality constraints. OR Spectrum, 33 (3), 481–498. https://doi.org/10.1007/s00291-011-0248-1
- Rawls, J., 1971. A theory of justice. Harvard University Press.
- Rea, D., Froehle, C., Masterson, S., Stettler, B., Fermann, G., Pancioli, A., 2021. Unequal but fair: Incorporating distributive justice in operational allocation models. Production and Operations Management, 30, 2304–2320. https://doi.org/10.1111/poms.13369
- Red Hat. 2022. Optaplanner. https://www.optaplanner.org/
- Reddie, A. W., Goldblum, B. L., Lakkaraju, K., Reinhardt, J., Nacht, M., Epifanovskaya, L., 2018. Next-generation wargames. Science, 362 (6421), 1362–1364. https://doi.org/10.1126/science.aav2135
- Reed, J., 2009. The G/GI/N queue in the halfin–whitt regime. The Annals of Applied Probability, 19 (6), 2211–2269. https://doi.org/10.1214/09-AAP609
- Reed, S., Campbell, A. M., Thomas, B. W., 2022. Impact of autonomous vehicle assisted last-mile delivery in urban to rural settings. Transportation Science, 56 (6), 1530–1548. https://doi.org/10.1287/trsc.2022.1142
- Rehfeldt, D., 2021. Faster algorithms for steiner tree and related problems: From theory to practice [Ph.D. thesis]. Technische Universität Berlin.
- Rehfeldt, D., Koch, T., 2021. Implications, conflicts, and reductions for Steiner trees. In Singh M. & Williamson D. P. (Eds.) Integer Programming and Combinatorial Optimization - 22nd International Conference , IPCO 2021, Atlanta, GA, USA, May 19–21, 2021, Proceedings. Vol. 12707 of Lecture Notes in Computer Science (pp. 473–487). Springer
- Reichert, P., Langhans, S. D., Lienert, J., Schuwirth, N., 2015. The conceptual foundation of environmental decision support. Journal of Environmental Management, 154, 316–332. https://doi.org/10.1016/j.jenvman.2015.01.053
- Reinhardt, L. B., Pisinger, D., 2012. A branch and cut algorithm for the container shipping network design problem. Flexible Services and Manufacturing Journal, 24 (3), 349–374. https://doi.org/10.1007/s10696-011-9105-4
- Ren, H., Huang, T., 2022. Opaque selling and inventory management in vertically differentiated markets. Manufacturing & Service Operations Management, 24 (5), 2543–2557. https://doi.org/10.1287/msom.2021.1041
- Ren, X., Jiang, C., Khoveyni, M., Guan, Z., Yang, G., 2021. A review of DEA methods to identify and measure congestion. Journal of Management Science and Engineering, 6 (4), 345–362. https://doi.org/10.1016/j.jmse.2021.05.003
- Resnick, S. I., 2007. Heavy-tail phenomena: Probabilistic and statistical modeling. Springer Science & Business Media.
- Ribeiro, C. C., 2012. Sports scheduling: Problems and applications. International Transactions in Operational Research, 19 (2), 201–226. https://doi.org/10.1111/j.1475-3995.2011.00819.x
- Richardson, H. S., Weithman, P. J. (Eds.), 1999. The Philosophy of Rawls (Vol. 5). Garland.
- Righini, G., Salani, M., 2008. New dynamic programming algorithms for the resource constrained elementary shortest path problem. Networks, 51 (3), 155–170. https://doi.org/10.1002/net.20212
- Rintamäki, T., Spence, M. T., Saarijärvi, H., Joensuu, J., Yrjölä, M., 2021. Customers’ perceptions of returning items purchased online: Planned versus unplanned product returners. International Journal of Physical Distribution & Logistics Management, 51 (4), 403–422. https://doi.org/10.1108/IJPDLM-10-2019-0302
- Rios Insua, D., Couce-Vieira, A., Rubio, J. A., Pieters, W., Labunets, K., G Rasines, D., 2021. An adversarial risk analysis framework for cybersecurity. Risk Analysis, 41 (1), 16–36. https://doi.org/10.1111/risa.13331
- Ritchie, C., Taket, A., Bryant, J. (Eds.), 1994. Community works: 26 case studies showing community operational research in action. Pavic Press.
- Rittel, H. W. J., Webber, M. M., 1973. Dilemmas in a general theory of planning. Policy Sciences, 4 (2), 155–169. https://doi.org/10.1007/BF01405730
- Robenek, T., Azadeh, S. S., Maknoona, Y., Bierlaire, M., 2017. Hybrid cyclicity: Combining the benefits of cyclic and non-cyclic timetables. Transportation Research Part C: Emerging Technologies, 75, 228–253. https://doi.org/10.1016/j.trc.2016.12.015
- Roberti, R., Ruthmair, M., 2021. Exact methods for the traveling salesman problem with drone. Transportation Science, 55 (2), 315–335. https://doi.org/10.1287/trsc.2020.1017
- Robinson, A., Robinson, M., 1994. On the tabletop improvement experiments of Japan. Production and Operations Management, 3 (3), 201–217. https://doi.org/10.1111/j.1937-5956.1994.tb00120.x
- Robinson, S., 2014. Simulation: The practice of model development and use. Palgrave Macmillan.
- Robinson, S., 2020. Conceptual modelling for simulation: Progress and grand challenges. Journal of Simulation, 14 (1), 1–20. https://doi.org/10.1080/17477778.2019.1604466
- Robinson, S. L., 2008. Conceptual modelling for simulation Part I: Definition and requirements. Journal of the Operational Research Society, 59 (3), 278–290. https://doi.org/10.1057/palgrave.jors.2602368
- Rocha, M., Oliveira, J. F., Carravilla, M. A., 2013. Cyclic staff scheduling: Optimization models for some real-life problems. Journal of Scheduling, 16 (2), 231–242. https://doi.org/10.1007/s10951-012-0299-4
- Rockafellar, R. T., Uryasev, S., 2002. Conditional value-at-risk for general loss distributions. Journal of Banking & Finance, 26 (7), 1443–1471. https://doi.org/10.1016/S0378-4266(02)00271-6
- Rockafellar, R. T., Uryasev, S., et al., 2000. Optimization of conditional value-at-risk. Journal of Risk, 2, 21–42. https://doi.org/10.21314/JOR.2000.038
- Rockafellar, R. T., Wets, R. J.-B., 1991. Scenarios and policy aggregation in optimization under uncertainty. Mathematics of Operations Research, 16 (1), 119–147. https://doi.org/10.1287/moor.16.1.119
- Rockwell Automation. 2022. Arena simulation. https://www.rockwellautomation.com/en-us/products/software/arena-simulation.html
- Rogers, D. S., Tibben-Lembke, R., 2001. An examination of reverse logistics practices. Journal of Business Logistics, 22 (2), 129–148. https://doi.org/10.1002/j.2158-1592.2001.tb00007.x
- Romero, J. A., Abad, C., 2022. Cloud-based big data analytics integration with ERP platforms. Management Decision, 60 (12), 3416–3437. https://doi.org/10.1108/MD-07-2021-0872
- Rose, B., 2016. Defining analytics: A conceptual framework. ORMS Today, 43 (3), 36–40.
- Rosenbaum, D. T., 2004. Measuring how NBA players help their teams win. Retrieved November 1, 2022. http://www.82games.com/comm30.htm.
- Rosenberger, J. M., Johnson, E. L., Nemhauser, G. L., 2003. Rerouting aircraft for airline recovery. Transportation Science, 37 (4), 408–421. https://doi.org/10.1287/trsc.37.4.408.23271
- Rosenhead, J., 1986. Custom and practice. Journal of the Operational Research Society, 37 (4), 335–343. https://doi.org/10.1057/jors.1986.61
- Rosenhead, J. (Ed.), 1989. Rational analysis for a problematic world: Problem structuring methods for complexity, uncertainty and conflict. Wiley.
- Rosenhead, J., 1993. Enabling analysis: Across the developmental divide. Systems Practice, 6 (2), 117–138. https://doi.org/10.1007/BF01062247
- Rosenhead, J., 1996. What’s the problem? An introduction to problem structuring methods. Interfaces, 26 (6), 117–131. https://doi.org/10.1287/inte.26.6.117
- Rosenhead, J., 2006. Past, present and future of problem structuring methods. Journal of the Operational Research Society, 57 (7), 759–765. https://doi.org/10.1057/palgrave.jors.2602206
- Rosenhead, J., 2013. Book review of Johnson. In P. Michael (Ed.) 2012 community-Based operations research: Decision modeling for local impact and diverse populations. Interfaces (Vol. 43, pp. 609–610).
- Rosenhead, J., Mingers, J. (Eds.), 2001. Rational analysis for a problematic world revisited: Problem structuring methods for complexity, uncertainty and conflict (2nd ed.). Wiley.
- Rosenhead, J., White, L., 1996. Nuclear fusion: Some linked case studies in community operational research. Journal of the Operational Research Society, 47 (4), 479–489. https://doi.org/10.2307/3010725
- Rosling, K., 1989. Optimal inventory policies for assembly systems under random demands. Operations Research, 37 (4), 565–579. https://doi.org/10.1287/opre.37.4.565
- Ross, S. M., 1983. Introduction to stochastic dynamic programming. Academic Press.
- Roth, A., Singhal, J., Singhal, K., Tang, C. S., 2016. Knowledge creation and dissemination in operations and supply chain management. International Journal of Operations & Production Management, 25 (9), 1473–1488. https://doi.org/10.1111/poms.12590
- Rother, M., Shook, J., 1999. Learning to see: Value stream mapping to add value and eliminate muda. The Lean Enterprise Institute.
- Rothstein, M., 1971. An airline overbooking model. Transportation Science, 5 (2), 180–192. https://doi.org/10.1287/trsc.5.2.180
- Roundy, R., 1985. 98%-effective integer-ratio lot-sizing for one-warehouse multi-retailer systems. Management Science, 31 (11), 1416–1430. https://doi.org/10.1287/mnsc.31.11.1416
- Roundy, R., 1986. A 98%-effective lot-sizing rule for a multi-product, multi-stage production/inventory system. Mathematics of Operations Research, 11 (4), 699–727. https://doi.org/10.1287/moor.11.4.699
- Rouwette, E. A. J. A., 2016. The impact of group model building on behavior. In M. Kunc, J. Malpass, L. White (Eds.), Behavioral operational research: Theory, methodology and practice (pp. 213–241). Palgrave Macmillan.
- Rouwette, E. A. J. A., Korzilius, H., Vennix, J. A. M., Jacobs, E., 2010. Modeling as persuasion: The impact of group model building on attitudes and behavior. System Dynamics Review, 27 (1), 1–21. https://doi.org/10.1002/sdr.441
- Rowe, G., Wright, G., 1999. The delphi technique as a forecasting tool: Issues and analysis. International Journal of Forecasting, 15 (4), 353–375. https://doi.org/10.1016/S0169-2070(99)00018-7
- Roy, B., 1993. Decision science or decision-aid science? European Journal of Operational Research, 66 (2), 184–203. https://doi.org/10.1016/0377-2217(93)90312-B
- Roy, B., 1996. Multicriteria methodology for decision aiding. In Nonconvex optimization and its applications (Vol. 12). Springer-Verlag.
- Roy, B., 2005. Paradigms and challenges. In S. Greco, M. Ehrgott, J. R. Figueira (Eds.), Multiple criteria decision analysis: State of the art surveys (pp. 3–24). Springer-Verlag.
- Roy, B., Słowiński, R., 2013. Questions guiding the choice of a multicriteria decision aiding method. EURO Journal on Decision Processes, 1 (1), 69–97. https://doi.org/10.1007/s40070-013-0004-7
- Royset, J. O., Carlyle, W. M., Wood, R. K., 2009. Routing military aircraft with a constrained shortest-path algorithm. Military Operations Research, 14 (3), 31–52. https://doi.org/10.5711/morj.14.3.31
- Royston, G., 2009. One hundred years of operational research in Health—UK 1948–2048. Journal of the Operational Research Society, 60 (Supplement 1), s169–s179. https://doi.org/10.1057/jors.2009.14
- RSAS. 2020. The prize in economic sciences 2020. Press release, October 12, Royal Swedish Academy of Sciences.
- Rubinstein, A., 1982. Perfect equilibrium in a bargaining model. Econometrica, 50, 97–109. https://doi.org/10.2307/1912531
- Ruf, M., Cordeau, J. F., 2021. Adaptive large neighborhood search for integrated planning in railroad classification yards. Transportation Research Part B: Methodological, 150, 26–51. https://doi.org/10.1016/j.trb.2021.05.012
- Ruibal, C., Mazumdar, M., 2008. Forecasting the mean and the variance of electricity prices in deregulated markets. IEEE Transactions on Power Systems, 23 (1), 25–32. https://doi.org/10.1109/TPWRS.2007.913195
- Ruivo, P., Johansson, B., Sarker, S., Oliveira, T., 2020. The relationship between ERP capabilities, use, and value. Computers in Industry, 117, 103209. https://doi.org/10.1016/j.compind.2020.103209
- Ruiz-Tagle, A., Lopez Droguett, E., Groth, K. M., 2022. Exploiting the capabilities of Bayesian networks for engineering risk assessment: Causal reasoning through interventions. Risk Analysis, 42 (6), 1306–1324. https://doi.org/10.1111/risa.13711
- Rumelhart, D. E., Hinton, G. E., Williams, R. J., 1986. Learning representations by back-propagating errors. Nature, 323 (6088), 533–536. https://doi.org/10.1038/323533a0
- Russell, C., Kusner, M. J., Loftus, J. R., Silva, R., 2017. When worlds collide: Integrating different counterfactual assumptions in fairness. In Proceedings of 31st International Conference on Neural Information Processing Systems (pp. 6417–6426).
- Russell, S., 1998. Learning agents for uncertain environments (extended abstract). In P. L. Bartlett & Y. Mansour (Eds.), Proceedings of the Eleventh Annual Conference on Computational Learning Theory , COLT 1998, Madison, Wisconsin, USA, July 24–26, 1998. ACM (pp. 101–103). https://doi.org/10.1145/279943.279964
- Saaty, T., 1977. A scaling method for priorities in hierarchical structures. Journal of Mathematical Psychology, 15 (3), 234–281. https://doi.org/10.1016/0022-2496(77)90033-5
- Sadykov, R., 2022. Academic webpage. Retrieved September 16, 2022. https://www.math.u-bordeaux.fr/∼rsadykov/.
- Sadykov, R., Uchoa, E., Pessoa, A., 2021. A bucket graph–based labeling algorithm with application to vehicle routing. Transportation Science, 55 (1), 4–28. https://doi.org/10.1287/trsc.2020.0985
- Sadykov, R., Vanderbeck, F., Pessoa, A., Tahiri, I., Uchoa, E., 2019. Primal heuristics for branch and price: The assets of diving methods. INFORMS Journal on Computing, 31 (2), 251–267. https://doi.org/10.1287/ijoc.2018.0822
- Şahin, G., Süral, H., 2007. A review of hierarchical facility location models. Computers & Operations Research, 34 (8), 2310–2331. https://doi.org/10.1016/j.cor.2005.09.005
- Sahinidis, N., 1996. BARON: A general purpose global optimization software package. Journal of Global Optimization, 8, 201–205. https://doi.org/10.1007/BF00138693
- Salahi, M., Toloo, M., Torabi, N., 2021. A new robust optimization approach to common weights formulation in DEA. Journal of the Operational Research Society, 72 (6), 1390–1402. https://doi.org/10.1080/01605682.2020.1718016
- Salo, A., Keisler, J., Morton, A., 2011. Portfolio decision analysis: Improved methods for resource allocation. In International series in operations research and management science (Vol. 162). Springer-Verlag.
- Salo, A., Punkka, A., 2011. Ranking intervals and dominance relations for Ratio-Based efficiency analysis. Management Science, 57 (1), 200–214. https://doi.org/10.1287/mnsc.1100.1265
- Salo, A., Tosoni, E., Roponen, J., Bunn, D. W., 2022. Using cross-impact analysis for probabilistic risk assessment. Futures & Foresight Science, 4 (2), e2103. https://doi.org/10.1002/ffo2.103
- Samorani, M., Alptekinoğlu, A., Messinger, P. R., 2019. Product return episodes in retailing. Service Science, 11 (4), 263–278. https://doi.org/10.1287/serv.2019.0250
- Sampaio, A., Savelsbergh, M., Veelenturf, L. P., Van Woensel, T., 2020. Delivery systems with crowd-sourced drivers: A pickup and delivery problem with transfers. Networks, 76 (2), 232–255. https://doi.org/10.1002/net.21963
- Samuel, A. L., 1959. Some studies in machine learning using the game of checkers. IBM Journal of Research and Development, 3 (3), 210–229. https://doi.org/10.1147/rd.33.0210
- Samuelson, W., 2014. Auctions: Advances in theory and practice. In K. Chatterjee and W. Samuelson (Eds.), Game theory and business applications (pp. 323–366). Springer.
- Sandholm, W., 2010. Population games and evolutionary dynamics. MIT Press.
- Santibanez Gonzalez, E. D., Koh, L., Leung, J., 2019. Towards a circular economy production system: trends and challenges for operations management. International Journal of Production Research, 57 (23), 7209–7218. https://doi.org/10.1080/00207543.2019.1656844
- Sarimveis, H., Patrinos, P., Tarantilis, C. D., Kiranoudis, C. T., 2008. Dynamic modeling and control of supply chain systems: A review. Computers & Operations Research, 35 (11), 3530–3561. https://doi.org/10.1016/j.cor.2007.01.017
- Sartori, C. S., Gandra, V., Çalık, H., Smet, P., 2021. Production scheduling with stock- and staff-related restrictions. In M. Mes, E. Lalla-Ruiz, S. Voß (Eds.), Computational logistics (pp. 142–162). Springer.
- Savage, L., 1954. The foundations of statistics. John Wiley & Sons.
- Savaskan, R. C., Van Wassenhove, L. N., 2006. Reverse channel design: The case of competing retailers. Management Science, 52 (1), 1–14. https://doi.org/10.1287/mnsc.1050.0454
- Savelsbergh, M., 1994. Preprocessing and probing techniques for mixed integer programming problems. ORSA Journal on Computing, 6, 445–454. https://doi.org/10.1287/ijoc.6.4.445
- Savelsbergh, M., Van Woensel, T., 2016. 50th anniversary invited article—city logistics: Challenges and opportunities. Transportation Science, 50 (2), 579–590. https://doi.org/10.1287/trsc.2016.0675
- Sawaragi, Y., Nakayama, H., Tanino, T., 1985. Theory of multiobjective optimization. Academic Press.
- Saxena, N. A., Huang, K., DeFilippis, E., Radanovic, G., Parkes, D. C., Liu, Y., 2020. How do fairness definitions fare? Testing public attitudes towards three algorithmic definitions of fairness in loan allocations. Artificial Intelligence, 283, 103238. https://doi.org/10.1016/j.artint.2020.103238
- Scala, N. M., Howard II J. P. (Eds.), 2020. Handbook of military and defense operations research. CRC Press.
- Scarf, H., 1959. Bayes solutions of the statistical inventory problem. The Annals of Mathematical Statistics, 30 (2), 490–508. https://doi.org/10.1214/aoms/1177706264
- Scarf, H., 1960a. The optimality of (S, s) policies in the dynamic inventory problem. In Mathematical methods in the social sciences (pp. 196–202). Stanford University Press.
- Scarf, H. E., 1960b. Some remarks on Bayes solutions to the inventory problem. Naval Research Logistics Quarterly, 7 (4), 591–596. https://doi.org/10.1002/nav.3800070428
- Scarf, P., Parma, R., McHale, I., 2019. On outcome uncertainty and scoring rates in sport: The case of international rugby union. European Journal of Operational Research, 273 (2), 721–730. https://doi.org/10.1016/j.ejor.2018.08.021
- Scarf, P., Yusof, M. M., Bilbao, M., 2009. A numerical study of designs for sporting contests. European Journal of Operational Research, 198 (1), 190–198. https://doi.org/10.1016/j.ejor.2008.07.029
- Scarselli, F., Gori, M., Tsoi, A. C., Hagenbuchner, M., Monfardini, G., 2009. The graph neural network model. IEEE Transactions on Neural Networks, 20 (1), 61–80. https://doi.org/10.1109/TNN.2008.2005605
- Schaefer, A. J., Johnson, E. L., Kleywegt, A. J., Nemhauser, G. L., 2005. Airline crew scheduling under uncertainty. Transportation Science, 39 (3), 340–348. https://doi.org/10.1287/trsc.1040.0091
- Scheithauer, G., 2017. Introduction to cutting and packing optimization: Problems, modeling approaches, solution methods. In International series in operations research & management science. Springer. https://books.google.co.uk/books?id=FlM7DwAAQBAJ
- Scherfke, S., 2021. SimPy. https://github.com/simpx/simpy
- Schiffer, M., Boysen, N., Klein, P., Laporte, G., Pavone, M., 2022. Optimal picking policies in e-commerce warehouses. Management Science, 68 (10), 7497–7517. https://doi.org/10.1287/mnsc.2021.4275
- Schlkopf, B., Smola, A. J., Bach, F., 2018. Learning with kernels: Support vector machines, regularization, optimization, and beyond. The MIT Press.
- Schmenner, R. W., 2004. Service businesses and productivity. Decision Sciences, 35 (3), 333–347. https://doi.org/10.1111/j.0011-7315.2004.02558.x
- Schöbel, A., 2012. Line planning in public transportation: Models and methods. OR Spectrum, 34, 491–510. https://doi.org/10.1007/s00291-011-0251-6
- Scholten, L., Schuwirth, N., Reichert, P., Lienert, J., 2015. Tackling uncertainty in multi-criteria decision analysis – An application to water supply infrastructure planning. European Journal of Operational Research, 242 (1), 243–260. https://doi.org/10.1016/j.ejor.2014.09.044
- Schrijver, A., 1986. Theory of linear and integer programming. Wiley.
- Schrijver, A., 1998. Theory of linear and integer programming. John Wiley & Sons.
- Schrijver, A., 2002. On the history of the transportation and maximum flow problems. Mathematical Programming, 91 (3), 437–445. https://doi.org/10.1007/s101070100259
- Schrijver, A., 2003. Combinatorial optimization – Polyhedra and efficiency. Springer.
- Schrijver, A., 2005. On the history of combinatorial optimization (till 1960). In K. Aardal, G. L. Nemhauser, R. Weismantel(Eds.), Handbooks in operations research and management science (Vol. 12, pp. 1–68). Elsevier.
- Schummer, J., Vohra, R. V., 2003. Auctions for procuring options. Operations Research, 51 (1), 41–51. https://doi.org/10.1287/opre.51.1.41.12804
- Schütz, T., Stanley-Lockman, Z., 2017. Smart logistics for future armed forces. Brief 30, European Union Institute for Security Studies.
- Schwartz, E. S., Trigeorgis, L., 2004. Real options and investment under uncertainty: Classical readings and recent contributions. MIT Press.
- Schwetschenau, S. E., VanBriesen, J. M., Cohon, J. L., 2019. Integrated simulation and optimization models for treatment plant placement in drinking water systems. Journal of Water Resources Planning and Management, 145 (11), 04019047. https://doi.org/10.1061/(ASCE)WR.1943-5452.0001106
- Scott, R. J., Cavana, R. Y., Cameron, D., 2013. Evaluating immediate and long-term impacts of qualitative group model building workshops on participants’ mental models. System Dynamics Review, 29 (4), 216–236. https://doi.org/10.1002/sdr.1505
- SDG. 2022. Sustainable development goalsu. Retrieved October 24, 2022. https://sdgs.un.org/goals.
- Secomandi, N., 2001. A rollout policy for the vehicle routing problem with stochastic demands. Operations Research, 49 (5), 796–802. https://doi.org/10.1287/opre.49.5.796.10608
- See, K. F., Md Hamzah, N., Yu, M.-M., 2021. Metafrontier efficiency analysis for hospital pharmacy services using dynamic network DEA framework. Socio-Economic Planning Sciences, 78, 101044. https://doi.org/10.1016/j.seps.2021.101044
- Seidl, A., Kaplan, E. H., Caulkins, J. P., Wrzaczek, S., Feichtinger, G., 2016. Optimal control of a terror queue. European Journal of Operational Research, 248 (1), 246–256. https://doi.org/10.1016/j.ejor.2015.07.010
- Sein, M. K., Henfridsson, O., Purao, S., Rossi, M., Lindgren, R., 2011. Action design research. MIS Quarterly, 35 (1), 37–56. https://doi.org/10.2307/23043488
- Selten, R., 1975. Reexamination of the perfectness concept for equilibrium points in extensive games. International Journal of Game Theory, 4 (1), 25–55. https://doi.org/10.1007/BF01766400
- Serfozo, R., 1999. Introduction to stochastic networks. Springer-Verlag.
- Servranckx, T., Vanhoucke, M., 2019a. Strategies for project scheduling with alternative subgraphs under uncertainty: Similar and dissimilar sets of schedules. European Journal of Operational Research, 279 (1), 38–53. https://doi.org/10.1016/j.ejor.2019.05.023
- Servranckx, T., Vanhoucke, M., 2019b. A tabu search procedure for the resource-constrained project scheduling problem with alternative subgraphs. European Journal of Operational Research, 273 (3), 841–860. https://doi.org/10.1016/j.ejor.2018.09.005
- Sethi, S. P., Cheng, F., 1997. Optimality of (s, s) policies in inventory models with markovian demand. Operations Research, 45 (6), 931–939. https://doi.org/10.1287/opre.45.6.931
- Sethi, S. P., Thompson, G. L., 1970. Applications of mathematical control theory to finance: Modeling simple dynamic cash balance problems. Journal of Financial and Quantitative Analysis, 5 (4-5), 381–394. https://doi.org/10.2307/2330038
- Sethi, S. P., Thompson, G. L., 2009. Optimal control theory: Applications to management science and economics. Springer.
- Shaabani, H., 2022. A literature review of the perishable inventory routing problem. The Asian Journal of Shipping and Logistics, 38 (3), 143–161. https://doi.org/10.1016/j.ajsl.2022.05.002
- Shah, W. U. H., Hao, G., Yan, H., Yasmeen, R., Padda, I. U. H., Ullah, A., 2022. The impact of trade, financial development and government integrity on energy efficiency: An analysis from G7-Countries. Energy, 255 (1), 124507. https://doi.org/10.1016/j.energy.2022.124507
- Shamir, R., 1987. The efficiency of the simplex method: A survey. Management Science, 33 (3), 301–334. https://doi.org/10.1287/mnsc.33.3.301
- Shang, K. H., Song, J.-S., 2003. Newsvendor bounds and heuristic for optimal policies in serial supply chains. Management Science, 49 (5), 618–638. https://doi.org/10.1287/mnsc.49.5.618.15147
- Shang, K. H., Song, J.-S., Zhou, S. X., 2023. Single-stage approximations of multiechelon inventory models. In J.-S. Song (Ed.), Research handbook on inventory management. Edward Elgar Publishing.
- Shapiro, A., 2003. Monte Carlo sampling methods. In A. Ruszczynski & A. Shapiro (Eds.), Handbooks in operations research and management science (pp. 353–425). Horth-Holland.
- Shapiro, A., Dentcheva, D., Ruszczyński, A., 2021. Lectures on stochastic programming: Modeling and theory (3rd ed.). SIAM.
- Shapley, L., 1953. A value for n-person games. In H. Kuhn & A. Tucker (Eds.), Contributions to the theory of games II (pp. 307–317). Princeton University Press.
- Sharp, J. A., Meng, W., Liu, W., 2007. A modified slacks-based measure model for data envelopment analysis with ‘natural’ negative outputs and inputs. Journal of the Operational Research Society, 58 (12), 1672–1677. https://doi.org/10.1057/palgrave.jors.2602318
- Shaw, D., Westcombe, M., Hodgkin, J., Montibeller, G., 2004. Problem structuring methods for large group interventions. Journal of the Operational Research Society, 55 (5), 453–463. https://doi.org/10.1057/palgrave.jors.2601712
- Shaw, K., Irfan, M., Shankar, R., Yadav, S. S., 2016. Low carbon chance constrained supply chain network design problem: A benders decomposition based approach. Computers & Industrial Engineering, 98, 483–497. https://doi.org/10.1016/j.cie.2016.06.011
- Sherali, H., 1984. A multiple leader Stackelberg model and analysis. Operations Research, 32 (2), 229–476. https://doi.org/10.1287/opre.32.2.390
- Sherali, H., Adams, W., 1990. A hierarchy of relaxations between the continuous and convex hull representations for zero-one programming problems. SIAM Journal on Discrete Mathematics, 3, 411–430. https://doi.org/10.1137/0403036
- Sherali, H. D., Carter, T. B., Hobeika, A. G., 1991. A location-allocation model and algorithm for evacuation planning under hurricane/flood conditions. Transportation Research Part B: Methodological, 25 (6), 439–452. https://doi.org/10.1016/0191-2615(91)90037-J
- Sheu, J.-B., 2014. Post-disaster relief–service centralized logistics distribution with survivor resilience maximization. Transportation Research Part B: Methodological, 68, 288–314. https://doi.org/10.1016/j.trb.2014.06.016
- Shi, C., 2023. Approximation algorithms for stochastic inventory systems. In J.-S. Song (Ed.), Research handbook on inventory management. Edward Elgar Publishing.
- Shi, Z., Wang, G., 2018. Integration of big-data ERP and business analytics (BA). The Journal of High Technology Management Research, 29 (2), 141–150. https://doi.org/10.1016/j.hitech.2018.09.004
- Shipley, M. F., Coy, S. P., Shipley, J. B., 2018. Utilizing statistical significance in fuzzy interval-valued evidence sets for assessing artificial reef structure impact. Journal of the Operational Research Society, 69 (6), 905–918. https://doi.org/10.1057/s41274-017-0277-5
- Shneiderman, B., 1996. The eyes have it: A task by data type taxonomy for information visualizations. In Proceedings 1996 IEEE Symposium on Visual Languages (pp. 336–343).
- Shor, N. Z., 1977. Cut-off method with space extension in convex programming problems. Cybernetics, 13 (1), 94–96. https://doi.org/10.1007/BF01071394
- Shtub, A., Bard, J. F., Globerson, S., 2004. Project management: Engineering, technology and implementation (15th ed.). Pearson Custom Publishing.
- Si, J., Barto, A. G., Powell, W. B., Wunsch, D., 2004. Handbook of learning and approximate dynamic programming. John Wiley & Sons.
- Siegrist, M., Árvai, J., 2020. Risk perception: Reflections on 40 years of research. Risk Analysis, 40 (S1), 2191–2206. https://doi.org/10.1111/risa.13599
- Silva, E., Oliveira, J. F., Wäscher, G., 2016. The pallet loading problem: A review of solution methods and computational experiments. International Transactions in Operational Research, 23 (1–2), 147–172. https://doi.org/10.1111/itor.12099
- Silver, E. A., 2004. An overview of heuristic solution methods. Journal of the Operational Research Society, 55 (9), 936–956. https://doi.org/10.1057/palgrave.jors.2601758
- Silver, E. A., Meal, C., 1973. A heuristic for selecting lot size quantities for the case of a deterministic time-varying demand rate and discrete opportunities for replenishment. Production and Inventory Management, 2, 64–74.
- Silver, E. A., Pyke, D. F., Petterson, R., 1988. Inventory management and production planning and scheduling. John Wiley & Sons.
- Silver, E. A., Victor, R., Vidal, V., de Werra, D., 1980. A tutorial on heuristic methods. European Journal of Operational Research, 5 (3), 153–162. https://doi.org/10.1016/0377-2217(80)90084-3
- Simantics System Dynamics. 2017. SysDyn. http://sysdyn.simantics.org/
- Simão, H. P., Day, J., George, A. P., Gifford, T., Nienow, J., Powell, W. B., 2009. An approximate dynamic programming algorithm for large-scale fleet management: A case application. Transportation Science, 43 (2), 178–197. https://doi.org/10.1287/trsc.1080.0238
- Simar, L., Wilson, P. W., 2011. Two-stage DEA: Caveat emptor. Journal of Productivity Analysis, 36 (2), 205–218. https://doi.org/10.1007/s11123-011-0230-6
- Simchi-Levi, D., Chen, X., Bramel, J., 2014. The logic of logistics: Theory, algorithms, and applications for logistics and supply chain management. Springer.
- Simchi-Levi, D., Trichakis, N., Zhang, P. Y., 2019. Designing response supply chain against bioattacks. Operations Research, 67 (5), 1246–1268. https://doi.org/10.1287/opre.2019.1862
- Simon, B., 1992. A simple relationship between light and heavy traffic limits. Operations Research, 40 (Suppl. 2), S342–S345. https://doi.org/10.1287/opre.40.3.S342
- Simon, H. A., 1952. On the application of servomechanism theory in the study of production control. Econometrica, 20 (2), 247–268. https://doi.org/10.2307/1907849
- Simon, J. L., 1968. An almost practical solution to airline overbooking. Journal of Transport Economics and Policy, 2 (2), 201–202.
- Simoni, M. D., Kutanoglu, E., Claudel, C. G., 2020. Optimization and analysis of a robot-assisted last mile delivery system. Transportation Research Part E: Logistics and Transportation Review, 142, 102049. https://doi.org/10.1016/j.tre.2020.102049
- Simpson, V. P., 1978. Optimum solution structure for a repairable inventory problem. Operations Research, 26 (2), 270–281. https://doi.org/10.1287/opre.26.2.270
- Sims, C., 1980. Macroeconomics and reality. Econometrica, 48 (1), 1–48. https://doi.org/10.2307/1912017
- Sims, D., Smithin, T., 1982. Voluntary operational research. Journal of the Operational Research Society, 33 (1), 21–28. https://doi.org/10.2307/2581868
- Simul8 Corporation. 2022. Simul8. https://www.simul8.com/
- Skagerlund, K., Forsblad, M., Slovic, P., Västfjäll, D., 2020. The affect heuristic and risk perception – Stability across elicitation methods and individual cognitive abilities. Frontiers in Psychology, 11, 970. https://doi.org/10.3389/fpsyg.2020.00970
- Skorin-Kapov, D., Skorin-Kapov, J., Boljunčic, V., 2006. Location problems in telecommunications. In M. Resende & P. Pardalos (Eds.), Handbook of optimization in telecommunications (pp. 517–544). Springer.
- Slotine, J.-J. E., Li, W., et al., 1991. Applied nonlinear control (Vol. 199). Prentice Hall, Englewood Cliffs.
- Slovic, P., 2000. The perception of risk. Earthscan Publications.
- Sluijk, N., Florio, A. M., Kinable, J., Dellaert, N., Van Woensel, T., 2022a. A chance-constrained two-echelon vehicle routing problem with stochastic demands. Transportation Science. https://doi.org/10.1287/trsc.2022.1162
- Sluijk, N., Florio, A. M., Kinable, J., Dellaert, N., Van Woensel, T., 2022b. Two-echelon vehicle routing problems: A literature review. European Journal of Operational Research, 304 (3), 865–886. https://doi.org/10.1016/j.ejor.2022.02.022
- Smet, P., Brucker, P., De Causmaecker, P., Vanden Berghe, G., 2016. Polynomially solvable personnel rostering problems. European Journal of Operational Research, 249 (1), 67–75. https://doi.org/10.1016/j.ejor.2015.08.025
- Smidts, A., 1997. The relationship between risk attitude and strength of preference: A test of intrinsic risk attitude. Management Science, 43 (3), 357–370. https://doi.org/10.1287/mnsc.43.3.357
- Smith, C. M., Shaw, D., 2019. The characteristics of problem structuring methods: A literature review. European Journal of Operational Research, 274 (2), 403–416. https://doi.org/10.1016/j.ejor.2018.05.003
- Smits, M., 2010. Impact of policy and process design on the performance of intake and treatment processes in mental health care: A system dynamics case study. Journal of the Operational Research Society, 61 (10), 1437–1445. https://doi.org/10.1057/jors.2009.110
- Sniedovich, M., Viß, S., 2006. The corridor method: A dynamic programming inspired metaheuristic. Control and Cybernetics, 35 (3), 551–578.
- Snoeck, A., Merchán, D., Winkenbach, M., 2020. Revenue management in last-mile delivery: State-of-the-art and future research directions. Transportation Research Procedia, 46, 109–116. https://doi.org/10.1016/j.trpro.2020.03.170
- Snyder, L. V., Shen, Z.-J. M., 2019. Fundamentals of supply chain theory. John Wiley & Sons.
- Sobolev, B. G., Sanchez, V., Vasilakis, C., 2011. Systematic review of the use of computer simulation modeling of patient flow in surgical care. Journal of Medical Systems, 35 (1), 1–16. https://doi.org/10.1007/s10916-009-9336-z
- Soeffker, N., Ulmer, M., Mattfeld, D., 2022. Stochastic dynamic vehicle routing in the light of prescriptive analytics: A review. European Journal of Operational Research, 298 (3), 801–820. https://doi.org/10.1016/j.ejor.2021.07.014
- Solomon, S., Li, H., Womer, K., Santos, C., 2019. Multiperiod stochastic resource planning in professional services organizations. Decision Sciences, 50 (6), 1281–1318. https://doi.org/10.1111/deci.12370
- Solomon, S., Pannirselvam, G. P., Li, H., 2022. Using integrated simulation-optimisation to optimise staffing decisions in a service supply chain. International Journal of Integrated Supply Management, 15 (1), 1–26. https://doi.org/10.1504/IJISM.2022.119589
- Soltani, N., Lozano, S., 2020. Interactive multiobjective DEA target setting using lexicographic DDF. RAIRO - Operations Research, 54 (6), 1703–1722. https://doi.org/10.1051/ro/2019105
- Solyalı, O., Süral, H., 2022. An effective matheuristic for the multivehicle inventory routing problem. Transportation Science, 56, 1044–1057. https://doi.org/10.1287/trsc.2021.1123
- Song, E., Nelson, B. L., Pegden, C. D., 2014. Advanced tutorial: Input uncertainty quantification. In A. Tolk, A. Y. Diallo, I. O. Ryzhov, L. Yilmaz, S. Buckley, J. A. Miller (Eds.), Proceedings of the 2014 Winter Simulation Conference (pp. 162–176). IEEE Piscataway.
- Song, J.-S., 1994. The effect of leadtime uncertainty in a simple stochastic inventory model. Management Science, 40 (5), 603–613. https://doi.org/10.1287/mnsc.40.5.603
- Song, J.-S. (Ed.), 2023. Research handbook on inventory management. Edward Elgar Publishing.
- Song, J.-S., Xiao, L., Zhang, H., Zipkin, P., 2017. Optimal policies for a dual-sourcing inventory problem with endogenous stochastic lead times. Operations Research, 65 (2), 379–395. https://doi.org/10.1287/opre.2016.1557
- Song, J.-S., Zhang, Y., 2020. Stock or print? Impact of 3-D printing on spare parts logistics. Management Science, 66 (9), 3860–3878. https://doi.org/10.1287/mnsc.2019.3409
- Song, J.-S., Zipkin, P., 1993. Inventory control in a fluctuating demand environment. Operations Research, 41 (2), 351–370. https://doi.org/10.1287/opre.41.2.351
- Song, J.-S., Zipkin, P., 2003. Supply chain operations: Assemble-to-order systems. In , S. C. Graves & A. G. de Kok, (Eds.), Handbooks in operations research and management science (Vol. 11, pp. 561–596). Elsevier.
- Song, J.-S., Zipkin, P. H., 1996. Inventory control with information about supply conditions. Management Science, 42 (10), 1409–1419. https://doi.org/10.1287/mnsc.42.10.1409
- Sonnessa, M., Tànfani, E., Testi, A., 2017. An agent-based simulation model to evaluate alternative co-payment scenarios for contributing to health systems financing. Journal of the Operational Research Society, 68 (5), 591–604. https://doi.org/10.1057/s41274-016-0022-5
- Soorapanth, S., Eldabi, T., Young, T., 2022. Towards a framework for evaluating the costs and benefits of simulation modelling in healthcare. Journal of the Operational Research Society, https://doi.org/10.1080/01605682.2022.2064780
- Soyster, A. L., 1973. Convex programming with set-inclusive constraints and applications to inexact linear programming. Operations Research, 21 (5), 1154–1157. https://doi.org/10.1287/opre.21.5.1154
- Speranza, M. G., Ukovich, W., 1994. Minimizing transportation and inventory costs for several products on a single link. Operations Research, 42 (5), 879–894. https://doi.org/10.1287/opre.42.5.879
- Spliet, R., Dabia, S., Van Woensel, T., 2018. The time window assignment vehicle routing problem with time-dependent travel times. Transportation Science, 52 (2), 261–276. https://doi.org/10.1287/trsc.2016.0705
- Srinivasan, K., Satyajit, S., Behera, B. K., Panigrahi, P. K., 2018. Efficient quantum algorithm for solving travelling salesman problem: An IBM quantum experience. arXiv:1805.10928.
- Stadtler, H., 2003. Multilevel lot sizing with setup times and multiple constrained resources: Internally rolling schedules with lot-sizing windows. Operations Research, 51 (3), 487–502. https://doi.org/10.1287/opre.51.3.487.14949
- Starita, S., Strauss, A. K., Fei, X., Jovanović, R., Ivanov, N., Pavlović, G., Fichert, F., 2020. Air traffic control capacity planning under demand and capacity provision uncertainty. Transportation Science, 54 (4), 882–896. https://doi.org/10.1287/trsc.2019.0962
- Stecke, K. E., 1983. Formulation and solution of nonlinear integer production planning problems for flexible manufacturing systems. Management Science, 29 (3), 273–288. https://doi.org/10.1287/mnsc.29.3.273
- Stecke, K. E., Solberg, J. J., 1981. Loading and control policies for a flexible manufacturing system. International Journal of Production Research, 19 (5), 481–490. https://doi.org/10.1080/00207548108956679
- Stecke, K. E., Yin, Y., Kaku, I., Murase, Y., 2012. Seru: The organizational extension of JIT for a Super-Talent factory. International Journal of Strategic Decision Sciences, 3 (1), 106–119. https://doi.org/10.4018/jsds.2012010104
- Steinbach, M. C., 2001. Markowitz revisited: Mean-variance models in financial portfolio analysis. SIAM Review, 43 (1), 31–85. https://doi.org/10.1137/S0036144500376650
- Stephens, A., Lewis, E. D., Reddy, S. M., 2018. Inclusive systemic evaluation (ISE4GEMs): A new approach for the SDG Era. UN Women.
- Sterman, J. D., 1989. Modeling managerial behavior: Misperceptions of feedback in a dynamic decision making experiment. Management Science, 35 (3), 321–339. https://doi.org/10.1287/mnsc.35.3.321
- Sterman, J. D., 2000. Business dynamics: Systems thinking and modeling for a complex world. Irwin/McGraw-Hill.
- Sterman, J. D., 2014. Interactive web-based simulations for strategy and sustainability: The MIT sloan LearningEdge management flight simulators, Part I. System Dynamics Review, 30 (1-2), 89–121. https://doi.org/10.1002/sdr.1513
- Sterman, J. D., 2018. System dynamics at sixty: The path forward. System Dynamics Review, 34 (1–2), 5–47. https://doi.org/10.1002/sdr.1601
- Steuer, R., 1985. Multiple criteria optimization: Theory, computation and application. John Wiley & Sons, .
- Stewart, T. J., French, S., Rios, J., 2013. Integrating multicriteria decision analysis and scenario planning—Review and extension. Omega, 41 (4), 679–688. https://doi.org/10.1016/j.omega.2012.09.003
- Stidham, Jr, S., 2002. Analysis, design, and control of queueing systems. Operations Research, 50 (1), 197–216. https://doi.org/10.1287/opre.50.1.197.17783
- Stolyar, A. L., 2004. Maxweight scheduling in a generalized switch: State space collapse and workload minimization in heavy traffic. The Annals of Applied Probability, 14 (1), 1–53. https://doi.org/10.1214/aoap/1075828046
- Stoyan, Y., Pankratov, A., Romanova, T., 2016. Cutting and packing problems for irregular objects with continuous rotations: Mathematical modelling and non-linear optimization. Journal of the Operational Research Society, 67 (5), 786–800. https://doi.org/10.1057/jors.2015.94
- Strang, G., 1987. Karmarkar’s algorithm and its place in applied mathematics. The Mathematical Intelligencer, 9 (2), 4–10. https://doi.org/10.1007/BF03025891
- Strauss, A., Gülpınar, N., Zheng, Y., 2021. Dynamic pricing of flexible time slots for attended home delivery. European Journal of Operational Research, 294 (3), 1022–1041. https://doi.org/10.1016/j.ejor.2020.03.007
- Strauss, A. K., Klein, R., Steinhardt, C., 2018. A review of choice-based revenue management: Theory and methods. European Journal of Operational Research, 271 (2), 375–387. https://doi.org/10.1016/j.ejor.2018.01.011
- Street, R., Di Mauro, M., Humphrey, K., Johns, D., Boyd, E., Crawford-Brown, D., Evans, J., Kitchen, J., Hunt, A., Knox, K., Low, R., McCall, R., Watkiss, P., Wilby, R., 2016. UK climate change risk assessment evidence report: Chapter 8, Cross-cutting Issues. Report prepared for the Adaptation Sub-Committee of the Committee on Climate Change, London.
- Strogatz, S. H., 2018. Nonlinear dynamics and chaos: With applications to physics, biology, chemistry, and engineering. CRC Press.
- Strozzi, F., Colicchia, C., Creazza, A., Noè, C., 2017. Literature review on the ‘smart factory’ concept using bibliometric tools. International Journal of Production Research, 55 (22), 6572–6591. https://doi.org/10.1080/00207543.2017.1326643
- STT. 2021. ITC 2021: International timetabling competition on sports timetabling. Retrieved October 9, 2022. https://www.sportscheduling.ugent.be/ITC2021/.
- Su, X., 2007. Intertemporal pricing with strategic customer behavior. Management Science, 53 (5), 726–741. https://doi.org/10.1287/mnsc.1060.0667
- Subramanian, A., Uchoa, E., Ochi, L., 2013. A hybrid algorithm for a class of vehicle routing problems. Computers & Operations Research, 40 (10), 2519–2531. https://doi.org/10.1016/j.cor.2013.01.013
- Subramanian, R., Subramanyam, R., 2012. Key factors in the market for remanufactured products. Manufacturing & Service Operations Management, 14 (2), 315–326. https://doi.org/10.1287/msom.1110.0368
- Sueyoshi, T., Yuan, Y., Goto, M., 2017. A literature study for DEA applied to energy and environment. Energy Economics, 62 (1), 104–124. https://doi.org/10.1016/j.eneco.2016.11.006
- Sun, X. A., Conejo, A. J., 2021. Robust optimization in electric energy systems. Springer International Publishing.
- Sun, Y., Hassanlou, K., 2019. Equity trading server allocation using chance constrained programming. Journal of Supply Chain and Operations Management, 17 (1), 1–13.
- Sutton, R. S., Barto, A. G., 2018. Reinforcement learning: An introduction. MIT Press.
- Svetunkov, I., 2022. Smooth: Forecasting using state space models. R package version 3.1.6.
- Swamy, C., Kumar, A., 2004. Primal-dual algorithms for connected facility location problems. Algorithmica, 40, 245–269. https://doi.org/10.1007/s00453-004-1112-3
- Swan, J., Adriaensen, S., Brownlee, A. E., Hammond, K., Johnson, C. G., Kheiri, A., Krawiec, F., Merelo, J., Minku, L. L., Özcan, E., Pappa, G. L., García-Sánchez, P., Sörensen, K., Voß, S., Wagner, M., White, D. R., 2022. Metaheuristics “in the large”. European Journal of Operational Research, 297 (2), 393–406. https://doi.org/10.1016/j.ejor.2021.05.042
- Swaroop, P., Zou, B., Ball, M. O., Hansen, M., 2012. Do more us airports need slot controls? A welfare based approach to determine slot levels. Transportation Research Part B: Methodological, 46 (9), 1239–1259. https://doi.org/10.1016/j.trb.2012.03.002
- Sweeney, C., Bessa, R., Browell, J., Pinson, P., 2020. The future of forecasting for renewable energy. Wiley Interdisciplinary Reviews: Energy and Environment, 9 (2), e365.
- Sydelko, P., Espinosa, A., Midgley, G., 2023. Designing interagency responses to wicked problems: A viable system model board game. European Journal of Operational Research. https://doi.org/10.1016/j.ejor.2023.06.040
- Sydelko, P., Midgley, G., Espinosa, A., 2021. Designing interagency responses to wicked problems: Creating a common, cross-agency understanding. European Journal of Operational Research, 294 (1), 250–263. https://doi.org/10.1016/j.ejor.2020.11.045
- Szeider, S., 2003. On fixed-parameter tractable parameterizations of SAT. In Proceedings of the 6th International Conference on Theory and Applications of Satisfiability Testing (SAT) (Vol. 2919 of LNCS, pp. 188–202).
- Szeto, W. Y., Jiang, Y., 2014. Transit route and frequency design: Bi-level modeling and hybrid artificial bee colony algorithm approach. Transportation Research Part B: Methodological, 67, 235–263. https://doi.org/10.1016/j.trb.2014.05.008
- Taillandier, P., Gaudou, B., Grignard, A., Huynh, Q., Marilleau, N., Caillou, P., Philippon, D., Drogoul, A., 2019. Building, composing and experimenting complex spatial models with the GAMA platform. Geoinformatica, 23, 299–322. https://doi.org/10.1007/s10707-018-00339-6
- Takács, L., 1962. Introduction to the theory of queues. University texts in the mathematical sciences. Oxford University Press.
- Tako, A. A., 2015. Exploring the model development process in discrete-event simulation: Insights from six expert modellers. Journal of the Operational Research Society, 66 (5), 747–760. https://doi.org/10.1057/jors.2014.52
- Tako, A. A., Kotiadis, K., 2015. PartiSim: A multi-methodology framework to support facilitated simulation modelling in healthcare. European Journal of Operational Research, 244 (2), 555–564. https://doi.org/10.1016/j.ejor.2015.01.046
- Tako, A. A., Robinson, S., 2010. Model development in discrete-event simulation and system dynamics: An empirical study of expert modellers. European Journal of Operational Research, 207 (2), 784–794. https://doi.org/10.1016/j.ejor.2010.05.011
- Talluri, K., Van Ryzin, G., 1999. A randomized linear programming method for computing network bid prices. Transportation Science, 33 (2), 207–216. https://doi.org/10.1287/trsc.33.2.207
- Talluri, K., Van Ryzin, G., 2004a. Revenue management under a general discrete choice model of consumer behavior. Management Science, 50 (1), 15–33. https://doi.org/10.1287/mnsc.1030.0147
- Talluri, K., Van Ryzin, G., 2004b. The theory and practice of revenue management. In International series in operations research & management science. Springer.
- Talmar, M., Walrave, B., Podoynitsyna, K. S., Holmström, J., Romme, A. G. L., 2020. Mapping, analyzing and designing innovation ecosystems: The ecosystem pie model. Long Range Planning, 53 (4), 101850. https://doi.org/10.1016/j.lrp.2018.09.002
- Tan, J. S., Goh, S. L., Kendall, G., Sabar, N. R., 2021. A survey of the state-of-the-art of optimisation methodologies in school timetabling problems. Expert Systems with Applications, 165, 113943. https://doi.org/10.1016/j.eswa.2020.113943
- Tang, C. S., Veelenturf, L. P., 2019. The strategic role of logistics in the industry 4.0 era. Transportation Research Part E: Logistics and Transportation Review, 129, 1–11. https://doi.org/10.1016/j.tre.2019.06.004
- Tarhan, İ., Oğuz, C., 2022. A matheuristic for the generalized order acceptance and scheduling problem. European Journal of Operational Research, 299 (1), 87–103. https://doi.org/10.1016/j.ejor.2021.08.024
- Tashman, L. J., 2000. Out-of-sample tests of forecasting accuracy: An analysis and review. International Journal of Forecasting, 16 (4), 437–450. https://doi.org/10.1016/S0169-2070(00)00065-0
- Tavella, E., Papadopoulos, T., Paroutis, S., 2021. Artefact appropriation in facilitated modelling: An adaptive structuration theory approach. Journal of the Operational Research Society, 72 (11), 2381–2395. https://doi.org/10.1080/01605682.2020.1790308
- Tena, J. d. D., Forrest, D., 2007. Within-season dismissal of football coaches: Statistical analysis of causes and consequences. European Journal of Operational Researchh, 181 (1), 362–373. https://doi.org/10.1016/j.ejor.2006.05.024
- Teng, Y., Zhang, J., Sun, T., 2022. Data-driven decision-making model based on artificial intelligence in higher education system of colleges and universities. Expert Systems, e12820, https://doi.org/10.1111/exsy.12820
- Terrab, M., Odoni, A. R., 1993. Strategic flow management for air traffic control. Operations Research, 41 (1), 138–152. https://doi.org/10.1287/opre.41.1.138
- Teunter, R., van der Laan, E., Vlachos, D., 2004. Inventory strategies for systems with fast remanufacturing. Journal of the Operational Research Society, 55 (5), 475–484. https://doi.org/10.1057/palgrave.jors.2601687
- Thanassoulis, E., De Witte, K., Johnes, J., Johnes, G., Karagiannis, G., Portela, C. S., 2016. Applications of data envelopment analysis in education. In J. Zhu (Ed.), Data envelopment analysis: A handbook of empirical studies and applications (pp. 367–438). Springer US.
- Thanassoulis, E., Kortelainen, M., Johnes, G., Johnes, J., 2011. Costs and efficiency of higher education institutions in England: A DEA analysis. Journal of the Operational Research Society, 62 (7), 1282–1297. https://doi.org/10.1057/jors.2010.68
- The AnyLogic Company. 2022. AnyLogistix supply chain software. https://www.anylogistix.com/
- Theorin, A., Bengtsson, K., Provost, J., Lieder, M., Johnsson, C., Lundholm, T., Lennartson, B., 2017. An event-driven manufacturing information system architecture for industry 4.0. International Journal of Production Research, 55 (5), 1297–1311. https://doi.org/10.1080/00207543.2016.1201604
- Thies, C., Kieckhäfer, K., Spengler, T. S., Sodhi, M. S., 2019. Operations research for sustainability assessment of products: A review. European Journal of Operational Research, 274 (1), 1–21. https://doi.org/10.1016/j.ejor.2018.04.039
- Thoben, K.-D., Wiesner, S., Wuest, T., 2017. “Industrie 4.0” and smart manufacturing – A review of research issues and application examples. International Journal of Automation Technology, 11 (1), 4–16. https://doi.org/10.20965/ijat.2017.p0004
- Thompson, W., 1994. Cooperative models of bargaining. In R. J. Aumann, S. Hart (Eds.), Handbook of game theory (Vol. 2, pp. 1237–1284). North-Holland.
- Thunhurst, C., 1992. Operational research: A role in strengthening community participation? Journal of Management in Medicine 6 (4), 56–71. https://doi.org/10.1108/02689239210021979
- Tijms, H. C., 1994. Stochastic models: An algorithmic approach (Vol. 303). Wiley.
- Tine, G. C., 2005. Berlin airlift: Logistics, humanitarian aid, and strategic success. Army Logistician, 37 (5), 39–41.
- Tippong, D., Petrovic, S., Akbari, V., 2022. A review of applications of operational research in healthcare coordination in disaster management. European Journal of Operational Research, 301 (1), 1–17. https://doi.org/10.1016/j.ejor.2021.10.048
- Todd, M. J., 1988. Improved bounds and containing ellipsoids in Karmarkar’s linear programming algorithm. Mathematics of Operations Research, 13 (4), 650–659. https://doi.org/10.1287/moor.13.4.650
- Toffolo, T. A. M., Wauters, T., Trick, M., 2015. An automated benchmark website for the traveling umpire problem. http://gent.cs.kuleuven.be/tup
- Tohidi, G., Razavyan, S., Tohidnia, S., 2012. A global cost Malmquist productivity index using data envelopment analysis. Journal of the Operational Research Society, 63 (1), 72–78. https://doi.org/10.1057/jors.2011.23
- Toktay, L. B., Wein, L. M., Zenios, S. A., 2000. Inventory management of remanufacturable products. Management Science, 46 (11), 1412–1426. https://doi.org/10.1287/mnsc.46.11.1412.12082
- Toledo, F. M. B., Carravilla, M. A., Ribeiro, C., Oliveira, J. F., Gomes, A. M., 2013. The Dotted-Board model: A new MIP model for nesting irregular shapes. International Journal of Production Economics, 145 (2), 478–487. https://doi.org/10.1016/j.ijpe.2013.04.009
- Tolk, A., 2012. Engineering principles of combat modeling and distributed simulation. Wiley.
- Tolstoı, A. N., 1930. Metody nakhozhdeniya naimen’shego summovogo kilometrazha pri planirovanii perevozok v prostranstve (pp. 23–55). Planirovanie Perevozok, Sbornik pervyı, Transpechat’NKPS.
- Tolwinski, B. A. H., Leitmann, G., 1986. Cooperative equilibria in differential games. Journal of Mathematical Analysis and Applications, 119, 182–202. https://doi.org/10.1016/0022-247X(86)90152-6
- Tompkins, J., White, J., Bozer, Y., Tanchoco, J., 2010. Facilities planning. Wiley.
- Tone, K., 2002. A slacks-based measure of super-efficiency in data envelopment analysis. European Journal of Operational Research, 143 (1), 32–41. https://doi.org/10.1016/S0377-2217(01)00324-1
- Tone, K., Tsutsui, M., 2009. Network DEA: A slacks-based measure approach. European Journal of Operational Research, 197 (1), 243–252. https://doi.org/10.1016/j.ejor.2008.05.027
- Tone, K., Tsutsui, M., 2010. Dynamic DEA: A slacks-based measure approach. Omega, 38 (3), 145–156. https://doi.org/10.1016/j.omega.2009.07.003
- Tone, K., Tsutsui, M., 2014. Dynamic DEA with network structure: A slacks-based measure approach. Omega, 42 (1), 124–131. https://doi.org/10.1016/j.omega.2013.04.002
- Topaloglu, H., Powell, W. B., 2006. Dynamic-programming approximations for stochastic time-staged integer multicommodity-flow problems. INFORMS Journal on Computing, 18 (1), 31–42. https://doi.org/10.1287/ijoc.1040.0079
- Torres, J. P., Kunc, M., O’Brien, F., 2017. Supporting strategy using system dynamics. European Journal of Operational Research, 260 (3), 1081–1094. https://doi.org/10.1016/j.ejor.2017.01.018
- Toth, P., Vigo, D. (Eds.), 2002. The vehicle routing problem. In SIAM monographs on discrete mathematics and applications.
- Toth, P., Vigo, D. (Eds.), 2014. Vehicle routing: Problems, methods, and applications. SIAM.
- Towill, D. R., 1970. Transfer function techniques for control engineers. Iliffe.
- Towill, D. R., 1982. Dynamic analysis of an inventory and order based production control system. International Journal of Production Research, 20 (6), 671–687. https://doi.org/10.1080/00207548208947797
- Traub, V., 2020. Approximation algorithms for traveling salesman problems [Ph.D. thesis]. Universitäts-und Landesbibliothek Bonn.
- Trick, M., 2001. Challenge traveling tournament instances. https://mat.tepper.cmu.edu/TOURN/
- Trick, M. A., Yildiz, H., Yunes, T., 2012. Scheduling major league baseball umpires and the traveling umpire problem. Interfaces, 42 (3), 232–244. https://doi.org/10.1287/inte.1100.0514
- Trigeorgis, L., 1996. Real options: Managerial flexibility and strategy in resource allocation. MIT Press.
- Trigeorgis, L., Tsekrekos, A. E., 2018. Real options in operations research: A review. European Journal of Operational Research, 270 (1), 1–24. https://doi.org/10.1016/j.ejor.2017.11.055
- Trkman, P., McCormack, K., de Oliveira, M. P. V., Ladeira, M. B., 2010. The impact of business analytics on supply chain performance. Decision Support Systems, 49 (3), 318–327. https://doi.org/10.1016/j.dss.2010.03.007
- Trudeau, P., Dror, M., 1992. Stochastic inventory routing: Route design with stockouts and route failures. Transportation Science, 26 (3), 171–184. https://doi.org/10.1287/trsc.26.3.171
- Tsai, Y.-W., D. Gemmill, D., 1998. Using tabu search to schedule activities of stochastic resource-constrained projects. European Journal of Operational Research, 111 (1), 129–141. https://doi.org/10.1016/S0377-2217(97)00311-1
- Tsoukias, A., 2021. Social responsibility of algorithms: An overview. In J. Papathanasiou, P. Zaraté, J. Freire de Sousa (Eds.), EURO working group on DSS: A Tour OF THE DSS developments over the last 30 years (pp. 153–166). Springer.
- Tufte, E. R., 2001. The visual display of quantitative information. Graphics Press.
- Tully, P., White, L., Yearworth, M., 2019. The value paradox of problem structuring methods. Systems Research and Behavioral Science, 36 (4), 424–444. https://doi.org/10.1002/sres.2557
- Turnitsa, C., Blais, C., Tolk, A., 2021. Simulation and wargaming. Wiley.
- Tustin, A., 1953. The mechanism of economic systems: An approach to the problem of economic stabilization from the point of view of control-system engineering. Harvard University.
- Tversky, A., Kahneman, D., 1974. Judgment under uncertainty: Heuristics and biases: Biases in judgments reveal some heuristics of thinking under uncertainty. Science, 185 (4157), 1124–1131. https://doi.org/10.1126/science.185.4157.1124
- Uchoa, E., Pecin, D., Pessoa, A., Poggi, M., Vidal, T., Subramanian, A., 2017. New benchmark instances for the capacitated vehicle routing problem. European Journal of Operational Research, 257 (3), 845–858. https://doi.org/10.1016/j.ejor.2016.08.012
- Ulmer, M. W., 2020. Dynamic pricing and routing for same-day delivery. Transportation Science, 54 (4), 1016–1033. https://doi.org/10.1287/trsc.2019.0958
- Ulmer, M. W., Thomas, B. W., 2018. Same-day delivery with heterogeneous fleets of drones and vehicles. Networks, 72 (4), 475–505. https://doi.org/10.1002/net.21855
- Ulrich, M., Jahnke, H., Langrock, R., Pesch, R., Senge, R., 2021. Distributional regression for demand forecasting in e-grocery. European Journal of Operational Research, 294 (3), 831–842. https://doi.org/10.1016/j.ejor.2019.11.029
- Ulrich, W., 1983. Critical heuristics of social planning. Wiley.
- Ulrich, W., 1987. Critical heuristics of social systems design. European Journal of Operational Research, 31 (3), 276–283. https://doi.org/10.1016/0377-2217(87)90036-1
- Ulrich, W., 1994. Critical heuristics of social planning: A new approach to practical philosophy. Wiley.
- UNCTAD. 2022. Review of maritime transport 2022. Tech. rep., United Nations Conference on Trade and Development.
- Uniejewski, B., Nowotarski, J., Weron, R., 2016. Automated variable selection and shrinkage for day-ahead electricity price forecasting. Energies, 9 (8), 621. https://doi.org/10.3390/en9080621
- Utley, M., Crowe, S., Pagel, C., 2022. Operational research approaches. Elements of improving quality and safety in healthcare. Cambridge University Press.
- Utomo, D. S., Onggo, B. S., Eldridge, S., 2018. Applications of agent-based modelling and simulation in the agri-food supply chains. European Journal of Operational Research, 269 (3), 794–805. https://doi.org/10.1016/j.ejor.2017.10.041
- Vahdati Daneshmand, S., 2003. Algorithmic approaches to the Steiner problem in networks [Ph.D. thesis]. University of Mannheim, Germany.
- Valero-Carreras, D., Aparicio, J., Guerrero, N. M., 2022. Multi-output support vector frontiers. Computers & Operations Research, 143, 105765. https://doi.org/10.1016/j.cor.2022.105765
- Valladares, L., Nino, V., Martínez, K., Sobek, D., Claudio, D., Moyce, S., 2022. Optimizing patient flow, capacity, and performance of COVID-19 vaccination clinics. IISE Transactions on Healthcare Systems Engineering, 1–13. https://doi.org/10.1080/24725579.2022.2066740
- Van Bulck, D., Goossens, D., Beliën, J., Davari, M., 2021. The fifth international timetabling competition (ITC 2021): Sports timetabling. In Proceedings of MathSport International. University of Reading (pp. 117–122).
- Van de Ven, A., Delbeco, A. L., 1971. Nominal versus interacting group processes for committee decision-making effectiveness. Academy of Management Journal, 14 (2), 203–212. https://doi.org/10.5465/255307
- Van de Ven, A. H., Poole, M. S., 2005. Alternative approaches for studying organizational change. Organization Studies, 26 (9), 1377–1404. https://doi.org/10.1177/0170840605056907
- Van de Vonder, S., Demeulemeester, E., Herroelen, W., 2008. Proactive heuristic procedures for robust project scheduling: An experimental analysis. European Journal of Operational Research, 189 (3), 723–733. https://doi.org/10.1016/j.ejor.2006.10.061
- van der Hagen, L., Agatz, N., Spliet, R., Visser, T. R., Kok, A. L., 2022. Machine learning-based feasability checks for dynamic time slot management. SSRN Electronic Journal, 4011237. https://doi.org/10.2139/ssrn.4011237
- van der Laan, E., Salomon, M., Dekker, R., Van Wassenhove, L., 1999. Inventory control in hybrid systems with remanufacturing. Management Science, 45 (5), 733–747. https://doi.org/10.1287/mnsc.45.5.733
- Van Engeland, J., Beliën, J., De Boeck, L., De Jaeger, S., 2020. Literature review: Strategic network optimization models in waste reverse supply chains. Omega, 91, 102012. https://doi.org/10.1016/j.omega.2018.12.001
- van Leeuwaarden, J. S., Mathijsen, B. W., Zwart, B., 2019. Economies-of-scale in many-server queueing systems: Tutorial and partial review of the QED Halfin–Whitt heavy-traffic regime. SIAM Review, 61 (3), 403–440. https://doi.org/10.1137/17M1133944
- Van Roy, T., Wolsey, L., 1986. Valid inequalities for mixed 0–1 programs. Discrete Applied Mathematics, 14, 199–213. https://doi.org/10.1016/0166-218X(86)90061-2
- Van Roy, T., Wolsey, L., 1987. Solving mixed integer programming problems using automatic reformulation. Operations Research, 35, 45–57. https://doi.org/10.1287/opre.35.1.45
- Van Ryzin, G., McGill, J., 2000. Revenue management without forecasting or optimization: An adaptive algorithm for determining airline seat protection levels. Management Science, 46 (6), 760–775. https://doi.org/10.1287/mnsc.46.6.760.11936
- Van Slyke, R. M., Wets, R., 1969. L-Shaped linear programs with applications to optimal control and stochastic programming. SIAM Journal on Applied Mathematics, 17 (4), 638–663. https://doi.org/10.1137/0117061
- Vanhoucke, M., 2018. Planning projects with scarce resources: Yesterday, today and tomorrow’s research challenges. Frontiers of Engineering Management, 5 (2), 133–149.
- Vanhoucke, M., Demeulemeester, E., Herroelen, W., 2001a. An exact procedure for the resource-constrained weighted earliness–tardiness project scheduling problem. Annals of Operations Research, 102 (1), 179–196.
- Vanhoucke, M., Demeulemeester, E., Herroelen, W., 2001b. Maximizing the net present value of a project with linear time-dependent cash flows. International Journal of Production Research, 39 (14), 3159–3181. https://doi.org/10.1080/00207540110056919
- Vanhoucke, M., Demeulemeester, E., Herroelen, W., 2001c. On maximizing the net present value of a project under renewable resource constraints. Management Science, 47 (8), 1113–1121. https://doi.org/10.1287/mnsc.47.8.1113.10226
- Vasilakis, C., Pagel, C., Gallivan, S., Richards, D., Weaver, A., Utley, M., 2013. Modelling toolkit to assist with introducing a stepped care system design in mental health care. Journal of the Operational Research Society, 64 (7), 1049–1059. https://doi.org/10.1057/jors.2012.98
- Vassian, H. J., 1955. Application of discrete variable servo theory to inventory control. Journal of the Operations Research Society of America, 3 (3), 272–282. https://doi.org/10.1287/opre.3.3.272
- Vaswani, A., Shazeer, N., Parmar, N., Uszkoreit, J., Jones, L., Gomez, A. N., Kaiser, L. u., Polosukhin, I., 2017. Attention is all you need. In I. Guyon, U. V. Luxburg, S. Bengio, H. Wallach, R. Fergus, S. Vishwanathan, R. Garnett (Eds.), Advances in neural information processing systems (Vol. 30, pp. 1–11). Curran Associates, Inc.
- Vazirani, V. V., 2001. Approximation algorithms. Springer.
- Vedantam, A., Iyer, A., 2021. Revenue-sharing contracts under quality uncertainty in remanufacturing. Production and Operations Management, 30 (7), 2008–2026. https://doi.org/10.1111/poms.13370
- Veinott Jr, A. F., 1965. Optimal policy for a multi-product, dynamic, nonstationary inventory problem. Management Science, 12 (3), 206–222. https://doi.org/10.1287/mnsc.12.3.206
- Veinott Jr, A. F., 1966. The status of mathematical inventory theory. Management Science, 12 (11), 745–777. https://doi.org/10.1287/mnsc.12.11.745
- Velez-Castiblanco, J., Brocklesby, J., Midgley, G., 2016. Boundary games: How teams of OR practitioners explore the boundaries of intervention. European Journal of Operational Research, 249 (3), 968–982. https://doi.org/10.1016/j.ejor.2015.08.006
- Vennix, J. A. M., Vennix, J., 1996. Group model building: Facilitating team learning using system dynamics. Wiley.
- Ventana Systems Inc. 2022. Vensim. https://vensim.com/
- Ventosa, M., Baillo, A., Ramos, A., Rivier, M., 2005. Electricity market modeling trends. Energy Policy, 33 (7), 897–913. https://doi.org/10.1016/j.enpol.2003.10.013
- Verloop, I. M., Ayesta, U., Borst, S., 2010. Monotonicity properties for multi-class queueing systems. Discrete Event Dynamic Systems, 20, 473–509. https://doi.org/10.1007/s10626-009-0069-4
- Verma, S., Rubin, J., 2018. Fairness definitions explained. In Proceedings of the International Workshop on Software Fairness (FairWare) (pp. 1–7). https://doi.org/10.1145/3194770.3194776
- Verstegen, D. A., 1996. Concepts and measures of fiscal inequality: A new approach and effects for five states. Journal of Education Finance, 22, 145–160.
- Vidal, T., 2022a. Github webpage. https://github.com/vidalt/, accessed on 2022-09-16.
- Vidal, T., 2022b. Hybrid genetic search for the CVRP: Open-source implementation and SWAP* neighborhood. Computers & Operations Research, 140, 105643. https://doi.org/10.1016/j.cor.2021.105643
- Vidal, T., Crainic, T., Gendreau, M., Prins, C., 2013. Heuristics for multi-attribute vehicle routing problems: A survey and synthesis. European Journal of Operational Research, 231 (1), 1–21. https://doi.org/10.1016/j.ejor.2013.02.053
- Vidal, T., Laporte, G., Matl, P., 2020. A concise guide to existing and emerging vehicle routing problem variants. European Journal of Operational Research, 286, 401–416. https://doi.org/10.1016/j.ejor.2019.10.010
- Vidgen, R., Hindle, G., Randolph, I., 2020. Exploring the ethical implications of business analytics with a business ethics canvas. European Journal of Operational Research, 281 (3), 491–501. https://doi.org/10.1016/j.ejor.2019.04.036
- Vidgen, R., Shaw, S., Grant, D. B., 2017. Management challenges in creating value from business analytics. European Journal of Operational Research, 261 (2), 626–639. https://doi.org/10.1016/j.ejor.2017.02.023
- Virtanen, K., Mansikka, H., Kontio, H., Harris, D., 2022. Weight watchers: NASA-TLX weights revisited. Theoretical Issues in Ergonomics Science, 23 (6), 725–748. https://doi.org/10.1080/1463922X.2021.2000667
- Virtanen, K., Raivio, T., Hämäläinen, R. P., 2004. Modeling pilot’s sequential maneuvering decisions by a multistage influence diagram. Journal of Guidance, Control, and Dynamics, 27 (4), 665–677. https://doi.org/10.2514/1.11167
- von Bertalanffy, L., 1968. General system theory: Foundations, development, applications. G. Braziller.
- von Neumann, J., 1945. A model of general economic equilibrium. The Review of Economic Studies, 13 (1), 1–9. https://doi.org/10.2307/2296111
- von Neumann, J., Morgenstern, O., 1944. Theory of games and economic behavior (2nd ed.). Princeton University Press.
- von Nitzsch, R., Weber, M., 1993. The effect of attribute ranges on weights in multiattribute utility measurements. Management Science, 39 (8), 937–943. https://doi.org/10.1287/mnsc.39.8.937
- von Stackelberg, H., 1934. Marktform und gleichgewicht. Springer Verlag.
- Vossen, T. W., Ball, M. O., 2006. Slot trading opportunities in collaborative ground delay programs. Transportation Science, 40 (1), 29–43. https://doi.org/10.1287/trsc.1050.0121
- Vranas, P. B., Bertsimas, D. J., Odoni, A. R., 1994. The multi-airport ground-holding problem in air traffic control. Operations Research, 42 (2), 249–261. https://doi.org/10.1287/opre.42.2.249
- Vygen, J., 2002. On dual minimum cost flow algorithms. Mathematical Methods of Operations Research, 56 (1), 101–126. https://doi.org/10.1007/s001860200202
- Wächter, A., Biegler, L., 2006. On the implementation of a primal-dual interior point filter line search algorithm for large-scale nonlinear programming. Mathematical Programming, 1, 25–57. https://doi.org/10.1007/s10107-004-0559-y
- Wagner, H. M., Whitin, T. M., 1958. Dynamic version of the economic lot size model. Management Science, 5 (1), 89–96. https://doi.org/10.1287/mnsc.5.1.89
- Wagner, M. R., Radovilsky, Z., 2012. Optimizing boat resources at the U.S. coast guard: Deterministic and stochastic models. Operations Research, 60 (5), 1035–1049. https://doi.org/10.1287/opre.1120.1085
- Waisel, L. B., Wallace, W. A., Willemain, T. R., 2008. Visualization and model formulation: An analysis of the sketches of expert modellers. Journal of the Operational Research Society, 59 (3), 353–361. https://doi.org/10.1057/palgrave.jors.2602331
- Wallace, S. W., Ziemba, W. T., 2005. Applications of stochastic programming. SIAM.
- Walling, E., Vaneeckhaute, C., 2020. Developing successful environmental decision support systems: Challenges and best practices. Journal of Environmental Management, 264, 110513. https://doi.org/10.1016/j.jenvman.2020.110513
- Wang, C. N., Dang, T. T., Nguyen, N. A. T., Wang, J. W., 2022a. A combined data envelopment analysis (DEA) and grey based multiple criteria decision making (G-MCDM) for solar PV power plants site selection: A case study in Vietnam. Energy Reports, 8 (1), 1124–1142. https://doi.org/10.1016/j.egyr.2021.12.045
- Wang, H.-Z., Li, G.-Q., Wang, G.-B., Peng, J.-C., Jiang, H., Liu, Y.-T., 2017. Deep learning based ensemble approach for probabilistic wind power forecasting. Applied Energy, 188, 56–70. https://doi.org/10.1016/j.apenergy.2016.11.111
- Wang, J., Zhao, L., Huchzermeier, A., 2021. Operations-finance interface in risk management: Research evolution and opportunities. Production and Operations Management, 30 (2), 355–389. https://doi.org/10.1111/poms.13269
- Wang, K., Jacquillat, A., 2020. A stochastic integer programming approach to air traffic scheduling and operations. Operations Research, 68 (5), 1375–1402. https://doi.org/10.1287/opre.2020.1985
- Wang, K., Jacquillat, A., Vaze, V., 2022b. Vertiport planning for urban aerial mobility: An adaptive discretization approach. Manufacturing & Service Operations Management, 24 (6), 3215–3235. https://doi.org/10.1287/msom.2022.1148
- Wang, K., Xian, Y., Lee, C.-Y., Wei, Y.-M., Huang, Z., 2019a. On selecting directions for directional distance functions in a non-parametric framework: A review. Annals of Operations Research, 278 (1), 43–76. https://doi.org/10.1007/s10479-017-2423-5
- Wang, Q., Wu, Z., Chen, X., 2019b. Decomposition weights and overall efficiency in a two-stage DEA model with shared resources. Computers & Industrial Engineering, 136, 135–148. https://doi.org/10.1016/j.cie.2019.07.014
- Wang, X., Disney, S. M., 2016. The bullwhip effect: Progress, trends and directions. European Journal of Operational Research, 250 (3), 691–701. https://doi.org/10.1016/j.ejor.2015.07.022
- Wang, X., Hyndman, R. J., Li, F., Kang, Y., 2022c. Forecast combinations: An over 50-year review. arXiv:2205.04216.
- Wang, X., Kang, Y., Petropoulos, F., Li, F., 2022d. The uncertainty estimation of feature-based forecast combinations. Journal of the Operational Research Society, 73 (5), 979–993. https://doi.org/10.1080/01605682.2021.1880297
- Wang, X. j., Curry, D. J., 2012. A robust approach to the share-of-choice product design problem. Omega, 40 (6), 818–826. https://doi.org/10.1016/j.omega.2012.01.004
- Wang, Y., 2021. An improved machine learning and artificial intelligence algorithm for classroom management of English distance education. Journal of Intelligent & Fuzzy Systems, 40 (2), 3477–3488. https://doi.org/10.3233/JIFS-189385
- Wang, Y., Bi, M., Lai, J., Chen, Y., 2020. Locating movable parcel lockers under stochastic demands. Symmetry, 12 (12), 2033. https://doi.org/10.3390/sym12122033
- Wang, Y.-J., Kuo, Y.-H., Huang, G. Q., Gu, W., Hu, Y., 2022e. Dynamic demand-driven bike station clustering. Transportation Research Part E: Logistics and Transportation Review, 160, 102656. https://doi.org/10.1016/j.tre.2022.102656
- Ware, C., 2020. Information visualization: perception for design (interactive technologies) (4th ed.). Morgan Kaufmann.
- Warfield, J. N., 1994. A science of generic design: Managing complexity through systems design. Iowa State University Press.
- Wäscher, G., Haußner, H., Schumann, H., 2007. An improved typology of cutting and packing problems. European Journal of Operational Research, 183 (3), 1109–1130. https://doi.org/10.1016/j.ejor.2005.12.047
- Waßmuth, K., Köhler, C., Agatz, N., Fleischmann, M., 2022. Demand management for attended home delivery–A literature review. ERIM Report Series ERS-2022-002-LIS.
- Watson, N., Hendricks, S., Stewart, T., Durbach, I., 2021. Integrating machine learning and decision support in tactical decision-making in rugby union. Journal of the Operational Research Society, 72 (10), 2274–2285. https://doi.org/10.1080/01605682.2020.1779624
- Wei, K., Vaze, V., 2018. Modeling crew itineraries and delays in the national air transportation system. Transportation Science, 52 (5), 1276–1296. https://doi.org/10.1287/trsc.2018.0834
- Wei, K., Vaze, V., Jacquillat, A., 2020. Airline timetable development and fleet assignment incorporating passenger choice. Transportation Science, 54 (1), 139–163. https://doi.org/10.1287/trsc.2019.0924
- Weintraub, A., Romero, C., Miranda, J. P., Epstein, R., Bjørndal, T., 2007. Handbook of operations research in natural resources. Springer.
- Wen, M., Pacino, D., Kontovas, C. A., Psaraftis, H. N., 2017. A multiple ship routing and speed optimization problem under time, cost and environmental objectives. Transportation Research Part D: Transport and Environment, 52, 303–321. https://doi.org/10.1016/j.trd.2017.03.009
- Weron, R., 2014. Electricity price forecasting: A review of the state-of-the-art with a look into the future. International Journal of Forecasting, 30 (4), 1030–1081. https://doi.org/10.1016/j.ijforecast.2014.08.008
- Westcombe, M., Franco, L. A., Shaw, D., 2006. Where next for PSMs—A grassroots revolution? Journal of the Operational Research Society, 57 (7), 776–778. https://doi.org/10.1057/palgrave.jors.2602161
- White, L., 2002. Size matters: Large group methods and the process of operational research. Journal of the Operational Research Society, 53 (2), 149–160. https://doi.org/10.1057/palgrave.jors.2601298
- White, L., 2006. Evaluating problem-structuring methods: Developing an approach to show the value and effectiveness of PSMs. Journal of the Operational Research Society, 57 (7), 842–855. https://doi.org/10.1057/palgrave.jors.2602149
- White, L., 2009. Understanding problem structuring methods interventions. European Journal of Operational Research, 199 (3), 823–833. https://doi.org/10.1016/j.ejor.2009.01.066
- White, L., 2016. Behavioural operational research: Towards a framework for understanding behaviour in OR interventions. European Journal of Operational Research, 249 (3), 827–841. https://doi.org/10.1016/j.ejor.2015.07.032
- White, L., 2018. A Cook’s tour: Towards a framework for measuring the social impact of social purpose organisations. European Journal of Operational Research, 268 (3), 784–797. https://doi.org/10.1016/j.ejor.2017.06.015
- White, L., Burger, K., Yearworth, M., 2016. Understanding behaviour in problem structuring methods interventions with activity theory. European Journal of Operational Research, 249 (3), 983–1004. https://doi.org/10.1016/j.ejor.2015.07.044
- White, L., Kunc, M., Burger, K., Malpass, J., 2020. Behavioral operational research: A capabilities approach. Palgrave Macmillan.
- White, L., Lee, G. J., 2009. Operational research and sustainable development: Tackling the social dimension. European Journal of Operational Research, 193 (3), 683–692. https://doi.org/10.1016/j.ejor.2007.06.057
- Whitt, W., 1982. On the heavy-traffic limit theorem for GI/G/∞ queues. Advances in Applied Probability, 14 (1), 171–190.
- Whitt, W., 1991. A review of L=λW and extensions. Queueing Systems, 9 (3), 235–268.
- Whitt, W., 2002. Stochastic-process limits: An introduction to stochastic-process limits and their application to queues. Space, 500, 391–426.
- Whitt, W., 2018. Time-varying queues. Queueing Models and Service Management, 1 (2), 79–164.
- Whittle, P., 1988. Restless bandits: Activity allocation in a changing world. Journal of Applied Probability, 25 (A), 287–298. https://doi.org/10.2307/3214163
- Wickramasuriya, S. L., Athanasopoulos, G., Hyndman, R. J., 2019. Optimal forecast reconciliation for hierarchical and grouped time series through trace minimization. Journal of the American Statistical Association, 114 (526), 804–19. https://doi.org/10.1080/01621459.2018.1448825
- Wilensky, U., 1999. NetLogo. https://github.com/NetLogo/NetLogo
- Willemain, T. R., 1995. Model formulation: What experts think about and when. Operations Research, 43 (6), 916–932. https://doi.org/10.1287/opre.43.6.916
- Willemain, T. R., Powell, S. G., 2007. How novices formulate models. Part II: A quantitative description of behaviour. Journal of the Operational Research Society, 58 (10), 1271–1283. https://doi.org/10.1057/palgrave.jors.2602279
- Williams, A., Cookson, R., 2000. Equity in health. In A. Culyer & J. Newhouse (Eds.), Handbook of health economics (pp. 1863–1910). Elsevier.
- Williamson, D. P., 2019. Network flow algorithms. Cambridge University Press.
- Williamson, D. P., Shmoys, D. B., 2011. The design of approximation algorithms. Cambridge University Press.
- Wilson, R., 1934. A scientific routine for stock control. Harvard Business Review, 13, 116–128.
- Wilson, R., 1998. Sequential equilibria of asymmetric ascending auctions: The case of log-normal distributions. Economic Theory, 12, 433–440. https://doi.org/10.1007/s001990050229
- Winkenbach, M., Roset, A., Spinler, S., 2016. Strategic redesign of urban mail and parcel networks at la poste. Interfaces, 46 (5), 445–458. https://doi.org/10.1287/inte.2016.0854
- Winston, W. L., Venkataramanan, M., 2003. Introduction to mathematical programming. Operations research (4th ed., Vol. 1). Brooks/Cole – Thomson Learning, Pacific Grove.
- Winter, P., 1987. Steiner problem in networks: A survey. Networks, 17 (2), 129–167. https://doi.org/10.1002/net.3230170203
- Winters, P. R., 1960. Forecasting sales by exponentially weighted moving averages. Management Science, 6, 324–342. https://doi.org/10.1287/mnsc.6.3.324
- Woeginger, G. J., 2000. When does a dynamic programming formulation guarantee the existence of a fully polynomial time approximation scheme (FPTAS)? INFORMS Journal on Computing, 12 (1), 57–74. https://doi.org/10.1287/ijoc.12.1.57.11901
- Woeginger, G. J., 2021. The trouble with the second quantifier. 4OR - A Quarterly Journal of Operations Research, 19, 157–181. https://doi.org/10.1007/s10288-021-00477-y
- Wojtczak, D., 2018. On strong NP-completeness of rational problems. In F. V. Fomin & V. V. Podolskii (Eds.), Computer science – Theory and applications. Vol. 10846 of Lecture notes in computer science (pp. 308–320).
- Wolfers, J., Zitzewitz, E., 2004. Prediction markets. The Journal of Economic Perspectives, 18 (2), 107–126. https://doi.org/10.1257/0895330041371321
- Wollmer, R. D., 1992. An airline seat management model for a single leg route when lower fare classes book first. Operations Research, 40 (1), 26–37. https://doi.org/10.1287/opre.40.1.26
- Wolsey, L., 1975. Faces for a linear inequality in 0–1 variables. Mathematical Programming, 8, 165–178. https://doi.org/10.1007/BF01580441
- Wolstenholme, E. F., 1990. System enquiry: A system dynamics approach. Wiley.
- Wolszczak-Derlacz, J., 2018. Assessment of TFP in European and American higher education institutions – Application of Malmquist indices. Technological and Economic Development of Economy, 24 (2), 467–488. https://doi.org/10.3846/20294913.2016.1213197
- Womack, J., Jones, D., Roos, D., 1990. The machine that changed the world. Mandarin Books.
- Wong, D., Hiew, Y., 2020. Community operational research (OR) and design thinking for the health and social services: A comparative analysis. In 2020 IEEE International Conference on Industrial Engineering and Engineering Management (IEEM) . Singapore (pp. 1042–1047).
- Wong, N., Mingers, J., 1994. The nature of community OR. Journal of the Operational Research Society, 45 (3), 245–254. https://doi.org/10.2307/2584158
- Wood, R. M., McWilliams, C. J., Thomas, M. J., Bourdeaux, C. P., Vasilakis, C., 2020. COVID-19 scenario modelling for the mitigation of capacity-dependent deaths in intensive care. Health Care Management Science, 23 (3), 315–324. https://doi.org/10.1007/s10729-020-09511-7
- Wood, R. M., Moss, S. J., Murch, B. J., Vasilakis, C., Clatworthy, P. L., 2022. Optimising acute stroke pathways through flexible use of bed capacity: A computer modelling study. BMC Health Services Research, 22 (1), 1068. https://doi.org/10.1186/s12913-022-08433-0
- Wood, R. M., Murch, B. J., 2020. Modelling capacity along a patient pathway with delays to transfer and discharge. Journal of the Operational Research Society, 71 (10), 1530–1544. https://doi.org/10.1080/01605682.2019.1609885
- Wood, R. M., Murch, B. J., Moss, S. J., Tyler, J. M. B., Thompson, A. L., Vasilakis, C., 2021a. Operational research for the safe and effective design of COVID-19 mass vaccination centres. Vaccine, 39 (27), 3537–3540. https://doi.org/10.1016/j.vaccine.2021.05.024
- Wood, R. M., Pratt, A. C., Kenward, C., McWilliams, C. J., Booton, R. D., Thomas, M. J., Bourdeaux, C. P., Vasilakis, C., 2021b. The value of triage during periods of intense COVID-19 demand: Simulation modeling study. Medical Decision Making, 41 (4), 393–407. https://doi.org/10.1177/0272989X21994035
- Woodhouse, G., Goldstein, H., 1988. Educational performance indicators and LEA league tables. Oxford Review of Education, 14 (3), 301–320. https://doi.org/10.1080/0305498880140303
- Woolley, R. N., Pidd, M., 1981. Problem structuring—A literature review. Journal of the Operational Research Society, 32 (3), 197–206. https://doi.org/10.2307/2581061
- Wright, D. J., 1983. Catastrophe theory in management forecasting and decision making. Journal of the Operational Research Society, 34 (10), 935–942. https://doi.org/10.2307/2580892
- Wright, G., Cairns, G., O’Brien, F. A., Goodwin, P., 2019. Scenario analysis to support decision making in addressing wicked problems: Pitfalls and potential. European Journal of Operational Research, 278 (1), 3–19. https://doi.org/10.1016/j.ejor.2018.08.035
- Wright, P. D., Liberatore, M. J., Nydick, R. L., 2006. A survey of operations research models and applications in homeland security. Interfaces, 36 (6), 514–529. https://doi.org/10.1287/inte.1060.0253
- Wright, S. J., 1997. Primal-dual interior-point methods. SIAM.
- Xiang, W., Yin, J., Lim, G., 2015. A short-term operating room surgery scheduling problem integrating multiple nurses roster constraints. Artificial Intelligence in Medicine, 63 (2), 91–106. https://doi.org/10.1016/j.artmed.2014.12.005
- Xin, L., Van Mieghem, J. A., 2023. Dual-sourcing, dual-mode dynamic stochastic inventory models. In J.-S. Song (Ed.), Research handbook on inventory management. Edward Elgar Publishing.
- Xu, J., Huang, E., Hsieh, L., Lee, L. H., Jia, Q.-S., Chen, C.-H., 2016. Simulation optimization in the era of industrial 4.0 and the industrial internet. Journal of Simulation, 10 (4), 310–320. https://doi.org/10.1057/s41273-016-0037-6
- Yager, R., 1997. On the analytic representation of the leximin ordering and its application to flexible constraint propagation. European Journal of Operational Research, 102 (1), 176–192. https://doi.org/10.1016/S0377-2217(96)00217-2
- Yaman, H., 2005. Concentrator location in telecommunications networks. In Combinatorial optimization (Vol. 16). Springer.
- Yan, C., Barnhart, C., Vaze, V., 2022a. Choice-based airline schedule design and fleet assignment: A decomposition approach. Transportation Science. https://doi.org/10.1287/trsc.2022.1141
- Yan, C., Kung, J., 2018. Robust aircraft routing. Transportation Science, 52 (1), 118–133. https://doi.org/10.1287/trsc.2015.0657
- Yan, S., Archibald, T. W., Han, X., Bian, Y., 2022b. Whether to adopt” buy online and return to store” strategy in a competitive market? European Journal of Operational Research, 301 (3), 974–986. https://doi.org/10.1016/j.ejor.2021.11.040
- Yan, W., Wang, G., 2021. Research on the development trend of foreign education based on machine learning and artificial intelligence simulation analysis. Journal of Intelligent and Fuzzy Systems, 1–10. https://doi.org/10.3233/JIFS-219133
- Yan, Y., Chow, A. H., Ho, C. P., Kuo, Y.-H., Wu, Q., Ying, C., 2022c. Reinforcement learning for logistics and supply chain management: Methodologies, state of the art, and future opportunities. Transportation Research Part E: Logistics and Transportation Review, 162, 102712. https://doi.org/10.1016/j.tre.2022.102712
- Yang, D., 2018. Ultra-fast preselection in lasso-type spatio-temporal solar forecasting problems. Solar Energy, 176, 788–796. https://doi.org/10.1016/j.solener.2018.08.041
- Yang, D., Wang, W., Gueymard, C., Hong, T., Kleissl, J., Huang, J., Perez, M., Perez, R., Bright, J., Xia, X., van der Meer, D., Peters, I., 2022. A review of solar forecasting, its dependence on atmospheric sciences and implications for grid integration: Towards carbon neutrality. Renewable and Sustainable Energy Reviews, 161, 112348. https://doi.org/10.1016/j.rser.2022.112348
- Yang, X., Strauss, A. K., 2017. An approximate dynamic programming approach to attended home delivery management. European Journal of Operational Research, 263 (3), 935–945. https://doi.org/10.1016/j.ejor.2017.06.034
- Yang, X., Strauss, A. K., Currie, C. S., Eglese, R., 2016. Choice-based demand management and vehicle routing in e-fulfillment. Transportation Science, 50 (2), 473–488. https://doi.org/10.1287/trsc.2014.0549
- Yardley, E., Petropoulos, F., 2021. Beyond error measures to the utility and cost of the forecasts. Foresight: The International Journal of Applied Forecasting, 63, 36–45.
- Ye, Y., 1987. Karmarkar’s algorithm and the ellipsoid method. Operations Research Letters, 6 (4), 177–182. https://doi.org/10.1016/0167-6377(87)90016-2
- Ye, Y., 1997. Interior point algorithms: Theory and analysis. Wiley.
- Yearworth, M., White, L., 2014. The non-codified use of problem structuring methods and the need for a generic constitutive definition. European Journal of Operational Research, 237 (3), 932–945. https://doi.org/10.1016/j.ejor.2014.02.015
- Yearworth, M., White, L., 2019. Group support systems: Experiments with an online system and implications for Same-Time/Different-Places working. In D. M. Kilgour 7 C. Eden (Eds.), Handbook of group decision and negotiation (pp. 681–706). Springer.
- Yen, J. W., Birge, J. R., 2006. A stochastic programming approach to the airline crew scheduling problem. Transportation Science, 40 (1), 3–14. https://doi.org/10.1287/trsc.1050.0138
- Yeung, D., Petrosyan, L., 2018. Nontransferable utility cooperative dynamic games. In T. Başar & G. Zaccour (Eds.), Handbook of dynamic game theory (pp. 633–670). Springer.
- Yıldız, B., Karaşan, O. E., 2017. Regenerator location problem in flexible optical networks. Operations Research, 65 (3), 595–620. https://doi.org/10.1287/opre.2016.1587
- Yin, C., Perchet, R., Soupé, F., 2021. A practical guide to robust portfolio optimization. Quantitative Finance, 21 (6), 911–928. https://doi.org/10.1080/14697688.2020.1849780
- Yin, Y., Kaku, I., Stecke, K. E., 2008. The evolution of seru production systems throughout canon. Operations Management Education Review, 2, 27–40.
- Yin, Y., Stecke, K. E., Swink, M., Kaku, I., 2017. Lessons from seru production on manufacturing competitively in a high cost environment. Journal of Operations Management, 49–51, 67–76. https://doi.org/10.1016/j.jom.2017.01.003
- Yin, Y., Yasuda, K., 2006. Similarity coefficient methods applied to the cell formation problem: A taxonomy and review. International Journal of Production Economics, 101 (2), 329–352. https://doi.org/10.1016/j.ijpe.2005.01.014
- Yitzhaki, S., Schechtman, E., 2013. More than a dozen alternative ways of spelling Gini. In S. Yitzhaki & E. Schechtman (Eds.), The gini methodology (pp. 11–31). Springer.
- You, P.-S., 1999. Dynamic pricing in airline seat management for flights with multiple flight legs. Transportation Science, 33 (2), 192–206. https://doi.org/10.1287/trsc.33.2.192
- Young, B. C., Eyre, D. W., Kendrick, S., White, C., Smith, S., Beveridge, G., Nonnenmacher, T., Ichofu, F., Hillier, J., Oakley, S., Diamond, I., Rourke, E., Dawe, F., Day, I., Davies, L., Staite, P., Lacey, A., McCrae, J., Jones, F., Kelly, J., Bankiewicz, U., Tunkel, S., Ovens, R., Chapman, D., Bhalla, V., Marks, P., Hicks, N., Fowler, T., Hopkins, S., Yardley, L., Peto, T. E. A., 2021. Daily testing for contacts of individuals with SARS-CoV-2 infection and attendance and SARS-CoV-2 transmission in english secondary schools and colleges: An open-label, cluster-randomised trial. The Lancet, 398 (10307), 1217–1229. https://doi.org/10.1016/S0140-6736(21)01908-5
- Yu, D., He, X., 2020. A bibliometric study for DEA applied to energy efficiency: Trends and future challenges. Applied Energy, 268 (1), 115048. https://doi.org/10.1016/j.apenergy.2020.115048
- Yuan, J., Gao, Y., Li, S., Liu, P., Yang, L., 2022. Integrated optimization of train timetable, rolling stock assignment and short-turning strategy for a metro line. European Journal of Operational Research, 301 (3), 855–874. https://doi.org/10.1016/j.ejor.2021.11.019
- Yudin, D., Nemirovskii, A. S., 1976. Informational complexity and efficient methods for the solution of convex extremal problems. Ekonomika i Matematicheskie Metody, 12, 128–142.
- Zanakis, S. H., Evans, J. R., Vazacopoulos, A. A., 1989. Heuristic methods and applications: A categorized survey. European Journal of Operational Research, 43 (1), 88–110. https://doi.org/10.1016/0377-2217(89)90412-8
- Zawacki-Richter, O., Marín, V. I., Bond, M., Gouverneur, F., 2019. Systematic review of research on artificial intelligence applications in higher education – Where are the educators? International Journal of Educational Technology in Higher Education, 16 (1), 1–27. https://doi.org/10.1186/s41239-019-0171-0
- Zawadzki, P., Żywicki, K., 2016. Smart product design and production control for effective mass customization in the industry 4.0 concept. Management and Production Engineering Review, 7 (3), 105–112. https://doi.org/10.1515/mper-2016-0030
- Zeng, Q., Yang, Z., 2007. Model integrating fleet design and ship routing problems for coal shipping. In Y. Shi, G. D. van Albada, J. Dongarra, P. M. A. Sloot (Eds.), Computational science–ICCS (pp. 1000–1003). Springer.
- Zhang, J., Dimitrakopoulos, R. G., 2018. Stochastic optimization for a mineral value chain with nonlinear recovery and forward contracts. Journal of the Operational Research Society, 69 (6), 864–875. https://doi.org/10.1057/s41274-017-0269-5
- Zhang, N., Alipour, A., 2022. A stochastic programming approach to enhance the resilience of infrastructure under weather-related risk. Computer-aided Civil and Infrastructure Engineering. https://doi.org/10.1111/mice.12843
- Zhang, Y., Zhang, Z., Lim, A., Sim, M., 2021. Robust data-driven vehicle routing with time windows. Operations Research, 69 (2), 469–485. https://doi.org/10.1287/opre.2020.2043
- Zhang, Z. G., 2023. Fundamentals of stochastic models. CRC Press.
- Zhao, K., Jin, J. G., Lee, D.-H., 2017. Two-Stage stochastic programming model for robust personal rapid transit network design. Transportation Research Record, 2650 (1), 152–162. https://doi.org/10.3141/2650-18
- Zhao, X., Bennell, J. A., Bektaş, T., Dowsland, K., 2016. A comparative review of 3D container loading algorithms. International Transactions in Operational Research, 23 (1–2), 287–320. https://doi.org/10.1111/itor.12094
- Zhen, L., 2015. Tactical berth allocation under uncertainty. European Journal of Operational Research, 247 (3), 928–944. https://doi.org/10.1016/j.ejor.2015.05.079
- Zheng, Y.-S., 1992. On properties of stochastic inventory systems. Management Science, 38 (1), 87–103. https://doi.org/10.1287/mnsc.38.1.87
- Zhou, C., Ma, N., Cao, X., Lee, L. H., Chew, E. P., 2021. Classification and literature review on the integration of simulation and optimization in maritime logistics studies. IISE Transactions, 53 (10), 1157–1176. https://doi.org/10.1080/24725854.2020.1856981
- Zhou, H., Qi, J., Yang, L., Shi, J., Pan, H., Gao, Y., 2022. Joint optimization of train timetabling and rolling stock circulation planning: A novel flexible train composition mode. Transportation Research Part B: Methodological, 162, 352–385. https://doi.org/10.1016/j.trb.2022.06.007
- Zhou, H., Yang, Y., Chen, Y., Zhu, J., 2018. Data envelopment analysis application in sustainability: The origins, development and future directions. European Journal of Operational Research, 264 (1), 1–16. https://doi.org/10.1016/j.ejor.2017.06.023
- Zhou, K., Doyle, J. C., 1998. Essentials of robust control. Prentice Hall.
- Zhou, S. X., Tao, Z., Chao, X., 2011. Optimal control of inventory systems with multiple types of remanufacturable products. Manufacturing & Service Operations Management, 13 (1), 20–34. https://doi.org/10.1287/msom.1100.0298
- Zhu, E., Crainic, T. G., Gendreau, M., 2014. Scheduled service network design for freight rail transportation. Operations Research, 62 (2), 383–400. https://doi.org/10.1287/opre.2013.1254
- Zhu, J., 2015. Data envelopment analysis: A handbook of models and methods. Springer.
- Zhu, Q., Wu, J., Song, M., Liang, L., 2017. A unique equilibrium efficient frontier with fixed-sum outputs in data envelopment analysis. Journal of the Operational Research Society, 68 (12), 1483–1490. https://doi.org/10.1057/s41274-017-0181-z
- Zhuang, F., Qi, Z., Duan, K., Xi, D., Zhu, Y., Zhu, H., Xiong, H., He, Q., 2021. A comprehensive survey on transfer learning. Proceedings of the IEEE, 109 (1), 43–76. https://doi.org/10.1109/JPROC.2020.3004555
- Ziel, F., 2016. Forecasting electricity spot prices using lasso: On capturing the autoregressive intraday structure. IEEE Transactions on Power Systems, 31 (6), 4977–4987. https://doi.org/10.1109/TPWRS.2016.2521545
- Ziel, F., Liu, B., 2016. Lasso estimation for GEFCom2014 probabilistic electric load forecasting. International Journal of Forecasting, 32 (3), 1029–1037. https://doi.org/10.1016/j.ijforecast.2016.01.001
- Ziel, F., Steinert, R., 2018. Probabilistic mid- and long-term electricity price forecasting. Renewable and Sustainable Energy Reviews, 94, 251–266. https://doi.org/10.1016/j.rser.2018.05.038
- Ziel, F., Weron, R., 2018. Day-ahead electricity price forecasting with high-dimensional structures: Univariate vs. multivariate modeling frameworks. Energy Economics, 70, 396–420. https://doi.org/10.1016/j.eneco.2017.12.016
- Zikopoulos, C., Tagaras, G., 2008. On the attractiveness of sorting before disassembly in remanufacturing. IIE Transactions, 40 (3), 313–323. https://doi.org/10.1080/07408170701488078
- Zipkin, P., 2000. Foundations of inventory management. McGraw-Hill.
- Zis, T., Psaraftis, H. N., 2017. The implications of the new sulphur limits on the european Ro-Ro sector. Transportation Research Part D: Transport and Environment, 52, 185–201. https://doi.org/10.1016/j.trd.2017.03.010
- Zis, T., Psaraftis, H. N., 2019. Operational measures to mitigate and reverse the potential modal shifts due to environmental legislation. Maritime Policy & Management, 46 (1), 117–132. https://doi.org/10.1080/03088839.2018.1468938
- Zis, T. P. V., Psaraftis, H. N., Ding, L., 2020. Ship weather routing: A taxonomy and survey. Ocean Engineering, 213, 107697. https://doi.org/10.1016/j.oceaneng.2020.107697
- Zografos, K. G., Salouras, Y., Madas, M. A., 2012. Dealing with the efficient allocation of scarce resources at congested airports. Transportation Research Part C: Emerging Technologies, 21 (1), 244–256. https://doi.org/10.1016/j.trc.2011.10.008