
Abstract
A discussion of the need for organizational behavior management practitioners to shift their application paradigm from a dyadic perspective to a systems perspective is presented. Such a shift would improve the identification of performance improvement opportunities, reduce the effects of unintended contingency interactions, and help ensure sustainable improvement efforts. Nine performance system tools are described that assist the analyst in the design of a performance system and its long-term management and maintenance. A manufacturing case study describing the application of these tools is provided.
The operant conditioning chamber, or the more popular term Skinner box, was first described by Heron and Skinner in 1939. The Skinner box has been used extensively in the experimental analysis of behavior. It provided many of the basic principles used in the technology of applied behavior analysis. In these applications, a dyadic (two-party) relationship similar to that in the Skinner box has been maintained. That is, in the experimental analysis of behavior an experimenter manipulates the contingencies for subjects, whereas in applied behavior analysis a therapist or trainer manipulates the contingencies for clients or students.
This dyadic paradigm is also largely adopted by the field of organizational behavior management (OBM). The practitioner consultant or manager manipulates the contingencies for workers. Though this dyadic paradigm produced significant results in OBM projects (see below), an exclusively dyadic paradigm may lead to a focus on the wrong issues, cause unintended effects, or fail to sustain behavior changes. It is recommended that in OBM the dyadic paradigm be subsumed within a systems view. Dyadic analyses and techniques are applied only at the lowest system level—the modification or management of specific employee behaviors. These differences in perspective and methodology are driven by differences inherent in science versus technology.
PERFORMANCE SYSTEMS
Many successful OBM interventions have been applied to specific target performance measures in organizations (Alvero, Bucklin, & Austin, Citation2001; Balcazar, Hopkins, & Suarez, Citation1985). However, interactions of the change in the target measure with other measures in the job position, other job positions, or higher organizational levels are rarely reported. Furthermore, the long-term sustainability of such interventions is also seldom reported. The performance systems perspective posits that in OBM the total performance system should be analyzed and managed before focusing on one behavior within a job.
The performance systems view has been advocated by many OBM authors over the past 40 years (Abernathy, Citation2011; Brethower, Citation1972; Harshbarger & Maley, Citation1974; Krapfl & Gasparato, Citation1982; Malott, Citation2003; Mawhinney, Citation2001; Rummler & Brache, Citation1995). Much of the discussion of performance systems has been at a conceptual level more so than an applied level. A lack of applied performance system tools may explain why so few system-level OBM interventions have been reported.
Many of the tools described here are organized in a computer database called the Performance System Database. The Performance System Database was developed beginning in the 1980s by my consulting firm, Abernathy & Associates. The database was developed and applied through a service bureau for more than 170 organizations in the United States and abroad. The Performance System Database was developed to provide customer organizations with a relatively easy-to-use method of tracking performance and computing performance pay. Approximately two-thirds of the clients purchased the system to implement an organization-wide performance pay system. The other third were interested in replacing a subjective performance appraisal system with an objective one. The performance system tools presented in this article were developed by Abernathy & Associates from 1981 through 2001. In 2005 the technology was acquired by Aubrey Daniels International (ADI).
PERFORMANCE SYSTEM DESIGN TOOLS
The major obstacle for an OBM performance systems approach is the basic requirement of an organization-wide performance measurement system. This involves defining objective performance measures for each job position within the organization. In our earliest attempts, the design of a performance system was confusing and too time consuming for most clients. The tools described here enabled us to reduce the performance system design time to an average of five to seven job positions per design day. As a result, the practitioner could comfortably design an organization-wide performance measurement system for a client with, for example, 30 job positions in 4 or 5 days.
A manufacturing performance system is used as a case study to describe many of the performance system tools. The case study organization is a private company with around 120 employees. It provides metal parts to its customers and has been in business since 1980.
System Design Tool 1: Result Rather Than Behavior Measurement
We began our efforts to design organization-wide performance systems by measuring employee behaviors. In our first attempt, we designed a measurement system for a bank operations center with around 100 employees. Nine hundred unique behaviors were identified. We soon realized that attempting to measure each behavior was too time consuming and cumbersome. After two more attempts at this approach with other clients, we abandoned using behaviors as the basic system elements in favor of the results these behaviors produced. For these reasons, the term performance measures is used rather than behavior measures.
Results are measured rather than behaviors for three reasons. First, results are typically measured and tracked in organizations, whereas behaviors often are not. Even in the operant chamber, switch closures are typically counted rather than direct observations of behavior. Second, interactions across measures and jobs often are determined by the results of behaviors rather than the behaviors themselves. An upstream unit may send inaccurate data to a downstream unit. The data errors rather than the original behaviors create the immediate problems for the downstream unit. Third, measuring behavior constrains employee innovation and flexibility. Skinner’s conception of the free operant focuses on the result produced by a class of behaviors that may vary from day to day or across employees. The case study company’s performance system consists of 11 management/professional job positions and 20 worker job positions. Six of these worker positions are measured as teams, whereas the other 14 measure individual results. Of the 46 unique performance measures, 43 are based on results, one is subjective (a leadership score), and two are behaviors (a driver safety score and behavioral safety indexes).
System Design Tool 2: Seven Performance Measurement Categories
Using the statistical technique cluster analysis, we analyzed several of our client organizations’ performance databases and arrived at seven performance measurement categories that described all performance measures in the databases. These categories were (a) sales, (b) expenses, (c) productivity, (d) cash flow, (e) regulatory compliance, (f) customer service, and (g) special projects (Abernathy, Citation2011). The behavior analyst can develop a balanced set of measures for any job position by simply asking the manager these seven questions (i.e., Do employees in this job significantly affect sales? Do they significantly affect expenses? and so on). The case study company measurement system includes all seven measurement categories.
System Design Tool 3: The Method of Cascading Objectives
This method was described by Kaplan and Norton (Citation1996). In the 1980s we worked from the bottom up in designing performance system measurement programs. That is, we designed measures for worker-level scorecards first, then moved up through management. This approach not only was very time consuming but often failed to properly align organizational, manager, and worker performance objectives. We then reversed the process and began to first design an organizational scorecard (using the seven measurement categories in the previous section) and then work down through the organization. The organizational scorecard represents senior management’s strategy for improving the organization’s success. The time required was less than 20% of the original bottom-up time. Furthermore, the problem of alignment across organizational levels was resolved (Abernathy, Citation2011). The organizational scorecard for the case study organization is as follows:
Sales: total gross profit (revenues—expenses, with revenue the focus)
Expenses: total gross profit (revenues—expenses, with expenses the focus)
Productivity: corporate productivity (average of individual and team productivity measures)
Cash Flow: corporate uncollected sales/inventory aging
Regulatory compliance: Occupational Safety and Health Administration index (only used in the organizational scorecard; lower level measures are behavioral safety checklists)
Customer service: corporate quality (average of individual and team quality measures)
Special projects: leadership score (computed from quarterly subordinate employee survey and scorecards)
System Design Tool 4: Performance Scorecard
A performance systems approach requires that all critical results in the seven measure categories be measured for each job position to ensure balance and to manage unforeseen interactions. We found the performance matrix (Felix & Riggs, Citation1986) the most versatile and effective approach for designing scorecards that track multiple performance measures within a job position. is an illustration of ADI’s performance scorecard, which is based on the performance matrix. Each manager is e-mailed his or her personal performance scorecard monthly as well as all of their subordinates’ scorecards. A meeting is held in which scorecards are distributed and discussed.
FIGURE 1 Performance scorecard.
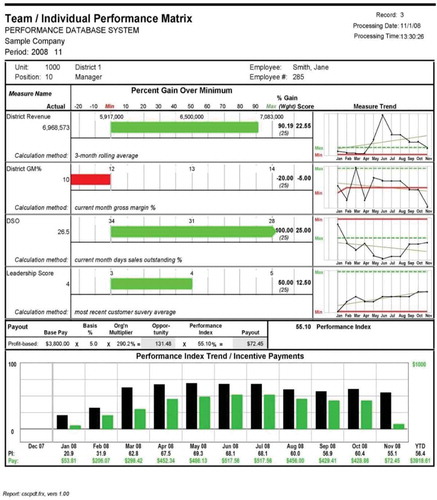
Each row of the basic scorecard consists of a measure name, minimum, maximum, priority weight, percent gain, weighted percent gain, and performance index. The minimum is defined as current or minimally accepted performance. The maximum is computed as a 1 SD improvement, performance of the exemplar, or top down, where individual performances are allocated to sum to departmental or organizational budgets. The priority weights are determined by management with consideration given to how critical the measure’s dimension is and each measure’s improvement potential. The percent gain is computed as (actual – min)/(max – min). It represents the percentage of improvement from min to max. The weighted percent gain is the percent gain multiplied by the weight, and the performance index is the sum of the weighted percentages. For example, in a two-measure scorecard the computations might be as shown in .
FIGURE 2 Sample calculations for weighted percent gain and performance index.
The scorecards serve as performance prompts in that they list the key results for a job position and each measure’s base, goal, and priority weight. The scorecards provide employee feedback by computing and charting the monthly percent gain for each measure. The individual measures’ percent gains are multiplied by their priority weights and summed to compute a performance index that serves as the basis for reinforcement through an organization-wide performance pay system.
PERFORMANCE SYSTEM MANAGEMENT TOOLS
Performance system management tools are used by the analyst after the measurement system implementation to improve employee performances and to ensure that the performance system contingencies remain valid and effective over time.
System Management Tool 1: Leadership Matrix
The leadership matrix is designed to identify managers or supervisors who prove ineffective in managing subordinate performance through positive feedback and reinforcement. These managers are then provided with performance coaching by a behavior analyst. The leadership matrix is presented in . The y-axis of the leadership matrix represents the average performance index score of the leader’s subordinates (Abernathy, Citation2011). For line supervisors this is the average performance score of the reporting workers. For middle- and upper level managers, it is the average leadership score of their reporting managers.
FIGURE 3 Leadership matrix.
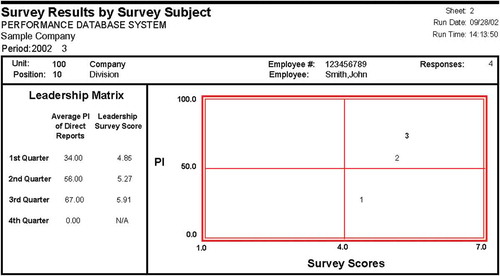
The x-axis is an average rating by the leader’s subordinates on a leadership survey that is distributed quarterly. The leadership survey asks the manager’s subordinates questions concerning the manager’s performance management effectiveness (e.g., “Our managers and supervisors consistently provide their employees immediate and effective performance feedback”).
The intersection of the performance scores and the ratings is plotted on the leadership matrix. In the sample matrix (see ), in the first quarter the manager had poor subordinate performance, but subordinates rated the manager above average in performance management effectiveness. In the second and third quarters, both subordinate performance and subordinate ratings improved. A perfect score would be plotted in the upper right-hand corner of the matrix.
System Management Tool 2: Organization-Wide Performance Pay Program
Organization-wide performance measurement systems are difficult for an organization to implement and maintain. Early in our service bureau experience we discovered that client data reporting became more incomplete and delayed over time. To correct this serious issue, we implemented performance pay programs tied to the scorecard results. Put simply, we paid (reinforced) employees to report the data completely, accurately, and on time. Generally speaking, as long as performance pay was available, the system reporting was sustained. There were many other benefits to implementing performance pay. Employee receptiveness and assistance in the system implementation increased substantially. Furthermore, a significantly higher percentage of scorecard measures improved, and improvements were greater than in previous systems we had implemented without performance pay.
The performance pay system is termed profit-indexed performance pay (PIPP; Abernathy, Citation2011). PIPP consists of three elements: the employee’s performance pay basis, the profit multiplier, and the scorecard performance index. The performance pay basis is assigned individually to each employee and is expressed as a percentage of the employee’s base pay. For example, an employee with a $3,000 monthly base pay and a basis of 5% would be eligible for $3,000 × 5% = $150 each month.
The profit multiplier is based on total organizational profit and typically ranges from 0 to 3 (though some systems extend beyond 3). Each month, each employee’s basis percentage is adjusted by the multiplier. For example, if the month’s multiplier is 2, then the previous employee’s performance pay opportunity increases (5% × 2 = 10%). Adjusting each employee’s opportunity based on overall profitability ensures that the organization can fund the performance pay and helps ensure that employees are concerned with overall profitability—not just their personal scorecard results.
The final PIPP component is the scorecard performance index, which is the weighted sum of all performances on the employee’s scorecard. The performance index ranges from 0% to 100%. The month’s adjusted performance opportunity percentage is multiplied by the employee’s performance index to compute the actual payout percentage. In the previous example, the employee’s opportunity was 10% of monthly pay. If the performance index were 80%, the employee’s actual payment would be 10% × 80% = 8% of monthly base pay:
Performance system sustainability
Abernathy & Associates’ service bureau managed performance systems for clients over several years. The longest duration client’s performance system is still operational and reporting after 20 years. The case study organization is moving into its 11th year of performance system reporting.
Performance improvement
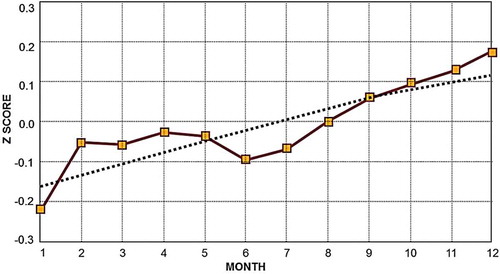
The overall first-year results of performance pay programs across 25 client organizations are displayed in (Abernathy, Citation2011). These data include 2,195 performance measures. The data have been transformed to z scores to allow them to be averaged. The data represent the first 12 data points of each client organization’s system implementation.
FIGURE 4 Average performance improvement for a sample of 2,195 matrix measures. Trend = 2.76%, annualized = 33.12%.
System Management Tool 3: System-Wide Identification of Performance Improvement Opportunities
A basic task for the behavior analyst is to identify performance improvement opportunities and implement plans to improve them. The Performance System Database provides the analyst with several data screens, two of which are presented here, to assist in pinpointing performance improvement opportunities.
Results by organizational level (ROL) screen
The ROL screen is used to pinpoint improvement opportunities across the organization’s total performance system (see ). The ROL screen allows the analyst to explore the results for any area and any level of an organization. The screen contains a table that displays a selected job position and all positions that directly report to it. The position being investigated is always at the top of the table and is highlighted. The screen displays the current performance index, trend, and variability for that position on the left half of the screen. The right-most columns show the same information but summarized for those positions that report to the higher level. This gives a snapshot of three levels in an organization: the current position, summarized performance for subordinate positions, and the performance of each subordinate.
FIGURE 5 Results by organizational level.
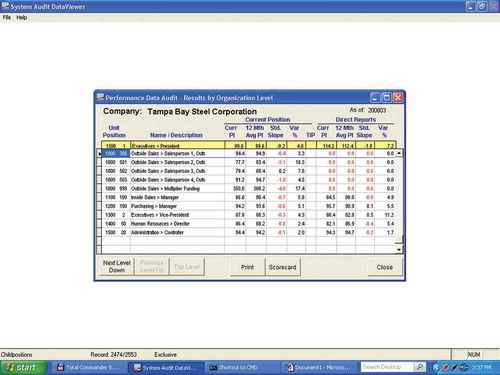
Measures with deteriorating trends are highlighted in red. Measures exhibiting consistent low performance, high variability, or deteriorating trends may be selected by the analyst for further investigation. The analyst can use the ROL screen not only to pinpoint specific problem areas but also to determine when managers’ performance scores do not seem to reflect those of their subordinates. This may indicate either invalid or unaligned measures at one level or another. Once a measure of interest has been identified, the analyst clicks on “scorecard” to display the specific scorecard within which the measure resides. The “TIP” column flags measures for which a tactical improvement plan is currently in place. Tactical improvement plans are developed by managers who attend a workshop on performance improvement. The plan chosen is determined by the target scorecard measure. Such plans may improve the opportunity to perform (time and input), the capability (employee competence, resources, or processes), or the performance context (prompts, feedback, or consequences).
depicts the case study’s president’s performance as well as that of his direct reports: outside salespeople, inside sales manager, purchasing manager, vice president, human resources director, and controller. (For convenience, the client chose to include the performance pay profit multiplier.)
Performance scorecard analysis screen
This screen (see ) displays a specific worker, team, or manager scorecard. The screen displays each measure name, the base, the current actual performance, the goal, the priority weight, the current period percent gain, the slope, and the variability of the measure over the past 12 periods. Scales are provided to make it easier to quickly identify the measure with the poorest performance.
FIGURE 6 Performance scorecard analysis.
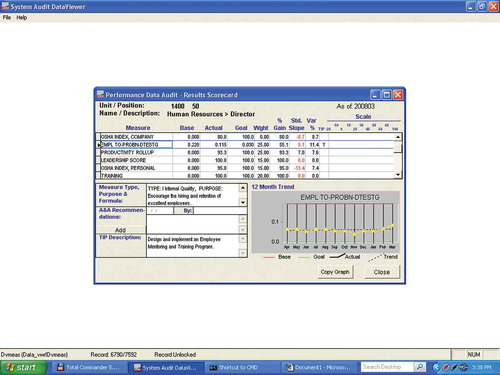
For the highlighted measure, the panels below the scorecard provide a description of the measure and its purpose, the analyst’s recommendations regarding the measure’s impact and likely constraints, and a description of any current tactical improvement plan. The final panel charts the performance trend for the past 12 months relative to the base (in red) and the goal (in green). The data points change from dots to triangles in the month in which a tactical improvement plan is implemented.
The human resources director’s scorecard is presented here. The director’s current month’s percent gains are all above 80% except for the employee problem testing gain, which is at 55.1%. This score, relative to the other scores, indicates that an intervention would be of value. As the chart shows, the performance has remained rather flat the past 12 months. An employee training and mentoring program is described in the tactical improvement plan panel but does not appear to have had any effect on performance, as it has been in place for the past 12 months.
presents the results of 59 tactical improvement plans for a statewide banking client. A total of 85% of the projects obtained an improvement within 90 days.
FIGURE 7 Results of 59 bank-wide tactical improvement plans.
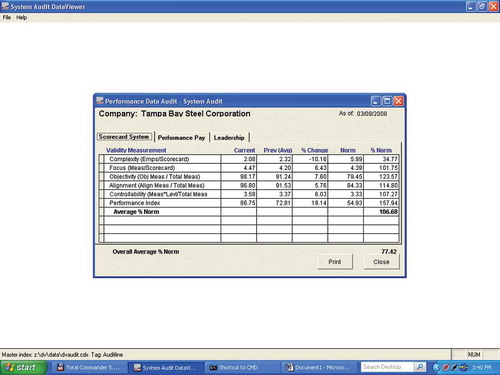
System Management Tool 4: Scorecard System Audit
The measures on the system audit screens refer to characteristics of the performance system rather than specific employee performances. The two audits are an audit of the scorecard system’s validity and effectiveness and an audit of the performance pay system’s equity and effectiveness.
The scorecard system audit (see ) is used to identify problems with the design and structure of the scorecard system. The current period is compared to the previous period to compute the percent change in the measure. Data from all client systems reporting to the service center are used to compute a norm, and the current score is compared to the norm to compute the percent norm. A system with an average percent norm at 100% or above is considered a valid system relative to the norm group.
FIGURE 8 Scorecard system audit screen.
Scorecard system complexity
The scorecard system complexity is the number of employees in the system divided by the number of active scorecards (job positions). Complex measurement systems will have fewer employees per scorecard than simpler ones. To reduce complexity, scorecard measures should be stated at a higher priority or level, or jobs should be enlarged or enriched so that multiple performance measures are subsumed within the same results. These actions reduce the number of performance measures and scorecards in the system.
Scorecard focus
The scorecard focus is the number of performance measures in the system divided by the number of scorecards (job positions). Unfocused scorecards exceed the recommended number of performance measures of no more than seven per scorecard. To reduce the number of measures, the unit’s priorities can be better defined and low-priority measures eliminated. The scorecards are not intended to be job descriptions but rather key results that relate directly to the organizational strategic scorecard.
Scorecard objectivity
The scorecard objectivity is the percentage of the system’s scorecard measures that are subjective. Examples of subjective measures are supervisor ratings of subordinates, employee peer ratings, administrative checklists, and the like. To reduce subjectivity, ratings must be converted to objective, measurable outcomes.
Scorecard alignment
The scorecard alignment is the percentage of the system’s scorecard measures that are derived from the organizational scorecard measures. The number of unrelated measures should be reduced to improve alignment.
Measure controllability
Each measure is multiplied by its level code (1 = organization, 2 = division, 3 = department, 4 = team, 5 = personal). These levels are summed and divided by the total number of measures to compute the average level. The higher the level, the more controllable the measures and the more effective the system. For example, a controllability index of 4.5 would mean that all measures were at the team or individual level.
Performance index
The performance index is the average scorecard performance index for all employees in the system. An effective scorecard system will typically have an average performance index between 30 and 70. This range ensures employee contact with the reinforcement but provides for additional improvement.
For the case study organization, the primary system deficiency is the system complexity (see ). This system has 2.08 employees per unique scorecard, whereas the norm group averages 5.99 employees per scorecard. The organization can reduce its system complexity through job redefinition and enlargement or by moving measures to higher organizational levels. For example, a banking client may have 1,000 tellers but only four teller measures.
System Management Tool 5: Performance Pay System Audit
These indexes measure the system’s effectiveness in paying predictably, adequately, and fairly for employee performance. The measures screen is presented in . In the average percent norm column, 100% indicates that the system is at norm, whereas below 100% means that the system is not as valid and effective as the norm group, and above 100% indicates that it is more valid and effective. N/A means “not available” (the client did not report the data needed to compute the metric).
FIGURE 9 System audit, performance pay.

Reliability
The average number of changes per month to the system scorecards is divided by the number of scorecards (percent scorecards changed each month). The more changes that are made to scorecards, the less reliable and predictable the scorecard is for employees and the less effective it is in managing performance.
Opportunity percent
The opportunity percent is the average monthly performance pay opportunity divided by the employees’ total base pay. Generally speaking, the greater the opportunity, the more effective the performance pay system. In PIPP, the opportunity varies with the organization’s profitability.
Payout percent
The payout percent is the average monthly performance payout divided by the employees’ base pay. Generally speaking, the greater the payout, the more effective the performance pay system.
Leverage percent
The leverage percent is the percent below market pay the employees’ base pay is. If the overall external and internal pay equity (next items) are acceptable, then the higher the leveraging the more motivated are the employees.
External equity percent
The external equity percent is the opportunity percent divided by the leverage percent (see items above). One hundred percent means that the percent pay below market equals the percent above market performance pay opportunity. Typically, 300% is a good ratio. That is, for every dollar below market and at risk there is a $3 performance pay opportunity.
Internal equity percent
The internal equity percent is high performer pay divided by average performer pay. Across the organization, employee pay is divided into five pay bands. These bands are then sorted by employee performance indexes. The pay of high performers is then compared to that of average performers. One hundred percent indicates perfect equity. Percentages below 100% mean that high performers are paid less than their performances warrant. Percentages above 100% indicate that high performers are paid more than their performances warrant.
Performance pay return
The average controllable net income (excluding investment income and depreciation expense) is divided by the performance pay. The result is a percent return. For example, a 300% return means that for each performance pay dollar disbursed, the organization receives $3 in controllable net income. The numerator and denominator can be reversed to compute the employees’ share percentage. The share percentage is the percentage of each controllable net income dollar paid to employees.
The case study organization’s performance pay system indicators (see ) are well above the norm. System reliability, leverage, external equity, and performance pay data have not been submitted and are therefore listed as N/A, or not available. Currently, the employees’ performance pay opportunity, as a percentage of base pay, is 54.37% which is more than twice the norm group’s 26.42%. The actual payout percentage is 47.4% of base. The internal equity is currently 1.17, which indicates that high performers (in the same jobs) are paid significantly more than poor performers.
The performance pay audit evaluates the organization’s performance pay system in terms of its value to employees (opportunity and payout), pay equity within and without the organization, and the organization’s return on performance payouts.
DISCUSSION
It is recommended that OBM practitioners shift their application paradigm from a dyadic, manager–subordinate view to a systems paradigm. The reasons for this proposal are to better identify performance improvement opportunities; to produce more sustainable performance improvements; and to reduce the possibility of an intervention’s unintended effects on other performances within a job, across jobs, or across organizational levels.
A critical obstacle to performance systems interventions is that an organization-wide performance measurement system is required. Four tools were presented that have proven to significantly reduce the time and effort involved in developing such a system for a client organization. These are (a) results measurement, (b) measurement categories, (c) cascading objectives, and (d) performance scorecards. These methods have reduced design complexity and substantially reduced design time. The case study manufacturing organization has 115 employees, 31 job positions, and 46 unique performance measures. The performance system was designed and management trained in its use in a 2-week period.
Better identification of performance improvement opportunities is facilitated through the application of two tools. These are data screens that compare performances by organizational level and scorecards that track performance trends and display information regarding tactical improvement plans.
Producing more sustainable performance improvements is accomplished through a system-wide performance pay plan that also expedites the measurement design and implementation phases. This objective is further facilitated by two performance system audits: a measurement system audit and a performance pay system audit. These tools ensure the ongoing validity of a dynamic system in which external or internal changes can be identified and addressed efficiently.
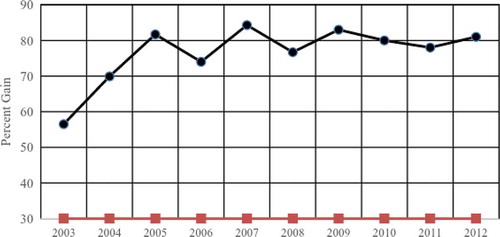
The case study organization’s performance system has been sustained over a 10-year period. is a chart of employee performance over the past 10 years of the case study performance system’s implementation. The performances plateaued in the third year likely because of performance constraints that could not be overcome through better performance and continuous employee turnover.
FIGURE 10 Mean performance index: 10-year change.
The final objective of reducing the unintended effects of implementing new contingencies is partially achieved in that the scorecard displays a balanced set of measures that enables the analyst to observe the effects of a measure intervention on other key measures within a job position.
We conducted a correlational study of the interactions between scorecard productivity measures and measures of accuracy, timeliness, and customer service ratings. Using ADI’s client database, we examined 3,866 performance measure pairs (i.e., productivity to accuracy) for 25 organizations for a 12-month period (Kling, Citation2012). From these data we identified scorecards that had two or more of the target measure types and conducted a Pearson correlation across all of the data pairs. The results are summarized in . The findings indicate that as productivity (output/labor) increases, accuracy also increases, but timeliness and customer service ratings decrease.
We are currently exploring the analysis of measure interactions through the use of factor and cluster analyses to identify critical relationships across all system measures. These analyses are being conducted on the ADI service center client databases and show considerable promise in getting the big picture of measure interactions and identifying critical measures that impact many other measures. Such analyses are only possible with organization-wide performance measurement systems.
TABLE 1 Effects of Changes in Productivity on Quality in the Workplace
I hope that the concepts and tools presented in this article highlight the need for a systems approach in OBM and will provide OBM researchers and practitioners with techniques that will better enable them to apply a systems paradigm in their work.
ACKNOWLEDGMENT
I wish to thank Aubrey Daniels International for sharing their Performance System Database computer screens.
Related Research Data
REFERENCES
- Abernathy, W. B. (2011). Pay for profit: Designing an organization-wide performance-based compensation system. Atlanta, GA: Performance Management Publications.
- Alvero, A. M., Bucklin, B. R., & Austin, J. (2001). An objective review of the effectiveness and essential characteristics of performance feedback in organizational settings. Journal of Organizational Behavior Management, 21(1), 3–29.
- Balcazar, F., Hopkins, B. L., & Suarez, Y. (1985). A critical, objective review of performance feedback. Journal of Organizational Behavior Management, 7(3–4), 65–89.
- Brethower, D. M. (1972). Behavioral analysis in business and industry: A total performance system. Kalamazoo, MI: Behaviordelia.
- Felix, G. H., & Riggs, J. L. (1986). Productivity by the objectives. Eugene, OR: Oregon University Press.
- Harshbarger, D., & Maley, R. F. (1974). Behavior analysis and systems analysis: An integrative approach to mental health programs. Kalamazoo, MI: Behaviordelia.
- Heron, W. T., & Skinner, B. F. (1939). An apparatus for the study of behavior. Psychological Record, 3, 166–176.
- Kaplan, R. S., & Norton, D. P. (1996). The balanced scorecard: Translating strategy into action. Cambridge, MA: Harvard Business Press.
- Kling, B. L. (2012). Effects of changes in productivity on quality in the workplace. Hammond, LA: Southeastern Louisiana University.
- Krapfl, J., & Gasparato, G. (1982). Behavioral systems analysis. In L. W. Fredericksen (Ed.), Handbook of organizational behavior management (pp. 21–38). New York, NY: Wiley.
- Malott, M. E. (2003). Paradox of organizational change: Engineering organizations with behavior systems analysis. Reno, NV: Context Press.
- Mawhinney, T. C. (2001). Organization-environment systems as OBM intervention context: Minding your metacontingencies. In L. J. Hayes, J. Austin, R. Houmanfar, & M. C. Clayton (Eds.), Organizational change (pp. 137–165). Reno, NV: Context Press.
- Rummler, G. A., & Brache, A. P. (1995). Improving performance: How to manage the white space on the organizational chart (2nd ed.). San Francisco, CA: Jossey-Bass.