
Abstract
The British census asked employers to record their workforce numbers. The responses to this instruction provide a unique resource on firm size. While the responses were digitized and included in the Individual Census Microdata (I-CeM) deposit, their format limits their utility. A further data deposit, the British Business Census of Entrepreneurs (BBCE), overcomes I-CeM’s deficiencies by infilling data gaps and parsing employer and workforce data into separate fields. This paper evaluates the coverage in I-CeM and BBCE data for this specific census question, and compares these with the published census analysis of the same data. The results prove the benefits of the BBCE data over I-CeM on the subject of firm size, and demonstrate the need for caution in using the published tables.
Introduction
Before the deposit of digital records of the British population censuses, quantitative studies on long-term economic and social trends in nineteenth-century Britain relied on published aggregate tabulations of the census, case studies that consulted individual records, or the valuable but necessarily restricted 5 percent sample of the 1851 census (Anderson, Collins, and Scott Citation1979). The deposit of digital records of the full population census data for 1881 (Schürer and Woollard Citation2000), and the censuses for 1851–1911 in the Individual Census Microdata database (I-CeM) (Schürer and Higgs Citation2014; Higgs et al. Citation2015; Schürer et al. Citation2016), have opened up the potential for full-population aggregate-level, and individual-level analysis for all years 1851–1911 (except for 1871, which is yet to be deposited). Just like the impact of the Minnesota Historical Census projects (Ruggles and Menard Citation1995), the availability of census digital microdata has made possible new insights in British demographic, economic and social history. Over the past five years, the I-CeM data containing census records of the full population of England, Wales, and Scotland have been used to develop new interpretations of childhood mortality (Jaadla and Reid Citation2017; Atkinson et al. Citation2017), family structure (Schürer et al. Citation2018), fertility (Garrett and Reid Citation2018; Reid et al. Citation2019), business proprietors (Bennett, Smith, and Montebruno Citation2018; Bennett et al. Citation2019; Van Lieshout et al. Citation2019), business partnerships (Bennett Citation2016), agriculture (Montebruno et al. Citation2019a), women’s occupations (You Citation2019), portfolios in farming (Radicic, Bennett, and Newton Citation2017), migration (Schürer and Day Citation2019; Smith, Bennett, and van Lieshout Citation2019), and urban structure (Smith, Bennett, and Radicic Citation2018), and have been visualized and further made available in the online atlas Populations Past (Reid et al. Citation2018). These analyses have considerably improved on scholarship based on the only source that was previously available with national coverage: the published tabulations created by the census administrators (the General Register Office: GRO) at the time of the censuses.
The censuses over 1851–81 included specific questions to employers and farmers to record their workforce numbers, and for farmers the number of acres occupied. The responses to these questions provide a unique resource for this period on firm size and farm size. While these data were not coded into I-CeM, the occupational strings containing them were mostly captured. However, unfortunately these contain truncations of some of the source transcriptions, omissions of some whole occupational descriptor strings, the gap for 1871, as well as the absence of parsing and coding of the employer and farmer responses. This has limited the utility of these data for studies of businesses. This deficiency has been overcome in a further data deposit of the 1851–1911 censuses that develops I-CeM for business proprietors by infilling truncations and other gaps and supplements it for 1871: the British Business Census of Entrepreneurs (BBCE).
This paper evaluates the quality of coverage by the digital records in I-CeM data and BBCE for the specific 1851–81 census questions to business proprietors on the size of their workforce. The GRO’s few published tables based on the responses to these questions have previously been used in the study of social, family and demographic change (Anderson Citation1988), agricultural history (Grigg Citation1987; Lawton and Pooley Citation1992; Mills Citation1999; Shaw-Taylor Citation2012), and business sector firm size development (Clapham Citation1938; Rodger Citation1988). Now the full digital records allow all years and individual records to be analyzed. Using a mixture of algorithmic and clerical extraction methods, a pilot study based on the 1881 census demonstrated the feasibility of extracting the data contained in the digital records of the original occupational descriptor strings to give parsed variables containing the workforce types, numbers of workers, and farm acres for each individual business proprietor (Bennett and Newton Citation2015). This method has now been extended and applied to all the censuses 1851–81. This paper uses these extractions to evaluate their quality compared, where possible, with the published census analysis of the same data in order to evaluate the completeness of the digital record of employer workforce numbers now available. The paper also evaluates how far infills and supplements to the I-CeM records in BBCE that are necessary to overcome data truncations are successful.
The process of infilling for truncations are consequential from an earlier stage of our assessment of the extractions that showed that I-CeM had serious deficiencies for extracting the workforce numbers because the occupational data strings for 1851 and 1861 were truncated in the digital data preparation process. This paper evaluates the data in I-CeM and BBCE on employers’ workforces against the published tables. The paper demonstrates the potential of the new data, and how this new and enhanced database provides new insights into the developments of Britain’s population of business proprietors and their workforce in the nineteenth century.
The mid-nineteenth century was a crucial period of British economic development, that initially saw dominance of the global economy both in trade and manufactured goods, but then witnessed its comparative decline after 1870 (Clapham Citation1938). Despite its importance to British economic history, this is a period for which the previous lack of data on businesses has led Les Hannah to refer to it as a “statistical dark age” (Hannah Citation2007, 414). As a result most business histories have had to be based on the largest firms or case studies. This has inhibited understanding of Britain as well as international comparisons. The BBCE dataset now fills this data gap, and includes all employers regardless of size. As small firms made up the majority of business in the Victorian period, it provides a unique opportunity for the study of business growth, success, or failure, the variety of business in different sectors, and the demographic characteristics of employers and their workforces. In addition, it offers a basis to extend long term analysis of trends among the largest firms (see Hannah Citation2014) and international comparisons of firm-size development (see e.g., Atack, Citation1986).
The UK population census and business
Unlike the US, Britain did not have a manufacturing census during the nineteenth century (Atack and Bateman Citation1999). Instead, business historians have generally had to rely on archives of individual businesses, Board of Trade data, Factory Inspectorate returns, or trade directories, all of which have inconsistencies of coverage over time and generally cover only a few sectors (with greatest density of cover for manufacturing). Although the population census existed, the data relating to business proprietors were mostly unpublished and therefore inaccessible. However, the GRO had an interest in distinguishing employers and employees, and measuring agricultural workforces in particular (Higgs Citation2005, 106–112). In consequence, in 1851 the GRO introduced a question into the census that asked respondents in trades and manufactures to state their workforce, and farmers to state the laborers in their employ as well as their acreage. This question remained in the census until 1881, when a question redesign removed any enquiry about workforce size and replaced it with a question on “employment status” between employer, employed, and own account (neither employer nor employed). The census household returns between 1851 and 1881 therefore constitute the earliest large-scale and most complete source of information available on individual business workforce size that gives a national coverage.
The GRO conducted a limited analysis on these employer responses in its published census reports. The 1851 Census of Great Britain report tabulated “masters,” and the number of men in their employ, for each of the eleven divisions of England and Wales, and for Scotland for a selection of the main towns combined. Farmers were tabulated at the county level and broken down by farm size occupied measured in acres, and by workforce size employed on the farm. However, the GRO was very critical of the quality of the returns of masters, which were considered imperfect, as not all masters had identified themselves as such, and it was suspected that some of the masters had not returned their employees. As a result, the report concluded that the tables based on the return of workpeople by masters were “tentative, and a mere auxiliary to our inquiry” (1851 census report: lxxviii). The results of the farmers’ returns were likewise viewed with some suspicion; however, as the results were considered “of so much interest on a matter so imperfectly understood,” additional county-level tables were published showing the size of farms and the number of laborers employed on them in each of Great Britain’s counties (1851 census report: lxxviii). Because of this interest in farms, the Census of England and Wales continued tabulating farm size by acreage and laborers for selected counties in 1861 and 1871. By 1881, however, the GRO explicitly abandoned any attempt at publishing tabulations, describing the analysis of the occupations as “the most laborious, the most costly, and, after all, perhaps the least satisfactory part of the Census” (1881 census report, 25). No tables of either the employees of tradespeople or farmers’ laborers were made, and the recording of employees and laborers was abandoned in the design of the 1891 census. Scotland’s census was administered independently from 1861 onwards; while it did not include farm tabulations for 1861 and no further non-farm tables, farms for all counties were tabulated for 1871 and 1881.
The limited published tables until now remained the only source for firm and farm size data available. Historians have used the published tables as the basis of studies on industry (Clapham Citation1938; Rodger Citation1988) and farming. However, the generally negative assessment of these tables has tended to put off subsequent analysts. For example, Clapham (Citation1938, 35) although quoting the main results for 1851 was critical of their value and thought they under-represented the total number of firms. Mills (Citation1999, 58–77) has raised questions about the accuracy of the published tables on farms. However, Shaw-Taylor (Citation2005, 158–191) considered the published data on farms as reliable but with certain caveats, and in Shaw-Taylor (Citation2012) used the 1851 tables as a firm basis to compare with earlier periods, whilst Grigg (Citation1987) used the published tables for 1851 as a sound basis for national comparisons with later data sources. Other usage of these data went back to the original census archival records and hence was restricted to case studies, usually of several parishes or (part of) one county (e.g., Beckett Citation1983; Goose Citation2006; Howkins and Verdon Citation2008). I-CeM data now allow us, for the first time, to extract these data directly from the digital records and undertake both case studies and full national coverage using the individual data.
The 1851 instruction to farmers read:
The term FARMER to be applied only to the occupier of land, who is to be returned – ‘Farmer of [317] Acres, employing [12] labourers;’ the number of acres, and of in or out-door labourers, on March 31st, being in all cases inserted.
The instruction to other employers was:
In TRADES the Master is to be distinguished from the Journeyman and Apprentice, thus – ‘(Carpenter – Master employing [6] men);’ inserting always the number of persons of the trade in his employ on March 31st.
This was widened in 1861 to apply to “TRADES, MANUFACTURES, or other Business,” and remained on the census form in more or less unchanged format until 1881. The responses recorded in the Census Enumerator Books (CEBs), which were passed to The National Archives (TNA), now form the basis of the digital records. These derive from scanning the CEBs and then transcribing them by various commercial genealogy suppliers; for most years by FindMyPast (FMP), and for 1881 by the Genealogical Society of Utah (GSU). I-CeM is based on these transcriptions. The responses to the above instructions are included in the occupational string (OCC) variable, but are not coded into parts. This means that employers and their workforces have to be identified from the mass of all other occupational responses of the entire population of 17–20 million records for each census. An algorithm written as part of a pilot study on the GSU transcriptions of the 1881 England and Wales census extracts those strings that are likely candidates to represent employers based on the presence of the verb “employ,” its abbreviations and synonyms, the presence of keywords representing employee types (“laborer,” “hands,” etc.), and pattern matching of typical phrasing of employee types and numbers. A second algorithm then parsed the extracted strings into separate fields, thus distinguishing the employer descriptor from their reported employees and splitting the workforce into bins for men, women, boys, laborers etc. (Bennett and Newton Citation2015). The results were subject to significant clerical checking and cleaning to remove false positives, wrongly attributed strings, and erroneous parsing and transcriptions. The method was refined and applied to I-CeM data for the 1851 and 1861 England and Wales censuses, and later to the 1851–81 Scotland censuses. While the England and Wales 1871 census is currently unavailable in I-CeM, an additional transcription source was identified, and the same method applied to extract employers from this (Van Lieshout et al. Citation2018). These algorithms treated farmers and non-farmer employers in the same way but used an additional algorithm to identify and parse the statements of farm acres.
Comparing I-CeM to the published data
The 1851 census was the earliest that explicitly sought to differentiate employers from others, and masters from “men.” It was also the only census over 1851–81 to actually publish the results of the census enquiry of all non-farm employers. This provides two valuable elements: first, insight into how GRO interpreted the responses to this census question; and second, a comparator and check of the content of the I-CeM records and the methods of extraction that have been used here for identifying individuals in the original CEBs.
Unfortunately, comparisons with the GRO tables are made difficult because it is unclear precisely how the GRO calculated their employer tables. The tables are titled “Employers (with number of men)” and their header claims that the “Table includes those persons only, who, in the Householders’ Schedules, stated themselves to be Masters, in conformity with an instruction printed on every Schedule” (1851 census report: cclxxvi–cclxxix). The GRO report recognized that many employers of workpeople had not adhered to the “master” part of the instruction even if they returned their workforce as per the second half of the instruction. The master-journeyman-apprentice terminology did not apply to all sectors; in particular professionals, and large-scale employers such as those of factories, did not always call themselves “master.” Nevertheless, most still returned their workforce. Secondly, the tables state they only counted “men.” even though the census instruction mentioned “persons.” While employed women and children were sometimes quoted separately in the tables at census division level, this was only for a few of the branches of trades where women and children were employed in significant numbers. However, the header note also mentioned “the number of hands employed by masters,” and some of the division tables have footnotes for individual large employers, making clear they included employers who returned gender-neutral descriptors such as hands – for instance: “One master employing 398 hands” in division III (1851 census report, 234). It is unclear what happened to the other descriptors of employees such as boys, males, journeymen, apprentice, or any other occupational title. Farmers were more straightforward to understand as they were explicitly tabulated by number of laborers and men in employ. Women and children were explicitly excluded from this count with their number noted separately below each table.
compares the results from the initial I-CeM extractions with the published. In order to eliminate the issues surrounding the criteria to be considered an employer, these figures are based on any employers who returned any type of employee, which explains some of the initial I-CeM overcounts for non-farmer employers. However, the main feature is that some divisions show major discrepancies, with most divisions showing that some data are missing. Overall there is a total deficit of about 23,000 non-farmer and 40,000 farmer employers in I-CeM compared to the GRO report. This number is too large, and clearly not randomly distributed, to be accounted for by transcription or keying errors. Even more worrying the deficits are heavily concentrated in the North-Western (Lancashire and Cheshire) and London divisions, which were the most populated and contain many, if not most, of the major employers in the whole UK. The explanation for these gaps appears to be that the varied sources used by FMP for the 1851 census were working at different levels of transcription. The 1851 transcription for FMP derived from two sources: (i) family history society existing transcriptions, which had been transcribed for genealogy purposes and often stopped transcribing after the main occupation had been captured, leaving out the essential part listing the employee numbers; and (ii) FMP’s own transcriptions. For FMP’s own transcription it appears that there was a combination of deficiencies: some areas were missed entirely, some individuals had truncated lines because they were never fully keyed (in the same way as family history societies), and some data were truncated and lost at some stage in the transfer of databases between IT systems, with the occupation text-string cut off at 100 characters.
Table 1. 1851 published data against the original I-CeM extractions, England and Wales, 1851.
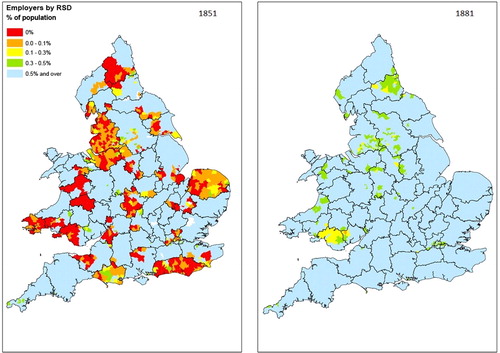
In order to probe the I-CeM deficit further, shows the percentage of employers within the population by Registration Sub-District (RSD) for 1851 and 1881. Analysis of other early census years shows that, overall, employers constituted around 0.8-0.9 per cent of the whole population, and while there were a few areas that genuinely had 0.1 to 0.5 per cent employers, such as south Wales, parts of east London, and parts of the north east, as indicated for 1881 in , these areas were exceptions. Hence, we would expect that in most places employers would make up at least 0.5 per cent of the population and consequently areas such as those indicated for 1851 in as below this level were likely incomplete. It should be noted that, in addition, RSDs are sufficiently large units that the presence of some employers should be expected in all cases, meaning that RSDs with 0 per cent employers were definitely suspect. depicts large areas in the 1851 I-CeM data compared to 1881, where there were no or very few employers and, significantly, the distribution of many of these areas conformed to the county boundaries of Sussex, Norfolk, Radnorshire, Lancashire and Cheshire. This clearly points toward an issue of transcription, particularly since family history societies usually operate with these geographical bounds. Closer checks on the affected areas by inspecting the original CEB records show that in almost all of these cases the occupational strings contained only the occupation of the employer, while the workforce had not been transcribed.
Figure 1. Percentage employers per population by RSD, 1851 and 1881. Source: The Authors.
A similar but different truncation issue was discovered in the 1861 England and Wales I-CeM data, and for all of the 1851–1881 Scottish censuses. In these years, occupational strings had been truncated through the transfer of databases, with all strings cut off at a maximum of 50 characters. Since this truncation was also present on the FMP web interface it must have happened at some point before the transfer to I-CeM. This constitutes a major problem, since employer strings tend to be longer than non-employer strings, and cutting them off at a certain point leaves out all or part of the stated workforce (see Bennett and Newton Citation2015: ).
This analysis shows that I-CeM data are imperfect for any firm size analysis. In the 1851 England and Wales census, over 60,000 from a population of about 240,000 employers are missing; large numbers of employers are missing or have incomplete workforces in England and Wales for 1861, and some are missing from all of the Scottish censuses. In addition, 1871 England and Wales is not contained in I-CeM in its entirety. The BBCE was therefore constructed to supplement I-CeM and addresses each of these issues in order to create a near-complete resource of all British employers between 1851 and 1881.
The British business census of entrepreneurs
The BBCE offers a complete coverage of British entrepreneurship from the census data between 1851 and 1911. For the employers and workforce data, as available from the 1851 to 1881 censuses, it offers an enhanced version of I-CeM, which is fully compatible with the deposited I-CeM, allowing researchers to identify the complete employer records with their employees. The BBCE also contains improved records for 1891-1911 with appropriate weights for non-response and misallocation biases; and it also uses data enrichment to identify company directors within the census. For the focus of this paper, the BBCE database contains additional data not in I-CeM for 53,000 employers in England and Wales in 1851, 28,000 in 1861, and all employers for 1871; and 6,500 additional employers in Scotland covering all years 1851–81.
This supplemental data coverage was achieved in several stages. was used as a starting point for supplementation of 1851 employer data. All areas with no employers were judged as almost certainly truncated, areas with less than 0.1 per cent employers were judged as very likely to have been truncated, and those with 0.1–0.3 per cent employers as possibly truncated. Areas with 0.3–0.5 per cent employers were also candidates for truncations and were checked. Fortunately, as well as FMP, there are a number of other genealogy suppliers that provide transcriptions of the census. One frequently used alternative, Ancestry, did not have full occupation strings either. But the deficit could be mostly remedied by using S&N Genealogy Supplies (S&N). S&N has undertaken an entirely independent transcription of all the censuses derived from the microfilms of the original CEBs and this covers almost all of the deficiencies in FMP and I-CeM. Using our extraction algorithms on their transcribed occupation strings, S&N supplied records for all the areas on the map with possible truncations: the whole of the 14 counties where records were wholly absent or very partial in I-CeM (Carmarthenshire, Cheshire, Derbyshire, Dorset, Glamorgan, Gloucestershire, Lancashire, London, Middlesex, Montgomeryshire, Norfolk, Radnorshire, Sussex, and Warwickshire), and the 87 Registration Districts within 27 other counties that otherwise appeared fairly complete, but where records were wholly absent or very partial at RSD level in I-CeM. These RSDs were within Berkshire, Brecknockshire, Cambridgeshire, Cornwall, Cumberland, Denbighshire, Devon, Durham, Essex, Flintshire, Hampshire, Huntingdonshire, Kent, Leicestershire, Lincolnshire, Merionethshire, Monmouthshire, Northumberland, Oxfordshire, Pembrokeshire, Shropshire, Somerset, Staffordshire, Surrey, Wiltshire, Worcestershire, and Yorkshire. In total, the algorithms identified 75,000 records from the S&N data.
The S&N and I-CeM records were then compared against each other at the individual level, and where gaps were found the S&N records were input to supplement I-CeM. This process was far from simple because the parish and other identifiers in S&N differ from those in I-CeM so a considerable resource had to be deployed to ensure accurate matching. While up to 80 per cent of records could be linked using automated matching, these still had to be checked manually while the remainder had to be clerically matched at an individual level. There were several other complexities. Most records of individuals identified in S&N had counterpart records in I-CeM. However, about 1,570 records in S&N did not have records matching those in I-CeM at all. This was either because of transcriber or other keying errors that prevented the matched individuals being found (about 450 cases), or because of totally omitted parishes, usually in batches (about 1,120 cases). These S&N records with no identifiable I-CeM counterpart were added to the BBCE database manually, coded to the same format as I-CeM, but given additional RecIDs. Conversely, there were some records in I-CeM for areas which otherwise appeared to have deficiencies in employer entries, which did not have a counterpart in S&N. These I-CeM records were retained in the BBCE database. In cases where I-CeM already contained the full string, and the S&N match was a duplicate with slight variance in transcription, the I-CeM transcription has been retained to maintain greater consistency. The result of this infill was an additional 53,000 individual employer records identified that would otherwise be absent or truncated, 30,000 of whom were farmers. This was approximately 25 per cent of the total number of employers identifiable for this year.
The 1861 England and Wales census truncations, as well as all years in Scotland, required manual data entry to complete strings based on the scanned images of the original CEBs, which required significant resource. I-CeM was checked to identify all potentially truncated strings based on length of string over 50 characters, string ending in “###” (which was a key indicator of truncation during data transfer) or the presence of “…” in the string (which was the main indicator that parts were not transcribed). There were about 35,000 truncated strings identified by these methods for which manual corrections were added, of which 28,000 were employers. This was about 20 per cent of the employer records for this year. This method should ensure that the target for as complete coverage of the census records as possible is achieved, despite the truncation problem in I-CeM. A similar exercise was conducted for Scotland, where the 1851 strings were truncated at 100 characters, the 1861 and 1871 strings at 60 characters, and the 1881 string at 80 characters. All strings that ended at these truncation numbers or the truncation number -1 (to account for spaces) were manually checked against the CEB images, completing almost 8,000 strings, of which 84 per cent were employers.
For 1871 for England and Wales there were no usable occupation strings available in I-CeM as they were never transcribed by FMP. For this year the extraction algorithm was applied directly to the S&N data and then cleaned and parsed in the same way as the 1851 data. Over 300,000 records were derived by these searches, which was then parsed and cleaned, resulting in a final data set of almost 140,000 employers. This provided coverage of employers for 1871 in the same way as for the other England and Wales censuses 1851–81.
BBCE compared with the published tables
Having thus supplemented I-CeM, the BBCE extractions can again be compared against the published records, which should give a better test of how far the available digital records replicate the GRO tabulations. In the following analysis, efforts have been made to replicate the GRO’s coding methods as closely as possible. As previously mentioned, there is considerable ambiguity about who were counted as employers in the non-farmer tables: whether they only counted employers explicitly called “master,” as they claim to be doing in the header to the tables, or whether they included other non-farmer employers as well, as they seem to have done based on the footnotes to the table. The comparisons below present several possibilities. The farmer employer tables were more explicit: the title of these tables reads “Farmers, with the Number of Labourers employed, and of Acres occupied,” while in the table itself the columns are labeled: “Number of Labourers (Men) employed by each of the under-mentioned number of Farmers.”Footnote 1 Each table then lists the number of women and children also employed on the farms, who were not included in the tabulation. The only exception is the 1881 tabulations for Scotland, where employees were broken down by age and gender (men, women, boys and girls). It seems clear therefore, that what the GRO intended to measure in most years was the number of male laborers.
The following analysis therefore compares GRO tables with farmers in the BBCE who declared men and/or laborers, with the farm size determined by the total of these two groups. If a farmer also declared women, boys, girls or any other employee, these were not included in the GRO total. For example, a farmer declaring his workforce as two men and one boy would be counted as having two employees. There were very few farmers who only employed women and children, with the vast majority returning women or children in addition to men or laborers. However, we show that counting only the men and laborers means that the farm size used in the GRO analysis gives smaller workforces than those actually returned by the farmers.
The type of employee returned also depended heavily on the phrasing of the question and varied by year. As previously mentioned, in 1851 farmers were asked “to be returned—“Farmer of [317] acres, employing [12] labourers”; the number of acres, and of in and out-door labourers, on March 31st, being in all cases inserted.” In response, 80 per cent of farmers returned their workforce as laborers. In 1861 however, the instruction asked for “men and boys employed on the farm” to be inserted, with the example reading “Farmer of 317 acres, employing 8 labourers and 3 boys.” This changed how farmers responded: 36 per cent still listed laborers, but almost 60 per cent of farmers returned men, with a similar percentage returning boys, and only 2 per cent mentioning women (as clear from the example, farmers could return several categories). The 1871 and 1881 England and Wales census instruction asked for the number of “men, women, and boys,” while the example remained the same as it had been in 1861. The percentage of farmers returning laborers dropped even further to 30 per cent, while the proportion of farmers returning women more than doubled in response to these instructions. Finally, the 1881 Scottish census asked the same question as in England and Wales, but as example listed “Farmer of 317 acres (of which 105 arable), employing 6 men, 2 girls, and 3 boys,” thus completely dropping the term “laborer” from the instructions. The effect was dramatic: only 45 farmers, representing less than 1 per cent of the Scottish farmers that year, returned any laborers, with all of their responses were phrased as men, women, boys, or girls. In the previous two census years, when the question was the same as asked in England and Wales, over 40 per cent of farmers had mentioned laborers in their returns.
These variations have two important implications: firstly, they mean it is difficult to use the disaggregated workforces as a guide for analysis on changing patterns of employment. Rather than reflecting real workforce mixes, the farmers were responding to the questions they were asked. Many did not list female employees unless prompted to do so, and even then, many responded following the examples they were given. Second, we cannot compare just the number of laborers in the BBCE to the published data, as it seems clear that, post-1851, a quickly diminishing number of farmers used that term to respond to the census, reporting men instead and it seems the GRO realized this by equating men and laborers. Taking account of these differences, the following analysis compares, year by year, the BBCE workforces to those in the published GRO reports.
1851
shows the BBCE extracted non-farm employers against the published in four ways. The first measure only includes employers explicitly called “masters” who employed “men”: the criteria claimed in the table header. It is clear that this measure is nowhere near the published figures; the extractions only picked up between 15 to 50 per cent of the published numbers, and almost none at all in the larger firm categories, which were often textile, steel or engineering businesses that did not follow the master-apprentice system. Comparing the large employers individually mentioned in the division tables’ footnotes to those extracted from the BBCE, indicates that “master” was not the sole criteria used as the only matches between these groups with sufficient certainty were occupational strings without the word “master.”
Figure 2. Different ways of tabulating the non-farmer employers, BBCE against published, 1851.
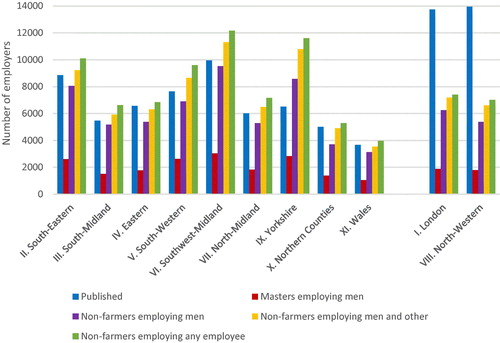
Including all non-farmer employers, not just masters, seems a more likely method used by the GRO. The figure does this by comparing three different measures of workforce: the first includes only those employers who reported men. However, as we have already seen, the GRO included employers with “hands” and thus did not strictly adhere to the “men” qualifier either. Large employers in particular tended to return their workforce in terms of “hands,” “workpeople” or a composite “men, women and children.” The second measure includes all employees that were not tabulated separately by the GRO; i.e., it excludes all those not listed as employing only women or children. This excludes those only reporting laborers (which was rare for non-farmers), women, or children (including boys and girls), for which a separate table was published. It includes employers who reported men, hands, any occupational descriptor such as porter or carrier, or any contraction of different categories that could not be split using our algorithm (e.g., “100 men, women, and children”), which would have applied to the GRO as well. This latter category is similar to “hands” in that it mainly occurred in the larger firms. The final measure depicted in includes employers of any type of employee, which was the same measure as used in .
As shows, the majority of non-farmer employers employed men (even if they also employed other categories) but the total derived from counting only men falls short of the published in almost all divisions. Adding those who also employed others (other than solely women and children) brings the total up to more than the published, while those employing anyone adds a small additional number of employees who only employed women and/or children. Since these were tabulated separately, it seems unlikely that they were included in the rest of the GRO table, and that the calculation of employers returning men and other, but not just women and/or children, is the most likely candidate to reflect what the GRO tabulated. However, although the key conclusion to draw is that the GRO tables come closest to a definition based on employers returning men and other excluding those employing solely women and/or children, the match with I-CeM suggests that the count by the GRO was somewhat deficient in some divisions: the SE, SW, SW Midland, and especially Yorkshire. Hence in nine of the 11 divisions it appears that the BBCE extractions are often superior to the GRO clerical extractions. Indeed it is not surprising that GRO clerks missed some employer returns: they are often very small entries crammed into the inadequate space provided, overflowing into other parts of the CEB sheets (which results in split lines); and it would be very easy for a GRO clerk who was turning many pages of the CEBs to miss rare entries where an employer appeared in a mass of workers where no other employers occurred.
On the other hand, the two divisions on the right-hand side of the figure for London and the North Western Division (Lancashire and Cheshire) indicate remaining deficiencies in both the I-CeM and BBCE data, as these extractions are low against the published irrespective of what measures are calculated. We return to these divisions later below.
The GRO also tabled employer responses by firm size. compares the BBCE data against the published by firm size for all divisions, and on the right with all divisions except London and the North West which still have data deficiencies in the BBCE. The table shows that, in the divisions where data are complete, the BBCE picks up 12.6 per cent more employers than listed in the GRO. However, this is unevenly distributed. The smallest firm sizes of 1, 2 or 3 employees are only between 5 and 10 per cent above the published numbers, while the larger firms have more substantial proportions, with the very largest firms being more than twice as numerous as those indicated by GRO. The largest firms have all been checked against the CEBs as part of the clerical cleaning process and represent genuine firms missed by the compilers of the GRO tables. While they were more likely to report their workforce either as hands or as a contraction that could not be broken down, it seems clear from the published tables footnotes that this did not prohibit firms to be included in the published tables. The omissions by GRO clerks in these cases are likely to have arisen from the complexity of the CEB entries and the difficult of reading them at the speed required by the GRO managers of the clerical process.
Table 2. Comparing non-farmer employers to the published by firm size, England and Wales, 1851.
For Scotland, the GRO created one table combining non-farmer employers in the main towns (called burghs in Scotland): Aberdeen, Dundee, Edinburgh, Glasgow, Greenock, Inverness, Leith, Paisley, and Perth. These cannot be disaggregated into the individual towns, and any non-farm employer outside these burghs have not been included. However, while all table titles are the same as for the English and Welsh counties, the explanatory note with the Scotland table specifies that it referred to “Masters and Employers of workpeople” (1851 census report, 1022), implying that this tabulation was definitely not restricted to masters only and included everyone who had responded to that census instruction and all types of workers. Again, the footnotes to the table mention “hands” and “persons.” The data presented in includes all non-farmer employers in the listed towns by firm size. It should be noted that some parishes were incomplete in I-CeM, with over 40 per cent of one Glasgow parish (St David) missing, as well as 28 per cent of Aberdeen West. Conversely, there are some population overcounts in Edinburgh.Footnote 2 Overall, however, the total population of these towns was within 1 per cent of the published. Since this table made clear it did not just include masters, this measure has been omitted, all other measures are as in . Taking employers of men and other as the most likely measure, the BBCE data look robust for the Scottish burghs, although a few firms are missing in the 75–100 and 300–350 categories, as well as some employers of small firms with fewer than 10 employees.
Table 3. Comparing non-farmer employers to the published by firm size, selected Scottish towns (burghs), 1851.
A similar breakdown to that provided in and can be made for farmers, as shown in and for England and Wales and Scotland, respectively. The GRO tables were based on any farmers, not just farmers as their first or main occupation, meaning that they included farmers who farmed alongside other activities. In addition, the footnotes to the Scottish occupation tables state that crofters who returned acres and/or employees were included with farmers in these tables as well. The following analysis follows these instructions as far as possible: first, as discussed above, only farmers who reported laborers and/or men were included; second, farmers who farmed as a secondary occupation were included in the count; and third, the Scottish table includes crofters who returned laborers or men.
Table 4. Comparing farmer employers to the published by farm size, England and Wales, 1851.
Table 5. Comparing farmer (and crofter) employers to the published by farm size, Scotland, 1851.
A larger proportion of small farms seem to be missing from the BBCE data even when excluding the problematic divisions (of which London included relatively few farmers). However, even though the England and Wales totals show deficiencies across all farm sizes up to 60 laborers, and the Scottish totals for all up to 15 laborers, the largest size classes again show a substantially higher number of larger farm employers than the published tables. That these were again genuine farmers was confirmed by checks against the CEBs for the largest employers. For example, the 1851 published tables listed 2 farmers of over 60 laborers in Lincolnshire, with a footnote indicating each of them employed 60 laborers (1851 census report, 597). These can be readily identified in the BBCE and are unambiguously included: both reported their occupation as the formulaic “farmer of x acres employing 60 laborers.” However, there was another farmer in Lincolnshire who employed 72 laborers on 1626 acres, who was missed by the GRO clerks.
1861 and 1871
In 1861 the GRO only tabulated farmers for a group of 10 English counties: Buckinghamshire, Cambridgeshire, Cheshire, Cumberland, Lincolnshire, Norfolk, Shropshire, Sussex, Wiltshire, and the North Riding of Yorkshire. No Welsh county was included, and Scotland, which conducted its own census that year, did not tabulate anything. It is known that 3.7 per cent of individuals for 1861 England and Wales CEBs were lost after tabulation and publication of the GRO reports, and are therefore missing from FMP, I-CeM and the BBCE. Comparisons of I-CeM with published data (forthcoming) show that none of the 10 counties GRO tabulated was badly affected by data loss. The GRO followed the same criteria for inclusion of farmers as they did in 1851, which have been followed in the BBCE extraction used here as well. The totals for 1861 are shown in and show missing farmers across all sizes. Of the counties, Cumberland and Yorkshire were particularly affected by missing data.
Table 6. Comparing farmer employers to the published by farm size, 10 selected English counties, 1861.
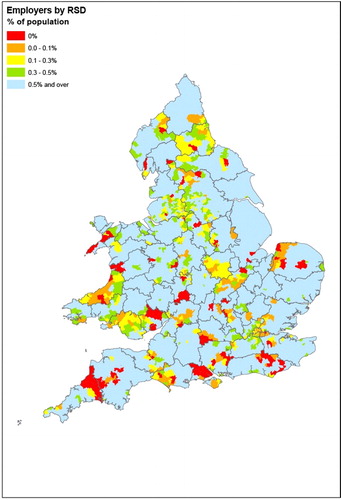
The 1871 England and Wales BBCE data were derived solely from S&N. Comparison of coverage between censuses shows that the extracted number of employers who reported employees was lower than expected if 1871 had the same proportions as in 1851–61 and 1881: while the overall percentage of employers in the total population for the other census years was 0.8-0.9 per cent, they constituted only 0.61 per cent in the 1871 data. Hence, based on expectations in line with 1861 and 1881, the 1871 extracted employers appear to have around 20 per cent under-estimates. However, this discrepancy was not evenly distributed. In 112 RSDs there were no employers at all, and another 116 RSDs had an employer entrepreneurship rate of less than 0.05 per cent, as shown in . Just as for the pre-BBCE I-CeM data for 1851 shown in , all of the areas with 0 or less than 0.1 per cent employers and most of the areas with 0.1 to 0.5 per cent employers are likely to be deficient in coverage of employers, due to transcription gaps in the S&N data that cannot be remedied. However, in at least 11 counties there is complete or nearly complete coverage judged by equaling or exceeding 0.5 per cent, and a check on these counties shows they are mainly in line with the expected numbers of employers based on 1861 and 1881. A further 9-10 counties have near complete coverage of rural areas but a few deficiencies in some of the urban centers; these give reliable estimates for farmers but are less reliable for non-farmers. The least reliable are Caernarvon, Cardigan, Cornwall, Cumberland, Durham, Glamorgan, Hampshire, Leicester, Monmouth, Norfolk, Northamptonshire, Sussex, and parts of Lancashire and the West Riding of Yorkshire.
Figure 3. Employer rate by RSD in 1871; used to indicate possible gaps in transcription coverage; RSDs below 0.5 indicate possible omissions. Source: The Authors.
As in 1861, the GRO tabulated a limited analysis of farmers for a group of 17 “representative” counties in England in 1871. However, unfortunately only 4 of these overlapped with the counties chosen in 1861. The counties for 1871 were: Surrey (Extra-Metropolitan), Kent (Extra-Metropolitan), Sussex, Hampshire, Berkshire, Essex, Suffolk, Norfolk, Leicestershire, Rutland, Lincolnshire, Nottinghamshire, Derbyshire, Durham, Northumberland, Cumberland, and Westmorland. It should be noted that while some of these are amongst the better-transcribed counties when it comes to employers, such as Lincolnshire and Suffolk, there are also some of the poorer ones, such as Durham, Hampshire and Leicestershire.
As with the 1851 farm data, the breakdown by size between the published and the extracted farms, as presented in , shows the BBCE has a higher proportion of missing small farms, but a larger number of the largest size groups. While the total underestimate of farmer employers was 26 per cent, small farms with fewer than 10 employees are up to 31 per cent lower, while the larger farms have greater numbers than the GRO reported, even though this table includes poorly transcribed areas. However, the 1871 published report calculated that of the farmers who employed one or more laborers, the average number of employees was less than 6 (1871 census report, xlviii). The average number of employees in the extracted data is 5.9, an indication that the skew noted in these tables does not affect overall trends by very much.
Table 7. Comparing farmer employers to the published by farm size, 17 “representative” English counties, 1871.
1881
The England and Wales GRO made no tabulations at all for 1881, which is unfortunate as for this year FMP uses the GSU transcriptions, which are considered to be of good quality. However, the Scottish GRO made quite extensive tabulations for farmers in 1881, which are shown in . While there was no explicit mention of crofters for this year, they seem to have been included since if they are omitted there are substantial missing farms in the crofting divisions compared to the published, particularly for the smallest farms by acreage, while including them brings these in line with the published for the rest of the country.
The totals for 1881 were provided by the gender of the declared workforce. The report stated that the farmers returned “adult male labourers,” as well as boys, women, and girls who were engaged in agricultural work. This suggests that “man” is equivalent to adult male laborer (1881 Scottish census report: xxix). However, these cannot be added to provide a total workforce, as many of the farmers who employed girls would also employ men, so this would double count most farms. There were only 95 farms that employed women, boys or girls but no men (1881 Scottish census report: xxix). shows that the data best compares to the published for boys and girls, and worst for women, but overall the extractions are far closer to the totals than any of the other censuses.
Table 8. Workforce size by Men, Boys, Women and Girls, Published compared against BBCE, Scotland 1881.
Since most farms employed men in their workforce, a more detailed breakdown is best presented for men only. shows the percentage of missing men by division; the percentages missing for women, boys and girls generally track the men’s trends, although the data for women are always slightly lower. Combining and shows that while around 10 per cent of the small workforces are missing, the large farm extractions track the published totals quite well in 1881. Furthermore, the missing small farms are geographically concentrated: divisions IV, VII, and to a lesser extent division I, are very close to the published tables. Larger numbers of employer-farmers are missing in the North Western division, are equally divided between Ross & Cromarty and Inverness; the West-Midland, where the missing farms are in Argyll with the other counties close to the totals; and the South West, where Lanark contributes most of the missing employers. Again, Scotland shows the same pattern of higher I-CeM responses than the published for large farms.
Table 9. Comparison of farm employers to the published by farm size for men only, all divisions, Scotland 1881.
Discussion
A major contribution of this paper has been to compare the published tables from GRO in order to assess how far the extractions from the electronic versions of the 1851–81 censuses give reliable estimates of the population of employers and their workforce size. The assessment also informs us better about the methods used and reliability of the GRO process for collecting the data and producing the published.
As identified in the 1851, 1871 and 1881 data, the BBCE includes a larger number of the larger firms and farms than the published census. To assess the origin of the smaller coverage of the larger enterprises in the published tables a further analysis was undertaken for the 1871 census by making additional checks on the largest firms. On top of the usual cleaning process that has been used to prepare the BBCE data which involves CEB checks on farms with over 70 employees, for the 1871 data some further CEB checks were performed on the largest farms in order to test whether these were transcription errors or reflect undercounts by the GRO’s clerks. The additional checks involved inspection of the CEBs for all farmers with over 50 employees in the representative counties. It identified several aspects of the issue of GRO undercounts.
Firstly, a small number of discrepancies arise from how the BBCE was constructed, particularly in relation to multiple occupations. When an employer provided two occupations, the BBCE has assumed the majority of the workers belonged to the first named or major enterprise. In contrast coding for census publications usually gave precedence to farming over other occupations.Footnote 3 The I-CeM coding algorithm looked for farmers first, coded them, and for these people did not consider any other occupations further (Schürer, Penkova, and Shi Citation2015). This followed the GRO coding of multiple occupations where, as noted earlier, tabulations of farming always took precedence, regardless of it being mentioned first or last. In the BBCE the most appropriate coding was made for analyzing business proprietors. This focuses on the purposes of subsequent analysis where the primary business activity should be as correctly identified as possible. Where there was no way of reliably splitting the types of reported workforces the first was coded as the main, in line with the census instructions, but not in line with how GRO coded the question for publication. For example, in 1851 the instructions read “A person following MORE THAN ONE DISTINCT TRADE may insert his occupations in the order of their importance”; with similar instructions were used in the other years. As a result of the GRO publication coding, they included employers among the farmers who were farming as their second occupation, while the majority of their employees were active in another business. This accounts for only a small number of the higher counts in the BBCE than GRO (using a restriction to employers of men and laborers, since most of the largest employers will use a composite or gender-neutral descriptor of their workforce). However, there were some ambiguities in the remaining farmers who had an additional occupation where some of the workforce may have belonged mainly to the other occupation; hence, the GRO must have applied an (unrecorded) method for separating some of these workforces.
Secondly, as already shown for 1851, the GRO missed some individual farmers in 1871. In Lincolnshire, one of the better transcribed counties for 1871, the GRO recorded three farmers with over 50 laborers. The BBCE contains six farmers in this category. This was a pattern that repeated across the counties, with the GRO regularly missing some large farms, even if they had responded to the census exactly as the instruction requested, namely as farmers of “x acres employing y laborers.” More interestingly, however, was the decision of the GRO to only include the count of laborers and men to calculate farm size. In Berkshire for instance, the GRO recorded only one farmer of over 50 laborers. Berkshire has poorer transcriptions for this year, but as well as one such farmer with 59 men, the BBCE includes a second farmer employing 59 “persons,” as well as 6 additional farms that would have been pushed into the over 50 employees category if we count the women and boys returned by the farmer as well. In fact, even the farmer with the 59 men also returned 6 women and 23 boys. In the GRO’s analysis these farms would have been counted as smaller farms. Manual CEB checks further down the farm size range are infeasible due to the numbers involved. However, these examples for larger farms demonstrate that either the BBCE extraction possibly misses out many small farms, and/or that the GRO misallocated some of the missing large farms in BBCE as smaller farms, thus making up some of the difference. The method used by GRO appears to be an unreliable way to measure farm workforce from the census responses received. The BBCE data should give researchers a better coverage of the real information the census contains; it also allows a decision to be made by the researcher on whether to include women, boys or girls with men, codes portfolios of businesses separately, and allows assessment of the consequence of taking different definitions.
Finally, there is some ambiguity about the inclusion of family labor, with the 1851 report stating that to obtain the total number of persons who are employed on the farm “frequently the farmer’s sons at home” should be added (1851 census report: lxxviii). An attempt was made to assess the effect of including farmers with sons who were agricultural laborers in the smallest farm size employee categories. This was inconclusive. Full inclusion of all sons results in over-estimating the 1-3 employee categories compared to the GRO, but still falls short of the GRO’s numbers in the mid- and larger-farm size categories. Despite this discrepancy it seems most probable that GRO did include some farmer’s sons, but that their effort was imperfect in the same way that they missed some large farmers and other employers. Hence, researchers using the BBCE data should be aware of this distinction and can now choose to include farmer’s sons or not depending on the purpose of their analysis.
This leads to three main conclusions on the GRO published tables for the years 1851–81. First, the GRO tabulations of the CEB data contain errors and omissions which have not been previously identified. There was a tendency for clerks to miss a substantial proportion of the (smaller number of) larger farms and non-farm firms that exist in the CEBs. Second, GRO usually had a higher count of the smaller farms and firms; some of these will be misallocated larger firms; some reflect GRO definitions of counting everyone who mentioned farmer even if their main occupation was something else; and some probably reflect an attempt to include farmer’s sons in the farm workforce counts. In addition, some of the undercount in I-CeM and BBCE will reflect deficiencies in transcriptions and/or ability to identify through extractions. Finally, however, it is difficult to be sure exactly what the GRO tables actually included as the definitions used in the instructions and the way the tables claim to cover the data differ. It is likely that the clerks, when confronted with the complexity and scale of the tabulation challenge with these data (which is by far the most complex census question of the period), were not fully consistent nor able to fully distinguish all the different elements of the question. This results in discrepancies of the published tables from what they claim to cover, and from the data themselves.
On a more positive note, comparisons of the well-transcribed 1881 data with that for 1851-71 show very comparable coverage by firm size, with the same relatively low counts for small firms and strong coverage of larger firms (see Bennett et al. Citation2019: chapter 5). Similarly, the averages of the laborers/men employed on a farm match well between the published records and the BBCE extractions. A detailed comparison of the frequency distribution by firm size also shows that the same mathematical curves fit closely to all the years—although 1871 is far weaker as expected from the remaining truncation deficiencies in S&N that cannot be overcome (Montebruno et al. Citation2019b). Their characteristic is a “heavy tail” for the larger firm sizes, and this specific feature is reproduced by the same mathematical functions for each year. This gives strong confirmation that the main parts of the firm-size distribution are captured by the electronic records and extraction methods used.
Despite the remaining deficiencies in the data, the BBCE presents a preferable resource over both I-CeM and the published tables for the study of business history for identifying and researching employers, and their declared workforces in particular. Apart from England and Wales in 1871, which currently does not exist in I-CeM, the BBCE is fully integrated with I-CeM allowing for the study of businesses within households, using demographic variables, and location. In addition, the BBCE data coding allows researchers to differentiate parts of business portfolios, and includes all employees declared, or selected in various employee categories, including 1871, and is not constrained by the male workforce as tabulated by the GRO.
Implications and significance
As well as evaluating the published analysis of the 1851–81 census data by GRO and how the extractions compare, the new data can also be used to show how we should begin to revise some interpretations of developments of the period, as well as confirming others. The BBCE shows that the vast majority of firms during the nineteenth century were micro-businesses, with over 60 per cent of firms employing fewer than five employees. Large businesses, often the focus of business historians, were rare, with fewer than 200 firms having 500 or more employees in 1851, accounting for 0.1 per cent of total firms. However, both medium and large businesses were on the increase over 1851–81, both in absolute numbers and as a proportion of total firms (Bennett et al. Citation2019, 113-4). The BBCE data also show the variety of business sizes between different sectors, as well as how organizational changes in the economy affected them in different ways. For instance, food sales and refreshment firms were particularly characterized by micro-businesses as, during a time were refrigeration was rare, businesses such as butchers and milk sellers remained localized, and thus small and numerous. In other sectors some consolidation was starting to occur. Footwear and apparel trades, while remaining predominantly small scale, were increasingly using larger workshops and seeing the introduction of mechanization. Most business consolidation, however, took place in manufacturing, mining, and finance, which were sectors that became increasingly mechanized and required large capital investments to achieve low costs through economies of scale and scope, as recognized in case studies by Clapham (Citation1938), Pollard (Citation1965) and Chandler (1962, 1990) and others. The new data show the extent of this development, its relatively slow progress by 1881, the strong sectoral distinctions between different industries, and for the first time allow full comparisons across all sectors.
The BBCE also allows an analysis of gender, thus contributing to an increasing understanding of female entrepreneurship patterns in the nineteenth century (see e.g., Kay Citation2009; Aston Citation2016; Van Lieshout et al. Citation2019). The BBCE also shows that, despite previous well-known criticisms of the census as a source for identifying women’s business activities (see e.g., Higgs Citation1987; Anderson Citation1999), use of the CEBs overcomes that most of the deficiencies that derive for the editing of the data by GRO in publications; the original census responses provide much more complete coverage. The BBCE indicates that there were many more female proprietors than previous estimates, although most were own account who employed no-one else. The individual data also show a wider participation of women in larger firms than previously understood, although larger firms were much more likely to have male proprietors. Since the BBCE includes the gender breakdown of the reported workforces, future research can also assess the sectoral analyses of workforces by gender.
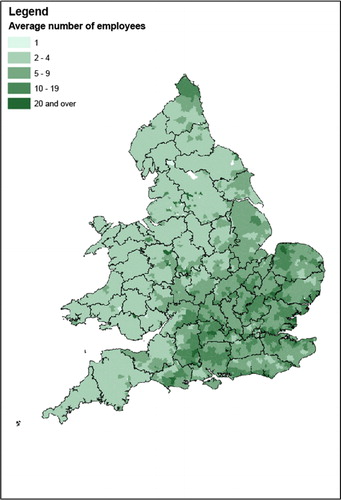
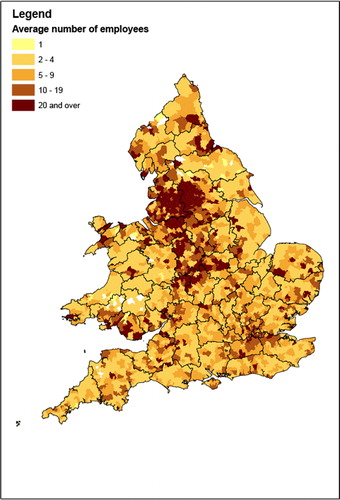
In addition, the average size of farms and other businesses can be mapped to show regional variation at a much more fine-grained level than possible before. The average size of farms depicted in at the RSD level, shows a more detailed picture than any previous analysis. It shows a pattern of small-sized farms concentrated in Wales, the Pennines, the South West and remote rural areas, while larger farms were mainly toward urban fringes, and the better land of Southern England, to the South and East of a line from the Humber to the Severn, and in East Yorkshire and Northumberland (Bennett et al. Citation2019, 118). These patterns can also be related to land quality, the type of agriculture, proximity to urban markets and the presence of large-scale estates explain the geographical differences, as shown by Montebruno et al. (Citation2019a).
Figure 4. Farms: average workforce size, 1881. Source: The Authors.
The non-farm employers mapped in show a pattern that reflects the relative concentration of the large-firm sectors. While some sectors were rather widely distributed, many sectors with the largest firms were highly concentrated in some parts of the country. This has been previously understood to be mainly in textiles, iron and steel, coal mining, and shipbuilding (Clapham Citation1938; Rodger Citation1988). Now it is clear that large firms were more generally characteristic of the main urban areas, the ports, and London, as well as the better recognized industrial centers in the north and Midlands. The places with smallest average firm sizes were upland Wales, the Pennines and South West, and remoter rural areas such as Lincolnshire and North Yorkshire. Most of the country, however, was characterized by small and medium firms of less than 10 employees in retailing, the professions, and small-scale manufacturing or maker-dealer industries. This typified the main rural and small town communities across most of England which were accessible to, but not part of, the major urban centers (Bennett et al. Citation2019, 118). The new data therefore show a much more widespread and more geographically diversified development for the period which begins to rebalance the previous emphasis on the major manufacturing centers toward a more complete understanding of Britain as a whole.
Figure 5. Non-farm businesses: average firm size, 1881. Source: The Authors.
Conclusion
This paper has assessed the quality of the data that can now be used to understand the business development of Britain 1851–81. The absence of firm-size data in the past has meant that there was virtually nothing known at a population level on the material we now present. This paper has demonstrated that the new data is generally reliable and provides a firm basis for other researcher s to use in the future. The overall level of coverage in the digital records of the census in I-CeM, supplemented in BBCE, is good compared to the GRO published tables, and superior to the published tables for the larger firms and farms. The numbers of business proprietors identified in the BBCE and the published tables generally match well (once lost data and transcription omissions and truncations are taken into account). This should give confidence that the electronic records capture what the census actually recorded. This should also allow research to be developed for comparison with other countries. The US Census of Manufacturers is one obvious comparator, though this is limited to manufacturing. The results in and suggest a larger number of major firms at an earlier date than in the USA. This is contrary to much previous literature which has suggested the US as ahead in business concentration (e.g., Chandler Citation1962, Citation1990; cf. Hannah Citation2014), and provides an opening for more detailed analysis of the US and British data on a detailed sub-sector matched basis.
Despite the potential of the data, it is clear that for all years there are gaps in transcriptions, despite the substantial efforts made in BBCE to infill identified gaps which means that analysis much proceed with care. We have sought in this paper to identify these limitations as a guide for future research. The gaps mainly arise from truncation of lines by transcribers or in transfer of electronic files at FMP, so that crucial information on employee numbers was sometimes omitted; in other cases, there was total omission of some individuals’ occupation strings. Some of the transcription omission is a random loss where individual transcribers, who were otherwise thorough, missed odd entries. The error rate may be higher for the largest employers that often have very long and complex strings. However, unfortunately, the biggest gaps occur in nonrandom large geographical blocks, because transcription was usually undertaken in batches of CEBs.
Because the electronic versions of the census now available have been assembled from different sources by different transcription processes the quality of coverage varies by census year. This needs to be taken into account in any subsequent analysis using I-CeM and the BBCE. For 1851, most of the I-CeM deficiencies (53,000 out of 63,000) have been infilled from S&N data, which has overcome most gaps. Total coverage is still incomplete, with London and the North West falling short of published figures even after topping up from S&N. Other areas can probably be treated as having no omissions, or small random omissions. For the 1861 census there is a general limitation that 3.7 per cent of the CEB records have not survived and hence cannot be included in I-CeM or the BBCE. These have concentrations in Wales, small parts of London, and a scatter of isolated locations across the country. For the surviving records for 1861, efforts have been made to infill the I-CeM truncations, with 28,000 employers added. However, comparisons with the published imply that some discrepancies remain in some counties. The 1871 census has the poorest transcriptions. However, at least eleven counties in England and Wales have complete or nearly complete coverage, and a further 9-10 counties have good coverage of rural areas with deficiencies mainly in a few urban centers. In addition, this is the only available geocoded, occupation-coded, and parsed data source available on British employers for this year. The 1881 census should give the fullest and most accurate records of all the censuses 1851–81, as evidenced by the Scottish comparisons and the coverage level depicted in . Hence, it should provide the best benchmark for what constitutes full coverage. This is because the transcription was undertaken by the GSU by individuals with a commitment and interest in the accuracy of records for genealogy, that is not reflected by the commercial transcribers used by FMP or S&N.
The central conclusion of this paper is, therefore, that although there are deficiencies of the transcriptions and extractions possible from the digital records of the censuses 1851–81, the BBCE data supplement I-CeM to a level where most difficulties have been overcome. In addition, it provides data at an individual level for which previously no published sources were available. In addition, the BBCE extractions are less ambiguous in definitions and in many cases more complete than achieved by the GRO published tables, especially for large firms.
Business historians, or anyone interested in non-farm and farm employees or firm size data, will find the BBCE a preferable source over the unmodified version of I-CeM. To facilitate users, the data deposit of BBCE is fully integrated with I-CeM and can be linked via the unique RecID attached to each individual in both digital records. This means that a researcher can use either the raw I-CeM data, or various forms of the supplementation and coding included specifically for employers in the BBCE. Although not discussed here, the data for farmers on their acreage occupied was also extracted and is contained in the BBCE (see Montebruno et al. Citation2019a). As a result, the BBCE also provides a new resource for studies of intensity of farm production in different locations. The BBCE data expands our understanding of what the mid-nineteenth century business landscape looked like, in terms of firm size, sector, gender and location. It confirms some previous work on nineteenth-century Britain, but adds better understanding of the differences between sectors, the predominance of small firms for both men and women, and the resilience of farm businesses in the context of declining agricultural workforces.
Acknowledgements
The RSD files use parish boundary files derive from A.E.M. Satchell, P.M.K. Kitson, G.H. Newton, L. Shaw-Taylor and E.A. Wrigley (2016) 1851 England and Wales census parishes, townships and places. This is an enhanced version of N. Burton, J. Westwood and P. Carter (2004) GIS of the ancient parishes of England and Wales, 1500-1850, Colchester, Essex: UK Data Archive (May 2004), SN 4828, which is a GIS version of R.J.P. Kain and R.R. Oliver, R.R. (2001) Historic parishes of England and Wales: An electronic map of boundaries before 1850 with a gazetteer and metadata, Colchester, Essex: UK Data Archive, SN 4348.
Additional information
Funding
Notes
1 In Scotland 1871 the column title is just ‘Number of Men Employed on each Size of Farm’, with no mention of labourers.
2 I-CeM v1 contained misallocations of batches of individuals to incorrect parishes. While many of these have been fixed for England and Wales at RSD level in the version of I-CeM used by the authors (Schürer et al. Citation2016), it is currently unclear how many of these misallocations occurred in the Scottish data.
3 See e.g. TNA, RG27/5, ‘Instructions to clerks employed in classifying occupations and ages of the people’, 1881: 3.
References
Parliamentary papers
- Census Report: Population Tables II . PP 1852-3 LXXXVIII (1691-I).
- Census Report . PP 1863 LIII (3221).
- Census Report . PP 1873 LXXI Part II ( 872 - I ).
- Census Report . PP 1883 LXXX (c. 3797).
Secondary literature
- Anderson, M. 1988. Households, families and individuals: Some preliminary results from the national sample from the 1851 Census of Great Britain. Continuity and Change 3 (3):421–38. doi: 10.1017/S0268416000004306.
- Anderson, M. 1999. What can the mid-victorian censuses tell us about variations in married women’s employment?. Local Population Studies 62:9–30.
- Anderson, M. , B. Collins , and C. Scott . 1979. National Sample from the 1851 Census of Great Britain. [data collection], UK Data Service. doi: 10.1017/S0963926800002522.
- Aston, J. 2016. Female Entrepreneurship in Nineteenth-Century England, Engagement in the Urban Economy . Basingstoke: Palgrave Macmillan
- Atack, J. 1986. Firm size and industrial structure in the United States during the nineteenth century. The Journal of Economic History 46 (2):463–75. doi: 10.1017/S002205070004626X.
- Atack, J. , and F. Bateman . 1999. Nineteenth-century U.S. industrial development through the eyes of the census of manufactures a new resource for historical research. Historical Methods: A Journal of Quantitative and Interdisciplinary History 32 (4):177–88. doi: 10.1080/01615449909598939.
- Atkinson, P. , B. Francis , I. Gregory , and C. Porter . 2017. Patterns of infant mortality in rural England, 1850–1910. The Economic History Review 70 (4):1268–90. doi: 10.1111/ehr.12488.
- Beckett, J.V. 1983. The debate over farm sizes in eighteenth and nineteenth-century England. Agricultural History 57:308–25.
- Bennett, R.J. 2016. Interpreting business partnerships in late Victorian Britain. The Economic History Review 69 (4):1199–227. doi: 10.1111/ehr.12327.
- Bennett, R. J. , and G. Newton . 2015. Employers and the 1881 population census of England and Wales. Local Population Studies 94:29–49.
- Bennett, R.J. , H. Smith , and P. Montebruno . 2018. The population of non-corporate business proprietors in England and Wales 1891–1911. Business History :1–35. early online access: doi: 10.1080/00076791.2018.1534959.
- Bennett, R.J. , H. Smith , C. van Lieshout , P. Montebruno , and G. Newton . 2019. The age of entrepreneurship. Business proprietors, self-employment and corporations since 1851 . Abingdon: Routledge.
- Chandler, A. D. 1962. Strategy and Structure: Chapters in the History of the Industrial Enterprise , Cambridge MA: MIT Press.
- Chandler, A. D. 1990. Scale and Scope: The Dynamics of Industrial Capitalism , London: Belknap Press.
- Clapham, J.H. 1938. An Economic History of Modern Britain, Vol. 3: Machines and National Rivalries (1887–1914) with an Epilogue (1914–1929) . Cambridge: Cambridge University Press. doi: 10.1086/ahr/44.4.902.
- Garrett, E. , and A.M. Reid . 2018. Composing a national picture from local scenes: New and future insights into the fertility transition. Local Population Studies 100:60–76.
- Goose, N. 2006. Farm service, seasonal unemployment and casual labour in mid nineteenth-century England. Agricultural History Review 54:274–303.
- Grigg, D.B. 1987. Farm size in England and Wales, from early Victorian times to the present. Agricultural History Review 35:179–98.
- Hannah, L. 2007. The ‘divorce’ of ownership from control from 1900 onwards: Re-calibrating imagined global trends. Business History 49 (4):404–38. doi: 10.1080/00076790701295821.
- Hannah, L. 2014. Corporations in the US and Europe 1790-1860. Business History 56 (6):865–99. doi: 10.1080/00076791.2013.837893.
- Higgs, E. 1987. Women, occupations and work in the nineteenth century censuses. History Workshop Journal 23 (1):59–80. doi: 10.1093/hwj/23.1.59.
- Higgs, E. 2005. Making Sense of the Census – Revisited . London: University of London School of Advanced Study Institute of Historical Research.
- Higgs, E. , C. Jones , K. Schürer , and A. Wilkinson . 2015. Integrated census microdata (I-CeM) guide . 2nd ed. Colchester: University of Essex History Department.
- Howkins, A. , and N. Verdon . 2008. Adaptable and sustainable? Male farm service and the agricultural labour force in midland and southern England, c.1850–1925. The Economic History Review 61 (2):467–95. doi: 10.1111/j.1468-0289.2007.00405.x.
- Jaadla, H. , and A.M. Reid . 2017. The geography of early childhood mortality in England and Wales, 1881‒1911. Demographic Research 37:1861–90. doi: 10.4054/DemRes.2017.37.58.
- Kay, A.C. 2009. The foundations of female entrepreneurship: Enterprise, home and household in London, c. 1800–1870 . London: Routledge
- Lawton, R. , and C. G. Pooley . 1992. Britain 1740–1950: An historical geography . London: Edward Arnold.
- Mills, D. 1999. Trouble with farms at the Census Office: An evaluation of farm statistics from the censuses of 1851-1881 in England and Wales. Agricultural History Review 47 (1):58–77.
- Mills, D. and K. Schürer eds. 1996. Local communities in the Victorian census enumerators books . Oxford: Leopards Head Press.
- Montebruno, P. , R.J. Bennett , C. van Lieshout , H. Smith , and M. Satchell . 2019a. Shifts in agrarian entrepreneurship in mid-Victorian England and Wales. Agricultural History Review 67:71. 1-4.
- Montebruno, P. , R.J. Bennett , C. van Lieshout , and H. Smith . 2019b. A tale of two tails: Do power law and lognormal models fit firm-size distributions in the mid-Victorian era?. Physica A: Statistical Mechanics and Its Applications 523:858–75. doi: 10.1016/j.physa.2019.02.054.
- Pollard, S. 1965. The genesis of modern management: A study of the industrial revolution in Great Britain , Edward Arnold, London.
- Radicic, D. , R.J. Bennett , and G. Newton . 2017. Portfolio entrepreneurship in farming: Empirical evidence from the 1881 census for England and Wales. Journal of Rural Studies 55:289–302. doi: 10.1016/j.jrurstud.2017.08.019.
- Reid, A.M. , H. Jaadla , E.M. Garrett , and K. Schürer . 2019. Adapting the ‘own children method’ to allow comparison of fertility between populations with different marriage regimes. Population Studies :1–22. doi: 10.1080/00324728.2019.1630563.
- Reid, A.M. , Arulanantham, S.J. J.D. Day , E.M. Garrett , H. Jaadla , H., and M. Lucas-Smith . 2018. Populations past: Atlas of Victorian and Edwardian population. https://www.populationspast.org/.
- Rodger, R. 1988. Concentration and fragmentation. Capital, labour, and the structure of Mid-Victorian Scottish Industry. Journal of Urban History 14 (2):178–213. doi: 10.1177/009614428801400202.
- Ruggles, S. , and R.R. Menard . 1995. The Minnesota historical census projects. Historical Methods: A Journal of Quantitative and Interdisciplinary History 28 (1):6–10. doi: 10.1080/01615440.1995.9955308.
- Schürer, K. , and J.D. Day . 2019. Migration to London and the development of the north–south divide, 1851–1911. Social History 44 (1):26–56. doi: 10.1080/03071022.2019.1545361.
- Schürer, K. , E.M. Garrett , H. Jaadla , and A.M. Reid . 2018. Household and family structure in England and Wales (1851–1911): Continuities and change. Continuity and Change 33 (3):365–411. doi: 10.1017/S0268416018000243.
- Schürer, K. , and E. Higgs . 2014. Integrated Census Microdata (I-CeM): 1851–1911. [data collection]. UK Data Service. SN: 7481.
- Schürer, K. , E. Higgs , A.M. Reid , and E.M. Garrett . 2016. Integrated Census Microdata 1851–1911, version V.2 (I-CeM.2), [data collection], UK Data Service, SN: 7481, http://dx.doi.org/10.5255/UKDA-SN-7481-1; enhanced.
- Schürer, K. , T. Penkova , and Y. Shi . 2015. Standardising and coding birthplace strings and occupational titles in the British censuses of 1851 to 1911. Historical Methods: A Journal of Quantitative and Interdisciplinary History 48 (4):195–213. doi: 10.1080/01615440.2015.1010028.
- Schürer, K. , and M. Woollard . 2000. 1881 Census for England and Wales, the Channel Islands and the Isle of Man (Enhanced Version) [data collection]. Federation of Family History Societies, Genealogical Society of Utah, [original data producers]. UK Data Service, SN: 4177, http://doi.org/10.5255/UKDA-SN-4177-1.
- Shaw-Taylor, L. 2005. Family farms and capitalist farms in mid-nineteenth-century England. Agricultural History Review 53:158–91.
- Shaw-Taylor, L. 2012. The rise of agrarian capitalism and the decline of family farming in England. The Economic History Review 65 (1):26–60. doi: 10.1111/j.1468-0289.2010.00585.x.
- Smith, H. , R.J. Bennett , and D. Radicic . 2018. Towns in Victorian England and Wales: A new classification. Urban History 45 (4):568–94. doi: 10.1017/S0963926818000020.
- Smith, H. , R.J. Bennett , and C. van Lieshout . 2019. Immigrant business proprietors in England and Wales, 1851–1911. Continuity and Change 34 (2):253–76. doi: 10.1017/S0268416019000171.
- Van Lieshout, C. , H. Smith , P. Montebruno , and R.J. Bennett . 2019. Female entrepreneurship: Business, marriage and motherhood in England and Wales, 1851–1911. Social History 44 (4):440–68. doi: 10.1080/03071022.2019.1656929.
- Van Lieshout, C. , J. Day , P. Montebruno , and R. J. Bennett . 2018. Working Paper 12: Extraction of data on Entrepreneurs from the 1871 census to supplement I-CeM. 10.17863/CAM.27488.
- You, X. 2019. Women’s labour force participation in nineteenth-century England and Wales: Evidence from the 1881 census enumerators’ books. Economic History Review doi: 10.1111/ehr.12876.