
Abstract
This study investigates the main features of collected disability statistics for the censuses in Sweden, 1860–1930, when the disability prevalence rose from four to 21 individuals per thousand of the population. We use qualitative methods to analyze the means of collecting, categorizing, and defining disability, while quantitative methods help us calculate the prevalence by disability type and gender in urban and rural areas. Our long-term findings reveal that this increase reflects new approaches whereby authorities applied alternative methods to collect disability data, using additional sources, wider definitions, and introducing new disability categories. The temporal variations in disability prevalence were influenced by the social and political context and normative views on who was considered disabled or not.
Introduction
From 1860 to 1930, Swedish authorities systematically collected disability data for the censuses. During this period, disability prevalence rose from four to 21 per thousand of the population.Footnote1 Even if the prevalence was low in Sweden, the increase over time was indeed substantial. The overarching purpose of our examination is to differentiate this considerable rise in Sweden and its causes by investigating the census reports from 1860 to 1930. We further consider some explanatory factors in society as Sweden, like many other nations in the Western world, underwent urban-industrial developments during the period studied, as well as advancements in medical knowledge and in politics.
By the middle of the 19th century, most European states had established some sort of statistical services and bureaus. At the International Statistical Congress, held during the period 1853 to 1876, statistical delegates from different countries met with the goal to bring about standardization and uniformity in the methods of national statistics of all countries (Randeraad Citation2011; Levi Citation1854). Swedish statisticians had extensive experience of international involvement and in 1874 the congress was held in Stockholm (Sköld Citation2004). The overall goal of the congress was not achieved at the time, but it was essential for the international and national acceptance of statistics as a guiding instrument for political decision-making (Randeraad Citation2011).Footnote2 However, statistics are not collected and compiled in an objective way by a statistical bureau, but rather are the product of a political, scientific, and governmental milieu with certain intentions. Previous research has likewise stressed the political nature of censuses and the importance of population statistics for the formation of the nation during the late 19th century (Schor Citation2017; Lie Citation2002; Lie and Roll-Hansen Citation2001; Rogers and Nelson Citation2003; Desrosières Citation1998). Scholars have further found that the categorization of the population in the censuses was shaped by normative views and played a vital role as a policy tool in the formation of the nation. The development of statistical categories also became part of the construction of “the other,” by using classifications referring to ethnicity, class, gender, and disability (Lie Citation2002; Schor Citation2017; Höjer Citation2001, 29–30; Vikström Citation2010; Brännlund and Axelsson Citation2013). In studies of the formation of the Swedish nation, researchers have explained the statistical categories in terms of moral statistics, as a means to describe the social behavior of the population. This illustrated an increasing interest in enumerating and distinguishing “normal” groups from “abnormal”, and to identify the poor, sick, or other “deviants” in population. Sweden was not unique in this respect. During the 19th century, the interest in moral statistics increased in Europe and the Western world and was followed by numerous surveys concerned with the health of the population stock to improve its future quality (Hacking Citation1986, 161; Lie and Roll-Hansen Citation2001; Schor Citation2017; Höjer Citation2001, 165; Björkman Citation2001).
While definitions and categorizations of class, gender, and ethnicity have been subject to many studies and critical investigations, disability has not received similar attention. Within the fields of historical population studies and historical demography, population registers and censuses have been extensively studied to obtain knowledge on health and living conditions in past societies (Osamu Citation1996). While health issues in terms of mortality, diseases, and epidemics have been examined accordingly and have helped establish the subfield of medical history, disabilities have received little recognition from historians using past population records. One explanation for this is probably the insufficient reporting of disabilities in these records, which jeopardizes any further examination. Another explanation might be that disability history is a comparatively recent subfield within the history discipline. Since disability history was established in the 1980s, it has primarily attracted qualitatively oriented social historians with a research interest in minorities or marginalized groups in society and who examine narrative sources describing disability issues (Kudlick Citation2003; Kudlick Citation2018). By examining Swedish censuses from 1860 to 1930, we will contribute to this nascent literature results that not only identify the use of disability definitions and categorizations, but also their impact on the rates of disabilities in past populations.
The overall aim of this study is to investigate how Swedish authorities collected and reported disability statistics in the censuses between 1860 and 1930, in particular regarding whether and how:
the methods and sources of collecting disability data used by national authorities changed;
the disability definition and categories altered;
the approach to measuring disability affected the disability rates over time, with respect to different disability categories and gender in urban and rural areas.
Answering these questions enables us to discuss both the benefits and drawbacks of using censuses as a resource for studying disabilities in history.
Background
In 1686, a new church law laid the foundation for the registration of the Swedish population. All citizens belonged to the Swedish Lutheran State Church by law and every parish minister was obliged to maintain registers of his parishioners. The record keeping had two purposes: to verify the parishioners’ adherence to the teachings of the Lutheran church and to provide a basis for the nation’s population statistics (Lext Citation1984, 33–34).
In 1749 the Swedish Tabellverket was created, a government agency collecting national population statistics, and the first numeric census was performed. This initial census was reliant on the existing systems for creating and maintaining parish records. In 1858, Statistics Sweden was established, inspired by the creation of Belgium’s central statistical bureau (in 1831) and other countries statistical departments (Sköld Citation2004; Sjöström Citation1998, 400; Sjöström Citation2002, 122).
The first nominal census was compiled in 1860, using nominative excerpts from parish records as well as stricter rules regarding registration and reporting of data (Wicksell Citation1922, 26–27; Sköld Citation2004). After 1860, censuses were conducted every tenth year until 1930 and then more irregularly; mainly every fifth year. During the period 1860 to 1930, the censuses included statistics about disabilities in the population. After 1930, this kind of information was not aggregated in the censuses, nor collected by Statistics Sweden.
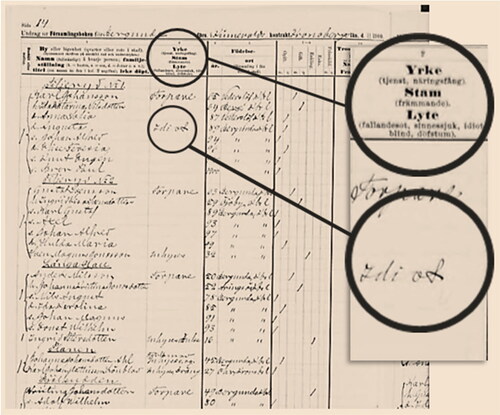
Historically, censuses worked as a tool to collect and obtain detailed information about the population. The main objective behind this collection of statistics was to aid the local as well as national planning and administration. In most Western countries, censuses were taken with the help of enumerators, or census takers, who registered people at specific times in specific places (Thorvaldsen Citation2018; Anderson Citation1988, 84; Desrosières Citation1998). Compared to other countries, Sweden differed in the way census data was taken during the 19th and early 20th century. The main way of collecting census data was through the parish ministers. They transcribed information from the parish registers into preprinted census forms provided by Statistics Sweden, which were then sent back to this authority for further treatment as explained below (see ).Footnote3 The parish registers included information on the total de jure population in a well-organized way and constituted the vital source for the initial collection of detailed population data to the nominative censuses (Lext Citation1984, 33–34; Thorvaldsen Citation2018; Wisselgren et al. Citation2014; Axelsson and Wisselgren Citation2018, 63–66).
Figure 1. Image of a preprinted census form for the 1900 census, Bergunda parish in Kronobergs county.Source: Statistiska Centralbyrån (Citation1900).Notes: The second column in the preprinted census form designed for the 1900 census shows information about occupation (yrke), ethnicity (stam), and disability (lyte) recorded by the minister. The header specifies what types of disabilities to register (i.e., “epilepsy”, “insanity”, “idiocy”, “blindness”, and “deaf-muteness”). As highlighted in the image, the minister in this parish has written “idiot” after one of his parishioners.
Materials and methods
For each census taken between 1860 and 1930, Statistics Sweden processed and produced aggregated statistics on the population by using the parish registers and publishing all information in a census report. With some variations over time, these reports provided data on the sociodemographic structures and health status of the population based on age, gender, mortality, marital status, household compositions, geographical location, occupations, ethnicity, religious affiliation, and on disability, the latter of which is the focus of this study. The census reports further described how the data of the population was collected and presented statistically. Statistics Sweden has digitized and published all census reports from 1860 to 1960 on its website, which makes them an accessible source to investigate.Footnote4 These reports from the Swedish censuses for the years 1860 to 1930 constitute the primary source of our longitudinal investigation.
Methodologically, this study makes use of both qualitative and quantitative analysis to identify the collection, reporting, definition, and categorization of disability data in the censuses, and their changes over time. Our qualitative analysis implies an examination of Statistics Sweden’s instructions concerning census taking, the classifications and definitions of disabilities considered in the census reports, and those subject to enumeration. This helps us uncover temporal variations regarding the measuring and data collection associated with disabilities at each census taking, which would affect the disability statistics reported. Our quantitative analysis implies calculations of disability prevalence rates in the population based on the disability statistics reported in each census. We further differentiate these rates in order to identify gender differences over time in urban and rural areas.
Like the vocabulary used at the time, Statistics Sweden used the term “lyte” to acknowledge all types of disability in the census reports. In this study, disability refers to “lyte” as it was used by Statistics Sweden in the reports. This term and other concepts in use at the time to describe different disabilities, which we come across in the census reports and make use of below, might appear insulting due to their derogatory meaning today. However, this usage is without any intention to offend and used only to avoid translation issues.
Results
Methods of collecting disability statistics
A census taking was a huge statistical exercise. When it was time to implement the first nominative census in 1860, a royal decree designated the catechetical examination register (husförhörsbok) as the primary source of information for the census (Statistiska Centralbyrån Citation1865, XXXIV; Wisselgren et al. Citation2014). Specially designed preprinted forms, with instructions on what information about the parishioners was required, were sent to all parish ministers by Statistics Sweden (cf. ). However, the ministers were not provided with any detailed guidance of what to define as disability, only a text listing conditions regarded as disabilities (lyten), for instance: “insanity” (sinnessjuk), “idiocy” (idiot/sinnessvag), blindness (blind) or deaf-muteness (dövstum) (Axelsson and Wisselgren Citation2018).
Census officials at Statistics Sweden reviewed the received and completed forms from the parish ministers following specific instructions. If unclear or ambiguous information in the preprinted forms was observed, the parish ministers had to correct inaccuracies (Axelsson and Wisselgren Citation2018, 75). When all forms were adjusted, the individual-level information was aggregated into geographical areas (urban/rural, county, and national level) and various categories such as gender, age, marital and occupational statuses, ethnicity, and disability, for example. The aggregated statistics were subsequently presented in the national census report, which usually contained up to three volumes depending on how comprehensive the census itself had been.
These procedures for census taking persisted during the period studied. However, by the end of the 19th century, census officials stressed that the ministers’ disability reporting was inadequate and not based on medical assumptions (Statistiska Centralbyrån Citation1885). The preprinted census forms included too many ambiguities regarding certain disabilities. Some terms, used by the ministers, were local phrases and indefinite, difficult to decipher and classify (Statistiska Centralbyrån Citation1895). The dissatisfaction was mutual. The ministers were not pleased with the current situation either. They were not only responsible for the collection of population statistics; they were, every so often, also giving the parishioners the disability diagnoses. This interfered with their actual clerical ministry and implied extra administrative duties. Consequently, in 1910, authorities like Statistics Sweden and the Lutheran State Church collectively addressed a proposal to the Royal Majesty (Kungliga Maj:t) and the Parliament (Riksdagen) requesting the inclusion of supplementary sources in the compilation of data for forthcoming censuses (Axelsson and Wisselgren Citation2018, 77–78). The proposal was accepted, and the 1920 census took a wider approach to collecting statistics about the population by involving other sources. In addition to the parish registers, information was for instance collected from the yearly poll tax registration (mantalsskrivning). The poll tax form (mantalslängd) was a self-reported questionnaire, which the head of every household filled in at the end of each year by answering questions about his/her occupation, income, education, disabilities etc. and those of other household members.Footnote5
As for the census takings in 1920 and 1930, the method of collecting disability data changed overall and came to include more than one sources, such as the catechetical registers and the self-reported information from the annual poll tax questionnaires, for example. The poll tax questionnaires were provided with a more detailed guidance for identifying disability, compared to the instructions given to the parish ministers. To be classified as “blind,” a person had to be totally blind. “Deaf mute” meant lacking power to hear and perform normal speech. “Idiots” were persons regarded to have been born with a learning disability, while the “insane” referred to those who had been in good mental health before falling to mental illness. Individuals who were absent-minded due to old age were not to be registered as either “idiots” or “insane” (Axelsson and Wisselgren Citation2018).
Consequently, from 1920 onward, not only did parish ministers provide disability information for the censuses, but also household heads or members when they reported disabilities via the catechetical registers and poll tax questionnaires. However, as explained below, this was not the first time Statistics Sweden used other sources to complete and ensure reception of disability information from the parish registers.
Changes in the collection and categorization of disability data
Throughout the period scrutinized, Statistics Sweden did not explicitly state the reasons for collecting disability statistics or why different types of disabilities were enumerated, neither in the census reports nor in the census instructions to the ministers. However, the benefits of enumerating disabled persons for the purpose of state administration were stressed in the 1860 census report, as it became important to identify disabled people staying at different types of care institutions. Tracking residents of care institutions was of state interest, both to monitor people enrolled at institutions and to avoid double registration of disabled individuals at institutions and at their home parish. In the 1860 census report, it was stated that the intention to collect nominal data was to gather as much information as possible about the population, as this would be useful for both state administration and for scientific purposes and disability statistics, as well:
However, the statistical information in question, like all others, should be intended to provide as much information as possible for both science and public administration. For such a purpose, it would perhaps be best if the count of the insane could henceforth be subject to special health and medical care statistics, based on surveys carried out by national doctors in accordance with the regulations specified by the Royal Board of Health (Statistiska Centralbyrån Citation1865, XXXIV).Footnote6
The fact that the information obtained from the censuses about insane people and idiots was incomplete has long been considered plausible, and this is confirmed by the survey carried out by the National Board of Health, announced on June 14th, 1901, implemented for the purpose of identifying the total number of insane and feeble-minded (idiots) in the nation, and how many of them were in need of institutional care (Statistiska Centralbyrån Citation1907, XLVI).Footnote7
Similarly, the Ministry of Ecclesiastical Affairs (Ecklesiastikdepartementet) needed more accurate numbers regarding blind people in Sweden. In 1920, the ministry conducted an investigation, which showed that the number of blind people in the population was higher than the figures reported in the 1920 census (Statistiska Centralbyrån Citation1925, 64). Results from this investigation supplemented the information from the parish registers and the poll tax questionnaires in the 1920 census, in order to increase the identification of blind people in the population. As for the 1930 census, Statistics Sweden furthermore extracted information about blind people from membership registers held by various associations of visually impaired people, to improve the statistics even more (Statistiska Centralbyrån Citation1936, 25–26).
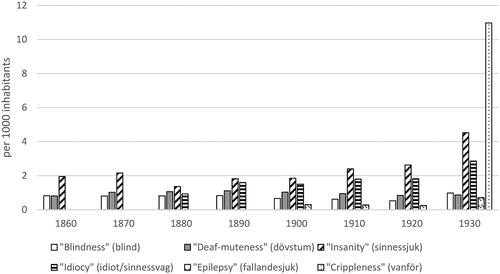
Not only did the collection of disability statistics change over time, but the disability categories in the censuses evolved as well. Some persisted, while new categories were included. As shows, the categories of “insanity”, “blindness”, and “deaf-muteness” persisted throughout the scrutinized period. In 1880, the category of “insanity” was divided into “idiocy” and “insanity.” The ministers were told to distinguish those who had a mental or intellectual disorder since childhood (“idiots”) from those who had become ill later in life (“insane”). In 1900, “epilepsy” was included as a disability category in the census reports and “crippleness” in 1930.
Table 1. The usage of different disability categories in Swedish national census reports (Statistiska Centralbyrån Citation1865, Citation1874, Citation1885, Citation1895, Citation1907, Citation1918, Citation1925, Citation1936) tabulated by marked cells per decennial report.
distributes the prevalence per disability category and shows that “blindness” and “deaf-muteness” were relatively low and stable during the whole study. The prevalence of “insanity” decreased in 1880, when it was divided into the two categories “insanity” and “idiocy.” By 1930, the prevalence of these two categories had more than doubled. Until the census of 1930, only “blindness”, “deaf-muteness”, and different types of mental disabilities were the disability categories observed and reported in the census reports. In 1930, “crippleness” (physical impairment) was regarded as a disability valuable to enumerate in the census and it demonstrated the highest prevalence of all categories under consideration.
Figure 2. Proportion (per thousand) of disabilities in Swedish populations per disability category in national censuses 1860 to 1930. Sources: Statistiska Centralbyrån (Citation1865, Citation1874, Citation1885, Citation1895, Citation1907, Citation1918, Citation1925, Citation1936) and Historical Statistics of Sweden (Citation1969). Note: 1860 (N= 3,859,728); 1870 (N= 4,168,525); 1880 (N= 4,565,668); 1890 (N= 4,784,981); 1900 (N= 5,136,441); 1910 (N= 5,522,403); 1920 (N= 5,904,489); 1930 (N= 6,142,191).
With new disability categories enumerated and included in the censuses, the definition of disability widened and became more differentiated over time. In the next section, we show how this affected the number of people classified as disabled in the population when the prevalence for each specific category is analyzed by gender in urban and rural areas.
Temporal variations in disability rates by gender in urban and rural areas
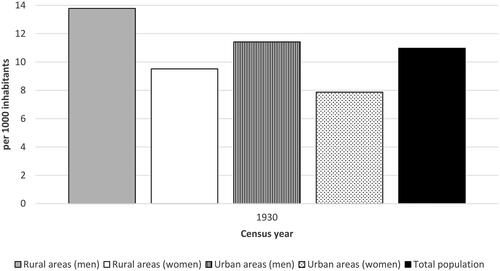
In its census reports, Statistics Sweden classified the disabled part of the population in accordance with the disability categories presented above (cf. and ). In 1860, the disability prevalence in Sweden was four individuals per thousand of the population. shows that it stayed relatively consistent for many years. In 1890, the rate was five per thousand and then six in 1920. However, ten years later in 1930, it more than tripled to 21 per thousand in the population.
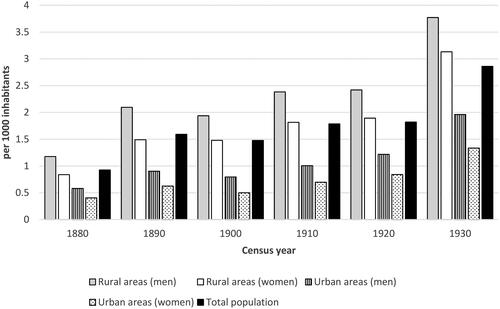
Figure 3. Disability prevalence of men and women in rural and urban areas of Sweden, 1860 to 1930.Sources: Statistiska Centralbyrån (Citation1865, Citation1874, Citation1885, Citation1895, Citation1907, Citation1918, Citation1925, Citation1936) and Historical Statistics of Sweden (Citation1969).
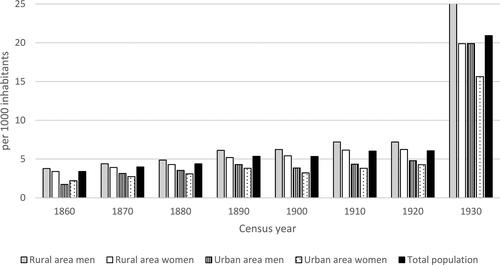
further shows that there were some urban versus rural as well as gender variations in disability prevalence between 1860 and 1930. In 1860 only, urban women showed a slightly higher rate compared to urban men while in all subsequent census reports, women in towns showed a lower disability prevalence than urban men did. In general, the prevalence was higher among men than women, and lower in urban populations than rural. In 1930, the gender difference was sharper both within urban and rural areas.
Below, the prevalence of each specific disability category is further described, following the order in which the categories were introduced in the census reports during the study period (cf. ).Footnote8 The prevalence of each disability category is distributed by gender in urban and rural areas.
Mental disorders
For the 1860 census, Statistics Sweden instructed the parish ministers to send information about all parishioners with any form of insanity. The census officials reported problems concerning the categorization of mental disorders. First, they had difficulty estimating the number of mentally ill in the population due to under-registration, since some people, or their family, might hide their mental illness. Secondly, officials were confused about what types of mental disorders the ministers included in their reporting and whether they excluded some sorts of illnesses. The scope of the category “insanity” was too wide and included too many concepts, the officials argued, questioning whether the ministers really described mental disorders at all (Statistiska Centralbyrån Citation1865, XXXIV).
The census of 1860 reported “insanity” in the population by gender in urban and rural areas, and by making international comparisons. In the 1870 census, insanity was distributed by age groups as well. As explained above, the 1880 census distinguished those who had a mental or intellectual disability since childhood from those who had become mentally ill later in life. “Idiocy” was the term used to define the former, while “insanity” referred to the latter. This census enumerated mental disability by marital status as well. The 1910 census distributed the statistics of mental disability further by also accounting for occupation. In the 1920 census, the statistics were more accurate than before, the officials argued, since information derived partly from a National Board of Health investigation and partly from the poll tax registration questionnaire was added to the parish registers. In the 1920 census, a change in terminology occurred referring to the use of “feeble-minded” instead of “idiots.” Notably, the 1930 census reported mental disability among ethnic minorities in Sweden for the first time, such as the Finns and the indigenous Sami people. The census attributed a high rate of mental disability to these minority groups.
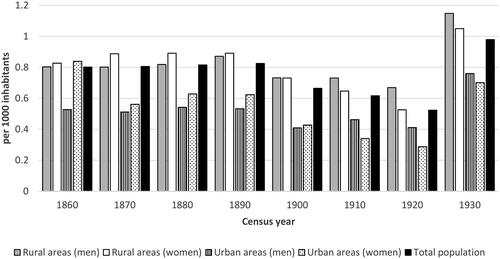
The prevalence of “insanity” among men and women in urban and rural areas is shown in . This prevalence was higher in the latter area in 1860 and 1870 but decreased for both genders from 1880, when the census distinguished “insanity” from “idiocy.” In 1890, the prevalence of “insanity” was equal in rural and urban areas, while the following censuses reported a higher prevalence in the countryside yet again and up until the peak of 1930, which concerned rural as well as urban areas. The rate of “insanity” was slightly higher among men in rural areas and somewhat higher among women in urban areas.
Figure 4. Prevalence of “insanity” in Swedish populations by gender in urban and rural areas, 1860 to 1930.Sources: Statistiska Centralbyrån (Citation1865, Citation1874, Citation1885, Citation1895, Citation1907, Citation1918, Citation1925, Citation1936) and Historical Statistics of Sweden (Citation1969).
As for “idiocy”, the pattern was slightly different. Between 1880 and 1930, the prevalence of “idiocy” increased, especially in rural areas and in men, although women’s rates rose as well. In urban environments, “idiocy” was less pronounced over time ().
Figure 5. Prevalence of “idiocy” in Swedish populations by gender in rural and urban areas, 1880 to 1930.Sources: Statistiska Centralbyrån (Citation1865, Citation1874, Citation1885, Citation1895, Citation1907, Citation1918, Citation1925, Citation1936) and Historical Statistics of Sweden (Citation1969).
In 1930, the prevalence of mental disability (“insanity” and “idiocy”) in Swedish population peaked. The extended use of supplementary sources, in parallel with modifications regarding the definition of mental disorders, was not the only reason for this peak according to census officials. They also recognized some circumstances in society having negative effects on mental health in the population, such as mass emigration to North America, depriving both the country and families of a strong and healthy population resource (Statistiska Centralbyrån Citation1925, 56).Footnote9
Blindness
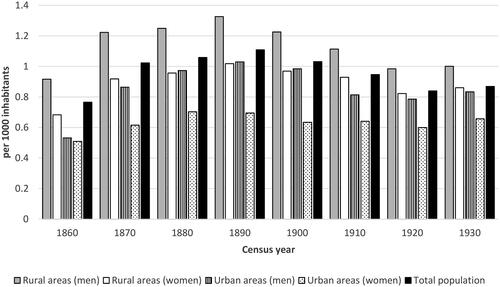
From the 1860 census until 1930, “blindness” in the population was enumerated. However, it was not clear in the 1860 census whom to count as “blind” and thus include in this category. It was debated whether or not infants who had contracted an eye disease, or if individuals being half-blind or having an eye sickness should be included in the group defined as “blind.” Conclusively, census officials decided to include statistics only regarding people with complete loss of sight. For future census takings, officials suggested that the ministers mark whether “blindness” was congenital or acquired. In the census of 1860, “blindness” in the population was reported by gender and geographical areas (counties, urban and rural). It was noticed that several institutions for blind people were located in rural areas, offering blind inmates housing and education. In the 1870 census, “blindness” was reported by variables such as gender, age, geographical areas, and marital status. Heredity factors, as well as educational institutions for blind people, were also considered in this census. In that of 1910, their occupations were reported and found to be relatively scant. The census of 1930 stated that the educational level among blind people was unsatisfactorily low, although many of them could find support in adulthood through work in the handicraft sector (Statistiska Centralbyrån Citation1936, 27). Similar to mental disorders, ethnic minorities especially represented “blindness” according to the statistics reported in the 1930 census.
The prevalence of individuals regarded as totally blind was fairly small and stable from 1860 to 1890, with a slow decrease during subsequent decades until 1920 (). In 1930, the prevalence of blind people rose. During the whole period studied, the prevalence was higher in rural areas. From 1860 to 1900, women in rural areas had a slightly higher prevalence compared to men. This gender difference reversed from 1910, when blind men in rural areas showed a slightly higher prevalence than women did. The census explained the higher prevalence of “blindness” in rural populations by the association between old age and loss of vision, because the countryside was largely populated by elderly people. Additionally, many educational institutions for blind individuals were located in rural areas. In the census reports, better access to eye doctors in towns further explained the urban-rural difference, as they could treat eye problems, which lowered the rate of blindness in urban populations.
Figure 6. Prevalence of “blindness” in Swedish populations by gender in rural and urban areas, 1860 to 1930.Sources: Statistiska Centralbyrån (Citation1865, Citation1874, Citation1885, Citation1895, Citation1907, Citation1918, Citation1925, Citation1936) and Historical Statistics of Sweden (Citation1969).
Deaf-muteness
In the past, people with a complete inability to hear were often perceived as being both “deaf” and “mute,” because they lacked the ability to communicate orally. In all censuses between 1860 and 1930, the term “deaf-mute” (dövstum) referred to people who were unable to hear and communicate orally. During the entire period, “deaf-muteness” was reported by the same variables as was “blindness” in the censuses (e.g., gender, age, marital status etc.). In the census of 1910, which concerned occupations among disabled people, it is mentioned that those in the category of “deaf-muteness” had better chances of finding work, such as a tailor or seamstress, compared to people with other disabilities.
According to the censuses, the prevalence of “deaf-muteness” in Swedish populations was low from 1860 to 1930 and in comparison with “blindness”, as illustrates. Between 1860 and 1890, the prevalence increased slightly, but from 1890 onwards, it decreased. Unlike the disability categories discussed above, the prevalence of “deaf-muteness” did not peak in 1930. There were clear differences between urban and rural areas, as this rate was markedly higher in the latter throughout the study period. The gender differences were obvious as well, since the rate in “deaf-muteness” was higher in men than in women both in rural and urban areas. Women in towns show the lowest rate, which persisted over time.
Figure 7. Prevalence of “deaf-muteness” in Swedish populations by gender in rural and urban areas, 1860 to 1930.Sources: Statistiska Centralbyrån (Citation1865, Citation1874, Citation1885, Citation1895, Citation1907, Citation1918, Citation1925, Citation1936) and Historical Statistics of Sweden (Citation1969).
Epilepsy
The census of 1900 enumerated people with “epilepsy” (fallandesjuka) for the first time, although it appeared in very few cases and thus had a low prevalence (). The census officials explained this by the uncertainty involved with collecting this kind of information. For example, there was confusion about whether the ministers had really registered the correct case of epilepsy, namely “epilepsy idiopathica”.Footnote10 Since the statistics on “epilepsy” were regarded as deficient, the census officials found it difficult to compare over time. They further argued that people tried to hide this type of disability, as epilepsy as well as other mental illnesses constituted an impediment to marriage.
Figure 8. Prevalence of “epilepsy” in Swedish populations by gender in rural and urban areas, 1900 to 1930.Sources: Statistiska Centralbyrån (Citation1907, Citation1918, Citation1925, Citation1936) and Historical Statistics of Sweden (Citation1969).
The prevalence of “epilepsy” in the population was low overall and quite stable. In 1930, it rose significantly, as was the case with all other types of disabilities enumerated in the censuses, except “deaf-muteness”. The prevalence of “epilepsy” was higher in rural areas than in towns, while there were no prominent gender differences.
Crippleness
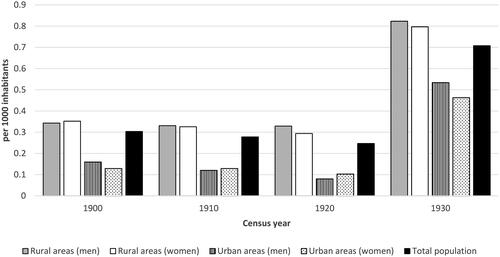
The census of 1930 took account of people being “crippled” (vanföra). This was the first occasion in which physical disabilities were statistically counted in a Swedish census. Statistics Sweden defined a “crippled” person as someone having chronic or bodily dysfunctions, regardless of whether it was congenital or caused by an accident or illness (Statistiska Centralbyrån Citation1936, 28).
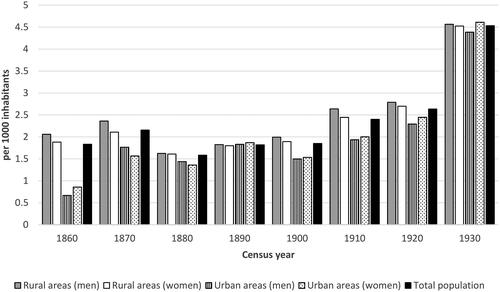
Even if the overall disability prevalence in the Swedish population was low during the study period, irrespective of the peak in 1930, the rate of “crippled” cases in 1930 was the highest compared to all other disability categories considered. This rate was higher in rural populations than in urban ones, and more prevalent in men than in women no matter whether they lived in the countryside or in towns (). Census officials explained this by noting the older age structure of the population in the countryside, since physical disability tended to increase with growing age.
Figure 9. Prevalence of “crippleness” in Swedish populations by gender in rural and urban areas, 1930.Sources: Statistiska Centralbyrån (Citation1936) and Historical Statistics of Sweden (Citation1969).
Discussion
Between 1860 and 1930 the disability prevalence rose from 4 to 21 per thousand of the population, according to the Swedish censuses. This study examines the development of the methodology to measure disability in Sweden, with the intention to find explanations to what caused the sharp increase in disability prevalence in 1930.
We find both continuity and change regarding data collection, definition, and categorization of disability that Swedish authorities used during the period to picture the disability status in the population. These changes are of interest to study and clarify since they influence the statistical production. Firstly, our study shows that over time, Statistics Sweden started to use new sources to collect disability data in addition to the parish registers used since first nominal census taking in 1860. The intention was to improve the information about disability in the population when authorities from other state departments requested more consistent disability data. Secondly, the study reveals that these requests and the use of statistical investigations performed by medical experts made the censuses more scientific in the reporting of disabilities. Thirdly, we find that the disability definition widened as well as differentiated over the period studied as new disability categories were introduced in the census reports.
Researchers claim that the collection of national official statistics in many countries during the 19th century worked as a tool of state power, and that the introduction as well as modification of different categories to define people in the population helped the construction of the nation (Schor Citation2017; Lie Citation2002, 806; Axelsson Citation2010). By the late 19th century, it is obvious that the Swedish state and governmental officials wanted more from the censuses, that the information extracted from the parish registers were regarded inadequate and not as reliable as perceived before. At the time, there was a growing societal and medical concern about mental disorders and its degenerated effects on the “quality” of the population. Similar to many other countries around 1900, Swedish society was characterized by eugenic ideas and a sterilization program discussed to be valid for “idiots”, “insane”, and those suffering from “epilepsy” (Broberg and Tyden Citation1996, 95–102). The Swedish state and medical authorities were confident that improved official statistics would enhance the enumeration and identification of this group in society. In the official statistics this was observed via the incorporation of medically-established investigations into census data collection and by dividing mental illness into subcategories. As previous research contends, when eugenics and race biology became of increasing concern to governments and medical authorities in many countries, the measuring and classification of mentally disabled people exemplify one means to segregate groups of people from society and confine them to institutions (Lie Citation2002; Björkman Citation2001; Engwall and Larsson Citation2012, 20; Qvarsell Citation1991; Junkka, Sandström, and Vikström Citation2020). This concern had an impact on the reporting of mentally disabled people in Swedish population as shown in growing prevalence of the categories “insanity” and “idiocy”. During the period in study, the census reporting of mental disorders became more intricate, scientific, and medicalized. As the definition of this particular disorder widened and became more differentiated, the number of people labeled with mental disabilities increased in the censuses.
Ian Hacking (Citation1986) argues that social changes create new statistical categories of people and that shifts in collecting official statistics and classifying people work as windows into history. These windows, or statistical categories, help to show what once was viewed as (dis)abled, (ab)normal, or (un)healthy conditions in past society. Our census study reveals that the remarkable increase in disability prevalence in 1930 was mainly caused by the introduction of the new category “crippled” (vanföra) in the census. Today, it might appear strange not to account for physical impairments when considering different forms and the number of disabled people in the population. Obviously, this was not the case in the early 20th century Sweden, but why?
Unfortunately, the census reports do not explicitly specify the reasons why physically impaired people were enumerated in 1930. Most likely, the explanation is found in the surrounding socio-economic and political context. During the early decades of the 20th century, Sweden developed rapidly into an urban industrialized society. Compared to other Western countries, this transition was late. Through industrialization and the absence of devices for effective worker protection, the risks of accidents at workplaces increased. However, statistics covering accidents at work or occupational diseases were lacking at the time, as well as reliable statistics on the proportion of the population incapable of work (Sverige Socialutredningen Citation1974, 39). In the 1930 census, every person aged 15 to 67 years old had to answer questions about their working situation, if they were fully or partially capable of working. Every person was also obliged to declare his/her ability or incapability to support himself/herself (försörjningsförmåga), i.e., whether they were partly or completely unable to support themselves. It did not matter whether they were unable to work due to illness, an accident, or disability. Those who were permanently unable to work but could support themselves had to confirm this on the self-reported questionnaires in the tax registration form.
Like in other Western countries, the means of obtaining detailed information about the working capacity and health status of the population through the comprehensive census of 1930 in Sweden was probably a response to social circumstances at the time. In order to determine the people in need of community support, the emerging Swedish welfare state needed reliable statistics regarding the number and proportion of people with physical disabilities (“crippled”) in the population as well as the working force.Footnote11 Sweden was hit hard by the international postwar depression during the first decades of the 20th century, which caused political problems and rocketing unemployment rates. Recurrent recessions made employers hesitant to hire people in general, and studies suggest it became increasingly difficult for people with disabilities to find employment in the factories and industrial production. The labor requirements of these modern employment sectors differed from the manual work associated with handicraft and agrarian production, sectors in which many disabled people previously could find a job and an income. Disabilities made people less able to compete in the labor market of industrial society and made them become more dependent on state support than before (Åmark Citation2005; Förhammar Citation2004, 57; Olsson Citation2004, 101; Vikström, Häggström Lundevaller, and Haage Citation2017).
Our results show that disability is a most interesting but complex condition to examine involving challenges for measurements and data collection. This is largely because impairments regarded as disabling differ depending on the time-space context and normative views on who is (dis)abled or not. The Swedish censuses reflect these views, offering, as Hacking (Citation1986) has argued, a historical window on the period 1860 to 1930. We conclude that the Swedish censuses constitute a valuable and rich source for exploring disability in the past, especially since censuses comprise the total population. However, as our results demonstrate, there is a need to look beyond the numbers when studying disability statistics making use of the census reports’ narrative and quantitative information. To have sound knowledge about the data collection, the categorization as well as the definition is essential when analyzing disability statistics. While the more narrative census information has been subject to research concerning how censuses have categorized people depending on ethnicity, class, gender, and even disability to some extent, the censuses have been under-used as a historical source regarding the reporting of disability numbers in populations. Our examination of disabilities in the Swedish censuses indicates that their quantitative reporting holds potential for supporting new research on disability in history through more in-depth analysis of the findings uncovered in this study.
Disclosure statement
No potential conflict of interest was reported by the author(s).
Additional information
Funding
Notes
1 Present-day estimations suggest that between 1.3 and 1.8 million of the total Swedish population (10.3 million) has some type of disabilities (http://www.funka.com/design-for-alla/tillganglighet/statistik/).
2 Still today, there is an expressed need to harmonize data collection on disability to facilitate cross-country comparisons and to increase global awareness of disabilities. Disability prevalence differs significantly both within and across countries, as the means of defining and measuring disability are not consistent in the present-day world. High and middle-income countries, including Sweden, report a disability prevalence from 100 to 200 per thousand of the population, while many low-income countries report only 50 per thousand or below (Mont Citation2007; WG; WHO). https://www.washingtongroup-disability.com [2021.04.20] and https://www.who.int/news-room/fact-sheets/detail/disability-and-health [2021.04.20].
3 The Swedish church law early prescribed the registration of certain disabilities without any medical basis. However, during the 18th century, the parish ministers were obliged by the state to, among other things, produce statistics for Statistics Sweden and other state authorities. The relationship between the state and the Lutheran church has historically been strong in Sweden, as has the connection between the church and medicine. Until the end of the 19th century, there was a general shortage of doctors in the country why the minister’s annual contact with the parishioners was used by the health care, partly to check the health of the parishioners and partly to report about their health to the state. Initially the parish ministers reported infectious diseases, later they came to give diagnoses and practice some medical care. However, during the latter part of the 19th century, the number of doctors increases as well as their authority (Drugge Citation1988, 4–33).
5 In 1930, when an extraordinarily extensive census was conducted, detailed guidance was sent out to every household in order to identify and classify the form of disability to collect in the census. For this census, special municipal officials (kommunalombud) were recruited and organized in census districts to help the public complete and fill in the poll tax forms correctly. These officials also collected, corrected, and complemented the forms if required, before sending them to Statistics Sweden. When needed, these officials furthermore assisted the parish ministers with the transcription of information from the parish registers (Axelsson and Wisselgren Citation2018, 65).
6 ”Den ifrågavarande statistiska uppgiften bör emellertid liksom alla andra afse att så vidt möjligt bereda någon upplysning både åt vetenskapen och statsförvaltningen. För sådant ändamål vore måhända bäst, om redogörelsen för de sinnessjuke framdeles kunde blifva föremål för den speciela helso- och sjukvårdsstatistiken och grundas på undersökningar anställde af Rikets läkare enligt särskilda föreskrifter af Kongl. Sundhets-Kollegium” (Statistiska Centralbyrån Citation1865, XXXIV).
7 ”Att det vid folkräkningarne erhållna uppgifterna om sinnessjuke och idioter voro ofullständiga, har man länge ansett sig kunna antaga, och denna förmodan bekräftas af den undersökning, som Kungl. Medicinalstyrelsen, jämlikt i nådigt bref den 14 juni 1901 meddeladt uppdrag, lät verkställa i syfte att utröna hela antalet sinnessjuka och sinnesslöa (idioter) inom riket, samt huru stor del af dem finge anses vara i behof af vård å anstalt” (Statistiska Centralbyrån Citation1907, XLVI).
8 In every population there are people with multiple disabilities. In the census reports the portion of people with more than one disability was clearly stated, as well as how the census officials had handled these cases to avoid double or triple registration.
9 Consequently, the proportion of people with mental disorder as well as other disabilities increased, relatively speaking, when many of the young and healthy part of the population emigrated.
10 According to Westrin (Citation1907, Nordisk familjebok), epilepsy (fallandesot) was considered a mental illness since it was long perceived as a neurosis (Westrin Citation1907, Nordisk familjebok, 1323). See also Riving (Citation2012, 39).
11 At the beginning of the 1930s, about 10 percent of the population received poor welfare benefits (Sverige Socialutredningen Citation1974, 39). According to the aggregated 1930 census report, people with disabilities had an overall low capacity to work and to live independently without state support (Statistiska Centralbyrån Citation1936).
References
- Åmark, K. 2005. Hundra år av välfärdspolitik. Välfärdsstatens framväxt i Norge och Sverige [One hundred years of welfare policy. The rise of the welfare state in Norway and Sweden]. Umeå: Borea.
- Anderson, M. J. 1988. The American census: A social history. New Haven and Yale: Yale University Press.
- Axelsson, P. 2010. Abandoning “the Other”: Statistical Enumeration of Swedish Sami, 1700 to 1945 and Beyond. Berichte Zur Wissenschaftsgeschichte 33 (3):263–79. doi: 10.1002/bewi.201001469.
- Axelsson, P., and M. J. Wisselgren. 2018. Sweden in 1930 and the 1930 census. In Three centuries of northern population censuses, ed. G. Thorvaldsen, 61–86. Abingdon: Routledge.
- Björkman, J. 2001. Vård för samhällets bästa: Debatten om tvångsvård i svensk lagstiftning 1850–1970 [Care for the sake of society. The debate on compulsory care in Swedish Legislation, 1850–1970]. Stockholm: Carlssons.
- Brännlund, I., and P. Axelsson. 2013. Family matters: Representation of Swedish Sámi households at the turn of the nineteenth century. In About the hearth: Perspectives on the home, hearth, and household in the circumpolar north, ed. D. G. Anderson, R. P. Wishart, and V. Vate, 103–22. Oxford and New York: Berghahn Books.
- Broberg, G., and M. Tyden. 1996. Eugenics in Sweden: Efficient care. In Eugenics and the Welfare State: Sterilization Policy in Denmark, Sweden, Norway, and Finland, ed. G. Broberg and N. Roll-Hansen, 77–149. East Lansing: Michigan State University Press.
- Desrosières, A. 1998. The politics of large numbers: A history of statistical reasoning. Cambridge: Harvard University Press.
- Drugge, U. 1988. Om husförhörslängder som medicinsk urkund: Psykisk sjukdom och förståndshandikapp i en historisk källa [Catechetical examination registers as a medical record: Mental illness and intellectual disability in a historical source]. Umeå: Forskningsarkivet, Umeå Universitet.
- Engwall, K., and S. Larsson, eds. 2012. Utanförskapets historia: Om funktionsnedsättning och funktionshinder [The history of exclusion: About impairment and disability]. Lund: Studentlitteratur.
- Förhammar, S. 2004. Svensk handikappolitik: Från separation till integration [Swedish disability policy: From separation to integration]. In Funktionshinder i ett historiskt perspektiv [Disability in a historical perspective], ed. S. Förhammar and M. C. Nelson, 45–66. Lund: Studentlitteratur.
- Hacking, I. 1986. Making up people. In Reconstructing individualism: Autonomy, individuality, and the self in Western thought, ed. T.C. Heller, M. Sosna, and D.E. Wellbery, 222–36. Stanford, Calif.: Stanford University Press
- Historical Statistics of Sweden. 1969. Part 1. Population. 2nd ed., 1720–967. Stockholm: Statistics Sweden.
- Höjer, H. 2001. Svenska siffror: Nationell integration och identifikation genom statistik 1800–1870 [Swedish numbers: National integration and identification through statistics 1800–1870]. PhD diss., Gidlund, Hedemora.
- Junkka, J., G. Sandström, and L. Vikström. 2020. The emergence of social gaps in mental health: A longitudinal population study in Sweden, 1900–1959. Plos One 15 (4):e0232462. doi: 10.1371/journal.pone.0232462.
- Kudlick, C. 2018. Social history of medicine and disability history. In The Oxford Handbook of Disability History, ed. M. Rembis, C. Kudlick, and K. E. Nielsen, 105–124. Online edn, Oxford Academic. doi: 10.1093/oxfordhb/9780190234959.013.1.
- Kudlick, C. J. 2003. Disability history: Why we need another “other. The American Historical Review 108 (3):763–93. doi: 10.1086/529597.
- Levi, L. 1854. Resume of the Statistical Congress, held at Brussels, September 11th, 1853, for the purpose of introducing unity in the statistical documents of all countries. Journal of the Statistical Society of London 17 (1):1–4. doi: 10.2307/2338350.
- Lext, G. 1984. Studier i svensk kyrkobokföring 1600–1946 [Studies in Swedish parish registration 1600–1946]. Göteborg: Landsarkivet.
- Lie, E. 2002. Numbering the nationalities: Ethnic minorities in Norwegian population censuses 1845–1930. Ethnic and Racial Studies 25 (5):802–22. doi: 10.1080/0141987022000000277.
- Lie, E., and H. Roll-Hansen. 2001. Faktisk talt: Statistikkens historie i Norge [Actually speaking: The history of statistics in Norway]. Oslo: Universitetsforlag.
- Mont, D. 2007. Measuring health and disability. The Lancet 369 (9573):1658–63. doi: 10.1016/S0140-6736(07)60752-1.
- Olsson, I. 2004. Synen på avvikelse [The view of deviance]. In Funktionshinder i ett historiskt perspektiv [Disability in a historical perspective], ed. S. Förhammar and M. C. Nelson, 87–104. First edition. Lund: Studentlitteratur.
- Osamu, S. 1996. Historical demography: Achievements and prospects. Population Studies 50 (3):537–53.
- Qvarsell, R. 1991. Vårdens idéhistoria [The idea history of care]. Stockholm: Carlsson.
- Randeraad, N. 2011. The International Statistical Congress (1853-1876): Knowledge transfers and their limits. European History Quarterly 41 (1):50–65. doi: 10.1177/0265691410385759.
- Riving, C. 2012. Från fånighet till ADHD. Glimtar ur de psykiatriska diagnosernas historia [From stupidity to ADHD. Glimpses from the history of psychiatric diagnoses]. In Utanförskapets historia: Om funktionsnedsättning och funktionshinder [The history of exclusion: About impairment and disability], ed. K. Engwall and S. Larsson. Lund: Studentlitteratur.
- Rogers, J., and M. C. Nelson. 2003. “Lapps, finns, gypsies, jews, and idiots”? Modernity and the use of statistical categories in Sweden. Annales De Démographie Historique 105 (1):61–79. doi: 10.3917/adh.105.79.
- Schor, P. 2017. Counting Americans: How the US Census classified the nation. New York: Oxford University Press.
- Sjöström, O. 1998. Svensk statistik 250 år: Tabellverket och Pehr Wargentin [Swedish statistics 250 years: Tabellverket and Pehr Wargentin]. Statsvetenskaplig Tidskrift 101:391–492.
- Sjöström, O. 2002. Svensk statistikhistoria: En undanskymd kritisk tradition [Swedish statistical history: A neglected critical tradition]. Hedemora: Gidlund.
- Sköld, P. 2004. The Birth of Population Statistics in Sweden. The History of the Family 9 (1):5–21. doi: 10.1016/j.hisfam.2001.10.001.
- Statistiska Centralbyrån. 1865. Folkräkningen den 31 December 1860 [1860 census]. Stockholm: P.A. Nordstedt & Söner.
- Statistiska Centralbyrån. 1874. Folkräkningen den 31 December 1870 [1870 census]. Stockholm: P.A. Nordstedt & Söner.
- Statistiska Centralbyrån. 1885. Folkräkningen den 31 December 1880 [1880 census]. Stockholm: P.A. Nordstedt & Söner.
- Statistiska Centralbyrån. 1895. Folkräkningen den 31 December 1890 [1890 census]. Stockholm: P.A. Nordstedt & Söner.
- Statistiska Centralbyrån. 1900. Församlingsboksutdrag [pre-printed census form for the 1900 census]. SE/RA/420401/08/H 1 AA/25. https://sok.riksarkivet.se/bildvisning/A0061156_00030.
- Statistiska Centralbyrån. 1907. Folkräkningen den 31 December 1900 [1900 census]. Stockholm: P.A. Nordstedt & Söner.
- Statistiska Centralbyrån. 1918. Folkräkningen den 31 December 1910 [1910 census]. Stockholm: P.A. Nordstedt & Söner.
- Statistiska Centralbyrån. 1925. Folkräkningen den 31 December 1920 [1920 census]. Stockholm: P.A. Nordstedt & Söner.
- Statistiska Centralbyrån. 1936. Folkräkningen den 31 December 1930 [1930 census]. Stockholm: P.A. Nordstedt & Söner.
- Sverige Socialutredningen. 1974. Socialvården: Mål och medel. Sammanfattning av Socialutredningens principbetänkande SOU 1974:39 [Social services: Goals and means. Summary of the Social Investigation’s principle report SOU 1974:39]. Stockholm: Göteborgs offsettryckeri.
- Thorvaldsen, G. 2018. Censuses and census takers: A global history. London: Routledge/Taylor & Francis Group.
- Vikström, L. 2010. Identifying dissonant and complementary data on women through the triangulation of historical sources. International Journal of Social Research Methodology 13 (3):211–21. doi: 10.1080/13645579.2010.482257.
- Vikström, L., E. Häggström Lundevaller, and H. Haage. 2017. First a job, and then a family? Impacts of disabilities on young people’s life courses in a nineteenth-century Swedish region. Disabilities Studies Quarterly 37:4.
- Westrin, T. 1907. Fallandesot. Nordisk familjebok, 1323. Stockholm: Nordisk familjebok.
- Wicksell, S. 1922. Bilaga till statistiksakkunnigas betänkande. Redogörelse för huvuddragen av den officiella statistikens utveckling och nuvarande organisation i Sverige jämte kort översikt av dess organisation i vissa främmande länder samt i internationellt hänseende. Stockholm: Finansdepartementet.
- Wisselgren, M. J., S. Edvinsson, M. Berggren, and M. Larsson. 2014. Testing methods of record linkage on Swedish censuses. Historical Methods: A Journal of Quantitative and Interdisciplinary History 47 (3):138–51. doi: 10.1080/01615440.2014.913967.