
Abstract
The lack of long-term assessment of the administrative divisions of Galicia, a former part of the Austrian monarchy, has so far been a serious obstacle in the mapping and spatial analyses of archival census data. To fill this gap, we reconstructed the boundaries of 5944 cadastral communes, court districts, and political districts into circles (https://doi.org/10.7910/DVN/PXDP41). Geometric boundaries are accompanied by different names according to census and cartographic sources. We found that a detailed reconstruction of the administrative units for Galicia is critically important for appropriately using census data in spatial analyses. So far, it has been neglected or considered difficult to perform because of the large area of the region, frequent administrative changes, and time-consuming map processing.
Introduction
A great deal of data on demographic and economic processes, e.g. population censuses, forest and agricultural statistics, and industrial and trade statistics, have been and are still being collected for administrative units, such as districts and communes. Therefore, the reconstruction of historical administrative divisions is critically necessary for the correct spatial referencing of these data, their mapping, the determination of different patterns, and various spatial analyses (Gregory and Southall Citation2002; Cunningham Citation2014).
This is why we have undertaken to reconstruct the long-term (1857–1910) administrative boundaries in Galicia at the level of circles, districts, and communes from medium- and large-scale maps so that the data from each of the censuses that were conducted in the Austro-Hungarian Empire every ten years or so from 1857 onwards can be mapped for them (Teibenbacher, Kramer, and Göderle Citation2012). The frequent and complicated changes in the administrative division of Galicia in the second half of the nineteenth century have caused great difficulties in the mapping and analysis of socioeconomic data for this part of Europe (Burzyński Citation1982). Even 19th-century statisticians emphasized the complexity of this problem (Pilat Citation1883). Therefore, scholars needed to create, from scratch, on a large scale, order, and coherence in the reconstruction of administrative divisions over a period of over 50 years, despite the fact that earlier attempts had already been made for various administrative levels in various parts of Galicia.
Border reconstruction at the circle and district level has so far been carried out at overview scales (1:700,000 and smaller) by Burzyński (Citation1982), Himka (Citation1990), and others. A. Burzyński (Citation1982) checked the comparability of the administrative areas of all of Galicia for the period between 1880 and 1910 at the level of districts at the scale of ∼1:3,000,000. Himka (Citation1990) drew province and district borders for eastern Galicia (∼60% of Galicia overall) for the years 1867–1868 and 1910 at the scale of ∼1:2,500,000. District boundaries were also reconstructed by various authors in historical atlases generally at overview scales of about 1:2,000,000 (e.g. Paździora Citation2021). These data are therefore generalized and are not available as vector files for use with software employed by geographic information systems. District maps for the entire Austro-Hungarian Empire in digital versions, generally for 1- or 2-time profiles, were produced as part of the Mosaic (https://censusmosaic.demog.berkeley.edu/) and HistoGIS (https://histogis.acdh.oeaw.ac.at/) projects. The basis for the preparation of these files were maps at overview scales of ∼1:700,000.
The reconstruction of cadastral commune boundaries has so far been carried out, for example, by Soja (Citation2008) and Affek et al. (Citation2021), both for substantial parts of the Polish Carpathians. Their areas of study cover ∼24 and 22% of Galicia, respectively. They used boundaries reconstructed from overview maps of Galicia at the scale of 1:144,000 to 1:600,000 (Soja Citation2008) and mainly 1:115,200 (Affek et al. Citation2021). They did not reconstruct circle or district boundaries. One or more commune boundaries were reconstructed also by other authors (e.g. Wolski Citation2007 for 61.7 km2, Wnęk Citation2011 for 8.3 km2, Affek Citation2016 for 233 km2, Sobala, Rahmonov, and Myga-Piatek Citation2017 for about 45 km2).
Research work resembling our dataset has been performed for other parts of Europe and the world in general, increasingly in digital form (e.g. Gregory and Southall Citation2002; Bičík et al. Citation2015; Ostafin et al. Citation2020b; Gay Citation2021; COMMUNE HIS-DBD Project https://www.campop.geog.cam.ac.uk/research/projects/internationaloccupations/enchpopgos/france/). The demand for reliable historical borders is growing due to the digital availability of archival data on the Internet, for example, the Austrian Österreichische Nationalbibliothek (www.onb.ac.at), Polona (https://polona.pl/), Federacja Bibliotek Cyfrowych (https://fbc.pionier.net.pl/). With these data fusion possibilities, it is likely to extend many demographic, economic and genealogical analyses (Massey et al. Citation2018; Bukowski et al. Citation2019; Cherkesly, Dillon, and Gagnon Citation2019; Palma, Reis, and Zhang Citation2020) as well as to understand the effects of land use changes (Sobczyński Citation1993, Citation2018; Munteanu et al. Citation2015; Szabó et al. Citation2018; Leyk and Uhl Citation2018). In the post-communist countries of Central Europe in particular, the need for a historical dataset for mapping is enormous (Drummond and Lubecki Citation2010; Szady Citation2017; Haid Citation2017; Bukowski et al. Citation2019; Mick Citation2019).
Our dataset contains 16 digital layers of administrative borders, in zipped shapefile vector format, together with attributes, such as names in several versions according to census and cartographic sources, areas from statistical sources and the geometry of our outline, and codes for different levels of administrative units, so that the correspondence of these areas can be compared. While the borders of cadastral communes were very stable during the period we studied, the borders of districts changed significantly between successive censuses (Pilat Citation1883). Sometimes new units were created and sometimes cadastral communes were assigned to different districts (Burzyński Citation1982).
District borders are very important as the largest number of statistical data publications are given specifically for districts (Österreichische Nationalbibliothek (www.onb.ac.at), see: Supplementary Material, Part F).
The user of our database has the option of attaching any type of statistical data to the reconstructed borders with the certainty that he or she is relating them to the geographic areas that we have validated. Our database can be extended for additional years, but this requires going to sources already created under other historical circumstances associated with the countries that had emerged after the collapse of the Austro-Hungarian Empire after World War I.
Research area
The Polish–Lithuanian Commonwealth (Crown of the Kingdom of Poland and the Grand Duchy of Lithuania) was divided at the end of the eighteenth century by the Russian Empire, the Kingdom of Prussia, and the Austrian Monarchy (after 1867, the Austro-Hungarian Empire). Galicia includes the territories that were occupied by Austria (Pogonowski Citation1988; Evans Citation2008; Pounds Citation2009). The name Galicia has its origins in the principality of Halych, later the principality of Galicia–Volhynia, which emerged after the disintegration of the Kievan Rus’ (Wolff Citation2010; Abbot Citation2018). shows the boundaries of Galicia that were formed after the Congress of Vienna in 1815, the incorporation of the Republic of Cracow in 1846, and the exclusion of Bukovina in 1849.
Figure 1. The study area. Source: The Authors.
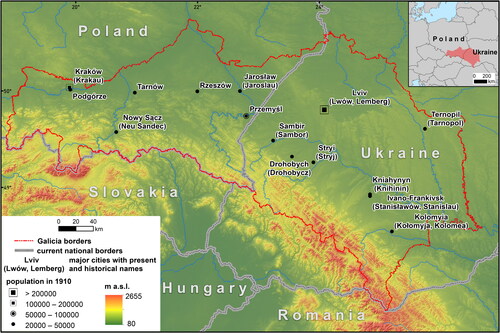
Galicia existed until World War I, and after Poland regained its independence in 1918, it was again a part of Poland until World War II. After the Second World War, almost 60% of the area of Galicia fell within the borders of the Soviet Union (as a part of the Ukrainian Soviet Socialist Republic), and since 1991, that same area has been part of independent Ukraine (Himka Citation1990; Wolff Citation2010).
Historical background
Before 1848, there were two levels of state administration of Galicia: circles (Kreise) and dominions (Landgut, Dominium) (Wolff Citation2010; Grzybowski Citation1959). Circles included several hundred localities (300–400 villages and towns). The head of a circle included a circle head and circle commissioner whereas dominions, ranging from one to several dozen localities, belonged to a single landowner. The heads of a circle were responsible for registering migrations of the population, recruiting for military service, supervising customs and passport matters, and controlling dominions (Grodziski Citation1971). The owner of a dominion was the feudal overlord of the population residing on his land. He was responsible for judicial, policing, and administrative matters typical of state administrations (Pilat Citation1878, Citation1883; Grzybowski Citation1959; Grodziski Citation1971).
After 1848 and the Spring of Nations, enfranchisement reform abolished the landowner’s jurisdiction over his subjects, and the dominion—as the basic administrative unit in Galicia and a pillar of the feudal system—lost its raison d’être (Ślusarek Citation2002). The development of a new administrative system became a necessity, and the foundations for such a system were laid between 1851 and 1855. The new administrative division had three levels, with the highest level being circles, the middle, districts (Bezirke), and the lowest, communes (Gemeinde) (Pilat Citation1878, Citation1883; Grzybowski Citation1959).
Before the new administrative division was stabilized, two parallel administrative systems, old and new, operated in practice for many years (Pilat Citation1878). This duality was only abolished in the 1860s. After Galicia was granted autonomy and communal and district local governments were established, circles were abolished in 1865, and their competencies were mostly transferred to the districts. Thus, instead of the planned three-level administrative system, a two-level system was introduced, in which the basic units of territorial administration were political districts (Politische Bezirke), each of which contained several court districts (Gerichtsbezirke), and communes became the second level. The head of a district was a district commissioner. He performed tasks assigned by higher government authorities, supervised communes, supervised the collection of taxes, adjudicated in criminal and administrative cases in the district, and watched over security and public order (Pilat Citation1883; Grzybowski Citation1959).
The commune was first introduced “an institution by the Provisional Municipal Law of March 17, 1849, but it was regulated by a new Imperial law on March 5, 1862, and an act of the national Galician parliament on August 12, 1866, on the organization of communes. This law passed by the national parliament recognized ‘every settlement (village, town, city) that currently ha[d] its own communal board’ as a commune.” At the same time, manor areas (Gutsgebiete) were created; these were defined as “holdings of land” that were “formerly dominions” and that had a supervisor who was usually the owner of the dominion. The head of a commune or the mayor of a town performed tasks assigned by higher government authorities, registered population movements (registration of residence, marriages), adjudicated on criminal and administrative matters in the commune, oversaw safety and public order (local police), managed the commune’s property and roads, and operated and maintained communal schools (Pilat Citation1883; Grzybowski Citation1959).
Cadastral communes (Katastralgemeinde) were established as organizational units for the taxation of land cadastre (Stabiler Kataster) measurements. One cadastral commune usually corresponds to one political (administrative) commune and one manor area, but there are also more complex relationships. Relationships between both divisions—administrative and cadastral—can be found in the census data, which is the most important point of the reconstruction of the administrative division presented in this paper (Pilat Citation1878, Citation1883).
A table with the structure for the two administrative systems of Galicia that overlapped in the mid-nineteenth century, the authorities of the units and their prerogatives, and selected additional divisions are available in Supplementary Material, Part A.
Methods
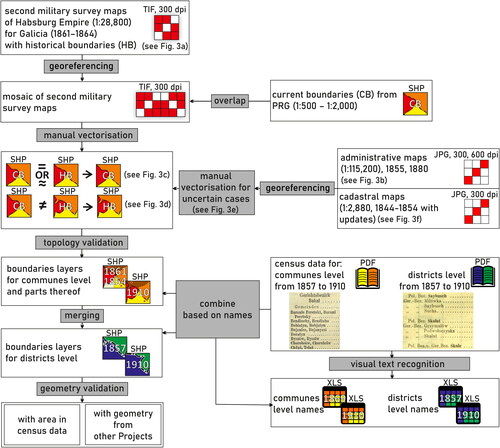
As shown in , our studies included historical map processing, census data preparation and merging, and validation of both sources of historical data. Despite the considerable progress made in automatic methods of data extraction from historical maps (Piechl Citation2020; Chen et al. Citation2021), in our border reconstruction, we used manual vectorization. Manual vectorization is probably more cost-intensive than automated vectorization, but given enough experience on the operator’s side, it can better handle difficult cases. In many instances, where the quality of the historical source materials is poor, e.g. paper damage, dark overlapping symbols, or lack of symbols (by default the border is found along other objects), manual work is generally more accurate (Ostafin et al. Citation2017). During vectorization, it was necessary to use auxiliary maps in cases where the symbols for boundaries on the basic maps were difficult to interpret. Difficulties were generally caused by the dominance of dark colors and dense symbols (e.g., relief depicted by crosshatching) in the Ukrainian and Polish Carpathians. Administrative boundaries in some sections were not marked with continuous symbols, but with various topographic objects, such as roads, streams, and land use boundaries, which also simultaneously served as administrative boundaries. When reconstructing the names of villages, towns, and districts, human operators had to use visual text recognition because of the presence of characters specific to the Polish language and, in some places, illegible fonts in the digital scans.
Figure 2. Workflow for the production of the dataset. Source: The Authors.
Cartographic data sources
The most detailed and accurate source of information on the administrative division of Galicia is surveys of the Austrian stable cadastres established for individual cadastral communes (Hernik et al. Citation2020; Banasik and Borowski Citation2021). For the cadastral communes of Galicia, the cadastral survey was based on a detailed field survey conducted in this crown land in 1824–1830 and 1844–1854. Cadastral plans based on these measurements, at a scale of 1:2880 (in the mountains 1:5760; in towns 1:1440), document, among other historical features, administrative divisions.
Due to the dispersion and incompleteness of cadastral survey plans (in Ukrainian and Polish archives) for Galicia (Stoksikówna Citation1975; Nowak Citation2021), deriving boundaries from these sources is very difficult. Similar efforts for areas much smaller than Galicia, such as Bukovina (10,442 km2) (Rumpler, Scharr, and Ungureanu Citation2015) and Austrian Silesia (5150 km2), are long-term projects (http://www.franziszeischerkataster.at).
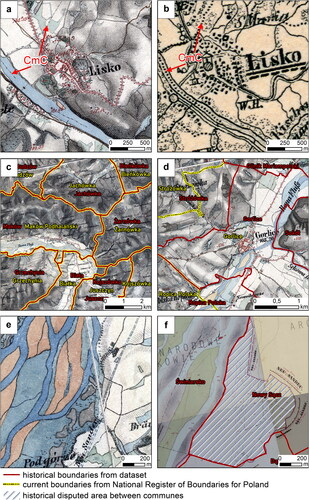
Hence, for the reconstruction of more than 98.5% of the length of the studied boundaries, we used 413 map sheets from the second military survey for Galicia (1861–1864; 1:28,800) (Ostafin et al. Citation2020a), compiled by a 10-fold reduction in cadastral plans, as a basis for reconstructing the boundaries of cadastral communes. The example of Lesko (Lisko) is provided in . For large parts of central Europe, these maps are available on the web service Mapire (https://maps.arcanum.com/en/). The supporting maps (), for the reconstruction of about 1% of the length of our boundaries, are administrative maps, at a scale of 1:115,200, in two editions (1855 and 1880), each with 53 sheets covering Galicia. The administrative map is informally known as the Kummerer von Kummersberg map, after an Austrian military officer. On these maps, the administrative boundaries are significantly more generalized than in the second military survey but are generally legibly drawn. In the second military survey, the interpretation of boundaries was hampered by relief drawing and, to a lesser extent, by the road network and the dense network of symbols, such as in towns. Online cadastral maps (1:2880) available on the websites Szukaj w Archiwach (https://www.szukajwarchiwach.gov.pl/) or Gesher Galicia (https://www.geshergalicia.org/) were used only in problematic cases, <0.5% of the length of reconstructed boundaries, such as where the course of administrative boundaries was difficult to interpret from the second military survey and administrative maps.
Figure 3. Examples of administrative boundary vectorization based on archival maps. (a) Second military survey map (1:28,800) with cadastral commune boundaries, CmC; (b) administrative map (1:115,200) with cadastral commune boundaries, CmC; (c) boundaries with no changes; (d) change connected to urban expansion; (e) no boundary symbol in the riverbed; (f) explanation of the lack of a boundary symbol in the riverbed based on a cadastral map (1:2880) due to disputed area between the communes. Source: The Authors.
Maps of the second military survey were extracted from the War Archive in Vienna and the Österreichisches Staatsarchiv in the form of 300 dpi TIFF scans. Administrative maps of Galicia were obtained from the Jagiellonian Digital Library (https://bj.uj.edu.pl/) for 1855 as 300 dpi scans in JPEG format and from the University of Vienna for 1880 as 600 dpi scans in TIFF format.
Geometric correction and georeferencing
Georeferencing was employed for the second military survey maps using other reference data. For the Polish part of Galicia, Polish topographic maps at a scale of 1:25,000 from the 1970s were used. Maps produced in the 1965 Polish coordinate system based on the Pulkovo-42 reference frame were obtained as raster images transformed to the PL-1992 coordinate system based on the ETRF-89 reference frame. In the case of the Ukrainian part of Galicia, high-resolution World Imagery, Digital Globe imagery, and Soviet military topographic maps at scales of 1:25,000, 1:50,000, and 1:100,000 were used. Soviet maps produced in the 1942 coordinate system based on the Pulkovo-42 reference frame were transformed to the appropriate zone of the UTM coordinate system.
The map sheets of the second military survey were cropped along a map frame. Each cropped image was processed separately, using at least 20 control points per sheet. Points were chosen from triangulation points, historical buildings (e.g., churches), recognizable crossroads, bridges, and viaducts. In the absence of such points, river/stream connections (confluences) were also used. Geometric correction and georeferencing to the 1992 or UTM coordinate system were obtained using second-order polynomial transformation. For map sheets with small amounts of coverage along the Galicia border, a first-order polynomial transformation was applied. The total root mean square error for the majority of the sheets reached a value between 10 and 30 m and occasionally exceeded 30 m. The selected method of geometric correction differs from methods used in georeferencing for the second military survey by Timár et al. (Citation2006) and Affek (Citation2013). These authors georeferenced the second military survey using projection and datum parameters, within the case of Affek’s work—additional affine transformation based on triangulation points, presented on maps. Such methods do not correct geometric errors or they correct only the smallest errors typical for triangulation points.
Geometric errors for the second military survey may reach 50–100 m (Konias Citation2000), and the only way to minimize such errors is, in our opinion, to use a dense network of stable control points, regularly distributed across each section of the second military survey. In the final step, the georeferenced set of sheets was transformed to the Lambert azimuthal equal-area projection layout (EPSG 9820) in ArcMap 10.8 using georeferencing tools. Administrative maps at a scale of 1:115,200 were georeferenced to the maps of the second military survey. For 1880, we used 2498 control points, and the average root mean square error was 87.01 m. For 1855, we used 212 control points on the corners of the map content frames, fitting them into the 1880 edition.
Manual vectorization
Manual vectorization was carried out at scales ranging from 1:2000 to 1:5000. Editing tools in ArcMap 10.8 were used. For Poland, the current administrative boundaries from the National Register of Boundaries (www.gugik.gov.pl/pzgik) were helpful. The Galician cadastral commune is a counterpart of the contemporary Polish communal district, and units of the territorial division are still in use e.g. in Austria (Katastralgemeinde), the Czech Republic (katastrální území), and Italy (comune catastale). If historical and contemporary boundaries overlapped, the contemporary boundaries were accepted, as shown in . Otherwise, the course of historical borders was reconstructed based on archival maps as in . This was done even when there were clear discrepancies in short sections of borders, such as meandering and changing riverbeds (as in ), or in the case of administrative borders before the construction of reservoirs. Neither the maps of the second military survey at a scale of 1:28,800 nor the administrative maps at a scale of 1:115,200 contained the boundaries of the manor areas. This makes it impossible to reconstruct administrative divisions at the level of political communes and manor areas. In some cases, precise reference of the statistical data to the spatial information is not possible without using cadastral data, as changes in the administrative boundaries could be conducted even at the level of single parcels of land. However, at the scale of the analysis (the crown land Galicia), such changes are negligible.
For Ukraine, the borders were vectorized without any reference to modern borders. Until the completion of vectorization in Ukraine, there were no unit boundaries available for lower-level administrative units. The changes in territorial division under the USSR and later in independent Ukraine were greater than those in Poland (Himka Citation1990). Cadastral communes were aggregated into higher subdivisions using the Dissolve tool in ArcMap 10.8.
Census data
The basis for reconstructing the higher-level units in each census year from the vectorized cadastral communes was the commune and district lists signed by the Central Statistical Commission (K. K. Statistische Central Commission). The geometries of the administrative boundaries were accompanied by attributes of the names of the administrative affiliations according to the lists.
Several supporting publications generally gave the areas of higher administrative units: the Tafeln zur Statistik der oesterreichischen Monarchie—Neue Folge, published in 1849–1865, and then the Statistisches Jahrbuch published from 1863 to 1881. These were later followed by Österreichische Statistik for 1880–1910 and Österreichische Statistik and Neue Folge for 1910–1914. The largest collection is available at the Österreichische Nationalbibliothek (https://www.onb.ac.at/).
1857
Data on the affiliation of cadastral communes with circles and districts were established based on a publication from 1855 (Skorowidz wszystkich miejscowości 1855) and an administrative map at a scale of 1:115,200 from 1855. For Eastern Galicia, the affiliation of communes with districts was checked against the list of settlements for 1857 (Handbuch des Lemberger Statthalterei 1857).
Data on the upper-level administrative division of Galicia came from the publication of census data for the whole monarchy as of October 31, 1857 (Statistische Übersichten 1859). According to this source, Galicia consisted of two parts: the Eastern (Ost-Galizien) under the administration of Lviv (Lemberger Verwaltungs-Gebiet) and the Western (West-Galizien) under the administration of Kraków (Krakauer Verwaltungsgebiet). Eastern Galicia was divided into the city of Lviv (Landeshaupstadt), 12 circles, and 110 districts (Stadt- und Land-Bezirke), and Western Galicia into the city of Kraków, 7 circles, and 67 districts (). As shown in Supplementary Material, Part E, thanks to reconstruction at the level of cadastral communes, it is possible to establish an enclave of circles in other circles, as well as enclaves of districts in other districts.
Table 1. Summary of the numbers of reconstructed administrative units and parts thereof for census years and second military survey years.
According to the abovementioned census publication of 1857, Galicia would have an area of 1360.66 square Austrian miles, which converts (Jansen Citation1900) into 78,301.14 km2, which can be compared to the area of the cadastral Galician communes we have indexed, 78,463.81 km2.
1869
The main source for ordering administrative units was the publication of the 1869 census (Orts-Repertorium des Kӧnigreiches Galizien 1874). In this publication, the districts are arranged alphabetically with lists of communes and parts thereof (Ortschaft). The list includes the division of communes into political communes (Orts-Gemeinden) and manor areas. For both areas, the number of buildings and the population are indicated, giving the number of men and women individually. The values for these two areas, generally with the same name, sum to the value for the cadastral commune.
The difficulties in compiling the data are indicated in the preface to the publication, even though 5 years have passed since the census was conducted. The difficulties resulted from the short time that had passed since the major administrative reform of Galicia and the specific conditions of land ownership in Galicia on a monarchical scale, that is, the large number of manor areas. The problem was also the definition of census units within districts, that is, parts of the communes and settlements (Pilat Citation1878, Citation1883).
An additional data source was seven published volumes containing the census for the entire monarchy at the district level (Bevölkerung und Viehstand 1871). In the available volumes, there was no direct information on the area of the districts. This can be calculated indirectly, for example, from the population density (Bevölkerung und Viehstand 1872, 39). Population figures from commune and district publications coincide and amount to 5,418,016. The population totals agree for 73 of the 74 districts and two cities with their own statutes. In only one district (Zhovkva, Żółkiew) did the population sums differ (by 10 persons). This was an error in the summation of men and women in the publication compiling political communes and manors. In the publication for districts, as in the publication for communes, discrepancies regarding population density in districts were noted. The published areas of the districts were obtained by the Central Statistical Commission from the Lviv Governorate (K. K. Statthalterei in Lemberg) and diverged from the cadastral measurements by 8.69 square Austrian miles (∼500.10 km2).
In the publications of the Statistisches Jahrbuch series for Galicia from this period (Statistisches Jahrbuch 1871), the same population figures are given for individual districts, and as in the seven-volume publication mentioned above, the area of the districts is missing.
For 1869, after comparison with the census publications, we vectorized two cities with their own statutes, 74 districts, 5875 cadastral communes as areas, and 931 political communes and parts thereof or manor areas as points, as shown in and Supplementary Material, Part E. For Galicia in 1869, neither the list of communes nor the list of districts indicated the court districts, unlike such neighboring crownlands as Silesia or Bukovina.
1880
The primary source for 1880 was the compilation of communes (Special-Orts-Repertorium 1886). This bilingual German-Polish publication lists the communes in the alphabetical register of districts with data for buildings, population divided into men and women, four categories of religious affiliation, and four categories of vernacular language. Schools, parish seats, railways, post offices, and telegraph offices were listed under the name of each commune. Political communes are listed separately from the manor areas. A second source of information was the reference books for the districts of the monarchy from the census of December 31, 1880, in the Österreichische Statistik series (Oesterreichische Statistik Citation1882).
Additional publications included reference books for the districts in the Statistisches Jahrbuch series (Statistisches Jahrbuch 1883). In 1880, the total population of Galicia differed by 6953 inhabitants from the total population in the list of communes. This volume included an annotation (on page 9) regarding inconsistencies in the districts relative to the data from 1877. It is worth noting that the next volume of the Statistisches Jahrbuch series provides direct areas for all political and court districts, together with the population for 1880 (Statistisches Jahrbuch 1884). The total area of Galicia, summed from the areas of the individual districts, was 78,507.89 km2. The population is in agreement with that given for the list of communes (Special-Orts-Repertorium 1886); for example, the area of the city of Cracow differs by 4.91 km2 but has the same number of inhabitants (66,095). For 1869, we reconstructed the borders of the two cities with their own statutes (Lviv, Kraków), 74 political districts, and 176 court districts ().
1890
For 1890, a compilation of communes published in a bilingual German-Polish edition was used (Special Orts-Repertorium 1893). This publication lists the communes in the alphabetical register of districts (Bezirks-Hauptmannschaft) and court districts (Gerichts-Bezirk) with data for buildings, populations of men and women, four categories of religious affiliation, four categories of vernacular language, and various types of institutions present in the communes. Manor areas are listed separately from administrative communities. The second source of data on the area of districts from cadastral measurements as of December 31, 1890 are publications from the Österreichische Statistik series (Oesterreichische Statistik Citation1892). We also reconstructed two cities with their own statutes, 74 political districts, and 178 court districts ().
1900
The list of communes for 1900 (Gemeindelexikon der im Reichsrate Citation1907) is the most detailed published list for 1857–1910. It contains information about administrative communes, cadastral communes, and manor areas with mutual relationships. For both types of communes, the area is given in hectares. For administrative communes and manor areas, the publication contains the number of inhabitants divided into men and women, religious affiliation, and four categories of vernacular language, as well as the number of buildings. For cadastral communes, the publication lists, among other items, five categories of data on land use, four categories of farm animals, and the number of large land holdings and factories. For 1900, we reconstructed two cities with their own statutes, 78 political districts, and 184 court districts ().
1910
For 1910, the publication on communes for parts of the Austrian monarchy was used (Allgemeines Verzeichnis 1915); it lists Galician districts, administrative communes, parts thereof, and manor areas. It provides population data for each of these. The publication was issued in 1915, and the compilation lists the communes with administrative changes made after 1910. However, thanks to the list of changes in the affiliation of communes, it is possible to reconstruct the status in the census of December 31, 1910. For 1910, we reconstructed two cities with their own statutes, 81 political districts, 186 court districts, 5870 municipalities as areas, and 432 points for parts of administrative communes or manor areas ().
Results
Data records
The resulting dataset of administrative units (accessible at https://doi.org/10.7910/DVN/PXDP41) is an open vector SHP format that is used by most GIS programs and is easily converted to other formats. We attach metadata to each shapefile layer as a file with the same name as the layer with an XML extension based on the ISO 19139 Metadata Implementation Specification GML 3.2 standard, in which the data sources for the geometry and the aggregation method and the source of the administrative unit names are explained. For each layer, there is also a readme file with metadata in the form of a simple text file.
These layers are stored in 16 compressed ZIP archives. The ZIP archives can be opened directly using open source software, such as QGIS or after extraction, e.g., using 7-Zip or WinZip, as well as with a single command Add Data to ArcGIS Desktop or ArcGIS Pro. The layers are given the acronyms GAL (Galicia) and YYYY (years); the special reference units are given the acronyms CL (crow land), Cr (circles), DP (political districts), DC (court districts), CmC (cadastral communes), CmPp (part of political communes), and CmCp (part of cadastral commune) ().
Table 2. Names of layers in the dataset.
The attributes in the layers contain names, areas, and administrative unit codes similar to Ostafin et al. Citation2020b (see Supplementary Material, Part A). The names of the communes are listed in the attribute table (.dbf file) according to the cartographic and census sources (). The source of the names is in the metadata of each layer. Names for the same communes may differ, for example, because of the different inscriptions of Polish characters or phonetic notations in the sources. In some cases, the differences were due to an actual name change. Polish characters are in UTF-8 encoding.
Table 3. List of attributes covered by the dataset.
The names of the districts are written in accordance with their census sources for the districts in each census year. Additionally, each district has had a name since 1910, when the names were well established. The codes for each level of administrative units can help the user to create a time series of the duration of administrative units. The codes of the same units are the same between 1857 and 1910.
The areas are given as geometric and statistical source areas. The affiliation of cadastral communes with units of a higher level of administrative division enables the analysis of changes in administrative divisions in the time sections of censuses.
A complete list and maps of administrative units—circles, political districts, and court districts—can be found in Supplementary Material, Part B.
Technical validation
The data acquired by manual vectorization were inspected by topological correctness tools in ArcMap 10.8, using the rules Must Not Overlap and Must Have no Gaps, with a tolerance of 0.001 m.
The areas of the vectorized cadastral communes were compared with those of cadastral communes published in the 1900 census (Gemeindelexikon der im Reichsrate Citation1907). For 98.0% of the cadastral communes, the differences between the spatial and census data were between −5 and 5%, with the absolute values being highly dependent on the size of the commune (see: Supplementary Material, Part E). For the 58 cadastral communes with >5% area differences from the average size of the commune (total area: 1321 ha), the average area was 646 ha, and for the 61 communes with < −5% area differences, the average area was 543 ha.
In the case of the 119 cadastral communes with the largest discrepancies, that is, for 53 cases, >5 or < −5% real boundary changes were identified by comparing the second military survey maps with the 1880 administrative maps or the textual and graphic annotations on cadastral plans. For 23 cases, no boundary changes were identified between the second military survey and the 1880 administrative map, and cadastral plans that could explain the discrepancies, mainly from Ukraine, were not available online. For 37 cases, the boundaries were in the beds of large rivers, where boundary changes may have occurred, for example, due to changes resulting from floods, and may have been areas disputed by two communes. In numerous sections, the border of Galicia with the Russian Empire in the Vistula riverbed does not coincide with the borders of cadastral communes, which should simultaneously serve as borders with the Russian Empire. For the six cases with an average commune size of 44 ha, the error may be a result of the processing of underlay maps (root mean square error) or the generalization of borders on the 1:28,800 map.
We checked the reconstructed circles and districts, both political and court, by comparing their areas with those in the statistical censuses issued by the Central Statistical Commission in Vienna.
In 1857, for 86% of the circles (including Lviv, a city with its own statute), the differences between the area of the geometry and the area from the statistical censuses were < ±1%, whereas 14% of the circles (including the city of Kraków) showed differences of between 1 and 3%. For 93% of the districts, the differences between the area of geometry and the area from the statistical censuses were < ±5%. In subsequent time frames, 72% of the districts had ±5% area concordance for 1869, 97% for 1880, 100% for 1890, 100% for 1900, and 100% for 1910. For court districts, the percentage of correspondence between the geometric and statistical areas within ±5% was as follows: 92% (1880), 98% (1890), 100% (1900), and 98% (1910) (see: Supplementary Material, Part E).
For 1869, because of the least area concordance among all the timeframes, for districts, we aggregated population data from individual communes, assuming that the partial population data values would add up to the values given for the districts (see below: the example of Chortkiv [Czortków] district in 1869). For 93% of districts, there was full agreement regarding population totals; for 3% of districts, the difference between the totals was <0.05%, and for 4% of districts, the difference was <0.03%. The aggregation of population data from the level of cadastral communes allowed us to verify the areas of the districts and confirmed that some official data on the areas of Galicia’s districts for 1869 did not match the list of cadastral communes. Thus, published values for population density or livestock density are unreliable for some districts.
A complete set of comparisons of the areas of administrative units of the higher levels of the administrative division of Galicia (circles, political, and court districts) for the time frames of the censuses can be found in Supplementary Material, Part B.
Example of Kraków city, 1857–1910
The matching of statistical data with the geometry of Kraków’s boundaries is a more complicated example of identification, despite there being numerous sources and studies (Supplementary Material, Part C). Different sources for the same timeframes provide different areas and populations for Kraków.
There are several reasons for the inconsistencies in the datasets for the area and population of Kraków. The first results from a difference in how the territory of Kraków is understood. Kraków could be defined as a territory consisting of city parts or city districts (Stadtteile) or it could be defined as a cadastral commune. From 1857 to 1880, the Central Commission’s publications for districts probably indicated the area of Kraków by including the area of the nearby communes Dąbie and Grzegórzki, which were owned by the commune of Kraków (Skorowidz wszystkich miejscowości 1868). This area (0.23 square Austrian miles, 13.24 km2 after conversion) was similar to the area of the Kraków fortress (Festung Krakau), a military area within the territorial range from the 1850s (https://www.szukajwarchiwach.gov.pl/jednostka/-/jednostka/3065698).
Between 1857 and 1909, the cadastral commune of Krakow (8.3 km2) included the area of eight city districts (5.56 km2) and Czarna Wieś (2.76 km2), a political commune bordering Kraków to the west. In 1909 and 1910, the area of Kraków was enlarged by 12 neighboring cadastral communes, and the process of enlarging the city continued until 1915. In the Central Commission’s lists of communes from 1869 to 1910, the population and number of buildings in Krakow referred to the Kraków city districts. The total population of Kraków consisted of the sums of the population of the city districts. The area of the cadastral commune was given as 832 ha only in the 1900 list of communes.
The second reason for the discrepancies in the sources is the administrative changes to the area of Kraków close to the years in which the census was published. The census source could not take into account territorial changes if the changes were recent, or they might have taken them into account but assigned outdated census data to the changed administrative units. For example, this applies to the list of communes for 1910 published in 1915 (Allgemeines Verzeichnis 1915), in which, however, it is possible to reconstruct the status as of December 31, 1910, thanks to reliable footnotes.
A third reason for the discrepancies may be the adoption of different census population categories for the total population. For example, in the list of settlements made by a postal clerk for 1910 (Bigo Citation1914), the total population includes only the category of the civilian population (Zivilbevölkerung), without military population (actives Militär); although for 1880 and 1890, the same author compiled the total population (Bevölkerung) for Kraków.
A fourth reason for the differences includes typographical errors, such as 57.7 km2 for Kraków in 1880 (Special-Orts-Repertorium 1886) instead of 5.77 km2. There are also mistakes in exchanging the population figures for units with similar names, such as the 59,444 residents of the court district of Kraków being assigned in 1900 to the population of the city of Kraków (Bigo Citation1904).
Kraków is also a good example of how the slight rounding of the city’s area (from 8.32 km2 to 8 km2, representing a large population of 91,323 and a small area) in publications from 1900 can change the precision of population density calculations per km2 by 439 people. The differences in population density values were even greater when counting the population of the districts of Kraków per cadastral commune area. This problem did not apply to Lviv, where the city center and four suburbs coincided with the cadastral commune of Lviv.
Example of the Chortkiv district in 1869
The example of Chortkiv (Czortków) indicates that statistical sources signed by the Central Commission published for the same year are not always compatible and may juxtapose outdated areas with proper population census data.
The 1869 census of communes for the Chortkiv district lists 49 political communes and 48 manor areas, which can be combined into 47 cadastral communes whose boundaries we have vectorized. A comparison of the areas vectorized from the maps of the second military survey and the 1900 census values of the cadastral communes shows that there were no major changes in the areas of the cadastral communes during the period 1861–1900. The maximum difference in the area of one commune in the Chortkiv district is 74 ha, with an average cadastral commune size of 1724 ha. Statistical data from the 1869 publications for districts indicated that the area of the Chortkiv district was 602.51 km2, vis-à-vis the 809.59 km2 we vectorized. When aggregating the population data of cadastral communes, we obtained 100% correspondence in the population between the publication for communes and the publication for districts for both levels of administrative division.
Hence, for the purposes of boundary reconstruction, we have assumed that our areas, based on the aggregation of cadastral communes and verified by censuses, are reliable for 1869, despite inconsistencies with area data reconstructed based on population density or livestock from district publications. We are reassured by comments in the sources regarding the difficulties in collating the data and by the previously mentioned preface from the 1869 list for communes.
A summary of source data for the Chortkiv district is found in Supplementary Material, Part D.
Comparison to other projects
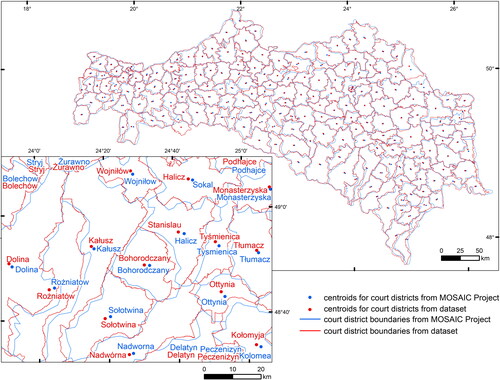
We have related the vectorized boundaries to two other projects containing data for Galicia: HistoGIS and Mosaic. Data from the Mosaic project included the boundaries of the 1711 court districts of the Austro-Hungarian Monarchy in 1910. They were made by the Max Planck Institute for Demographic Research and the Chair for Geodesy and Geoinformatics, University of Rostock, a slightly modified version of a GIS file by Rumpler and Seger (Citation2010). This dataset for Galicia provides the geometry of 186 court districts and two cities with their own statutes, the same as in our data for 1910. The total length of boundaries for the court districts in Galicia from the Mosaic project is 20,093.86 km compared to the 25,650.01 km we vectorized. Only two districts from our dataset had boundaries shorter than those from Mosaic, with a minimum value of 82.80%. The largest difference in the boundary length was 220.4% for the Muszyna district. The average difference in the court district area for our data is 1.93%. The greatest discrepancies were noted for the court district of Muszyna, for which we vectorized an area 299.66% larger, and the city of Lviv, where the area we vectorized was 44.53% smaller than that of the Mosaic data. For 61 districts, we vectorized <95% of the area given by Mosaic, and for 56 judicial districts, we vectorized more than 105%. For the eight districts of the Mosaic project, we noted incorrect names that were swapped with the names of other districts. The district of Muszyna was within our borders, but in Mosaic, it was assigned to the right bank of Tisa River (Rechtes Theißufer), which is not part of Galicia but belongs to the Hungarian part of the monarchy. The existing court district of Muszyna in the Mosaic Project was sectioned from the court district of Nowy Sącz (Neusandez).
In the next step of the validation, we generated centroids (geometric centers) for the court districts from the Mosaic project and centroids for the court districts we vectorized (). The average difference in the distance of the two sets of centroids was 1349.56 m, the smallest difference being 144.80 m for the district of Rudki, and the largest, 4638.05 m, for the court district of Nowy Sącz.
Figure 4. Comparison of centroid positions for court districts from the Mosaic Project and from the dataset. Source: The Authors.
The final step in validating our data was to compare it to data from the HistoGIS Project (https://histogis.acdh.oeaw.ac.at/). This project is described as a geographical information system, workbench, and repository for retrieving, collecting, creating, enriching, and preserving historically temporalized spatial datasets. The collection includes data for many regions of Europe from a very wide time range, but most are from the nineteenth century. As a result of searching the data of this project using the “Tempspatial” filter with the additional criteria (columns) of Start Date, End Date, How accurate is the given date, Source, and Contemporary Administrative Unit, we found 95 records for administrative divisions of Galicia from 1850 to 1918, mainly at the level of political districts. A total of 82 names from the identified districts were unique. For comparison with our data, the Stanislau political district (Stanisławów), today’s Ivano-Frankivsk, was randomly selected and downloaded as a GeoJSON file and converted to a shapefile format for validation.
The time range for the Stanislau district boundaries in the HistoGIS metadata was defined as July 10, 1868–October 31, 1918. Hence, we compared the district boundaries with the boundaries vectorized for the 1869–1910 census time sections. The area of the Stanislaus political district was 879.81 km2 according to HistoGIS, but according to our data, it was 794.78 km2 in 1869, 851.57 km2 in 1880, and 868.37 km2 in 1890, 1900, and 1910. According to the lists of communes, between 1869 and 1880, the following cadastral communes were attached to the Stanislau political district: Chorostków, Drohomirczany, Międzyhorce, Radcza, and Siemikowce. Between 1880 and 1890, the communes of Bratkowice and Meducha were attached. These changes for each section can be reconstructed from our data. Between 1890 and 1910, the boundaries of the Stanislau political district did not change, as shown in Supplementary Material, Part E.
Conclusion
This paper has presented the possibility of reconstructing administrative changes over time for a large area of Central Europe at a detailed level and then verifying the accuracy of these reconstructions. Such data have not yet been available at this level of spatial and temporal detail (Burzyński Citation1982; Himka Citation1990). Furthermore, the reconstruction of the administrative boundaries of districts from small-scale maps may be insufficient to provide certainty regarding which communes belong to which district.
We have shown that it is possible to verify the quality of censuses through the reconstruction of administrative units. Some calculations in the censuses from 1869 for districts (e.g., population density or stocking density for districts in 1869) may be incorrect because they incorrectly referenced administrative units (Zamorski Citation1989).
For Galicia, the 1857 census must be interpreted in light of preparations for the administrative reform of 1866. The publication of the 1869 census must take into account the short period of implementation of this reform. Censuses from 1880 onwards show very good agreement between the statistical listings and geometrical data from the maps. Administrative changes in Galicia have become very clear since 1880, and it is possible to reconstruct counties accurately for any year between the dates of the censuses. Our studies showed a different situation in the organization of historical data for Galicia from the one observed in Austrian Silesia, another crown country of the Austro-Hungarian Monarchy, where the geometries of administrative units have been very consistent with the census data since the 1830s (Ostafin et al. Citation2020b).
This level of detail in the reconstruction of administrative boundaries can be a good starting point for linking with modern data. When starting from the reconstruction of district borders, such linking is difficult or even impossible. The dataset can be useful for demographic, ownership, and genealogical reconstructions, as well as for studying land-use changes.
Author contributions
K.O. designed the study, vectorized the boundaries, wrote the manuscript, created figures, SHP files, and Supplementary Materials, and secured funding. M.T., D.K., and K.O. prepared the historical maps, revised, and edited the manuscript. K.Ś. and M.T. wrote the manuscript. A.S., A.M., K.G., and N.K. revised and edited the manuscript.
Supplemental Material
Download Zip (47.4 MB)Acknowledgments
We thank Joshua MacFadyen and Lisa Dillon, Co-Editors, and two anonymous Reviewers for valuable comments and suggestions that have improved the manuscript. We also thank Tate from Taylor & Francis Author Services, Agi Legierska, and Grzegorz Zebik for their assistance in proofreading the text.
Disclosure statement
No potential conflict of interest was reported by the author(s).
Additional information
Funding
References
- Abbot, J. S. C. 2018. History of the Habsburg Empire. Praha: Madison & Adams Press.
- Affek, A. N. 2013. Georeferencing of historical maps using GIS, as exemplified by the Austrian military surveys of Galicia. Geographia Polonica 86 (4):375–90. doi:10.7163/GPol.2013.30.
- Affek, A. N. 2016. Dynamika krajobrazu: uwarunkowania i prawidłowości na przykładzie dorzecza Wiaru w Karpatach (XVIII-XXI wiek). Warszawa: Instytut Geografii i Przestrzennego Zagospodarowania PAN.
- Affek, A. N., J. Wolski, M. Zachwatowicz, K. Ostafin, and V. C. Radeloff. 2021. Effects of post-WWII forced displacements on long-term landscape dynamics in the Polish Carpathians. Landscape and Urban Planning 214:104164. doi:10.1016/j.landurbplan.2021.104164.
- Banasik, P., and Ł. Borowski. 2021. Georeferencing the Cadastral Map of the Krakow Region. The Cartographic Journal 58 (4):329–40. doi:10.1080/00087041.2021.2023963.
- Allgemeines Verzeichnis der Ortsgemeinden und Ortschaften Österreichs nach den Ergebnissen der Volkszählung vom 31 Dezember 1910. 1915.
- Bevölkerung und Viehstand der im Reichsrathe Vertretenen Königreiche und Länder: nach der Zählung Vom 31 December 1869. 1871.
- Bevölkerung und Viehstand der im Reichsrathe Vertretenen Königreiche und Länder: nach der Zählung vom 31 December 1869. 1872.
- Bičík, I., L. Kupková, L. Jeleček, J. Kabrda, P. Štych, Z. Janoušek, and J. Winklerová. 2015. Land use changes in the Czech Republic 1845–2010: Socio-economic driving forces. Cham: Springer.
- Bigo, J. 1904. Najnowszy skorowidz wszystkich miejscowości z przysiółkami w Królestwie Galicji, Wielk. Księs. Krakowskiem i Księs. Bukowińskiem. Lwów: Drukarnia Ludowa.
- Bigo, J. 1914. Najnowszy skorowidz wszystkich miejscowości z przysiółkami w Królestwie Galicji, Wielk. Księs. Krakowskiem i Księs. Bukowińskiem. Lwów: Drukiem I. Jaegera.
- Bukowski, M., P. Koryś, C. Leszczyńska, M. Tymiński, and N. Wolf. 2019. Urbanization and GDP per capita: New data and results for the Polish lands, 1790–1910. Historical Methods: A Journal of Quantitative and Interdisciplinary History 52 (4):213–27. doi:10.1080/01615440.2019.1580171.
- Burzyński, A. 1982. Górnictwo, hutnictwo i przemysł rafineryjny. In Informator statystyczny do dziejów przemysłu w Galicji, ed. H. Madurowicz-Urbańska. Kraków: Uniwersytet Jagielloński.
- Chen, Y., E. Carlinet, J. Chazalon, C. Mallet, B. Duménieu, and J. Perret. 2021. Vectorization of historical maps using deep edge filtering and closed shape extraction. In Document analysis and recognition – ICDAR 2021, ed. J. Lladós, D. Lopresti, and S. Uchida, 510–25. Cham: Springer International Publishing.
- Cherkesly, I., L. Dillon, and A. Gagnon. 2019. Creating the 1831 Canadian Census Database. Historical Methods: A Journal of Quantitative and Interdisciplinary History 52 (2):110–27. doi:10.1080/01615440.2019.1567419.
- Cunningham, N. 2014. Troubled geogrpahies: A historical GIS of religion, society, and conflict in Ireland since the Great Famine. In Toward spatial humanities, ed. I.N. Gregory and A. Geddes, 62–87. Bloomington, IN: Indiana University Press.
- Drummond, A. J., and J. Lubecki. 2010. Reconstructing Galicia: Mapping the cultural and civic traditions of the former Austrian Galicia in Poland and Ukraine. Europe-Asia Studies 62 (8):1311–38. doi:10.1080/09668136.2010.504385.
- Evans, R. J. W. 2008. Austria, Hungary, and the Habsburgs: Central Europe c.1683–1867. New York, NY: Oxford University Press.
- Gay, V. 2021. Mapping the Third Republic: A Geographic Information System of France (1870–1940). Historical Methods: A Journal of Quantitative and Interdisciplinary History 54 (4):189–207. doi:10.1080/01615440.2021.1937421.
- Gemeindelexikon der im Reichsrate vertretenen Königreiche und Lӓnder bearbeitet auf Grund der Ergebnisse der Volkszӓhlung vom 31. Dezember 1900. XII. Galizien. 1907.
- Gregory, IN., and H. R. Southall. 2002. Mapping British population history. In Past time, past place GIS for history, ed. A.K. Knowles, 117–30. Redlands, CA: ESRI Press.
- Grodziski, S. 1971. Historia ustroju społeczno politycznego Galicji 1772–1848. Kraków: Zakład Narodowy im. Ossolińskich.
- Grzybowski, K. 1959. Galicja 1848–1914. Historia ustroju politycznego na tle historii ustroju Austrii. Kraków; Wrocław; Warszawa: Zakład Narodowy im. Ossolińskich.
- Haid, E. 2017. Galicia: A Bulwark against Russia? Propaganda and violence in a border region during the first world war. European Review of History: Revue Européenne D’histoire 24 (2):200–13. doi:10.1080/13507486.2016.1257574.
- Handbuch des Lemberger Statthalterei-Gebietes in Galizien: für das Jahr 1857. 1857.
- Hernik, J., B. Prus, R. Dixon-Gough, J. Taszakowski, G. Navratil, and R. Mansberger. 2020. The evolution of cadastral systems in Austria and Galicia (Poland): Different approaches to a similar system from a common beginning. The Cartographic Journal 57 (2):97–112. doi:10.1080/00087041.2018.1534344.
- Himka, J.-P. 1990. Galicia and Bukovina: A research handbook about Western Ukraine, late 19th-20th centuries. Alberta: Alberta Culture & Multiculturalism Historical Resources Division.
- Jansen, H. 1900. Deutsche, österreichische und schweizerische Maße, Gewichte und Münzen. Sonder-Abdruck aus Muret-Sanders’ Deutsch-Englischem Wörterbuche. Berlin: Langenscheidt.
- Konias, A. 2000. Kartografia topograficzna Śląska Cieszyńskiego i zaboru austriackiego od II połowy XVIII wieku do początku XX wieku. Katowice: Uniwersytet Śląski.
- Leyk, S., and J. H. Uhl. 2018. HISDAC-US, historical settlement data compilation for the conterminous United States over 200 years. Scientific Data 5 (1):180175. doi:10.1038/sdata.2018.175.
- Massey, C. G., K. R. Genadek, J. T. Alexander, T. K. Gardner, and A. O’Hara. 2018. Linking the 1940 U.S. Census with modern data. Historical Methods 51 (4):246–57. doi:10.1080/01615440.2018.1507772.
- Mick, C. 2019. Legality, ethnicity and violence in Austrian Galicia, 1890–1920. European Review of History: Revue Européenne D’histoire 26 (5):757–82. doi:10.1080/13507486.2019.1641693.
- Munteanu, C., T. Kuemmerle, N. S. Keuler, D. Müller, P. Balázs, M. Dobosz, P. Griffiths, L. Halada, D. Kaim, G. Király, et al. 2015. Legacies of 19th century land use shape contemporary forest cover. Global Environmental Change 34:83–94. doi:10.1016/j.gloenvcha.2015.06.015.
- Nowak, D. 2021. Austriackie katastry gruntowe na terenie Galicji. Krosno: Wydawnictwo Ruthenus.
- Oesterreichische Statistik. Die Bevölkerung der im Reichsrathe vertretenen Königreiche und Länder nach Aufenthalt und Zuständigkeit. 1882.
- Oesterreichische Statistik. Die Ergebnisse der Volkszählung vom 31. December 1890. Band. 1. Heft. Die Summarischen Ergebnisse der Volkszählung. 1892.
- Orts-Repertorium des Kӧnigreiches Galizien und Lodomerien mit dem Grossherzogthume Krakau. Auf Grundlage der Volkszählung vom Jahre 1869. 1874.
- Ostafin, K., D. Kaim, M. Troll, and W. Maciejowski. 2020a. The authorship of the second military survey of Galicia and Austrian Silesia at the scale 1:28,800 and the consistency of sheet content based on selected examples. Polish Cartographical Review 52 (4):141–51. doi:10.2478/pcr-2020-0012.
- Ostafin, K., D. Kaim, T. Siwek, and A. Miklar. 2020b. Historical dataset of administrative units with social-economic attributes for Austrian Silesia 1837–1910. Scientific Data 7 (1):208. doi:10.1038/s41597-020-0546-z.
- Ostafin, K., M. Iwanowski, J. Kozak, A. Cacko, U. Gimmi, D. Kaim, A. Psomas, C. Ginzler, and K. Ostapowicz. 2017. Forest cover mask from historical topographic maps based on image processing. Geoscience Data Journal 4 (1):29–39. doi:10.1002/gdj3.46.
- Palma, N., J. Reis, and M. Zhang. 2020. Reconstruction of regional and national population using intermittent census-type data: The case of Portugal, 1527–1864. Historical Methods: A Journal of Quantitative and Interdisciplinary History 53 (1):11–27. doi:10.1080/01615440.2019.1666762.
- Paździora, M. 2021. Atlas historyczny Galicji. Chrzanów: Miejska Biblioteka Publiczna w Chrzanowie.
- Piechl, A. 2020. (Semi-) automatic vector extraction of administrative borders from historical raster maps. In Automatic vectorisation of historical maps, ed. K. Irás, 45–52. Budapest: ELTE Eötvös Loránd University.
- Pilat, T. 1883. Podział terytoryalny Galicyi według stanu z d. 1. stycznia 1883 r. Lwów: Pierwsza Związkowa Drukarnia.
- Pilat, T. 1878. Statystyka Gminna. Lwów: Pierwsza Związkowa Drukarnia.
- Pogonowski, I. C. 1988. Poland, a historical atlas. 3rd ed. New York, NY: Hippocrene Books Inc.
- Pounds, N. J. G. 2009. An historical geography of Europe 1500–1840. New York, NY: Cambridge University Press.
- Rumpler, H., and M. Seger. 2010. Die Habsburgermonarchie 1848-1918. Band IX: Soziale Strukturen. 2. Teilband: die Gesellschaft der Habsburgermonarchie im Kartenbild. Verwaltungs-, Sozial- Und Infrastrukturen. Nach dem Zensus von 1910. Wien: Verlag der Österreichischen Akademie der Wissenschaften.
- Rumpler, H., K. Scharr, and C. Ungureanu. 2015. Der Franziszeische kataster im Kronland Bukowina Czernowitzer Kreis, 1817–65. Wien; Köln; Weimar: Böhlau Verlag.
- Skorowidz wszystkich miejscowości położonych w Królestwie Galicyi i Lodomeryi jakoteż w Wielkiem Księstwie Krakowskiem i Księstwie Bukowińskim. 1855.
- Skorowidz wszystkich miejscowości położonych w Królestwie Galicyi i Lodomeryi wraz z Wielkiem Księstwem Krakowskiem. 1868.
- Ślusarek, K. 2002. Uwłaszczenie chłopów w Galicji Zachodniej. Kraków: Towarzystwo Wydawnicze “Historia Iagellonica”.
- Sobala, M., O. Rahmonov, and U. Myga-Piątek. 2017. Historical and contemporary forest ecosystem changes in the Beskid Mountains (southern Poland) between 1848 and 2014. iForest-Biogeosciences and Forestry 10 (6):939–47. doi:10.3832/ifor2418-010.
- Sobczyński, M. 1993. Trwałość dawnych granic państwowych w krajobrazie kulturowym Polski. Warszawa: Instytut Geografii i Przestrzennego Zagospodarowania PAN.
- Sobczyński, M. 2018. Granice polityczne w krajobrazie – krajobraz pogranicza. Studia z Geografii Politycznej i Historycznej 7:25–70. doi:10.18778/2300-0562.07.02.
- Soja, M. 2008. Cykle rozwoju ludności Karpat Polskich w XIX i XX wieku. Kraków: Instytut Geografii i Gospodarki Przestrzennej Uniwersytetu Jagiellońskiego.
- Special Orts-Repertorium von Galizien. Neubearbeitung auf Grund der Ergebnisse der Volkszählung vom 31. December 1890. XII. Galizien. 1893.
- Special-Orts-Repertorium von Galizien. 1886.
- Statistische Übersichten über die Bevölkerung und den Viehstand von Österreich nach der Zӓhlung vom 31 October 1857. 1859.
- Statistisches Jahrbuch-für das Jahr 1869. 1871.
- Statistisches Jahrbuch-für das Jahr 1880. Teil 1. 1883.
- Statistisches Jahrbuch-für das Jahr 1881. 1884.
- Stoksikówna, J. 1975. Galicyjski kataster gruntowy, jego geneza, dzieje i spuścizna aktowa. Archeion 63:165–87.
- Szabó, P., S. Suchánková, L. Křížová, M. Kotačka, M. Kvardová, M. Macek, J. Müllerová, and R. Brázdil. 2018. More than trees: The challenges of creating a geodatabase to capture the complexity of forest history. Historical Methods: A Journal of Quantitative and Interdisciplinary History 51 (3):175–89. doi:10.1080/01615440.2018.1444523.
- Szady, B. 2017. Geografia historyczna w Polsce – rozwój i perspektywy. Studia Geohistorica 1 (1):19–38. doi:10.12775/SG.2013.03.
- Teibenbacher, P., D. Kramer, and W. Göderle. 2012. An inventory of Austrian census materials, 1857–1910. Final report. Vol. 190. Rostock: Max Planck Institute for Demographic Research.
- Timár, G., G. Molnár, B. Székely, S. Biszak, J. Varga, and A. Jankó. 2006. Digitized maps of the Habsburg Empire – The map sheets of the second military survey and their georeferenced version. Budapest: Arcanum.
- Wnęk, K. 2011. Własność nieruchomości w Krakowie w połowie XIX w.: studia nad stałym katastrem Galicyjskim. Kraków: Towarzystwo Wydawnicze “Historia Iagellonica”.
- Wolff, L. 2010. The idea of Galicia: History and fantasy in Habsburg political culture. Stanford, CA: Stanford University Press.
- Wolski, J. 2007. Przekształcenia krajobrazu wiejskiego Bieszczadów Wysokich w ciągu ostatnich 150 lat. Warszawa: Instytut Geografii i Przestrzennego Zagospodarowania PAN.
- Zamorski, K. 1989. Ludność Galicji w latach 1857–1910. In Informator statystyczny do dziejów społeczno-gospodarczych Galicji, ed. H. Mandurowicz-Urbańska. Kraków; Warszawa: Uniwersytet Jagielloński.