
Abstract
In this article a new autoregressive moving average (ARMA) spectral estimator is introduced, which does not require estimation of the moving average parameters. The estimator makes use of Burg (or Marple) estimates in the purely autoregressive model to initialize the autoregressive coefficients in the mixed model. The coefficients are estimated using an algorithm of Tsay and Tiao, which is computationally reasonably fast. Several examples are given that include ARMA and non-ARMA data. These examples demonstrate that prefiltering the data is usually a good idea. A method for dynamically determining the proper filter is described in some detail. Having demonstrated the utility of an ARMA model for modeling the spectrum and having determined a dynamic prefiltering method and a reasonably efficient method of estimating the AR coefficients, a new robust ARMA spectral estimator is obtained as follows:
| 1. | Prefilter the data, | ||||
| 2. | Model the filtered data by | ||||
| 3. | Estimate the spectral density by | ||||
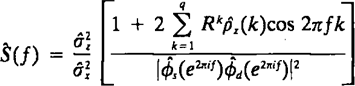
and ![]() .
.
The parameter R in (3) is chosen to guarantee a positive spectrum for a given resolution. The final example demonstrates that the method defined by Steps 1–3 actually contains more information concerning the system frequencies than is transmitted by the spectral density alone. For this reason a line spectrum is superimposed on the graph of the estimated spectral density. This, as is demonstrated, can convey significantly more information regarding the frequency content than the estimated spectral density alone. A computer program is available for the IBM PC, which interactively allows the user to carry out the spectral analysis technique outlined in Steps 1–3. The program outputs both plots of the data spectrum and autocorrelation. It is available on disk for the IBM PC and compatibles by writing to the authors.