Abstract
Recent genome-wide association studies (GWASs) designed to detect the main effects of genetic markers have had considerable success with many findings validated by replication studies. However, relatively few findings of gene–gene or gene–environment interactions have been successfully reproduced. Besides the main issues associated with insufficient sample size in current studies, a complication is that interactions that rank high based on p-values often correspond to extreme forms of joint effects that are biologically less plausible. To reduce false positives and to increase power, we develop various gene–environment/gene–gene tests based on biologically more plausible constraints using bivariate isotonic regressions for case–control data. We extend our method to exploit gene–environment or gene–gene independence information, integrating the approach proposed by Chatterjee and Carroll. We propose appropriate nonparametric and parametric permutation procedures for evaluating the significance of the tests. Simulations show that our method gains power over traditional unconstrained methods by reducing the sizes of alternative parameter spaces. We apply our method to several real-data examples, including an analysis of bladder cancer data to detect interactions between the NAT2 gene and smoking. We also show that the proposed method is computationally feasible for large-scale problems by applying it to the National Cancer Institute (NCI) lung cancer GWAS data.
Acknowledgments
This research was supported by the Intramural Research Program of the Division of Cancer Epidemiology and Genetics, National Cancer Institute, National Institutes of Health. The findings in this article reflect the viewpoints of the authors and do not necessarily reflect the views of the Department of Health and Human Services.
Notes
NOTE: ”Const” and ”Unconst” refer to constrained and unconstrained tests, respectively.
NOTE: ”Const” and ”Unconst” refer to constrained and unconstrained tests, respectively.
NOTE: ”Const” and ”Unconst” refer to constrained and unconstrained tests, respectively.
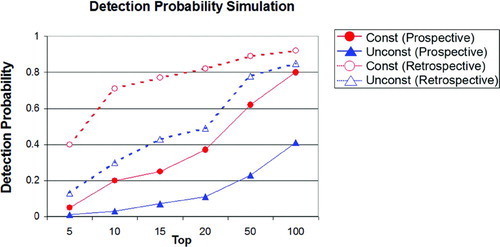
Figure 3 Results of the detection probability simulation for the test for interaction; the Y-axis displays the estimated probability for detecting at least four true pairs of interacting SNPs out of six true pairs and 3771 null pairs of SNPs from the top X findings (X = 5,10,15,20,50,100). The online version of this figure is in color.
NOTE: Interaction tests were applied to SNPs in 82 genes in the one-carbon metabolism pathway using the constrained and unconstrained methods. The first five rows are the top findings sorted by the constrained method, and the next five rows are the findings sorted by the unconstrained method. ”Const” and ”Unconst” refer to constrained and unconstrained tests, respectively. Sorted p-values in each method are written in bold.
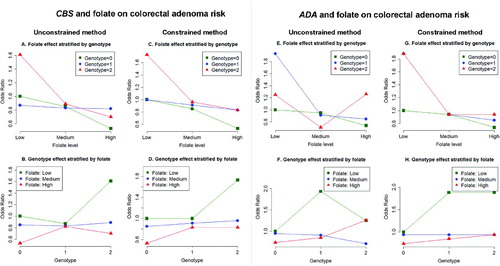
Figure 4 The joint effects of SNP rs2851391 in CBS and folate on colorectal adenoma risk under the unconstrained (first column) and the constrained method (second column); the joint effects of SNP rs244072 in ADA and folate on colorectal adenoma risk under the unconstrained (third column) and the constrained method (fourth column). Each odds ratio for a given follate level and genotype is calculated compared to a reference group with low folate level and zero genotype value. The online version of this figure is in color.