1. INTRODUCTION
I know this program is the last thing standing between you and the hottest ticket on the West Coast this summer—tonight's JSM Dance Party. I promise to keep my remarks brief, but I need to start by telling you that it is the honor of a lifetime to serve as your president.
One of the issues I will discuss today is the importance of mentorship in a statistician's career, and some of the ways the ASA is helping to promote and strengthen these relationships.
Before I begin, I would like to take a moment of personal privilege to thank—and to dedicate—this Presidential Address to a few of the mentors who made a difference in my own life and career.
Ms. Ruth Bauer was my math teacher from the 10th through 12th grades, but her influence extended well beyond Trig or Calculus. She was the type of teacher, who, for graduation, gave each of her students a copy of Siddhartha, reminding us to explore the world around us, and to seek to live lives of meaning. I will always be grateful for her inspiration.
Joe Waksberg and Ed Bryant, two of my mentors at Westat, were both born in 1915, 100 years ago. Ed was born in a log cabin in Wyoming, without running water or electricity. Joe was born in a town in Poland. Despite growing up on opposite sides of the globe, and being opposites themselves in many ways, they were both brilliant statisticians, and mentors to many of us. Their lives and careers also illustrate another theme I will touch on today, that our profession is strengthened by a diversity of perspectives from around the world.
Thank you to the many volunteers and ASA employees, who have worked so hard to make this year's JSM a success. Our organization depends on the hard work of some 2000 people who help keep it running. I will bet many of you here tonight are ASA volunteers. If you are, raise your hand. Everyone, please give them a round of applause!
Let me extend a special welcome to the JSM's first-timers. I hope this JSM is living up to, and even exceeding, your expectations. And I hope you will not only return next year, but also be inspired to take on greater roles in the association, whether at the section, chapter, or national level. Most of all, I hope you will volunteer to take part in our mentorship program, which I will be talking about in a few moments.
This has already been pointed out to you, but please do look for people who have that extra purple-colored ribbon on their badges. These are veteran JSM conference goers who have volunteered to serve as “docents” for this meeting. They are offering to be a resource for all of you, and to help guide and advise you through what can be an overwhelming experience. If there are any docents in the room, would you please raise your hand? Feel free to ask these folks for any assistance or advice you might need.
Finally, I hope that all of you, whether it is your first or your 20th JSM, are indeed making the connections, renewing the friendships, and discovering the new methods that can help enhance your careers, your contributions, and your enthusiasm for our work as statisticians.
And now, since I know you are tired of sitting, let us go for a walk. There are three big changes facing our profession. First, I will give you a snapshot of the changing faces of our field—of who we are today, and how we might work to both support and diversify our ranks. Second, I will talk about some of the problems and challenges that have come with rapid change and data growth, particularly some of the challenges that have accompanied the rise of Big Data. Finally, I will propose some ways not just to address the challenges, but to seize the opportunities created by change—most of all by communicating with the rest of the world and helping them understand what it is we do, and how, even in the age of Big Data, we can help our fellow scientists, business leaders, and public servants make better decisions.
2. CHANGING FACES OF OUR PROFESSION
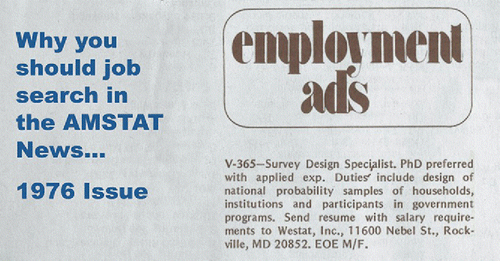
The first stop on our journey answers the question, “Why should we read Amstat News, especially if we are looking for a job?” Megan Murphy at the ASA office was able to find a copy of the ad that I spotted in 1976 in the back pages of Amstat News—the ad that led to my 39 years and counting at Westat (). (Legal disclaimer required by ASA lawyers: The ASA cannot guarantee 39 years of steady employment from its job ads.)
It is astounding how not just ASA, but our profession has grown in the four decades since I answered that ad. As we all know, technology has enabled us to gather and process unprecedented amounts of data in never-before imagined fields. Decades ago, a four-function calculator was considered an amazing advance. Today we can wear a watch that is orders of magnitude more powerful than the original 13 ton Univac. My watch tells me when I am lazy and need to walk more. Now that is progress!
Not long ago, a biologist could only study gene expression by spotting black dots on a piece of paper or extracting a few numbers from standard curves. Now, biostatisticians can sift through exabytes of data in seconds. Not even the best clairvoyant could have predicted the diversity of ways we are now able to make a difference, and a living, as statisticians. From fighting deadly epidemics such as Ebola to helping big city mayors fill in potholes as soon as they occur, from assembling World Series-winning baseball teams to mapping a U.S. Presidential candidate's path to the White House.
When I joined the ASA in 1972, we had just four sections. We now support 28 sections—from Biometrics, established in 1938, to Statistics in Genomics and Genetics, established just this year. Let us look at the faces of the people who currently make up the ASA, and by extension, the global statistical community.
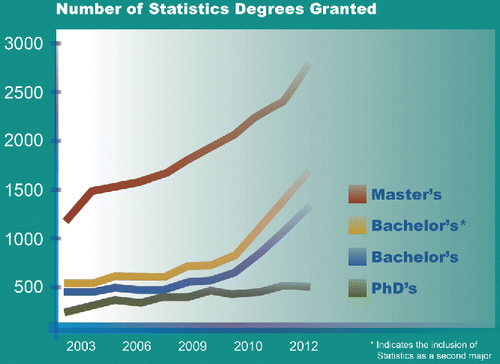
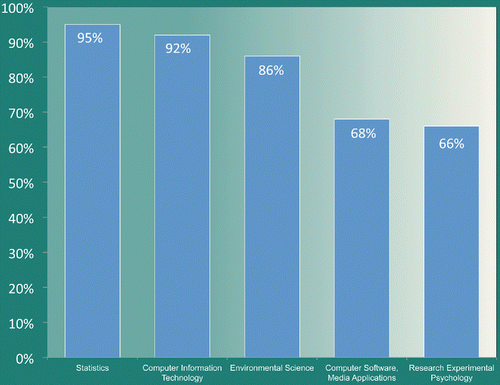
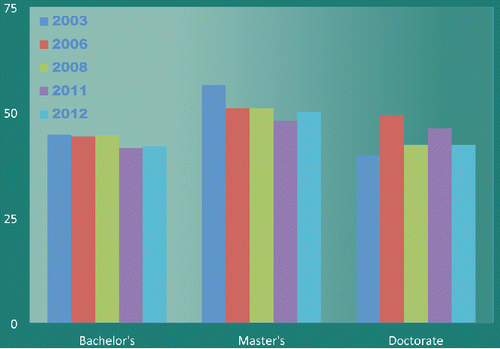
The demand for people who can analyze and make sense of undifferentiated data and put it to good use continues to grow dramatically. During the years 2003–2012, the numbers of masters’ degrees conferred in statistics more than doubled and the number of undergraduates who either majored or minored in our field has nearly tripled (). So, it is no surprise that college students are increasingly choosing statistics (). Bachelor's degrees in statistics have jumped 95% since 2010. With these numbers, we are the fastest growing STEM field in America, edging out information technology. What should make us even more proud is the fact that our field is much closer to reaching gender parity than any other STEM field. More than 40% of degrees in statistics today are being earned by women ().
But we cannot stop now. This is so important, because as demand for our skills continues to grow and as the problems we tackle become increasingly complex, we have got to ensure that our profession is populated with the world's best statistical minds.
The story of how the highly respected Gertrude Cox (http://www.amstat.org/about/statisticiansinhistory/index.cfm?fuseaction=biosinfo&BioID=2) came to head the Statistics Department at North Carolina State in 1940 is instructive. Her then-mentor had been asked by the university to recommend people who might head its newly created stats department. The mentor offered a list of five candidates—all of them men. After Gertrude saw the letter and protested, he added a postscript, “Of course if you would consider a woman for this position I would recommend Gertrude Cox of my staff.”
Imagine what statistics would have lost if Gertrude had not insisted that she be included on the list, or if her mentor had not agreed to put forward her name, or if NC State had refused to consider her because of her gender. Now imagine how many more Gertrude Coxes will join us and make vital contributions to our profession if we commit ourselves as teachers, colleagues, and employers to expanding diversity of all types in our profession.
Another source of diversity in the ASA is the fact that we are increasingly an international organization. Our membership represents some 96 countries around the world. The ASA is stronger for our global representation. For the past decade, the majority of statistics graduate students in U.S. stat programs have come from outside the United States. You are indispensable to the success of our classrooms, labs, and workplaces.
But we can do better by working to address the challenges you face working in a foreign language, in a foreign country. Some foreign students I have had the pleasure of meeting on college visits expressed appreciation for the short courses that ASA offers on improving communications skills. We should continue providing such extra assistance, and find new ways to support you in your efforts to adjust and excel!
The ASA speaks many languages. With so many native and professional languages spoken by our membership, and not just Chinese or German, but also Bayesian and Biostatistician, Survey Design, and Quality Control, we often need a glossary of terms to understand each other. And that is why this meeting, our smaller conferences throughout the year, our journals and magazines, our website, Facebook, Twitter, and other social media outlets are so vital. We have got to keep communicating with each other, keep striving to stay current and informed of the rapid transformations taking place in our profession. We have got to communicate as one voice about our profession to journalists and to the public. We do not want the ASA Big Tent to become a Tower of Babel.
Our work is never done. Just as data can easily become dated, self-satisfaction and complacency with our achievements can leave us on our heels. McKinsey & Co. (http://www.mckinsey.com/features/big_data) has estimated that in the coming years, analytical positions in the United States alone will exceed supply by as much as 190,000. We have got to continue to grow our profession, and to ensure that those taking on data jobs are equipped with statistical tools and approaches.
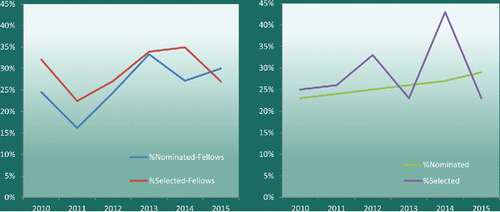
We have got to strengthen our efforts to ensure that our committee memberships, and our committee chairs, reflect the diversity of our profession and our membership. We should strive to make sure those nominated and selected for awards also reflect the full range of talent and contributions made by all our members. On these graphs, you will notice that the rate of women's award nominations and recipients is approaching a level matching their rate of membership (). It demonstrates exactly what we all know: Diversity serves to strengthen our membership and our leadership; it elevates our capacity as an organization; and expands our range of expertise.
When conference goers look at the page in the program showing the faces of our distinguished plenary session speakers, the page should reflect back on our membership. In Amstat News, we can invite more guest columnists to write about the challenges of working in a nonnative tongue, or being a statistician from a minority background, and propose innovative ways to address these challenges.
Finally, we have got to keep supporting and improving our This Is Statistics program, which reaches out to young people, especially girls and minority students, and encourages them to consider statistics as a profession where they can both do well financially and do good for society.
These are some of our efforts to recruit and retain the best and the brightest. But I encourage all of you to develop and suggest new ideas and ways we can grow and diversify our ranks. Now that we have seen the changing faces, let us look at the changing problems.
3. CHANGING PROBLEMS FACING OUR PROFESSION
As statisticians, we are all intimately familiar with the phenomenon that is Big Data. There is a growing belief out there that if there is a problem, Big Data will be able to fix it. In fact, Big Data is so `‘in,’’ there is a band named after it! However, many still ask, what is Big Data?
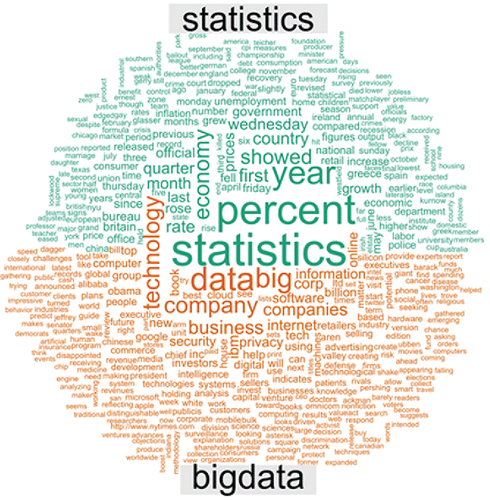
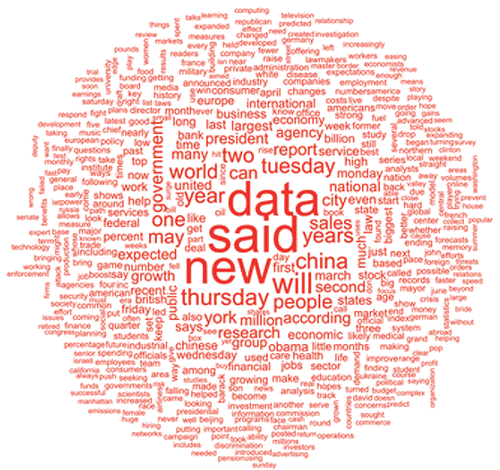
No doubt we have benefited from Big Data's ascendancy, especially when it comes to jobs. The growing popularity of statistics as a career is due in part to the growing excitement over the magic of Big Data. So to the public, Big Data and Statistics are inextricably linked. These word clouds on Big Data and on Statistics, created from thousands of articles in the New York Times, offer insights into the public's view of these two concepts (). Perhaps the most telling difference is how Big Data's words are less technical, and more related to the public sphere (). The benefits of volume may make it seem acceptable, more accessible to the average consumer. And that is not a bad thing!
Piquing the public's interest in data can benefit our industry, that is, if we take advantage of it. In fact, some of the words these clouds have in common demonstrate the intersection between the two fields. Growth, health, service, international, research—these are some of the many examples of where both fields intersect, and where both fields can benefit from collaboration.
And yet, we have all noticed a paradox. While the general public seems to lump statistics in with Big Data, when it comes to the Big Data party, statisticians simply have not been getting invited. Jeff Leek, in the blog Simply Statistics, noted that several major public Big Data efforts neglected to include the voices and viewpoints of statisticians. Let us let the numbers speak for themselves: How many of the participants at these events were statisticians?
White House Big Data Partners Workshop: 0 out of 19 participants
Moore Foundation: 0 out of 3 directors
Original group that proposed NIH BD2K: 0 out of 18 participants
White House Big Data rollout: 0 out of 4 thought leaders
Snubs like these can be pretty disheartening. So how can we enjoy the feast without succumbing to the poison pill? We can do one of two things:
We can stand aside, cross our arms like Rodney Dangerfield and keep complaining to anyone who will listen (mostly each other), “We get…no…respect.”
Or, we can choose to engage and find ways to remedy the situation, namely, by demonstrating how statistical methods and analyses are essential to making Big Data useful.
Many of us might get a little queasy, when we look at a Big Data set that was acquired, not by a carefully designed statistical survey or experiment, but for instance an e-commerce site in the course of ordinary business. But we live in an age where if we choose not to engage, others―many of whom lack our tools and training―will most certainly step forward, sometimes reaching misleading conclusions or worse (Lazer, D., Kennedy, R., King, G., and Vespignani, A. (2014), ``The Parable of Google Flu: Traps in Big Data Analysis,’’ Science, 343, 1203—1205.). Big Data hubris is the “often implicit assumption that big data are a substitute for, rather than a supplement to, traditional data collection and analysis (http://arstechnica.com/science/2014/03/researchers-warn-against-the-rise-of-big-data-hubris/).” So even when the data are incomplete, we still need to engage!
Morris Hansen, a former ASA president, and mentor to me and many others, was a perfectionist. And yet, at both Census and Westat, he pinned this Voltaire quote to his bulletin board: “The perfect is the enemy of the good.” To me, this is a key insight for us. Neither we nor our clients can afford the ideal. Whether the constraints are budgetary, or temporal, or due to the laws of physics, we simply cannot measure everything perfectly. Instead of being paralyzed by the imperfections, we can acknowledge our gaps in understanding, and still move forward with the good.
With apologies to George Box (Box, G. E. P., and Draper, N. R. (1987), Empirical Model-Building and Response Surfaces, New York, NY: John Wiley & Sons, p. 424.), I offer “All data are dirty, but some are useful.” Statistical analysis can extract value from less than perfect data. We can consider and weigh the complicating factors, and still use the data to make better decisions.
Sallie Keller, a former ASA president, describes Big Data as unstructured data. Those statisticians who, like Keller, are willing to use statistical tools to bring structure to unstructured data are best poised to master this new era. Sallie and her multi-disciplinary team at Virginia Tech are especially adept at melding together different kinds of data to produce an analysis that is more than the sum of its parts.
Recently, Keller's lab had been asked to help Arlington County in Northern Virginia determine, among other issues, if there were “loyal customers”—911 callers who do not have real emergencies, but frequently tax the resources of EMS with nonemergency calls for help in taking pills or simply to say hello to operators. The fire chief wanted to improve “situational awareness,” better understand the utilization of his units, and see if he could use social media to learn about incidents.
Her team aggregated unstructured data from a number of sources, starting with three years’ worth of 911 call records; then adding police, fire, and medical reports; incorporating social media and news reports; and assembled it into a map, which they call The Rhythm of the City. They found that the EMS did not have loyal customers per se, rather loyal communities—parts of the county, shown in darker shades, that were home to retirement communities, nursing facilities, and neighborhoods with a cluster of older residents. This information enabled the county to target these areas for community outreach and education about unnecessary ambulance calls (https://collaboration.vbi.vt.edu/display/FPSDSP/Our+Work+with+Arlington+County). By engaging with this “less than perfect, unstructured data,” Sallie's team was able to present her fire department collaborators with a useful, actionable discovery.
As long as we are clear about our assumptions and the limitations of our data, our objective analysis remains an invaluable tool. Those who are willing to give helpful, albeit imperfect, answers will always have a role to play. But it is up to us to communicate the usefulness of what we do. The challenging problems facing our profession are significant. But the good news is that we already have, or are, developing solutions to meet them.
4. CHANGING OUR PROGRAMS TO FACE OUR PROBLEMS
Over the past year, I have worked with the ASA Board and past presidents to develop four new initiatives. The first two are inward-looking, designed to strengthen our members and our membership, while the second two are outward-looking, intended to help promote the visibility and status of our profession.
At the beginning of our walk, I shared how I benefitted from the guidance and inspiration of three very important mentors whom I was lucky to meet early in my career. How many of you had mentors who guided you along your way? Please, raise your hands. Are any of your mentors here at JSM? Consider your text messages, emails, and contact lists. I suspect you will find someone in there who has mentored you in your career. Here is an invitation to you. After the JSM, send them a note or give them a call and tell them about the gifts you received from them.
Mentoring is not new in our association. Before this year, the Committee on Minorities in Statistics organized annual mentoring activities at the JSM. The Conference on Women in Statistics featured speed mentoring, and individuals have mentored on their own.
For more than a decade, the Washington Statistical Society annually recognizes an outstanding government mentor. My own section, the Survey Research Methods Section, has also sponsored a mentoring program. It is through this program that I met and began mentoring a new colleague a half dozen year ago. Here is what she felt that experience was worth for her.
Subsequently, I am pleased to say, Dhuly has become a very active volunteer in the WSS. As you can see, the benefits of mentoring extend beyond professional development; mentoring helps to make statistics a welcoming community.
Let me recognize Eric Vance who has been the ASA's point-person on building out our mentorship programs, working to initiate mentoring connections at the past two CSPs and at both last year's and this year's JSM. The Biopharm section and the WSS have also initiated mentoring activities. So far, we have had very positive feedback, from both mentors and mentees. A special 2016 issue of The American Statistician will be devoted to mentoring and will contain articles about experiences in and methods for mentoring.
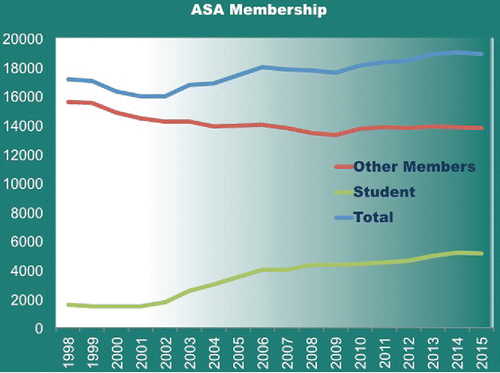
We have got to do a better job of ensuring that our newest and youngest members can get the support they need to build their careers. Today, more than 1 out of 4 of our members are graduate students, a number achieved through providing discounted membership rates for student members (). But our retention is not as good as we would like it to be. Only a small percentage of students maintain their membership after graduation.
To support retention, the ASA will launch the Colleague to Colleague System, connecting students and first year members with ASA members willing to offer a helping hand. And while mentoring's most obvious beneficiary is the mentee, the benefits often flow in both directions. As Skip Vecchia, the winner of the Washington chapter's 2015 award for mentoring, put it, “When you realize you need the people you are mentoring more than they need you, the importance of mentoring really hits home.”
The time is long overdue to recognize the vital contributions outstanding mentors can make, not just in a mentee's life, but to the overall strength of our profession. So I am proud to announce that beginning at next year's JSM we will be acknowledging an outstanding mentor with the ASA's Annual Mentoring Award. The winner will be selected from government, academia, or industry. I invite you to identify potential candidates and nominate them when the time comes.
Our next internal initiative is the Docent program—the brainchild of our colleague Mary Kwasny. We created this program to help our less experienced conference goers get the most of our super-sized conference. I thank our docents for volunteering in this inaugural year of the program. And I hope all of you will provide us feedback on how we might strengthen this program for next year's conference.
I am also excited to share with you the ways we have been working to increase public awareness and numeracy about statistics. There are two things that many of us find unsettling. First, a fundamental misunderstanding by the public of what we do. And second, the incorrect use of numbers and statistical analysis in the news. This year, we launched two initiatives, Stats 101 and STATS.org, to address these issues.
Most of us became statisticians because we know that statistics is an exciting and stimulating profession—one where curiosity and initiative intersect, and where we can make a difference in almost any industry that sparks our passion. But how many times have we been at a social event where someone asked us what we do for a living. When we replied “statistician,” we almost certainly got “The Look.” You have seen this look many times! It is “The Look” that says “There is no way I could ever do THAT for a living.” And it is “The Look” that is almost always followed by stories about an incredibly boring or outrageously difficult statistics class they took in high school or college.
To address this all too often negative perception of our profession and to help insure that many students’ sole encounter with statistics is a more pleasant experience, Dick De Veaux accepted a homework assignment: He and his committee are creating “Stats 101.” It is a dynamic, up to date, set of real life case studies for use as teaching examples, a kind of life raft for instructors that we will offer to schools and universities. Rather than have me talk more about these initiatives, let us hear directly from Dick, Eric, and Mary.
Finally in January, we launched STATS.org, a user-friendly blog designed to decode some of the statistical issues behind the news of the day, and to bring a data-driven perspective to the conversation. For instance, soon after football's Deflategate started making headlines, we posted a blog about how statistics could help determine whether or not the New England Patriots were up to no good by under-inflating the balls during that playoff game. Our goal is to help journalists take a more critical eye to reports that are purportedly based on statistical analysis. Through STATS.org, we offer to partner with journalists to help them bring an accurate statistical perspective to the news. Since we launched the blog, we have had more than 220,000 visitors!
5. CONCLUSION
During our walk today, we have seen the changing faces and problems and how we are changing our programs to address them. We are blessed to work in a profession that is in high demand, one that allows us to use our quantitative skills to solve real-world problems and make a difference in the fields we care most about, whether it is climate change, education, or public health. But we cannot afford to relax. Judging from the people I have had the pleasure to work with in my 40 years with ASA, most of you are not planning on it.
With This Is Statistics, we will work to recruit the next increasingly diverse generation of statisticians; with our new Mentoring Award, we will inspire more veteran members to help in guiding the careers of our newest members. Through STATS.org, we can inject statistical thinking into the fast-paced news cycle that fuels public knowledge. And with Stats 101, we can encourage and provide more and more talented people with the tools to incorporate proper statistical thinking into their research, decision-making, and daily lives.
We have many tools. But we are more than just a toolbox. We are collaborators and problem solvers: We are leaders! Let us continue working together as we strive to meet the challenge Gertrude Cox set for us so many years ago—to embrace new statistical frontiers, and to use our skills to serve other human beings. As Sharon Lohr reminded us in her 2014 Deming lecture (http://epaa.asu.edu/ojs/article/view/1972), our great value is in transferring statistical theory from one problem to another, using our special tools to make better decisions in new problems in education and health, in quality improvement, and improving the social condition.
We cannot rest until our ranks are fully diverse, with women and men of all backgrounds contributing their talents, insights, and fresh perspectives to our toughest statistical challenges. And we cannot consider our job done until we have found a way to enrich the human condition, add to the public good, and make the world a better place.
This is what we do…This is Statistics!
Thank you.
Additional information
Notes on contributors
David Morganstein
David Morganstein is Vice President and Director, Westat, Inc., 1600 Research Road, Rockville, MD 20850 (E-mail: [email protected]). This article was adapted from the 2015 ASA President's Address, delivered to the Joint Statistical Meetings in Seattle, WA.

