
 ?Mathematical formulae have been encoded as MathML and are displayed in this HTML version using MathJax in order to improve their display. Uncheck the box to turn MathJax off. This feature requires Javascript. Click on a formula to zoom.
Abstract
In many applications, the interest is in treatment effects on random quantities of subjects, where those random quantities are not directly observable but can be estimated based on data from each subject. In this article, we propose a general framework for conducting causal inference in a hierarchical data generation setting. The identifiability of causal parameters of interest is shown under a condition on the biasedness of subject level estimates and an ignorability condition on the treatment assignment. Estimation of the treatment effects is constructed by inverse propensity score weighting on the estimated subject level parameters. A multiple testing procedure able to control the false discovery proportion is proposed to identify the nonzero treatment effects. Theoretical results are developed to investigate the proposed procedure, and numerical simulations are carried out to evaluate its empirical performance. A case study of medication effects on brain functional connectivity of patients with Autism spectrum disorder (ASD) using fMRI data is conducted to demonstrate the utility of the proposed method. Supplementary materials for this article are available online.
1 Introduction
Studying treatment effects using observational data is one of the key questions in scientific, economic and social research. There is extensive research on causal inference under the ignorability assumption (Rosenbaum and Rubin Citation1983). However, the existing frameworks of causal inference are mainly built on the treatment effects of observable random variables. With the advance of automatic and high-throughput data collection techniques, collecting large-scale repeated measurements from each subject becomes more and more common in many studies, and the treatment effects of interest are typically on a large set of subject level parameters that take into account the heterogeneity among subjects. Compared to the classical setting which assumes variables of interest are observable and data from different subjects are iid, those subject level parameters are not directly observable, and the subject heterogeneity needs to be learned based on repeated measurements from each subject. The existing causal inference methods may not be directly applicable to the treatment effects on unobservable subject level parameters.
Our motivation example is to study treatment effects on brain connectivity using functional magnetic resonance imaging (fMRI) data. Here, brain functional connectivities are the subject level parameters of interest, which need to be estimated based on time course fMRI data from each subject (Qiu and Zhou Citation2022). To measure brain functional connectivity, Pearson’s correlation between distinct units within a brain nervous system (Andrews-Hanna et al. Citation2007; Palaniyappan et al. Citation2013) is widely used due to its simplicity and interpretability, which shows linear similarity/dissimilarity between brain signals arising from two regions. Other dependence measures have also been applied to study brain connectivity—such as precision coefficient or partial correlation (Marrelec et al. Citation2006), Spearman’s ρ and Kendall’s τ (Berto et al. Citation2022). Our interest is the average difference of brain connectivity under treatment and control. This is an important question in medical research as neurodevelopmental and neurodegenerative diseases, like Autism spectrum disorder and Alzheimer’s disease, may alter the connectivities among brain regions (Andrews-Hanna et al. Citation2007; Kana et al. Citation2014; Berto et al. Citation2022). Various treatments have been developed to maintain the brain functionality of patients, and their effects need to be evaluated using clinical trial data. Other examples include genotype effects on change rates of gene expression levels over plant growth and drug effects on variability of heart rate measured from wearable devices. To conduct statistical inference for treatment effects in this type of problems, it requires a new framework of causal inference on derived random variables under hierarchical models, and a multiple testing procedure to recover the nonzero treatment effects on the subject level parameters of interest.
Inverse probability weighting (IPW) estimators are commonly used to estimate average treatment effects (ATE) under the ignorability condition (Rosenbaum and Rubin Citation1983). This condition assumes the treatment selection is independent of the potential outcomes given the covariates, which means that there are no unobserved confounding variables that affect both the potential outcomes and the treatment selection. The effectiveness of IPW estimators was studied in Hirano, Imbens, and Ridder (Citation2003). See the literature review and the practice of IPW estimation methods in Austin and Stuart (Citation2015) and Imbens and Rubin (Citation2015).
If an outcome regression model is also assumed, the augmented inverse probability weighted estimator (Bang and Robins Citation2005; Funk et al. Citation2011) can be used to estimate ATEs, which is doubly robust and is the efficient estimator for ATE if both the outcome and propensity score models are correctly specified (Cao, Tsiatis, and Davidian Citation2009). However, imposing valid outcome models could be challenging in our problem, due to the high dimensionality of subject level parameters and possible restricted parameter spaces. The restriction on the models of subject level parameters could further put constraints on the models of observed responses for each subject. Taking modeling correlations for fMRI data as an example, although an inverse Wishart distribution can be made on individual covariance matrices if the covariances are independent of covariates (Marrelec et al. Citation2006), it is unclear how to model the relationship between covariates and correlations that satisfies the positive definiteness constraint of the correlation matrix under any value of the covariates. Bayesian is another approach for causal inference under a joint potential outcome model and a propensity score model (Rubin Citation1978). Indeed, Marrelec et al. (Citation2006) used Bayesian inference to model partial correlations among brain regions. Hierarchical models may also be employed for the estimation of treatment effect (Feller and Gelman Citation2015) and high-dimensional covariates can be added as well (Brown, Vannucci, and Fearn Citation1998). However, due to the nontrivial outcome models under restricted parameter spaces and the possible computational burden of Bayesian approaches, we choose the IPW estimation to study treatment effects on brain connectivity in this work.
Compared to the existing causal inference problems under the ignorability condition, our problem faces three new challenges. First, the subject level parameters of interest are not observable. The traditional identifiability conditions can not be directly applied to treatment effects on subject level parameters. New conditions for identifiability under a hierarchical data generation setting need to be developed. Second, the number of subject level parameters is usually large. A multiple testing procedure needs to be constructed to identify the nonzero treatment effects from a large set of candidates. Third, various types of dependence may exist in the data, which include the dependence among subject level parameters from a population distribution in a hierarchical model, the variable dependence among high-dimensional responses, and the temporal dependence of repeated measurements within each subject. Moreover, all the estimated treatment effects are dependent as they share common propensity score estimates. A valid testing procedure needs to control the dependence among the estimates of treatment effects.
Although multiple hypotheses testing has been well studied in the literature, how to control the false discovery proportion (FDP) under arbitrary dependence among test statistics is still an open question. Genovese and Wasserman (Citation2004) studied the stochastic properties of FDP. van der Laan, Dudoit, and Pollard (Citation2004a) constructed a step-down process on maximum statistics to control the family-wise error rate (FWER). van der Laan, Dudoit, and Pollard (Citation2004b) and Genovese and Wasserman (Citation2006) proposed an augmentation step to control the FDP exceedance rate. It is also worthwhile to mention the multiple testing procedures for sparse correlation and partial correlation matrices of one subject based on iid data (Cai and Liu Citation2016; Qiu and Zhou Citation2020). However, those works typically assume independence or sparse dependence among the test statistics for different hypotheses. Some works also assume exact Uniform(0, 1) distribution for the p-values under the null hypotheses. Our problem does not satisfy those assumptions due to the massive dependence among the data as mentioned above. Although van der Laan, Dudoit, and Pollard (Citation2004a) considered controlling the FWER for dependent statistics by bootstrapping or by estimating the covariances of their statistics, this procedure is unlikely to succeed for high-dimensional parameters since the sample covariance matrix is no longer consistent in a high-dimensional setting, and no theoretical justification is provided for their bootstrap procedure.
In this article, we propose a general framework for studying treatment effects on derived random variables from each subject. Our framework is built on a hierarchical setting that assumes the observed data from each subject follow a subject-specific distribution, and the parameters of the subject level distributions are drawn from a population distribution. This setting allows heterogeneity among subjects so that the subject level distributions could be different. The interest is in the causal effect of treatment on the subject level parameters. As those subject level parameters are not observable, the ignorability condition of treatment assignment is not directly made on those parameters. Instead, the identifiability of the causal effect is derived under an ignorability condition on the potential responses of each subject and a condition regulating the bias of the estimates for the subject level parameters of interest. The estimation of the treatment effect is constructed by inverse propensity score weighting on each of the estimated subject level parameters. Simultaneous confidence intervals for all treatment effects are constructed based on Gaussian approximation (GA) for the maximum of the estimated effects. Our GA result is valid under general dependence among the IPW estimates, which extends the original GA for sample means (Chernozhukov, Chetverikov, and Kato Citation2013) to IPW estimates with derived outcomes. A multiple testing procedure built on multiplier bootstrap is proposed to identify the nonzero treatment effects among a large set of parameters. Theoretical results are established which show that the proposed test is able to control the exceedance rate of the FDP. Examples of treatment effects on subject level correlations and coefficients from nodewise regressions are provided. Numerical simulations are carried out to evaluate the empirical performance of the proposed multiple testing procedure. A case study of medication effects on brain functional connectivity of patients with Autism spectrum disorder (ASD) using fMRI data is conducted to demonstrate the utility of the proposed method.
This article is organized as follows. Section 2 introduces the hierarchical setting of data generation and the causal parameters of interest in our problem. Section 3 presents the conditions and shows the identifiability of the causal parameters on derived random variables. Section 4 proposes the IPW estimator for the treatment effects and constructs the simultaneous confidence intervals. Section 5 proposes the multiple testing procedure and derives its theoretical results. Section 6 and 7 present the simulation results and a case study of medication effects on brain connectivity for ASD patients. Section 8 concludes the article. The technical proofs are provided in the supplementary material (SM).
2 Preliminary and Parameter of Interest
Suppose that we have a random sample of size n from a target population. For the ith subject, let be the treatment indicator, where Di
= 1 if this subject receives the treatment and 0 if not. Let
be the q-dimensional time-independent covariates associated with the ith subject. Let
denote the potential response of the jth variable at time t from the ith subject for d = 1 and 0, where
and
. Let
be the p-dimensional time series of potential responses,
be the collection of
over time, and
be the observed response vector. Given the covariates Wi, let
be the subject level distribution function of
, where
denotes the set of all subject level parameters that determine the distribution
for the ith subject and d = 0, 1. We assume
where
is the super population of
. Under this model,
are stationary with the same subject level distribution
. We do not assume specified parametric forms for
or
.
Let be the potential outcomes of p0-dimensional subject level parameters of interest, where
and
denote the target parameters under treatment and control, respectively. Note that
is a function or a part of
for d = 0, 1, and
also includes all other nuisance parameters for each subject. As only one level of Di
can be observed for each subject, in our context, we use potential responses and potential outcomes to denote the subject level data
and parameters of interest
under Di
= d, respectively. Let
. Different from the classical causal inference literature (Rubin Citation1974),
is not observable, but can be estimated based on the observed measurements
of each subject. We are interested in the population average treatment effect (ATE) on the subject level parameters,
(2.1)
(2.1)
where
. Here, the numbers of responses p and parameters of interest p0 could be much larger than n and m, but the number of covariates q is a fixed constant.
For example, in a resting-state fMRI study, Di
could indicate the treatment group of the ith subject. The covariates may include age, gender, medical records, preexisting conditions and genetic information, and the observed responses
are the measurements extracted from the time course fMRI data, representing the blood flow intensities in p brain regions of interest at time t. The potential outcomes
could be the subject level correlations or partial correlations among the brain regions. For resting-state fMRI data, it is reasonable to assume
being stationary so that
is fixed over time. We are interested in studying the treatment effects on brain connectivity, reflected by the average differences of the potential outcomes between treatment and control.
Note that the subject level parameters of interest and the distributions of the potential responses
depend on the covariates Wi
and vary across subjects. Our setting allows subject heterogeneity, where the data are generated from a hierarchical system. In the first hierarchy, each subject has a specific distribution
depending on the covariates and treatment; in the second hierarchy, repeated measurements from the subject-specific distribution are taken over time. This causal inference framework under the hierarchical model can be applied to general applications with multi-layer structured data, for example, assessing drug effects using data from wearable devices in healthcare, testing genotype effects of crops on gene expression patterns changing over time, and studying treatment effects using repeated measurements or longitudinal data of subjects. In the following, we provide two brain imaging applications under our framework in detail. In both examples, we consider resting-state fMRI data.
Example 1
(Treatment Effects on Correlations). We are interested in the effects of certain treatments on brain connectivity measured by Pearson’s correlations among brain regions. In this case, the causal parameters of interest are the subject level correlations, where and
(2.2)
(2.2)
for d = 0, 1. Here, the correlation is taken with respect to the subject level distribution
. The ATEs on correlations are
(2.3)
(2.3)
for
. The parameter
represents the average difference of the correlation between the j1th and j2th brain regions for taking the treatment. If
, the treatment has a nonzero average effect on the marginal correlation between the two brain regions over the whole population. Despite the sample correlations for each pair of brain regions can be readily obtained for each subject, the simultaneous inference procedure for the estimated treatment effects on subject level correlations is nontrivial due to the dependence among the large set of estimates.
Example 2
(Treatment Effects on Regression Coefficients). While Pearson’s correlation measures marginal dependence among variables, in many applications, we are also interested in the conditional association between two variables given all other variables. This motivates us to consider the nodewise regression (Meinshausen and Bühlmann Citation2006)
(2.4)
(2.4)
where
and
are uncorrelated for all
. Let
and
be the subject level covariance and precision matrices of
with respect to the distribution
. Lemma 1 in Peng et al. (Citation2009) shows that both the regression coefficients and error covariances of the nodewise regression are related to the precision matrix
where
Moreover, the partial correlation between and
is equal to scaled coefficient
. Based on this relationship, precision coefficient and partial correlation can be estimated from the nodewise regression (Qiu and Zhou Citation2020).
In brain connectivity analysis, represents the conditional effect of the j2th brain region on the j1th region under the group d, after controlling the effects of other brain regions. We are interested in the ATE
on the regression coefficients
for
, which shows whether certain treatment could improve the conditional association between the j1th and j2th brain regions.
To identify nonzero ATEs in Examples 1 and 2, we consider the multiple hypotheses
(2.5)
(2.5)
for
. In the following sections, we only use the subscript j in τj
and
to denote the jth parameter of interest for
when there is no confusion, despite the double subscript
is used for correlation and regression coefficient between the j1th and j2th variables in Examples 1 and 2, where
.
3 Conditions and Identifiability
As the outcomes of interest are not directly observable, we make the following conditions for the identifiability of the treatment effect
.
Condition 1. (i) The collection of covariates, treatment assignment and subject level parameters are independent among subjects and identically distributed (iid) from a super population for all
.
(ii) The variable Di
takes a value of either 1 (treatment) or 0 (control) for all i with potential responses denoted by and
, and for each subject, there are no different forms or versions of each treatment level, which lead to different potential responses.
(iii) The potential responses ,
and
,
from different subjects are independent for
and all
.
The first two parts of Condition 1 are the stable unit treatment value assumption, or SUTVA (Imbens and Rubin Citation2015) for the problem. As the subject level parameters of interest is a function of
, the independence assumption in Part (i) implies no interference, which means that the potential outcomes for any subject do not vary with the treatments assigned to other subjects. Part (ii) assumes no hidden variations of treatments. Part (iii) assumes the potential response variables
are independent between subjects, but allows temporal dependence among
over t within a subject.
To identify the causal parameter τ of interest, we make the strict overlap assumption on the propensity score and the unconfoundedness assumption (Rosenbaum and Rubin Citation1983; Hirano, Imbens, and Ridder Citation2003) on the independence of the treatment indicator Di
and the potential responses
given the covariates
.
Condition 2. (Strict Overlap): There exists a small positive constant such that
for all
.
Condition 3. (Unconfounded Treatment Assignment): Given the covariates ,
(3.1)
(3.1)
for all
and all
.
Condition 2 is the positivity assumption that every subject has some positive probability to be assigned to every level of Di
, which ensures the possibility to find both treated and control units for any given value of the covariates. Condition 3 implies that conditioning on the covariates, the probability of receiving the treatment is independent of the potential responses over the repeated measurements for each subject. This means that except for a random error independent of the potential responses, the covariates
include all the variables that determine Di
. Compared with the classical unconfoundedness assumption, we require conditional independence between the treatment assignment and the entire time course data of responses. This is because the subject level parameters
are unobservable, and need to be estimated using the responses
from each subject.
For any estimate of
based on
, let
. As
is a function of
, Condition 3 leads to the conditional independence between Di
and
given the covariates, which implies
. Let
be the bias of the estimator
for the ith subject, where
, and the expectation
is with respect to the subject level distribution
given all the subject level parameters and covariates. If there exists an estimate that satisfies
(3.2)
(3.2)
as
, the difference between
and
converges to zero, and hence the population ATE
in (2.1) can be identified based on
. This identification result is summarized in the following lemma.
Lemma 1.
Assume that there exists an estimate of
satisfying (3.2). Under Conditions 1–3, the population ATE
can be identified by
, where the outer expectation is with respect to
.
In our context, since the outcomes of interest are not observable, the identifiability of
needs to be implied by an proper estimator
of
that satisfies (3.2). This is an additional condition compared with the classical argument for the identifiability of causal parameters with observable outcomes under the unconfoundedness assumption. Note that the identification of
is independent of the sample size n, and if there exists an exactly unbiased estimator
of
such that
for all
, it does not require
either. Here, the condition in (3.2) could be understood as a model assumption for the identification of
. To identify the treatment effect on an unobservable random variable
, we need to assume the existence of an approximately unbiased estimator of
in the model. Note that the existence of an estimator satisfying the condition (3.2) may not be trivially true for any parameter or subject distribution as the potential responses
could be time-dependent and the dimension of the parameters could be very large.
Also notice that Lemma 1 holds under a weaker SUTVA condition on the derived potential outcomes and a weaker unconfoundedness condition
for d = 0, 1 than Conditions 1 and 3. Since SUTVA and unconfoundedness are properties of the designs of the experiments or observational studies that generate the data, we make those two conditions on the potential responses in Conditions 1 and 3, instead of on an estimator
chosen by the investigator.
To conduct statistical inference for , we need a stronger condition than (3.2), which specifies the uniform
-norm convergence rate of the estimate
to
.
Condition 4. For the estimate of
, we have
for d = 0, 1, and
as
.
The theoretical results in Sections 4 and 5 show that the proposed inference procedure for τ is valid if the bias term is small enough such that . Compared with (3.2), this additional requirement on the bias term is needed to achieve
convergence rate for the estimated
. Condition 4 can be satisfied for various types of estimators if the repeated measurements
are weakly dependent in time and the sample size m for each subject is relatively large. Also notice that for unbiased estimators with
, Condition 4 holds for any m > 0, and m is not required to diverge to infinity.
Take Example 1 in Section 2 as an illustration. Let be the sample variance of the ith subject, where
. It can be shown that the subject level correlation
can be well approximated by the sample correlation
such that
if the sequence of potential responses
satisfy certain mixing property and moment condition for each subject. For Example 2, under low-dimensional cases, since the least square estimator of the regression coefficient
is unbiased, Condition 4 is valid for this estimator under any m > p. Under high-dimensional cases, regulated regression estimators like lasso (Tibshirani Citation1996) are biased and are not suitable for our purpose. Instead, the de-sparsified lasso estimator (Van de Geer et al. Citation2014) can be applied to estimate
, which also satisfies Condition 4 under certain sparsity conditions on the coefficients. The justification of Condition 4 for the sample correlation and the de-sparsified lasso estimator for Examples 1 and 2 is provided in the SM.
In the next section, we propose an estimator of the ATE via inverse propensity score weighting and a multiple testing procedure for the hypotheses (2.5) with FDP control.
4 Simultaneous Confidence Interval
To solve the challenges of many target parameters in , high-dimensional
and multi-source dependence in the data, in this section, we develop the Gaussian approximation result on the maximum of the estimates of
. We assume the logistic regression for the propensity score model, where Di
follows a Bernoulli distribution with the probability
(4.1)
(4.1)
for
and unknown parameters
. Let
denote the true value of
. The maximum likelihood estimator (MLE)
of the logistic regression (4.1) solves
(4.2)
(4.2)
Let be the estimated propensity score for the ith subject. Recall that
is an estimate of
based on the responses
. The ATE τj
in (2.1) can be estimated by the inverse probability weighted estimator for derived random variables
as
(4.3)
(4.3)
If we have the outcome models for , the augmented inverse probability weighted estimator (AIPWE)
can be applied to estimate τj
, where
is the estimated outcome model by regressing
on Di
= d and
. The AIPWE is doubly robust and is the efficient estimator for τj
if both the outcome models and the propensity score model in (4.1) are correctly specified (Cao, Tsiatis, and Davidian Citation2009). However, in our problem, specifying the outcome model may not be easy as the number of parameters is large and the parameter space could be restricted. In Example 1, correlations are bounded in
and the subject level correlation matrices are positive definite for all subjects. In Example 2, coefficients of the nodewise regression are proportional to partial correlations, which also have the positive definiteness constraint.
In the following, we derive the asymptotic expansion of , which implies the consistency of
to τj
and its limiting distribution. Let
and
be the first and second derivatives of the logistic function
, respectively, where
is the conditional variance of Di
given
. Let
be the first derivative of
with respect to
. Then,
is the Fisher information (FI) matrix of
in the model (4.1). Let
be the inverse of the FI matrix, and
(4.4)
(4.4)
be the
dimensional influence matrix of
on
. The following proposition provides the asymptotic expansion of
in (4.3).
Proposition 1.
Assume the subject level parameters of interest , their estimates
, the covariates
and the true propensity score parameter
are bounded such that
and
for all
and a positive constant C. Under Conditions 1–4 and (4.1), we have that
(4.5)
(4.5)
where
,
(4.6)
(4.6)
with
for all
, and
is the jth row of
.
Proposition 1 implies asymptotic normality of with the influence functions
. Let
(4.7)
(4.7)
be the main order term of
. Under the conditions
and
, we have
in distribution for all
, as
. Notice that the variance θj
includes the variation of subject level parameters
, the estimation variation of
for each subject, and the variation of the estimated propensity score. The decomposition of θj
into each of those sources is provided in (S.7) in the SM. Let
be the estimator of θj
, where
(4.8)
(4.8)
The following proposition provides the uniform convergence rate of to θj
.
Proposition 2.
Under the conditions of Proposition 1, it can be shown that .
Although the responses could be time dependent within each subject, due to the independence among subjects, Proposition 2 shows that θj
can be consistently estimated by the sample variance of
without estimating the within-subject temporal dependence. The results in Propositions 1 and 2 directly imply the asymptotic normality of the standardized treatment effect
and the confidence interval of τj
, which is presented in the following theorem.
Theorem 1.
Under the conditions of Proposition 1, , and
for a small positive constant b1, we have
in distribution as
.
From Theorem 1, the confidence interval for τj
can be constructed as
, where
is the upper
quantile of the standard normal distribution. The condition
stands for nondegenerate variance of
. To construct simultaneous confidence intervals of
, we need to screen out the noninformative components with θj
converging to zero. Note that, from the decomposition of θj
in (S.7) in the SM,
if
for d = 0, 1 and all
, and the estimation variation of
diminishes to zero with the increase of m. Let
be the non-informative components of the subject level parameters. In Example 1 of causal effects on correlations, this means a common sparsity structure on all subject level correlation matrices such that some of the correlations are zero uniformly across all subjects.
Let for a small positive constant
, and
be the complement set of R0. Here, the lower bound
is needed to derive the asymptotic results in Theorems 1 and 2, which can be chosen arbitrarily small to exclude the components with
. Note that θj
also includes the estimation variation
which does not diminish to zero for bounded m. This screening procedure will typically not exclude any component for small m in real applications. In practice, we choose
so that
for
. In the real data analysis in Section 7, we find all
are larger than 0.03 and
.
Let be the complement set of
. To construct the simultaneous confidence intervals of τj
over
, we consider the maximal standardized estimates of treatment effects
(4.9)
(4.9)
over
. From the expansion (4.5), different components in
are dependent due to correlations among the subject level parameters
from the population distribution and the common estimate
of the propensity scores used in all
. The complex dependence among
makes the asymptotic analysis of
challenging.
To tackle this problem, we derive a Gaussian approximation result for 𝒱, and use the multiplier bootstrap to estimate its quantile and construct the simultaneous confidence intervals for . To establish this approximation result, we make the following assumption on the lower bound of θj
and the upper bound of the correlations of
for
. Conditions on bounds of variances and covariances are needed for Gaussian approximation results (Chernozhukov, Chetverikov, and Kato Citation2013).
Condition 5. There exist small positive constants b1 and b2 such that for all
and
for all
and
.
Notice that the variance θj
of is bounded from above under the conditions of Proposition 1. Condition 5 assumes θj
being bounded from below for all the components except those noninformative ones in
, and the correlations of
among those components are bounded away from 1. This implies nondegenerate influence functions
of
for all
. From Proposition 1,
is asymptotically equivalent to
, where
can be well approximated by
. Let
and
be the vectorization of
and
, respectively. Note that
for all
. Let
be the sample covariance of
, and
be the diagonal matrix of
. Let
be the collection of all data. The following theorem shows the distribution function of
can be approximated by that of the maximum of a Gaussian random vector when the sample size n is large.
Theorem 2.
Under the conditions of Proposition 1, Condition 5 and , we have
where
is a multivariate normal random vector.
Theorem 2 extends the original Gaussian approximation result for sample means (Chernozhukov, Chetverikov, and Kato Citation2013) to inverse probability weighted estimates with derived outcomes. From this result, the quantiles of can be approximated by those of
. To simulate
, we propose a multiplier bootstrap procedure that generates
and calculates
for . It can be easily shown that
. The upper α quantile of
can be estimated by
(4.10)
(4.10)
The simultaneous confidence intervals for
can be constructed as
(4.11)
(4.11)
for
, where
as
.
As the data from different individuals are assumed to be independent, the empirical bootstrap that re-samples individuals might also be able to estimate the distribution function of . Let
, and
be the re-sample estimates of
, τj
and θj
, respectively. The empirical bootstrap uses
to approximate the distribution of
. Chernozhukov, Chetverikov, and Kato (Citation2013) (Appendix K) showed that the empirical bootstrap can consistently estimate the distribution function of the maximum of sample means. However, the consistency of the empirical bootstrap for the maximum of the standardized IPW estimates in our problem is unclear as
requires the estimation of the propensity scores compared with sample means. We will investigate this question in future work.
5 Multiple Testing Procedure
In this section, we consider the multiple hypotheses versus
for
. Note that the simultaneous confidence interval constructed in (4.11) can be directly used to identify nonzero τj
. This procedure controls the FWER, defined as the probability of rejecting any true null hypothesis, at α asymptotically. However, the FWER control procedures are too conservative which lose power in detecting nonzero treatment effects. We aim to propose a more powerful multiple testing method that controls the FDP.
FDP is the ratio of the number of false positives over the number of discoveries, and false discovery rate (FDR) is the expectation of FDP. Given a small constant , the FDP exceedance rate (FDPex) is defined as
, which gives the probability of the FDP exceeding level c in a random sample. FDR control procedures target on the average FDP over repeated random samples, which fail to consider the variation of FDP in a single experiment. To introduce a more stringent measure of Type I errors for one random sample, Genovese and Wasserman (Citation2006) suggested to control the FDP exceedance rate
for pre-specified small positive constants c and α.
Following the step-down testing process with augmentation proposed in van der Laan, Dudoit, and Pollard (Citation2004b); Genovese and Wasserman (Citation2006), we use a similar construction of the multiple testing procedure to control the FDPex. However, the existing methods fail to work in our problem as any pair of the estimated ATEs are dependent. To solve this problem, we build the testing procedure on the maximum of
, and couple the step-down process with multiplier bootstrap, which approximates the distribution of the maximum statistic of standardized
based on the Gaussian approximation result.
Specifically, we test the overall hypotheses
sequentially by the maximum statistics
(5.1)
(5.1)
where
is a subset of indices. Let
be the vectorization of
, and
be the diagonal matrix of
, where
and
are given in (4.8). Let
be the sample covariance of
. Similar to Theorem 2, it can be shown that the quantile of
under
can be consistently estimated by the quantile of
where
. Therefore, multiplier bootstrap is applied to determine the rejection region of
for testing hypotheses
. If
is rejected, we remove the most significant index with the largest
from
and continue this testing process until the null hypothesis is not rejected. It can be shown this step-down process can control the FWER. By augmenting the rejected set with the next few most significant components, the final discovered set of nonzero τj
is able to control the FDPex.
Let be the cardinality of a set U, and
. Starting from the set
and the maximum statistic
, the proposed procedure is as follows.
Generate
. Let
Repeat the above step B times to generate iid Monte Carlo samples
Let
Repeat the first three steps until
Augment
Let be the set of true nonzero causal effects. The following theorem states the asymptotic size and power of the proposed multiple testing procedure.
Theorem 3.
Under the conditions of Proposition 1, Condition 5 and , for testing the hypotheses
vs.
for
, we have that
Theorem 3 demonstrates that the proposed multiple testing procedure is able to control the FDP exceedance rate at α and has a power converging to 1 if all the nonzero τj
is large than for some positive constant c. Compared with the existing methods, we have theoretically shown the Type I error control of the proposed testing procedure under general dependence among
based on the Gaussian approximation result. This theoretical result is justified by the empirical size and power of the proposed procedure reported in the simulation section.
6 Simulation
In this section, we conducted simulation studies to evaluate the false discovery proportion and power of the proposed multiple testing procedure for the hypotheses (2.5). We considered the treatment effects on subject level correlations and regression coefficients in Examples 1 and 2 in Section 2. As a comparison of the proposed procedure, we also implemented the Benjamini-Hochberg (BH) procedure (Benjamini and Hochberg Citation1995) on the standardized estimated treatment effect based on Theorem 1.
For each subject , the covariates
were iid generated from a q-dimensional multivariate normal distribution with zero mean and covariance matrix
, where
. Let
be the q-dimensional vector of one. The treatment assignment Di
was generated from a logistic regression model with
, where
. To generate the potential responses
of each subject, we first constructed the subject level correlation matrix
. To model subject heterogeneity on correlations, let
, where
and
was generated from
independent with Di
. We set the potential covariance matrix under control (d = 0) to be fixed among all subjects where
. For the potential outcomes under treatment (d = 1), we considered block-diagonal and super-diagonal settings to construct signals on the individual covariance matrices as follows.
Block-diagonal:
Super-diagonal:
Under the block-diagonal setting, the nonzero treatment effects appear in the blocks of size s0 along the main diagonal of the correlation matrices. There are no causal effects on subject level correlations outside those blocks. All the nonzero treatment effects have the same strength for the ith subject, and
is the average treatment effect on correlations. Under the super-diagonal setting, the nonzero causal effects are only on the s1th super diagonal of the correlation matrices. Comparing the two structures, the block-diagonal setting has more signals than the super-diagonal setting. In our settings, as Di
was independent of the subject level covariances
conditioning on the covariates
, the unconfounded treatment assignment condition was satisfied. We chose
and
in the simulation.
Denote . For each individual, the time course data
over repeated measurements were generated via a vector autoregressive (VAR) model. Let
and
be iid random vectors from the p-dimensional normal distribution
with mean zero and covariance matrix
, where m is the number of repeated measurements for each subject over time. As the number of fMRI scans from each subject is usually around 200 to 300, we set m = 300 in our study. Let
for
, where the parameter
specifies the strength of time dependence. Under this VAR model, the temporal correlation between
and
is equal to
for all
. We considered both
and
to evaluate the effect of time dependence on the proposed procedure. We set the number of covariates q = 4, n = 100, 200 and p = 50, 100. All the simulation settings were repeated 1000 times.
For the proposed multiple testing procedure, we aimed to control the FDPex rate over 0.1 at 0.05, namely, . The number B of bootstrap samples in (5.2) was set to be 1000. The nominal level of FDR for the BH procedure was set as 0.05. Over the 1000 repetitions of each simulation setting, we calculated the average FDR, the proportion of FDP larger than 0.1, and the average true positive rate (TPR) as the power of the test, which is the number of true positives over the total number of nonzero signals. Note that the BH procedure targets to control the FDR, which may not be able to control the FDPex rate, and the dependence among the standardized estimates
due to sharing the common estimated propensity scores may also cause an inaccurate Type I error control for the BH procedure. The average FDPex rate, FDR and power of the two methods are reported in and .
Fig. 1 The average FDPex rate , FDR and power of the proposed (red) and BH (blue) procedures for testing the hypotheses (2.5) to recover the nonzero treatment effects on the subject level correlations under the block-diagonal signal setting with
, m = 300, n = 100, 200,
and
and 0.3. The nominal level was 0.05.
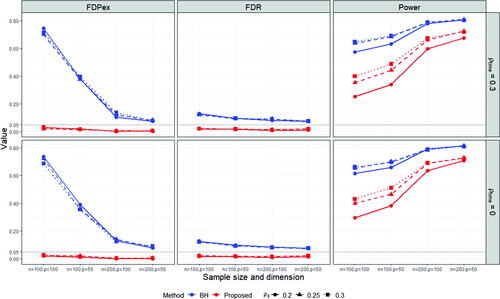
Fig. 2 The average FDPex rate , FDR and power of the proposed (red) and BH (blue) procedures for testing the hypotheses (2.5) to recover the nonzero treatment effects on the subject level correlations under the super-diagonal signal setting with
, m = 300, n = 100, 200,
and
and 0.3. The nominal level was 0.05.
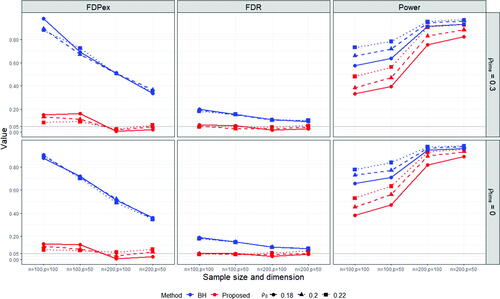
From and , we observe that the proposed method can control the FDPex rate for testing the hypotheses (2.5) smaller than 0.05 under most of the cases, except for the super-diagonal signal setting under n = 100, where the FDPex rate was around 0.1. But this error rate decreased to less than 0.05 when the number of subjects n was increased to 200. Meanwhile, the FDR of the proposed method was well controlled, around 5% under all the cases. In comparison, the empirical FDPex rate of the BH procedure was quite large, which reached over 0.7 and 0.9 under the block-diagonal and super-diagonal signal settings with n = 100, respectively. The FDPex rate of BH became much smaller under the block-diagonal setting when n was increased to 200, but it was still larger than 5%. This shows that the BH procedure can not control the FDP exceedance rate for testing many treatment effects derived from the same group of subjects. Also, notice that BH encountered a slight inflation on FDR. Its FDR was around 0.1 larger than the nominal level 5%. It reached around 0.2 under the super-diagonal setting and n = 100. This may be due to the dependence among the estimated treatment effects in (4.3) as they all use the common propensity scores.
The overall power of the proposed test was reasonable, and it was much increased with the increase of the sample size from 100 to 200. Compared with the BH procedure, the power of the proposed procedure was lower, especially under n = 100. This is because of the size inflation of the BH procedure and the more stringent Type I error control of our procedure. Notice that both procedures use the same estimates of the average treatment effects. The difference is solely from the ways of choosing the cutoff value for testing the multiple hypotheses (2.5). When n was increased to 200, the power of the proposed procedure became much closer to those of BH. Especially, under the super-diagonal setting and , the power of both methods reached around 0.9. Also notice that the results under
and
were comparable for both methods. When
, the subject level data were temporally independent. The power under
was slightly lower, which was due to the larger variation of the estimated subject level correlations under time-dependent data.
To evaluate the treatment effects on regression coefficients in Example 2, we compared the performance of the proposed method with the lasso estimate and the de-sparsified lasso estimate described in Section S1 in the SM. Note that the lasso estimate is biased, which does not satisfy Condition 4. The covariates , treatment assignment Di
and the subject level covariance matrix
under control were generated the same as the simulation settings for Example 1. Let
be the precision matrix. We added the signals on
in the block-diagonal setting where
for
and
for
. The subject level data
were generated by the VAR model with the error distribution
, where
. From Example 2, the support of the coefficients
of the nodewise regressions is the same as that of the precision matrix
. The lasso penalty parameters λj
and
were set as
for all
.
The average FDPex rate, FDR and power are reported in Figure S1 in the SM. We observe that the proposed method with the de-sparsified lasso estimate was able to control the FDPex rate under the nominal level 5% with good power. Its FDR was also controlled at 5%. In contrast, the proposed method with the lasso estimate failed to work. Its power was lower than 0.1 for all the cases due to the underestimation of the true regression coefficients. These results show that the asymptotic unbiasedness condition (Condition 4) is essential for the validity of the proposed method. Simply using any consistent estimator for the subject level parameters may not lead to desirable estimates of the treatment effects.
7 Case Study
It is well recognized that neurodevelopmental and neurodegenerative disorders, like Autism spectrum disorder (ASD), are associated with altered patterns of over- and under-connectivity in brains (Kana et al. Citation2014). In this section, we studied medication effects on the brain functional connectivity of patients with ASD. We used the fMRI data of 79 ASD patients from New York University Langone Medical Center. The preprocessed data were downloaded from the Autism Brain Imaging Data Exchange I initiative (Craddock et al. Citation2013). Among the 79 patients, 16 of them had taken some kind of medications for alleviating the related symptoms of ASD, and the rest 60 had not. We estimated and identified the nonzero treatment effects on brain functional connectivity, measured by correlations among brain regions, between the groups taking and not taking medications within three months before taking fMRI scans.
For each subject, there were 175 scans of brain overtime in the fMRI data, and a set of 116 regions-of-interests (ROI) were extracted according to the automated anatomical labeling atlas. Following Liu and Huang (Citation2020), those 116 ROIs can be divided into six common functional networks: the default mode network (DMN), the execution and attention network (EAN), the sensorimotor network (SMN), the visual network (Visual), the subcortical nuclei (SBN) regions and the cerebellum (Cerebel), which consist of 22, 17, 18, 14, 19, 26 regions, respectively. Data of three patients were deleted, one of which was due to missing covariates and the other two were due to missing values in the ROIs. The final data included 76 ASD patients.
Four covariates including age, sex, handedness, and FIQ were chosen in the analysis. Age and sex are binary variables, handedness is an integer score between –100 and 100 with a higher score implying more use of the right hand and vice versa, and FIQ is a positive integer score representing the standard estimate of intelligence. Note that the development of ASD symptoms is related to age, and ASD is a disorder of sexual differentiation (Alaerts, Swinnen, and Wenderoth Citation2016). IQ scores also affect the decision of taking medicine. An ASD patient may be treated if there is some abnormality in IQ. Meanwhile, those covariates are also related to the differences in brain connectivity among subjects. Therefore, age, sex, and IQ can be regarded as common causes for the treatment indicator and the potential responses. We make the unconfoundedness assumption that the treatment assignment and the potential fMRI readings are conditionally independent given the covariates.
We applied the proposed procedure for testing the multiple hypotheses (2.5) to identify the nonzero treatment effects on the subject level correlations among brain ROIs. Similar to the simulation study, we controlled the probability of FDP exceeding 0.1 at 0.05, namely, c = 0.1 and . We discovered four significant pairs of brain connections with nonzero ATE of medication on ASD patients, which are reported in together with the corresponding functional network. The BH procedure that controls the FDR at 5% based on the standardized estimated treatment effects gives the same set of discovered connections as the proposed method for this dataset. The estimated treatment effects for the four discovered pairs, their 95% confidence intervals, the IPW averages for the treatment and control groups,
and
, are also reported in . The visualization of those connections is shown in Figure S2 in the SM. All six functional networks except the cerebellum network were involved in those significant connections. Notice that the correlation between SMA.L and HES.R were altered in the positive direction on average by medication, while the correlations of the other three pairs were negatively enhanced. Among the identified ROIs, HES.R was also reported to be strongly associated with the severity of ASD in Liu and Huang (Citation2020). The discovered connections were mainly related to the execution and attention network (EAN). According to CDC, signs and symptoms of ASD are associated with execution and attention. Bernas et al. (Citation2018) and Snyder and Troiani (Citation2020) also found evidence that relates the abnormalities of neurodynamics and connectivity of ASD brains to brain regions associated with attention and execution. Our method reveals the medication effects on brain connectivities of some regions in EAN, which may alleviate the symptoms of ASD.
Table 1 The four pairs of ROIs (the functional networks they belong to in the parentheses) with the identified nonzero treatment effects on subject level correlations by the proposed multiple testing procedure, the estimated treatment effect, its 95% confidence interval, and the IPW averages for the treatment group (Ave-trt) and the control group (Ave-cl).
We also applied the two-sample t-test directly on the subject level sample correlations . This is equivalent to treating the propensity score in (4.3) being 16/76 for all subjects, as the ratio of the number of treated patients over the total sample size. Such a procedure is commonly used in many neuroscience studies. However, no significant difference in correlations between the treatment and control groups was found without the propensity score adjustment. This shows that simply conducting two-sample t-tests may not be able to identify treatment effects in observational studies for brain connectivity.
8 Discussion
In this article, we consider estimating the ATEs of unobservable random variables from each subject under the ignorability assumption. Those unobservable random variables need to be estimated using subject level data. Our theoretical analysis shows that an additional unbiasedness condition is needed for the identifiability and estimation of the ATEs, compared with the classical causal inference problems under the ignorability assumption. This implies that not all consistent estimators of the subject level parameters of interest can be used to estimate the population treatment effects. A de-biased estimator satisfying Condition 4 needs to be constructed.
We study the treatment effects on brain functional connectivity measured by Pearson’s correlation in the case study. The proposed method can be applied to other measures of brain connectivity, for example, Spearman’s ρ and Kendall’s τ for nonlinear association and partial correlation for conditional association. The proposed procedure can be extended to dynamic treatment effects over time as well, where the subject level potential outcomes and the average treatment effects
are functions of time (Bojinov, Rambachan, and Shephard Citation2021). This setting is suitable for task-based fMRI data where the brain activity patterns are likely to change with respect to the given tasks. Developing more powerful multiple testing procedures able to control the FDP under a general dependence structure among the estimated ATEs is also worth investigating in future work.
UASA_A_2252135_Supplement.zip
Download Zip (96.3 KB)supplement.pdf
Download PDF (1.8 MB)Acknowledgments
The authors would like to thank the anonymous referees, the Associate Editor and the Editor for thoughtful comments and suggestions which have improved the presentation of the paper. Part of the work reported in the paper was conducted while Qiu was affiliated with Iowa State University. He thanks ISU’s statistics department for providing various support during the course of the project.
Supplementary Materials
The supplementary material provides justification of Condition 4 for the de-sparsified lasso estimator and sample correlation, proofs for all theoretical results and some additional numerical results.
Disclosure Statement
No potential conflict of interest was reported by the author(s).
Additional information
Funding
References
- Alaerts, K., Swinnen, S. P., and Wenderoth, N. (2016), “Sex Differences in Autism: A Resting-State fMRI Investigation of Functional Brain Connectivity in Males and Females,” Social Cognitive and Affective Neuroscience, 11, 1002–1016. DOI: 10.1093/scan/nsw027.
- Andrews-Hanna, J. R., Snyder, A. Z., Vincent, J. L., Lustig, C., Head, D., Raichle, M. E., and Buckner, R. L. (2007), “Disruption of Large-Scale Brain Systems in Advanced Aging,” Neuron, 56, 924–935. DOI: 10.1016/j.neuron.2007.10.038.
- Austin, P. C., and Stuart, E. A. (2015), “Moving Towards Best Practice When Using Inverse Probability of Treatment Weighting (IPTW) Using the Propensity Score to Estimate Causal Treatment Effects in Observational Studies,” Statistics in Medicine, 34, 3661–3679. DOI: 10.1002/sim.6607.
- Bang, H., and Robins, J. M. (2005), “Doubly Robust Estimation in Missing Data and Causal Inference Models,” Biometrics, 61, 962–973. DOI: 10.1111/j.1541-0420.2005.00377.x.
- Benjamini, Y., and Hochberg, Y. (1995), “Controlling the False Discovery Rate: A Practical and Powerful Approach to Multiple Testing,” Journal of the Royal Statistical Society, series B, 57, 289–300. DOI: 10.1111/j.2517-6161.1995.tb02031.x.
- Bernas, A., Barendse, E. M., Aldenkamp, A. P., Backes, W. H., Hofman, P. A., Hendriks, M. P., Kessels, R. P., Willems, F. M., de With, P. H., Zinger, S., et al. (2018), “Brain Resting-State Networks in Adolescents with High-Functioning Autism: Analysis of Spatial Connectivity and Temporal Neurodynamics,” Brain and Behavior, 8, e00878. DOI: 10.1002/brb3.878.
- Berto, S., Treacher, A. H., Caglayan, E., Luo, D., Haney, J. R., Gandal, M. J., Geschwind, D. H., Montillo, A. A., and Konopka, G. (2022), “Association between Resting-State Functional Brain Connectivity and Gene Expression is Altered in Autism Spectrum Disorder,” Nature Communications, 13, 1–11. DOI: 10.1038/s41467-022-31053-5.
- Bojinov, I., Rambachan, A., and Shephard, N. (2021), “Panel Experiments and Dynamic Causal Effects: A Finite Population Perspective,” Quantitative Economics, 12, 1171–1196. DOI: 10.3982/QE1744.
- Brown, P. J., Vannucci, M., and Fearn, T. (1998), “Multivariate Bayesian Variable Selection and Prediction,” Journal of the Royal Statistical Society, Series B, 60, 627–641. DOI: 10.1111/1467-9868.00144.
- Cai, T. T., and Liu, W. (2016), “Large-Scale Multiple Testing of Correlations,” Journal of the American Statistical Association, 111, 229–240. DOI: 10.1080/01621459.2014.999157.
- Cao, W., Tsiatis, A. A., and Davidian, M. (2009), “Improving Efficiency and Robustness of the Doubly Robust Estimator for a Population Mean with Incomplete Data,” Biometrika, 96, 723–734. DOI: 10.1093/biomet/asp033.
- Chernozhukov, V., Chetverikov, D., and Kato, K. (2013), “Gaussian Approximations and Multiplier Bootstrap for Maxima of Sums of High-Dimensional Random Vectors,” The Annals of Statistics, 41, 2786–2819. DOI: 10.1214/13-AOS1161.
- Craddock, C., Benhajali, Y., Chu, C., Chouinard, F., Evans, A., Jakab, A., Khundrakpam, B. S., Lewis, J. D., Li, Q., Milham, M., Yan, C., and Bellec, P. (2013), “The Neuro Bureau Preprocessing Initiative: Open Sharing of Preprocessed Neuroimaging Data and Derivatives,” Frontiers in Neuroinformatics, 7, 27.
- Feller, A., and Gelman, A. (2015), Hierarchical Models for Causal Effects, Hoboken, NJ: Wiley.
- Funk, M. J., Westreich, D., Wiesen, C., Stürmer, T., Brookhart, M. A., and Davidian, M. (2011), “Doubly Robust Estimation of Causal Effects,” American Journal of Epidemiology, 173, 761–767. DOI: 10.1093/aje/kwq439.
- Genovese, C., and Wasserman, L. (2004), “A Stochastic Process Approach to False Discovery Control,” The Annals of Statistics, 32, 1035–1061. DOI: 10.1214/009053604000000283.
- Genovese, C. R., and Wasserman, L. (2006), “Exceedance Control of the False Discovery Proportion,” Journal of the American Statistical Association, 101, 1408–1417. DOI: 10.1198/016214506000000339.
- Hirano, K., Imbens, G. W., and Ridder, G. (2003), “Efficient Estimation of Average Treatment Effects Using the Estimated Propensity Score,” Econometrica, 71, 1161–1189. DOI: 10.1111/1468-0262.00442.
- Imbens, G., and Rubin, D. (2015), Causal Inference for Statistics, Social, and Biomedical Sciences: An Introduction, Cambridge: Cambridge University Press.
- Kana, R. K., Uddin, L. Q., Kenet, T., Chugani, D., and Müller, R.-A. (2014), “Brain Connectivity in Autism,” Frontiers in Human Neuroscience, 8, 349. DOI: 10.3389/fnhum.2014.00349.
- Liu, X., and Huang, H. (2020), “Alterations of Functional Connectivities Associated with Autism Spectrum Disorder Symptom Severity: A Multi-Site Study Using Multivariate Pattern Analysis,” Scientific Reports, 10, 1–13. DOI: 10.1038/s41598-020-60702-2.
- Marrelec, G., Krainik, A., Duffau, H., Pélégrini-Issac, M., Lehéricy, S., Doyon, J., and Benali, H. (2006), “Partial Correlation for Functional Brain Interactivity Investigation in Functional MRI,” Neuroimage, 32, 228–237. DOI: 10.1016/j.neuroimage.2005.12.057.
- Meinshausen, N., and Bühlmann, P. (2006), “High-Dimensional Graphs and Variable Selection with the Lasso,” The annals of statistics, 34, 1436–1462. DOI: 10.1214/009053606000000281.
- Palaniyappan, L., Simmonite, M., White, T. P., Liddle, E. B., and Liddle, P. F. (2013), “Neural Primacy of the Salience Processing System in Schizophrenia,” Neuron, 79, 814–828. DOI: 10.1016/j.neuron.2013.06.027.
- Peng, J., Wang, P., Zhou, N., and Zhu, J. (2009), “Partial Correlation Estimation by Joint Sparse Regression Models,” Journal of the American Statistical Association, 104, 735–746. DOI: 10.1198/jasa.2009.0126.
- Qiu, Y., and Zhou, X.-H. (2020), “Estimating c-level Partial Correlation Graphs with Application to Brain Imaging,” Biostatistics, 21, 641–658. DOI: 10.1093/biostatistics/kxy076.
- Qiu, Y., and Zhou, X.-H. (2022), “Inference on Multi-Level Partial Correlations based on Multi-Subject Time Series Data,” Journal of the American Statistical Association, 117, 2268–2282.
- Rosenbaum, P. R., and Rubin, D. B. (1983), “The Central Role of the Propensity Score in Observational Studies for Causal Effects,” Biometrika, 70, 41–55. DOI: 10.1093/biomet/70.1.41.
- Rubin, D. B. (1974), “Estimating Causal Effects of Treatments in Randomized and Nonrandomized Studies,” Journal of Educational Psychology, 66, 688–701. DOI: 10.1037/h0037350.
- Rubin, D. B. (1978), “Bayesian Inference for Causal Effects: The Role of Randomization,” The Annals of statistics, 6, 34–58.
- Snyder, W., and Troiani, V. (2020), “Behavioural Profiling of Autism Connectivity Abnormalities,” BJPsych Open, 6, e11. DOI: 10.1192/bjo.2019.102.
- Tibshirani, R. (1996), “Regression Shrinkage and Selection via the Lasso,” Journal of the Royal Statistical Society, Series B, 58, 267–288. DOI: 10.1111/j.2517-6161.1996.tb02080.x.
- Van de Geer, S., Bühlmann, P., Ritov, Y., and Dezeure, R. (2014), “On Asymptotically Optimal Confidence Regions and Tests for High-Dimensional Models,” The Annals of Statistics, 42, 1166–1202. DOI: 10.1214/14-AOS1221.
- van der Laan, M. J., Dudoit, S., and Pollard, K. S. (2004a), “Multiple Testing. Part II. Step-Down Procedures for Control of the Family-Wise Error Rate,” Statistical Applications in Genetics and Molecular Biology, 3, Article14. DOI: 10.2202/1544-6115.1041.
- van der Laan, M. J., Dudoit, S., and Pollard, K. S. (2004b), “Multiple Testing. Part III. Procedures for Control of the Generalized Family-Wise Error Rate and Proportion of False Positives,” U.C. Berkeley Division of Biostatistics Working Paper Series.