
 ?Mathematical formulae have been encoded as MathML and are displayed in this HTML version using MathJax in order to improve their display. Uncheck the box to turn MathJax off. This feature requires Javascript. Click on a formula to zoom.
Abstract
The effective utilization of structural information in data while ensuring statistical validity poses a significant challenge in false discovery rate (FDR) analyses. Conformal inference provides rigorous theory for grounding complex machine learning methods without relying on strong assumptions or highly idealized models. However, existing conformal methods have limitations in handling structured multiple testing, as their validity often requires the deployment of symmetric decision rules, which assume the exchangeability of data points and permutation-invariance of fitting algorithms. To overcome these limitations, we introduce the pseudo local index of significance (PLIS) procedure, which is capable of accommodating asymmetric rules and requires only pairwise exchangeability between the null conformity scores. We demonstrate that PLIS offers finite-sample guarantees in FDR control and the ability to assign higher weights to relevant data points. Numerical results confirm the effectiveness and robustness of PLIS and demonstrate improvements in power compared to existing model-free methods in various scenarios. Supplementary materials for this article are available online, including a standardized description of the materials available for reproducing the work.
1 Introduction
In various applications, data is commonly acquired and organized as ordered sequences or lattices, revealing informative structural patterns that play a crucial role in analysis and interpretation. For example, spatio-temporal data in econometric analyses may display serial or spatial dependence structures, while in genome-wide association studies, single-nucleotide polymorphisms (SNPs) often cluster along biological pathways, indicating functional relationships between genes. To make reliable and meaningful inferences, it is essential to account for the underlying structural patterns in such data. False discovery rate (FDR) methods (Benjamini and Hochberg Citation1995) are a powerful tool for identifying sparse signals from massive and complex data. In FDR analyses, a significant challenge lies in integrating structural information to enhance statistical power and interpretability, while simultaneously ensuring the validity of FDR control. In this section, we discuss recent advancements in addressing this challenge, as well as the limitations of existing approaches, and present our contributions.
1.1 Model-Based and Model-Free FDR Methods
Structural knowledge, such as the clustering patterns and dependence, can be leveraged to enhance the efficiency of existing FDR methods, as demonstrated by the works of Benjamini and Heller (Citation2007), Sun and Cai (2009), Fan, Han, and Gu (Citation2012), Sun et al. (Citation2015), Rebafka, Roquain, and Villers (Citation2022), and Perrot-Dockès et al. (Citation2023). However, the validity of existing “model-based” FDR methods, which involve constructing new test statistics based on estimated model parameters, typically depend on idealized assumptions, such as correct specification of the data generating models, homogeneity and stationarity of the underlying processes, consistent estimation of unknown parameters, and asymptotic normality of the test statistics. These assumptions may not be fulfilled and may be hard to check in practice. The violation of these assumptions can have serious consequences in FDR analysis, including decreased power and inflated error rate. It remains a significant challenge to develop powerful FDR methods for structured multiple testing that are assumption-lean and provably valid.
The framework of conformal inference (Vovk, Gammerman, and Shafer Citation2005) provides finite-sample uncertainty guarantees on a flexible class of off-the-shelf machine learning algorithms, only under the assumption of exchangeability. The important connection between machine learning and FDR analysis, as highlighted by Yang et al. (Citation2021), Mary and Roquain (Citation2022), and Bates et al. (Citation2023), indicates that efficient conformity scores, and hence provably valid and powerful conformal p-values, can be constructed based on complex learning algorithms. This insightful perspective leads to “model-free” approaches to FDR control, a research direction with considerable promise. Recent developments along this direction include the BONuS (Yang et al. Citation2021) and AdaDetect (Marandon et al. Citation2024) procedures, which convincingly demonstrate that combining conformal p-values with the Benjamini-Hochberg (BH) algorithm enables the use of highly effective machine learning models while ensuring finite-sample FDR control, even in the presence of model misspecification. However, currently available conformal methods are not well-equipped to handle structured multiple testing. The limitation is illustrated next.
1.2 Non-Exchangeable Scores and Asymmetric Decision Rules
Suppose we are interested in testing m null hypotheses , for
, based on summary statistics
. Denote
the true states of nature, where
indicates that
is true/false. Let
. The decisions are represented by a binary vector
, where
indicates that
is rejected and
otherwise. We allow
to depend on the entire dataset
. We call
a symmetric decision rule (Copas Citation1974) if
for all permutation operators
.
To provide context, consider a hidden Markov model (HMM) where the underlying states are unknown, and the observations are conditionally independent given
. In this toy example, we assume that the hidden states form a binary Markov chain and the non-null cases tend to appear in clusters. We further assume that the null and non-null distributions are respectively given by
and
Suppose we have observed
,
, where
is surrounded by small observations and
is surrounded by large observations. Intuitively,
is more likely to be a non-null case compared to
due to the clustering effects from the Markovian structure; hence, symmetric rules are inappropriate. Sun and Cai (2009) demonstrated that the optimal FDR procedure in HMMs is an asymmetric rule that relies on thresholding the local index of significance (LIS), whose value depends on the entire sequence, with higher weights given to neighboring locations.
The presence of structured patterns within the data and the use of asymmetric rules pose a significant challenge to the conformal inference framework. To see this, we tentatively consider the following definition, which generalizes the conformal p-value in Bates et al. (Citation2023) in a nuanced (and possibly improper) way:
(1)
(1)
Here is the conformity score function that is allowed to vary across i,
is the index set for calibration data containing null samples
, with
denoting the cardinality of a set. Bates et al. (Citation2023) showed that if the score functions are identical and permutation-invariant, and the data points
are jointly exchangeable, then the conformal p-values in (1) are super-uniform and PRDS.Footnote1 Hence, according to Benjamini and Yekutieli (Citation2001) and Sarkar (Citation2002), applying BH with these conformal p-values is valid for FDR control. However, score functions that leverage structural patterns are typically not permutation-invariant, leading to a violation of the joint exchangeability assumption. Consequently, the conformal p-values defined by (1) may become improper and compromise the PRDS property, making it problematic to apply the BH procedure.
1.3 A Preview of Our Method and Contributions
To develop a provably valid FDR procedure that can effectively leverage structural information and accommodate asymmetric rules, we propose the pseudo local index of significance (PLIS) procedure that consists of three steps:
constructing baseline data that preserve useful structural patterns;
calculating conformity scores based on user-specified working models;
constructing a mirror process that emulates the true process for decision-making.
The proposed algorithm features two critical components: an innovative algorithm for calculating the conformity score through a working model, which captures useful structural patterns and enhances the efficiency of the FDR analysis; a generic framework for constructing a mirror process for decision-making, which bypasses the p-value inference framework, eliminates the need for joint exchangeability assumptions, and establishes finite-sample FDR theory for asymmetric rules.
The proposed research makes several contributions. First, PLIS provides a provably valid model-free approach to multiple testing. Compared to model-based FDR procedures, it achieves comparable power when the underlying model is correctly specified and accurately estimated, while maintaining finite-sample FDR control in scenarios where the model is mis-specified or estimated poorly. Second, PLIS demonstrates superior power compared to existing conformal methods due to its ability to leverage asymmetric rules that exploit structural information. Finally, we have developed a novel theoretical framework that relies only on the pairwise exchangeability between and
under the null, which is much weaker than the joint exchangeability requirement stipulated in existing theories for conformal inference.
1.4 Organization
The article is organized as follows. Section 2 introduces the PLIS procedure for structured multiple testing and establishes its theoretical properties. Section 3 explores extensions of PLIS and its relationship to existing concepts. Section 4 presents simulation results to assess the numerical performance of PLIS and to compare it with existing methods. An illustration of the proposed method is provided in Section 5 through an application. The supplementary material contains proofs, extensions and additional numerical results.
2 Structured Multiple Testing: Conformal Inference with Asymmetric Rules
In this section, we first present the structured probabilistic model (Section 2.1) and the corresponding problem formulation (Section 2.2). Next, we introduce the PLIS procedure (Section 2.3) and establish its theoretical properties (Section 2.4). Concrete examples and guidelines are provided in Section 2.5 to illustrate the PLIS framework. Sections 2.6 and 2.7, respectively discuss the semi-supervised PLIS algorithm and the conformal q-value notion.
2.1 A Class of Structured Probabilistic Models
Consider a multiple testing problem with binary-valued unknown states that form a graph
. Let
be the number of nodes/hypotheses, where
indicates that node i is a null case, and
otherwise. Our study focuses on a class of structured probabilistic models (e.g., Goodfellow, Bengio, and Courville Citation2016), where the correlations between random variables
are captured by the interdependence structure between corresponding latent states
. The inference units may be conceptualized as the nodes of the graph, and the interdependence structures between test statistics are encoded as edges that connect the nodes. The observations
are conditionally independent given
, obeying
(2)
(2) where
and
are the null and non-null densities, respectively. Although the model assumes conditional independence, it still remains highly flexible, as we do not impose any distributional constraints on the unknown states
, and allow
to vary across different inference units. Conditional independence is closely related to the widely employed exchangeability assumption in the conformal inference literature (Schervish Citation2012; Barber et al. Citation2023). As established by de Finetti’s Theorem (Heath and Sudderth Citation1976; Diaconis and Freedman Citation1980; Durrett Citation2019), if a set of random elements is exchangeable, there must exist a latent
such that the random elements are iid conditional on
. For a more detailed and in-depth exploration of the generalization of model (2) and the exchangeability assumption, please refer to Section 2.6 and Section C of the supplementary material.
We make two assumptions without loss of generality: (a) ; and (b) a larger magnitude of
provides stronger evidence against the null hypothesis. In situations where the assumptions do not hold, we may transform
into z-values using the formula
, where
represents the cumulative distribution function (CDF) of
under the null, and
represents the CDF of a standard Gaussian variable.
We discuss several special cases of Model (2). First, we examine the scenario where the latent states are iid and the non-null densities
are identical (and hence denoted as
). Under this assumption, Model (2) reduces to Efron’s two-group model (Efron et al. Citation2001):
(3)
(3) where
is the proportion of non-null cases. While the independent case is not the primary focus of this work, it is worth noting that our proposed methodology remains applicable in this scenario. In Section 2.5, we present a tailored version of our proposal for Model (3), and discuss its connection to the AdaDetect procedure (Marandon et al. Citation2024).
When the latent states form a homogeneous binary Markov chain, a two-state hidden Markov model (HMM, Rabiner Citation1989) can be recovered from (2). HMMs have been extensively studied in the context of multiple testing (e.g., Sun and Cai 2009; Sesia, Sabatti, and Candès Citation2018; Perrot-Dockès et al. Citation2023). By properly accounting for the dependence between test statistics and leveraging the HMM structure, these methods can effectively control the FDR and provide more accurate inference. Section 2.5 presents a customized algorithm for HMMs based on our proposal and illustrates its superiority over existing methods.
The class of models in (2) also includes useful models such as the Ising model (Onsager Citation1944) and conditional random field model (Lafferty, McCallum, and Pereira Citation2001), which have been applied in multiple testing for climate change analysis and network analysis (Liang and Nettleton Citation2010; Shu, Nan, and Koeppe Citation2015; Liu, Zhang, and Page Citation2016; Rebafka, Roquain, and Villers Citation2022). In contrast to HMMs which assume homogeneous transition probabilities and identical emission probabilities, model (2) offers greater flexibility to accommodate deviations from these assumptions. Moreover, in contrast to the stationary hidden states model proposed by Wu (Citation2008), Model (2) allows the underlying process for to be nonstationary. As many real-world phenomena exhibit nonstationary behaviors, Model (2) is better equipped to provide a more accurate representation of the underlying dynamics.
2.2 Problem Formulation and Basic Setup
We consider a multiple testing problem that arises from Model (2), which can be complex in nature and difficult to learn accurately from data. The hypotheses of interest are for
. A key feature of the models in (2) is the exchangeability of null observations
, which remains true regardless of the model complexity. This important characteristic provides a strong foundation for conformal inference and has been widely assumed. If we make the additional assumption that our working model has learned a score function that is permutation-invariant, then we can properly define the conformal p-values in (1) for FDR analysis.
As previously indicated, we want to employ a score tailored specifically to index i. The score does not require permutation invariance regarding i. This attribute provides a substantial degree of flexibility, enabling the construction of powerful scores that can effectively leverage useful structural patterns. However, the violation of permutation invariance poses a significant challenge to the conformal inference framework, as the p-value is no longer super-uniform under the null. To address this issue, Section 2.3 develops a new framework that eliminates the need of defining p-values as required by existing methods.
In conformal inference, the calibration dataset, denoted as , plays a key role in assessing the relative significance of hypotheses. Various approaches can be employed to obtain the calibration data
. In the classical setting of multiple testing,
can be sampled from the known null distribution
. Conversely, in certain machine learning applications, such as the outlier detection problem,
may be sampled from a set of labeled null observations. For the present, we assume that the null distribution
is known. In Section 2.6, we turn to scenarios where
is unknown, yet labeled null samples are available.
Let denote the test score of unit i. The superscript X is used to distinguish
from the calibration score, denoted as
, which are computed based on the calibration data. Let
and
. In constructing the scores, it is crucial to guarantee the pairwise exchangeability between
and
for
. This important notion is rigorously defined in Section 2.4.
We denote the decision for test unit i as , where
signifies the rejection of
and
otherwise. Denote
. The false discovery proportion (FDP) and true discovery proportion (TDP) are respectively defined as
(4)
(4)
The (frequentist) FDR and average power (AP) can be defined accordingly: where the expectation operator is taken over the observed and calibration data while holding the hidden states
fixed. The objective is to develop a decision rule that effectively controls the FDR while maximizing the AP.
2.3 The PLIS Procedure for FDR Control
The conformity score that best captures structural patterns from probabilistic models (2) is , assuming perfect knowledge of the model structure. However, accurately estimating this score is challenging. To address this, we propose to compute a score through a user-specified working model that efficiently extracts structural information and predicts unknown states. Specifically, we choose a working model
and corresponding algorithm
to compute pseudo scores
, bearing in mind that the working model may deviate from the complex data-generating model.
To effectively leverage the structural information, the size of the calibration set needs to match that of the test set, ensuring that each test unit is paired with a corresponding calibration data point. Suppose the test and calibration data points have been paired and denoted as . In our methodology, the initial step involves constructing the baseline dataset, denoted as
, where
(5)
(5)
The construction of ensures that
depends equally on
and
, while satisfying the flipping-coin property, that is,
if
.
Remark 1
Any symmetric function satisfying can be employed to generate the baseline data
. However, our choice to use (5) enables us to retain data with large effect sizes, thereby preserving the structural patterns among the non-null cases. This is particularly advantageous for datasets that display local dependency structures. Section E.7 of the supplement shows that (5) leads to substantial power gain compared to alternative choices such as
.
We proceed to generate two parallel datasets and
by respectively substituting
and
for
in
. For example, if
is an ordered sequence
, then
. Next, we calculate the pseudo score
, referred to as the pseudo local index of significance (PLIS). The corresponding calibration score is given by
, applying the same working model
and computational algorithm
to the calibrated data
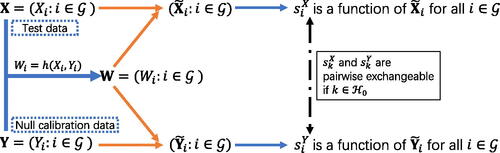
. visually illustrates the process of data generation and score computation, which guarantees the pairwise exchangeability between
and
, a key property that will be rigorously defined and established in Section 2.4.
Figure 1: A graphical illustration of constructing the baseline data and calculating the scores. To create and
, each
in
is replaced by
and
in turn, for
, with the values in remaining nodes unchanged. The same function
is used for computing
and
, ensuring that the two scores are pairwise exchangeable if
.
Suppose that a smaller value of indicates stronger evidence against the null hypothesis. Intuitively, the rejection of
requires two pieces of evidence: first,
must be sufficiently small, and second,
should be smaller than its null counterpart
. Therefore, we only select small
from the candidate rejection set
. Consider a class of thresholding rules
, where
for
, and
for
. Correspondingly, we introduce the calibration set
, which mirrors
. This mirror set of null scores
allows us to characterize the joint behavior of their counterparts
under the null. It follows that the true FDP process and its mirror process, denoted
, are respectively given by
(6)
(6)
To gain a better understanding of our methodology, it is helpful to note that provides a conservative estimate of
. This conservativeness arises from two factors: (a)
is always greater than or equal to
; and (b)
can be seen as a mirror process that resembles the unobserved process
since, as will be established in the next section (Property 3),
and
are pairwise exchangeable for
. We choose the largest threshold, denoted as
, such that the conservative estimate of the FDP falls below
:
The proposed PLIS procedure, summarized in Algorithm 1, rejects if
. By mathematical conventions, the supremum of an empty set is defined as
. Therefore, if the set
is empty, then
is set to
, and Algorithm 1 does not reject any hypotheses.
Algorithm 1
The PLIS procedure
Input: The observations , the null distribution
, a pre-specified FDR level
, a working model
and a computational algorithm
.
Output: A decision rule .
1: Generate , where
are iid observations from
.
2: Create , where
and
is given by (5). Construct
and
by respectively substituting
and
in place of
in
for
.
3: Calculate and
for
with the user-specified working model
and algorithm
. Let
.
4: Let , where
is defined in (2.3).
5: Let for
, otherwise
.
6: Return .
We conclude this section with several remarks. First, in order to ensure pairwise exchangeability between and
under the null, it is crucial to estimate the working model
from
before calculating the conformity scores. Detailed explanations and practical guidelines for the deployment of PLIS under two widely-used working models can be found in Section 2.5. Second, we can define an alternative estimate of
, denoted as
, by substituting
in place of both
and
in (2.3). However, employing
tends to be overly conservative; further elaborations on this are provided in Sections 3.3. Third, Algorithm 1 closely resembles the operation of the conformal BH, albeit with several modifications. Finally, as revealed by an insightful reviewer,
in (2.3) is closely related to the Selective SeqStep + algorithm (Barber and Candès Citation2015). Further discussions on these connections can be found in Section D of the supplement.
2.4 Theory
We start by establishing several exchangeability properties, first for the data points and subsequently for the conformity scores. The random elements are said to be (jointly) exchangeable if the distribution of
is the same as that of
for any permutation
of the indices
. We write
where
denotes equality in distribution. We will soon introduce a weaker notion, the pairwise exchangeability, which is more relevant to our theory. The following exchangeability properties are proven in Section A of the supplement.
The first property can be easily deduced from the definition of Model (2) and the construction of outlined in Algorithm 1.
Property 1 (Exchangeability and conditional independence between data points)
Suppose are observations from Model (2), and
are randomly drawn from the null distribution
. Then we have: (a) The random variables
are jointly exchangeable conditional on
; (b)
are conditionally independent given
and
; (c) For
,
and
are pairwise exchangeable conditional on
and
, that is,
The next property characterizes the pairwise exchangeability between and
.
Property 2 (Pairwise exchangeability and conditional independence between datasets)
Consider and
as generated according to Algorithm 1. Then we have: (a)
are conditionally independent given
and
; (b) For
,
and
are pairwise exchangeable, that is
.
The next property is concerned with the conditional independence and pairwise exchangeability between null scores.
Property 3 (Pairwise exchangeability and conditional independence between scores)
Consider scores and
computed according to Algorithm 1, denote
for
. Then we have: (a)
are conditionally independent given
and
; (b) Denote
. For
,
and
are pairwise exchangeable given
and
:
(7)
(7)
The pairwise exchangeability (7), which is crucial in proving the FDR theory for PLIS, is a weaker assumption than the joint exchangeability among all null scores required in most existing conformal methods. Now we state our main theorem that establishes the validity of PLIS for controlling the FDR.
Theorem 1
. Consider Model (2) and the PLIS procedure outlined in Algorithm 1. Then Properties 1–3 hold and PLIS controls the FDR at level .
Our approach sets itself apart from current theories in conformal inference that rely on joint exchangeability (Yang et al. Citation2021; Mary and Roquain Citation2022; Bates et al. Citation2023; Marandon et al. Citation2024). In contrast, we introduce a framework that uses only pairwise exchangeability and establishes our theory grounded in the Selective SeqStep + algorithm (Barber and Candès Citation2015).
2.5 Practical Guidelines and Examples
PLIS uses resampling techniques to generate a mirror process that quantifies the FDP in multiple testing. At its core, PLIS can be situated within the conformal inference framework, which facilitates the development of valid FDR rules that exhibit enhanced robustness to model misspecification. This section presents examples that contextualize PLIS as a valuable tool for “conformalizing” some well-known FDR procedures, producing inferences that possess similar operational characteristics as state-of-the-art conformal methods (Yang et al. Citation2021; Bates et al. Citation2023; Marandon et al. Citation2024; Liang, Sesia, and Sun Citation2024).
Example 1
(Conformalizing the LIS procedure under HMMs)
A variety of real-world applications involve data with HMM-type structures. Several works (Sun and Cai 2009; Perrot-Dockès et al. Citation2023) have demonstrated that exploiting the HMM structure can greatly enhance the power of FDR analysis. However, their theoretical analysis necessitates certain conditions to be satisfied, such as homogeneous transition probabilities and identical non-null distributions, which may not be strictly met in practical scenarios. The HMMs are characterized by a set of parameters, denoted as , where
is the transition probability matrix, and
and
are the emission densities for the null and non-null observations, respectively.
In our setup, we use as the HMM working model, where
is estimated using the EM algorithm on
. To implement the PLIS procedure, we use the forward-backward algorithm, denoted by
, to compute the scores
and
for
. The decision-making process is based on Algorithm 1. The PLIS procedure can be regarded as a conformalized adaptation of the LIS procedure proposed by Sun and Cai (2009), computed using
and algorithm
. PLIS differs from LIS in that it can handle a variety of data structures that deviate from HMMs. This ability ensures valid FDR control in finite-samples, even when the working model is misspecified or the model parameters are estimated poorly.
Example 2
(Conformalizing the adaptive z-value procedure under the two-group model (3) with independent observations). In the context where observations are assumed to be independent and Efron’s two-group model (3), denoted , is adopted, Sun and Cai (Citation2007) showed that the density ratio (DR)
or the local false discovery rate
serves as the optimal building block for FDR analysis. The PLIS framework treats DR and Lfdr equivalently since
is a constant across all study units and only the relative ranking contributes to the operation of PLIS. Using the working model
, the conformity score
can be taken as the DR function
, where
is known, and
is the standard kernel density estimator constructed based on
. The PLIS procedure operates by employing
and
in Algorithm 1. As carefully explained in Section D.7 of the supplement, although DR is permutation-invariant with respect to
, the null scores are not jointly exchangeable. Nevertheless, PLIS still works since
are pairwise exchangeable given
and
.
Sun and Cai (Citation2007) proposed a class of adaptive z-value (AZ) procedures, and showed that AZ outperforms p-value based methods by adapting to the shape of the alternative distribution. PLIS may be viewed as a conformalized adaptation of AZ, which effectively incorporates the structural information into inference while controlling the FDR in finite samples. This represents a notable advantage over the AZ procedure, which only ensures asymptotic FDR control. We note that the AdaDetect method (Marandon et al. Citation2024), which also uses the two-group model to estimate a permutation-invariant score function, exhibits similar advantages to PLIS. However, when encountering score functions that lack permutation-invariance, particularly when using the HMM as the working model, PLIS significantly deviates from AdaDetect.
Our customized PLIS procedures remain valid as long as the underlying model belongs to the broad class (2), regardless of the working models or algorithms used. Developing conformity scores using sensible models and computational algorithms is essential for improving the practicality and effectiveness of PLIS. Finally, instances of numerical issues such as significant reductions in power and convergence failures frequently serve as warnings for practitioners, highlighting the unsuitability of the current model for the specific application and emphasizing the need for a new working model.
2.6 Semi-Supervised PLIS
This section considers the scenario in which the null distribution is unknown, and users only have access to n labeled null data points drawn from that distribution. The objective is to assess whether new data points
follow the same unknown distribution as the reference dataset
. This scenario is known as the semi-supervised multiple testing problem (Mary and Roquain Citation2022), or the outlier detection problem in the conformal inference literature (Bates et al. Citation2023; Marandon et al. Citation2024). We introduce a semi-supervised PLIS (Algorithm 2) to solve this problem.
The algorithm first partitions the labeled null data into two subsets: the calibration set
and the training set
. The test data
and calibration data
are then used to construct the baseline data
by following the same steps in Algorithm 1. We move on to the estimation issue. In the case of an HMM, an estimator for the emission distribution
can be learned from the labeled null data
. Subsequently, we use the baseline data
to estimate
and transition probabilities via the EM algorithm, and then calculate the conformity scores via the forward-backward procedure. If the working model is a two-group model, the conformity scores correspond to the density ratios, which can be estimated using both
and
via the positive unlabeled (PU) learning algorithms. This approach has also been suggested by Marandon et al. (Citation2024). The above steps are summarized in Algorithm 2.
Algorithm 2
The semi-supervised PLIS procedure
Input: The test data , the null samples
, a pre-specified FDR level
, a working model
and a computational algorithm
.
Output: A decision rule .
1: Split into the calibration data
and the training data
.
2: Create , where
and
is given by (5). Construct
and
by respectively substituting
and
in place of
in
for
.
3: Calculate and
for
with the user-specified working model
and algorithm
based on
and
.
4: Let , where
is defined in (2.3).
5: Let for
, otherwise
.
6: Return .
Remark 2
Here we have assigned exactly one null data point to each test unit, but in situations where there is an abundance of null samples, it may be appropriate to employ the de-randomization idea in Section 3.2 to improve stability. In situations where the size of the null dataset is smaller than m, one may conduct an independent screening procedure to narrow down the focus before using PLIS on a smaller subset of hypotheses. These represent interesting issues for future investigation.
The next theorem, established using de Finetti’s theorem (see Section C in the supplement) and techniques employed in proving Properties 1–3, generalizes Theorem 1 in two ways. First, it considers the semi-supervised setup, where we have access to labeled null data instead of explicit knowledge of the null distribution. Second, it relaxes the assumption of conditional independence given in Model (2) by allowing for (exchangeable) correlated noise in the data generation process.
Theorem 2
Consider Algorithm 2, if the null data are exchangeable conditional on the non-null data
and the true states, then (a) for
,
and
are pairwise exchangeable, satisfying (7); (b) Algorithm 2 controls FDR at
.
In Section E.4 of the supplement, we provide numerical results to corroborate Theorem 2 by considering the semi-supervised setup in which correlated noises are introduced to the observations generated from Model (2).
2.7 Conformal q-values
When the joint exchangeability condition fails to hold, conformal p-values can no longer be properly defined. To address this issue, we introduce the concept of conformal q-value as a significance index to measure the risk associated with individual decisions.
We begin by examining in (2.3), which offers a conservative estimate of the FDP. Consider the minimum FDR level
at which
can be “just” rejected:
(8)
(8)
The adjusted is referred to as the conformal q-value corresponding to
, owing to its resemblance to the q-value idea introduced by Storey (Citation2003). While Storey’s q-value is constructed based on the empirical distribution of p-values, our conformal q-value is derived from a resampling method and a carefully designed mirror process.
The conformal q-value is a valid and user-friendly significance index that provides clear interpretability for individual decisions, and practitioners can directly use it for decision-making by comparing them with a pre-specified . Theorem 1 and Proposition 1 below together establish the validity of using the conformal q-value (8) in FDR analysis.
Proposition 1
Consider the PLIS procedure as outlined in Algorithm 1 and the conformal q-value defined by (8). Then the decision presented in Algorithm 1 is equivalent to rejecting
if
.
3 Connections to Existing Works and Extensions
In this section, we first establish the connection between PLIS and the e-BH method (Section 3.1), then introduce several ensuing extensions: derandomized PLIS (Section 3.2), as well as and
(Sections 3.3). Finally, we discuss the distinctions of PLIS from related works (Section 3.4).
3.1 Connection to the e-BH Procedure
In hypothesis testing, an e-value (Vovk and Wang Citation2021) is defined as the observed value of a nonnegative random variable E that satisfies the condition under the null hypothesis. E-values can be constructed using betting scores (Shafer Citation2021), likelihood ratios, and stopped super-martingales (Grünwald, de Heide, and Koolen Citation2020). This section demonstrates how the PLIS framework can be used to construct robust and powerful e-values.
Let be the e-values for testing
. Wang and Ramdas (Citation2022) proposed the e-BH procedure, which involves first ordering the e-values as
, and then choosing a cutoff along the ranking using the following step-wise algorithm. Let
, then reject hypotheses in the set
. We call
a set of generalized e-values if
(9)
(9)
Condition (9) is strictly weaker than the condition that for all
. Wang and Ramdas (Citation2022) proved that if
are a set of generalized e-values, then the e-BH procedure controls FDR at
under arbitrary dependence. We can construct a set of generalized e-values based on the PLIS framework. Specifically, define
(10)
(10) where
,
and
are defined by Algorithm 1. The following theorem can be proved using similar techniques for proving Theorem 1.
Theorem 3
The variables defined in (10) constitute a set of generalized e-values.
The following proposition demonstrates that the PLIS procedure is equivalent to implementing the e-BH procedure with generalized e-values as defined by (10). The connection to e-BH offers valuable insights into our theory, providing a new perspective on why PLIS performs robustly in the face of general dependence and model misspecification.
Proposition 2
If we implement the e-BH procedure with e-values in (10), then the rejection set , where
is the set of rejected hypotheses by Algorithm 1.
3.2 Derandomized PLIS
While the PLIS framework employs resampling methods, which can introduce additional uncertainties and may be viewed as undesirable by practitioners, the fact that the average of e-values is still an e-value (Vovk and Wang Citation2021) offers motivation to consider a principled derandomization method. This involves aggregating multiple random samples to reduce variability. Similar ideas have been used in contemporaneous works, including Ren and Barber (Citation2023) and Bashari et al. (Citation2023).
The derandomized PLIS procedure involves running the PLIS procedure repeatedly for N times and averaging the results for decision-making. Specifically, for the kth replication, , we generate
, and construct
and
by respectively substituting
and
in place of
in
, where
is created by combining
and
via (5). We then compute the scores
and threshold
based on Algorithm 1. The corresponding e-values
for replication k can be calculated using (10). This process is repeated for
. Finally, we average the individual e-values
to compute the summary e-values
for all
, and apply the e-BH procedure with
. The proposed derandomized PLIS procedure is summarized in Algorithm 3. The theoretical FDR control of derandomized PLIS follows from the validity of the e-BH procedure and Theorem 3.
Remark 3
Algorithm 3 has allowed different replications to have varied . As noted by Ren and Barber (Citation2023), derandomization could lead to higher power if the e-values are carefully aggregated through powerful weighting schemes. We have investigated this issue with some preliminary results provided in Section E.6 in the supplement. The development of optimal weights is an interesting direction for future research.
Algorithm 3
The Derandomized PLIS procedure
Input: Observations , the null distribution
, working model
, algorithm
, number of replications N, weights
, nominal FDR level
.
Output: Decisions .
1: for all do
2: Generate . Denote
.
3: Create by combining
and
via (5). Construct
and
by respectively substituting
and
in place of
in
for
.
4: Calculate and
for
with user-specified working model
and algorithm
. Let
,
, and
,
.
5: Let and
.
6: Calculate for
, otherwise
.
7: end for
8: Let for
. Denote the ordered statistics by
. Let
.
9: Let for
.
Return
3.3 Comparison with Conformal and Knockoff Methods
PLIS is developed based on the principles of conformal inference, which involve the utilization of machine learning algorithms to calculate conformity scores and the use of calibration data to quantify uncertainties in decision-making. Inspired by an insightful comment from a reviewer, Section D.4 of the supplement shows that the mirror process (2.3), originally adapted from the conformal BH algorithm (see Section D.3), falls into the class of Selective SeqStep + algorithms (Barber and Candès Citation2015). Our innovative construction of baseline data , development of pairwise exchangeable scores, and utilization of the new mirror process offer several enhancements to existing conformal methods, enabling the extension of the knockoff framework beyond regression settings (Barber and Candès Citation2015; Candès et al. Citation2018; Ren and Candès Citation2023).
This section explores two variations of PLIS, emphasizing its connection to existing works and providing insights into its advantages.
The first variation replaces both and
with
in Algorithm 1. This variation, denoted as
, essentially involves applying the conformal BH algorithm (Mary and Roquain Citation2022; Bates et al. Citation2023) to the conformity scores
generated by Algorithm 1. However, implementing the conformal BH algorithm with pairwise exchangeable scores may result in overly conservative FDR levels. Additionally, using the adaptive BH algorithm (Bates et al. Citation2023; Marandon et al. Citation2024) to overcome this conservativeness is inappropriate, as conformal p-values computed from pairwise exchangeable scores do not satisfy the super-uniformity and PRDS conditions.
The second variation involves applying symmetrization techniques, which have shown success in regression contexts (Barber and Candès Citation2015; Candès et al. Citation2018; Ren and Candès Citation2023; Du et al. Citation2023). Its key challenge lies in identifying efffective anti-symmetric functions that fulfill to transform pairwise exchangeable scores into symmetrized test statistics. In Section D.4 of the supplement, we demonstrate that the mirror process (2.3) corresponds to using the Selective SeqStep + algorithm proposed by Barber and Candès (Citation2015) with a carefully designed anti-symmetric function. To underscore the significance of the symmetrization process, we consider a popular choice of anti-symmetric function
, as suggested in Candès et al. (Citation2018) and their later works. This approach, labeled as
, rejects
if
, where
is determined by the following FDP process:
However, using
may lead to information loss because the contrast has a tendency to cancel out the inherent clustering structure among non-null effects.
Section E.8 presents numerical results that illustrate the advantages of PLIS over its two variations and
.
3.4 Comparison with Covariate-Adaptive Methods
Structured multiple testing is a subject of extensive research that has attracted significant interest. Our PLIS procedure distinguishes itself from existing covariate-adaptive methods in several aspects. First, in the works of Lei and Fithian (Citation2018), Ignatiadis and Huber (Citation2021) and Ren and Candès (Citation2023), the structural information is represented by a covariate sequence and is incorporated through techniques such as weighted p-values or covariate-adaptive thresholds. By contrast, our approach leverages structural knowledge about the underlying data generation process and integrates it into inference via a user-specified working model. Second, the theory in existing methods is developed based on group-wise cross-weighting (Ignatiadis and Huber Citation2021) or covariate modulation through data masking (Lei and Fithian Citation2018; Ren and Candès Citation2023). In contrast, PLIS operates within the theoretical framework of conformal inference, harnessing the flexibility of machine learning algorithms to learn powerful conformity scores, with associated decision risk being assessed by employing carefully calibrated null scores. Thus, PLIS not only facilitates the effective incorporation of structural information but also guarantees the validity of inference, even in scenarios where the machine learning models are mis-specified. Finally, PLIS offers an intuitive, fast, and user-friendly computational algorithm that efficiently computes scores from the baseline data. This differs from the more computationally intensive algorithms proposed in Lei and Fithian (Citation2018) and Ren and Candès (Citation2023), which involve intricate techniques such as adaptive unmasking and boundary updating.
4 Simulation
This section presents simulation results that compare PLIS, which is implemented as described in the examples of Section 2.5, with several competing methods. For all of the numerical experiments, we set and
. The observations are generated following this model:
. The latent states
obey various dependence structures in different experiments. The following methods are considered in our analysis: (a)
Footnote2 implemented via Algorithm 1, using the working model
as described in Section 2.5; (b) BH (Benjamini and Hochberg Citation1995); (c) AdaDetect (Marandon et al. Citation2024), where the density ratio is estimated by
, with
being known and
being the standard kernel estimator based on
. (d)
, implemented via Algorithm 1 using the working model
as described in Section 2.5. (e) AdaPT (Lei and Fithian Citation2018), implemented using the R package adaptMT. Throughout all the simulations conducted, the FDR and Average Power (AP) levels are computed by averaging the results obtained from 200 replications.
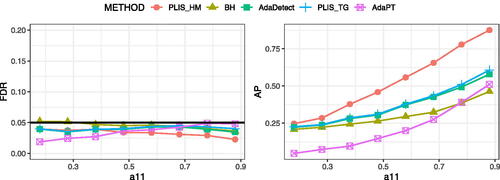
4.1 Comparisons with Symmetric Rules
We first consider HMMs in which is a binary Markov chain with transition matrix
. Here, we fix
, and the initial state of the latent chain is set to be
.
We apply BH, AdaDetect, AdaPT, , and
to the simulated data, and summarize the results in . Our results demonstrate that all of the methods under consideration effectively control the FDR at the nominal level. Both the
and AdaDetect exhibit similar performance and outperform BH in terms of power. Notably,
exhibits the highest power among all five methods in most scenarios. This can be attributed to the use of asymmetric rules in
. AdaPT outperforms/underperforms BH when
becomes large/small. Additional simulation results for HMMs are presented in Section E.2 of the supplement.
Figure 2: The comparison of FDR and AP for HMMs with and varying
.
4.2 Comparisons beyond HMMs
This section examines the case where the true transition matrices change over time, which is commonly referred to as a heterogeneous HMM. Such models are particularly useful since the structure of real-world data is often nonstationary. Specifically, we define as the transition probability matrix for the kth transition, where
, and
is fixed for all k. The conditional distributions remain the same as in the preceding simulations. We consider a scenario in which
decreases with k exponentially. This decreasing trend indicates that the stochastic system will gradually stabilize over time, with outliers becoming increasingly rare within the clusters. Since the data in this scenario possess a complex structure, accurately modeling them can be challenging. However, these data do exhibit patterns resembling HMMs, with moderate deviations from homogeneity conditions. Hence, we adopt a homogeneous HMM as a working model to capture the underlying structural patterns in the data and subsequently use the PLIS framework for inference. To assess the performance of PLIS and to compare it with other methods, specifically BH, AdaDetect, and AdaPT, we vary the parameter
from 2.2 to 3.2 and apply these methods to simulated data. The results are summarized in .
Figure 3: FDR and AP comparison for the heterogeneous HMM with exponentially vanishing .
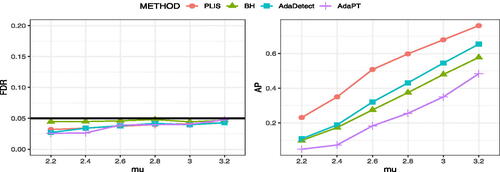
Our results demonstrate that all methods are effective in controlling the FDR, with PLIS exhibiting higher average power compared to other methods. This highlights the effectiveness of PLIS in leveraging structural information, even when wrong models and algorithms are employed. Additionally, our analysis of more general data structures, such as two-layer dynamic models and structured models generated from a renewal process, demonstrates that PLIS remains more powerful than the other methods in most cases (see Figures 8–12 in Section E of the supplement). These findings underscore the versatility and robustness of PLIS in a variety of settings, suggesting its considerable potential for analyzing complex data structures in practice.
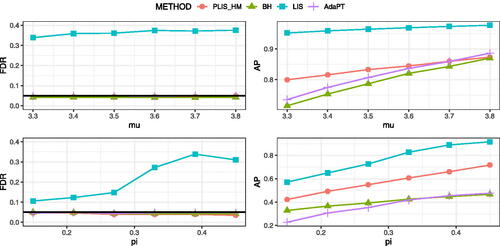
4.3 Comparisons Under a Covariate-Adaptive Model
Let denote the covariates that encode side information. Consider a covariate-adaptive model that can be described using a hierarchical approach:
where
represents the local sparsity level. An equivalent model, motivated from an empirical Bayes perspective, is given by
Let for
and fix
. We consider the following scenarios: (i)
;
for
, and
otherwise; (ii)
;
for
,
for
, and
otherwise. Hence, the external covariate
captures the local dependence structure, with
and
exhibiting similar values when
values are comparable.
We apply PLIS (employing the HMM as its working model), LIS (Sun and Cai 2009; using the HMM as its underlying true model), BH and AdaPT (Lei and Fithian Citation2018; using the R package adaptMT with as its covariate sequence) at FDR level
. The results are presented in . The following patterns can be observed. First, AdaPT demonstrates increased efficiency as
becomes more informative and may outperform both BH and PLIS in certain settings. Second, LIS, which mistakenly assumes that the data are generated from an HMM, suffers from severe FDR inflation. In contrast, PLIS, despite using the same EM algorithm as LIS, remains effective in FDR control even when the true model significantly diverges from the working model.
Figure 4: FDR and AP comparison under covariate-adaptive models.
5 Application
The identification of eye states has wide-ranging applications across various fields. By monitoring changes in eye states, such as eyelid closures and eye movements, systems can alert drivers when they exhibit signs of drowsiness, thereby preventing potential accidents. In mental health diagnosis, analyzing eye states can offer valuable insights into conditions such as schizophrenia or autism spectrum disorder. Eye state information can also effectively improve facial recognition performance and human–computer interactions.
This section illustrates semi-supervised PLIS for outlier detection using the Electroencephalogram (EEG) Eye State dataset, which is accessible at the UCI Machine Learning Repository (https://archive.ics.uci.edu). By conceptualizing the eye state sequence in a visual task as a Markovian process, the HMM provides a useful tool for modeling eye movement patterns, primarily due to its ability in capturing temporal dependencies within nearby latent states. In recent works such as Chuk et al. (Citation2020) and Hsiao et al. (Citation2022), it is shown that HMMs can effectively represent the dynamic characteristics of eye movement behaviors during a range of cognitive activities, offering valuable insights into the interplay between eye movement patterns and individual differences in cognitive styles or abilities. Furthermore, these studies indicate that the HMM is an appropriate model for describing the local dependence structure within eye states.
During the data preparation process, the eye states of one individual were continuously recorded in chronological order, with detections and manual labeling denoted as 0/1 to signify the eye-open/eye-closed states. The analysis uses data collected from an experiment focusing on measuring the Frontal left Hemisphere (F7). The primary goal is to pinpoint any eye-closed states (outliers) within a sequence of 1500 consecutive records (test samples). After collecting the test dataset, the remaining samples of this measurement with label “0” serve as the null samples. Concretely, we set aside the test samples and proceeded to generate the calibration samples (consisting of 1500 data points) and training samples by splitting the remaining data points with a label of “0”. Subsequently, we applied semi-supervised/conformal multiple testing methods, employing the null samples in both training and calibrating stages. The training data is also used to evaluate the null distribution and calculate p-values when implementing BH and AdaPT.
For the anomaly detection task, we implement various methods at the nominal FDR level of 0.05. The methods being considered include BH, AdaPT, AdaDetect, as well as the proposed semi-supervised PLIS (Algorithm 2) with two distinct working models: the HMM and Efron’s two-group model, respectively denoted as and
. The counts of discovered outliers and corresponding FDPs, computed based on the true labels of test samples and presented in parentheses, are provided for each method below:
: 69 (0.014), AdaPT: 38 (0), AdaDetect/
: 37 (0.054), and BH: 12 (0.083). Notably, the detected outliers are identical for AdaDetect and
, corroborating the concluding remark in Example 2 of Section 2.5 regarding the similarity of AdaDetect and
when employing Efron’s two-group model as the working model.
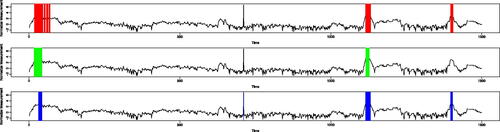
To further examine the comparison results, we visualize the outliers identified by , AdaPT, and AdaDetect in . The following patterns can be observed. First, AdaPT shows notable efficacy in detecting large outlier clusters compared to AdaDetect, which may be attributed to its successful integration of structural patterns, as encoded in the external covariate “Time”, in the decision-making process. Second, AdaPT exhibits reduced sensitivity in cases involving smaller clusters, leading to the omission of the final segment where structural information is relatively weak. Third, AdaDetect seems to demonstrate superior effectiveness in identifying isolated outliers. However, it turns out that the discovery at the single location of 711 is indeed a false positive, with the true label being “0”. This aligns with our intuition: if a person closes the eyes, the closed state will persist for a certain period of time. Conversely, by leveraging the structural information,
and AdaPT successfully filter out this seemingly plausible signal. Finally,
outperforms both AdaPT and AdaDetect by detecting the highest number of outliers while keeping the FDP well below the nominal level. This is made possible through the utilization of the HMM working model, which effectively exploits the informative structures within the data.
Figure 5: The discoveries of (red, top), AdaPT (green, middle) and AdaDetect (blue, bottom) in detecting eye-closed states in 1500 consecutive records according to F7 measurements.
Supplementary Materials
The supplement contains the proofs of theorems and propositions, some extensions of the proposed PLIS procedure, a comparative review of PLIS and related methods, and additional numerical results.
8._Supplementary_Materials-PLIS__2_.zip
Download Zip (486.9 KB)Acknowledgments
The authors thank the associate editor and two referees for their valuable comments, which have greatly enhanced the article. The comment from an insightful referee on the Selective SeqStep + algorithm and anti-symmetric functions has contributed significantly to enhance our understanding of related works.
Disclosure Statement
No potential conflict of interest was reported by the author(s).
Notes
1 have the positive regression dependency on each subset (PRDS) property on
if
is nondecreasing in u for any
and any nondecreasing set
.
2 In subsequent simulations, is referred to as PLIS if
is not involved.
References
- Barber, R. F., and Candès, R. J. (2015), “Controlling the False Discovery Rate via Knockoffs,” The Annals of Statistics, 43, 2055–2085. DOI: 10.1214/15-AOS1337.
- Barber, R. F., Candes, E. J., Ramdas, A., and Tibshirani, R. J. (2023), “De finetti’s Theorem and Related Results for Infinite Weighted Exchangeable Sequences,” arXiv preprint arXiv:2304.03927.
- Bashari, M., Epstein, A., Romano, Y., and Sesia, M. (2023), “Derandomized Novelty Detection with FDR Control via Conformal e-values,” arXiv preprint arXiv:2302.07294.
- Bates, S., Candès, E., Lei, L., Romano, Y., and Sesia, M. (2023), “Testing for Outliers with Conformal p-values,” The Annals of Statistics, 51, 149–178. DOI: 10.1214/22-AOS2244.
- Benjamini, Y., and Heller, R. (2007), “False Discovery Rates for Spatial Signals,” Journal of the American Statistical Association, 102, 1272–1281. DOI: 10.1198/016214507000000941.
- Benjamini, Y., and Hochberg, Y. (1995), “Controlling the False Discovery Rate: A Practical and Powerful Approach to Multiple Testing,” Journal of the Royal Statistical Society, Series B, 57, 289–300. DOI: 10.1111/j.2517-6161.1995.tb02031.x.
- Benjamini, Y., and Yekutieli, D. (2001), “The Control of the False Discovery Rate in Multiple Testing Under Dependency,” The Annals of Statistics, 29, 1165–1188. DOI: 10.1214/aos/1013699998.
- Candès, E., Fan, Y., Janson, L., and Lv, J. (2018), “Panning for Gold: ‘Model-x’ Knockoffs for High Dimensional Controlled Variable Selection,” Journal of the Royal Statistical Society, Series B, 80, 551–577. DOI: 10.1111/rssb.12265.
- Chuk, T., Chan, A. B., Shimojo, S., and Hsiao, J. H. (2020), “Eye Movement Analysis with Switching Hidden Markov Models,” Behavior Research Methods, 52, 1026–1043. DOI: 10.3758/s13428-019-01298-y.
- Copas, J. B. (1974), “On Symmetric Compound Decision Rules for Dichotomies,” Annals of Statistics, 2, 199–204.
- Diaconis, P., and Freedman, D. (1980), “Finite Exchangeable Sequences,” The Annals of Probability, 8, 745–764. DOI: 10.1214/aop/1176994663.
- Du, L., Guo, X., Sun, W., and Zou, C. (2023), “False Discovery Rate Control Under General Dependence by Symmetrized Data Aggregation,” Journal of the American Statistical Association, 118, 607–621. DOI: 10.1080/01621459.2021.1945459.
- Durrett, R. (2019), Probability: Theory and Examples (Vol. 49), Cambridge: Cambridge University Press.
- Efron, B., Tibshirani, R., Storey, J. D., and Tusher, V. (2001), “Empirical Bayes Analysis of a Microarray Experiment,” Journal of the American Statistical Association, 96, 1151–1160. DOI: 10.1198/016214501753382129.
- Fan, J., Han, X., and Gu, W. (2012), “Estimating False Discovery Proportion Under Arbitrary Covariance Dependence,” Journal of the American Statistical Association, 107, 1019–1035. DOI: 10.1080/01621459.2012.720478.
- Goodfellow, I., Bengio, Y., and Courville, A. (2016), Deep Learning, Cambridge, MA: MIT Press. http://www.deeplearningbook.org.
- Grünwald, P., de Heide, R., and Koolen, W. M. (2020), “Safe Testing,” in 2020 Information Theory and Applications Workshop (ITA), pp. 1–54. IEEE. DOI: 10.1109/ITA50056.2020.9244948.
- Heath, D., and Sudderth, W. (1976), “De Finetti’s Theorem on Exchangeable Variables,” The American Statistician, 30, 188–189. DOI: 10.1080/00031305.1976.10479175.
- Hsiao, J. H., An, J., Hui, V. K. S., Zheng, Y., and Chan, A. B. (2022), “Understanding the Role of Eye Movement Consistency in Face Recognition and Autism through Integrating Deep Neural Networks and Hidden Markov Models,” npj Science of Learning, 7, 1–12. DOI: 10.1038/s41539-022-00139-6.
- Ignatiadis, N., and Huber, W. (2021), “Covariate Powered Cross-Weighted Multiple Testing,” Journal of the Royal Statistical Society, Series B, 83, 720–751. DOI: 10.1111/rssb.12411.
- Lafferty, J. D., McCallum, A., and Pereira, F. C. N. (2001), “Conditional Random Fields: Probabilistic Models for Segmenting and Labeling Sequence Data,” in Proceedings of the Eighteenth International Conference on Machine Learning, ICML ’01, San Francisco, CA, USA, pp. 282–289. Morgan Kaufmann Publishers Inc.
- Lei, L., and Fithian, W. (2018), “AdaPT: An Interactive Procedure for Multiple Testing with Side Information,” Journal of the Royal Statistical Society, Series B, 80, 649–679. DOI: 10.1111/rssb.12274.
- Liang, K., and Nettleton, D. (2010), “A Hidden Markov Model Approach to Testing Multiple Hypotheses on a Tree-Transformed Gene Ontology Graph,” Journal of the American Statistical Association, 105, 1444–1454. DOI: 10.1198/jasa.2010.tm10195.
- Liang, Z., Sesia, M., and Sun, W. (2024), “Integrative Conformal p-values for Out-of-Distribution Testing with Labelled Outliers,” Journal of the Royal Statistical Society, Series B, 1–25. DOI: 10.1093/jrsssb/qkad138.
- Liu, J., Zhang, C., and Page, D. (2016), “Multiple Testing Under Dependence via Graphical Models,” The Annals of Applied Statistics, 10, 1699–1724. DOI: 10.1214/16-AOAS956.
- Marandon, A., Lei, L., Mary, D., and Roquain, E. (2024), “Adaptive Novelty Detection with False Discovery Rate Guarantee,” The Annals of Statistics, 52, 157–183. DOI: 10.1214/23-AOS2338.
- Mary, D., and Roquain, E. (2022), “Semi-Supervised Multiple Testing,” Electronic Journal of Statistics, 16, 4926–4981. DOI: 10.1214/22-EJS2050.
- Onsager, L. (1944), “Crystal Statistics. I. A Two-Dimensional Model with an Order-Disorder Transition,” Physical Review, 65, 117–149. DOI: 10.1103/PhysRev.65.117.
- Perrot-Dockès, M., Blanchard, G., Neuvial, P., and Roquain, E. (2023), “Post Hoc False Discovery Proportion Inference Under a Hidden Markov Model,” TEST, 32, 1365–1391. DOI: 10.1007/s11749-023-00886-7.
- Rabiner, L. (1989), “A Tutorial on Hidden Markov Models and Selected Applications in Speech Recognition,” Proceedings of the IEEE, 77, 257–286. DOI: 10.1109/5.18626.
- Rebafka, T., Roquain, É., and Villers, F. (2022), “Powerful Multiple Testing of Paired Null Hypotheses Using a Latent Graph Model,” Electronic Journal of Statistics, 16, 2796–2858. DOI: 10.1214/22-EJS2012.
- Ren, Z., and Barber, R. F. (2023), “Derandomized Knockoffs: Leveraging e-Values for False Discovery Rate Control,” Journal of the Royal Statistical Society Series B: Statistical Methodology, 86, 122–154. DOI: 10.1093/jrsssb/qkad085.
- Ren, Z., and Candès, E. (2023), “Knockoffs with Side Information,” The Annals of Applied Statistics, 17, 1152–1174. DOI: 10.1214/22-AOAS1663.
- Sarkar, S. K. (2002), “Some Results on False Discovery Rate in Stepwise Multiple Testing Procedures,” The Annals of Statistics, 30, 239–257. DOI: 10.1214/aos/1015362192.
- Schervish, M. J. (2012), Theory of Statistics, New York: Springer.
- Sesia, M., Sabatti, C., and Candès, E. J. (2018), “Gene Hunting with Hidden Markov Model Knockoffs,” Biometrika, 106, 1–18. DOI: 10.1093/biomet/asy033.
- Shafer, G. (2021), “Testing by Betting: A Strategy for Statistical and Scientific Communication,” Journal of the Royal Statistical Society, Series A, 184, 407–431. DOI: 10.1111/rssa.12647.
- Shu, H., Nan, B., and Koeppe, R. (2015), “Multiple Testing for Neuroimaging via Hidden Markov Random Field,” Biometrics, 71, 741–750. DOI: 10.1111/biom.12329.
- Storey, J. D. (2003), “The Positive False Discovery Rate: A Bayesian Interpretation and the q-value,” The Annals of Statistics, 31, 2013–2035. DOI: 10.1214/aos/1074290335.
- Sun, W., and Cai, T. T. (2007), “Oracle and Adaptive Compound Decision Rules for False Discovery Rate Control,” Journal of the American Statistical Association, 102, 901–912. DOI: 10.1198/016214507000000545.
- —-(2009), “Large-Scale Multiple Testing Under Dependence,” Journal of the Royal Statistical Society, Series B, 71, 393–424. DOI: 10.1111/j.1467-9868.2008.00694.x.
- Sun, W., Reich, B. J., Cai, T. T., Guindani, M., and Schwartzman, A. (2015), “False Discovery Control in Large-Scale Spatial Multiple Testing,” Journal of the Royal Statistical Society, Series B, 77, 59–83. DOI: 10.1111/rssb.12064.
- Vovk, V., Gammerman, A., and Shafer, G. (2005), Algorithmic Learning in a Random World (Vol. 29), New York: Springer.
- Vovk, V., and Wang, R. (2021), “E-values: Calibration, Combination and Applications,” The Annals of Statistics, 49, 1736–1754. DOI: 10.1214/20-AOS2020.
- Wang, R., and Ramdas, A. (2022), “False Discovery Rate Control with e-values,” Journal of the Royal Statistical Society, Series B, 84, 822–852. DOI: 10.1111/rssb.12489.
- Wu, W. B. (2008), “On False Discovery Control Under Dependence,” The Annals of Statistics, 36, 364–380. DOI: 10.1214/009053607000000730.
- Yang, C.-Y., Lei, L., Ho, N., and Fithian, W. (2021), “Bonus: Multiple Multivariate Testing with a Data-Adaptivetest Statistic,” arXiv preprint arXiv:2106.15743.