
Abstract
Background: Cancer cachexia is associated with poorer outcomes and is often diagnosed by the Fearon criteria. Oncologists clinically identify cachexia based on a patient’s presentation. In this study agreement between these identification methods was evaluated and associations with outcomes were studied in patients with metastatic colorectal cancer.
Methods: Fearon criteria comprised weight loss >5% OR weight loss >2% with either BMI <20 kg/m2 or sarcopenia (determined by CT-imaging). Clinical assessment by the oncologist was based on the patient’s clinical presentation. Agreement was tested with Kappa. Associations with treatment tolerance and progression free survival (PFS) were tested with logistic regressions and Cox proportional hazards, respectively.
Results: Of 69 patients, 52% was identified as cachectic according to Fearon criteria and 9% according to clinical assessment. Agreement between both methods was slight (Kappa 0.049, P = 0.457). Clinically cachectic patients had a shorter PFS than clinically non-cachectic patients (HR 3.310, P = 0.016). No other differences in outcomes were found between cachectic vs. non-cachectic patients using both methods.
Conclusions: The agreement between cancer cachexia identification by clinical assessment vs. Fearon criteria was slight. Further improvement of cachexia criteria is necessary to identify cachectic patients at risk of poorer outcomes, who may benefit from targeted cachexia interventions.
Introduction
Cancer cachexia is a syndrome characterized by loss of skeletal muscle mass due to reduced food intake, systemic inflammation, and metabolic changes (Citation1). It is associated with reduced quality of life, treatment tolerance, and survival (Citation2–11). Although its clinical implications have been shown, there is no agreement on the criteria defining cancer cachexia (Citation12). Proposed definitions vary in criteria, some focus on weight loss and body composition, while others incorporate additional factors like energy intake, fatigue, and inflammatory markers (Citation1,Citation13–15). When different diagnostic criteria are used within the same population, the prevalence of cachexia varies from 12 to 85% (Citation14).
International consensus criteria that are often used in research were proposed by Fearon and associates (Citation1). They defined cancer cachexia as unintentional weight loss >5% over the past 6 months OR a body mass index (BMI) < 20 kg/m2 and any degree of weight loss >2% OR sarcopenia and any degree of weight loss >2% (Citation1). A limitation of these criteria is that assessment of muscle mass is time consuming and not always feasible in routine clinical care.
In a survey among oncologists, 69% of the oncologists identified themselves as the profession most likely to identify cancer cachexia (Citation16). Although clinical assessment of cachexia by oncologists is not a validated method, it is known that oncologists consider weight loss, loss of appetite, muscle wasting, changes in physical appearance and extreme fatigue, among other criteria, as part of cancer cachexia (Citation16–18). Taking this into account, a patient’s clinical presentation might provide an easily assessable indication to evaluate whether a patient is cachectic and has poorer prognosis. However, identifying cachexia by clinical assessment has never been compared to the Fearon et al. cachexia criteria. Therefore, the aim of this study is to evaluate agreement between cancer cachexia identification according to clinical assessment and the Fearon et al. criteria. Furthermore, the association of both methods with treatment tolerance and with progression-free survival will be assessed.
Methods
Study Design
This study is a sub-study of a randomized controlled trial (RCT) evaluating the effect of individualized nutritional counseling and physical activity on skeletal muscle mass during first-line chemotherapy in patients diagnosed with metastasized colorectal cancer (mCRC) (Citation19). Patients were eligible for study participation if they were diagnosed with mCRC, were scheduled for first-line palliative chemotherapy with capecitabine monotherapy, capecitabine and oxaliplatin (CAPOX), or infusional 5-fluorouracil and oxaliplatin (FOLFOX), and had a World Health Organization performance score of 0–2. After enrollment, patients were randomized to either the usual care group or the intervention group. Patients in the intervention group received nutritional counseling from the first cycle of chemotherapy, aimed at sufficient energy and protein intake, when necessary supported by oral supplements or enteral feeding. In addition, physical activity recommendations were provided. Ethics approval for the study was obtained from the Medical Ethical Committee of the VU University Medical Center and the study was conducted according to the principles of the Declaration of Helsinki (64th version, October 2013) and in accordance with the Medical Research Involving Human Subjects Act (WMO, 1-3-2006). All patients gave informed consent prior to study inclusion.
For the current sub-study, baseline data including performance status, laboratory data, and disease characteristics, were used, as well as chemotherapy data from the first 3–4 cycles to evaluate treatment tolerance and data from follow-up visits to evaluate progression-free survival.
Cancer Cachexia
Cachexia was diagnosed prior to the first cycle of chemotherapy using two methods: assessment based on the Fearon et al. criteria and clinical assessment by the oncologist. Cachexia according to Fearon et al. (Citation1) was defined by:
Weight loss >5% over 6 months prior to baseline OR
BMI <20 kg/m2 AND any degree of weight loss >2% over 6 months prior to baseline OR
Low muscle mass measured on a single CT-slice according to the cutoffs defined by Martin et al. (Citation10) AND any degree of weight loss >2% over 6 months prior to baseline
Clinical assessment comprised the oncologists’ opinion based on the patient’s clinical presentation. The treating oncologist was asked whether the patient was considered being clinically cachectic (yes/no)? The oncologists were not further questioned on their motivation to consider a patient cachectic or not and they were not specifically asked to identify cachexia symptoms such as weight loss or fatigue, in order to not bias their opinion.
Body Weight
Self-reported weight at baseline and 6 months prior to baseline was inquired by a research assistant. Weight was corrected for clothes or clothes and shoes (1.6 and 2.0 kg for men and 1.0 and 1.3 kg for women, respectively) (Citation20). Because the difference between hospital measured weight and self-reported weight in patients in which both values were available was negligible (n = 63, mean difference 0.05 kg), the baseline hospital measured weight was used if baseline self-reported weight was missing (n = 3).
Muscle Mass
Skeletal muscle area (SMA, cm2) was analyzed by a trained researcher using a single CT slice at the level of the third lumbar vertebra. Skeletal muscles at this level were identified based on anatomical features and quantified using Hounsfield units with thresholds for skeletal muscle tissue from −29 to +150. The sum of the indicated muscle pixels was summed to compute SMA (Citation21,Citation22). Scans were analyzed using SliceOmatic software V5.0 (Tomovision, Canada). SMA was adjusted for height2 resulting in skeletal muscle index (SMI, cm2/m2). Because the SMI cutoffs for sarcopenia used by Fearon et al. in 2011 were based on an obese population (52.4 cm2/m2 in men and 38.5 cm2/m2 in women) (Citation11), more recently published cutoffs derived from a population of both non-obese and obese patients were used. These cutoff values were defined as an SMI below 43.0 cm2/m2 in men with a BMI <25.0 kg/m2, 53.0 cm2/m2 in men with a BMI ≥25.0 kg/m2 and 41.0 cm2/m2 in women (Citation10).
A sensitivity analysis was done using the former cutoff values.
Treatment Tolerance
Start dose of chemotherapy was compared to standard dose and reasons for a reduced start dose were recorded. Treatment tolerance was defined as relative dose intensity (RDI). This is a measure taking both the dose index (DI) and time index (TI) into account. The dose index was calculated by dividing the total delivered dose by the total standard dose. In case of a reduced start dose because of dihydropyrimidine dehydrogenase (DPD)-deficiency, this dose adapted to DPD activity was considered as 100% (standard dose). The time index was defined as the planned duration divided by the actual duration of the given cycles. The RDI (%) was calculated using the formula RDI = DI × TI × 100. For the treatment schedules consisting of multiple drugs, indices were calculated for each single drug and the mean value of these indexes was used in the analysis (Citation23,Citation24). For CAPOX and capecitabine the first three cycles were analyzed and for FOLFOX the first four cycles were analyzed, which comprises the standard number of cycles given per regimen until evaluation of treatment response. When chemotherapy was stopped early because of toxicity/patient condition, the planned cycles were included in the analyses. When chemotherapy was stopped early because of patient preference (without medical indication), only the given cycles were analyzed, with a minimum of two cycles. RDI was dichotomized into RDI ≤90% and RDI >90% for analyses.
Progression-Free Survival
Progression-free survival was defined as the time period between baseline (i.e., just before the start of first-line chemotherapy) and the date of disease progression or death. Disease progression was defined as radiological progression according to the Response Evaluation Criteria In Solid Tumors (RECIST) or clinical progression leading to discontinuation of first-line treatment (Citation25,Citation26). If patients had been recently included in the RCT and, therefore, had not had a follow-up visit, they were excluded for the progression-free survival analyses. Overall survival was not evaluated because most patients had been included in the RCT in the recent two years and, therefore, follow-up time was limited.
Statistics
Differences in patient characteristics between non-cachectic and cachectic patients were analyzed using independent t-tests, χ2-tests, and Mann-Whitney U-tests where applicable. To assess agreement between both identification methods of cachexia, Cohen’s Kappa was used, which indicates measurement agreement [<0.00 poor agreement, 0.00–0.20 slight agreement, 0.21–0.40 fair agreement, 0.41–0.60 moderate agreement, 0.61–0.80 substantial agreement, and 0.81–1.00 almost perfect agreement (Citation27)]. The association between both cachexia assessments with RDI was studied using logistic regression with adjustment for treatment allocation within the RCT. Odds ratios were reported, including 95% confidence interval (95% CI) and P value. This was done for all patients, including those with a reduced start dose, and separately only for patients starting with a standard treatment dose. To compare progression-free survival between non-cachectic and cachectic patients, Kaplan-Meier curves were plotted and differences between the curves were tested with log-rank tests. Cox proportional hazards analyses were performed to test the associations between cachexia and progression-free survival, adjusted for treatment allocation.
Results
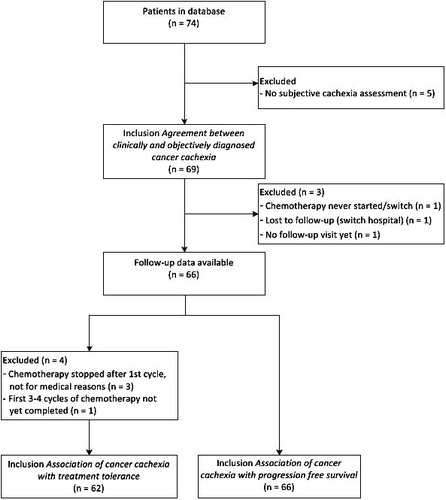
From the 74 patients within the database, 69 had complete data to be included in the analysis of the agreement between the Fearon et al. criteria and clinical assessment of cachexia. Follow-up data were available for 66 patients. From four of these patients, treatment tolerance could not be assessed ().
Figure 1. Study flowchart.
Population
The mean age of the patients was 65 (±11) years old and 67% were male. Most patients had a performance status of 0 or 1. Mean BMI was 25.7 (±4.1) kg/m2 and mean weight loss in the six months prior to baseline was 3.6 (±7.7)%. An overview of all relevant baseline characteristics is shown in .
Table 1. Baseline characteristics for the total study population and for cachectic vs. non-cachectic patients.
Cancer Cachexia
In total, 36 patients (52%) were cachectic based on the Fearon et al. criteria. Of these patients, 22 (61%) fulfilled more than one of the Fearon et al. criteria, mostly >5% weight loss in the previous 6 months and a SMI below the sex-specific cutoff combined with >2% weight loss (). Sensitivity analysis using the SMI cutoff values based on the original, obese population (Citation11) resulted in exactly the same population fulfilling the Fearon et al. criteria. Six patients (9%) were cachectic according to clinical assessment by the oncologist. Agreement between both methods was slight (, Kappa 0.049, 95% CI –0.079–0.176, P = 0.457).
Figure 2. Frequency of criteria for cachexia according to the Fearon et al. criteria. In total, 36 out of 69 patients fulfilled one or more of the Fearon et al. criteria for cachexia.
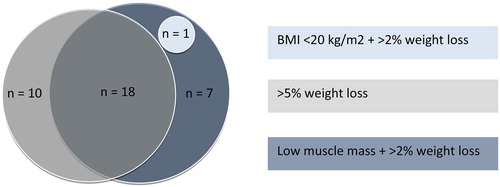
Table 2. Cancer cachexia – agreement between identification by clinical assessment vs. Fearon et al. criteria.
Cachectic patients according to Fearon et al. had a significantly higher C reactive protein, lower BMI, a higher percentage of weight loss, and lower perceived health and perceived quality of life compared to non-cachectic patients. Clinically cachectic patients had a lower BMI, a lower SMI (only significant in females), and lower quality of life scores for physical function, emotional functioning, perceived health, and perceived quality of life ().
Treatment Tolerance
Of the 62 patients of whom RDI could be assessed, 47 (76%) started treatment with a reduced dose. Reasons for dose reduction of the first cycle were related to the patient’s condition (n = 10), laboratory abnormalities (liver function or hemoglobin, n = 3), comorbidity (enterocutaneous fistula n = 1), and as part of a desensitization schedule (n = 1). Start of treatment with a reduced dose was not related to cachexia according to the Fearon et al. criteria nor to clinical assessment ().
Median RDI was 96 [75–100]% and 47% of the patients (n = 29) had a RDI ≤90%. Of the patients who were cachectic according to the Fearon et al. criteria (n = 33), 48% had a RDI ≤90%, compared to 45% of the non-cachectic patients (n = 29). Of the clinically cachectic patients (n = 5), 80% had a RDI ≤90%, which was 44% in the clinically non-cachectic patients (n = 57). There was no significant difference in the treatment tolerance between cachectic vs. non-cachectic patients using either of the two methods (odds for RDI >90%: Fearon et al. criteria 0.917, 95% CI 0.331–2.537, P = 0.867; clinical assessment 0.201, 95% CI 0.021–1.923, P = 0.164). When only patients starting with a standard treatment dose (n = 47) were analyzed, comparable results were found (odds for RDI >90%: objective assessment 0.804, 95% CI 0.224–2.886, P = 0.738; clinical assessment 0.202, 95% CI 0.016–2.520, P = 0.214).
Progression-Free Survival
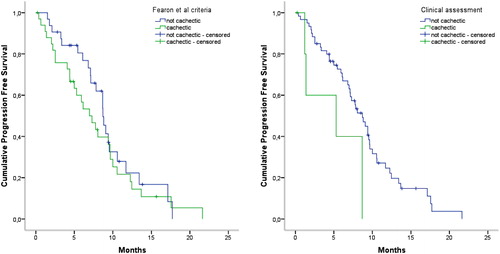
In patients who had disease progression within the study period (n = 52, 79%), median progression-free survival was 220 [108–294] days. Median follow-up time of the censored patients (n = 14, 21%) was 198 [137–298] days. Using the Fearon et al. criteria, cachectic (n = 34) vs. non-cachectic (n = 32) patients did not have different progression-free survival curves (P = 0.389, ) or hazard ratios for disease progression (HR 1.311, 95% CI 0.753–2.284, P = 0.339). The progression-free survival curve for patients who were clinically classified cachectic (n = 6) was significantly different from patients not clinically cachectic (n = 60) (P = 0.023, ). Progression-free survival was significantly shorter for patients who had been identified cachectic clinically (HR 3.310, 95% CI 1.252–8.748, P = 0.016).
Figure 3. Kaplan-Meier curves for progression-free survival of patients with metastatic colorectal cancer who are cachectic vs. not cachectic based on the Fearon et al. criteria (a) and based on clinical assessment (b).
Discussion
The prevalence of cancer cachexia was 52% according to the Fearon et al. criteria and 9% when identified by clinical assessment. Agreement between both methods was slight. Previous studies have reported proportions of cancer cachexia using different criteria as well. Using the Fearon et al. criteria, the prevalence of cachexia was 55% in patients with stage IV colorectal cancer (n = 75) (Citation4), which is in line with the prevalence found in the current study. Studies in other populations showed higher numbers: the prevalence was 85% in palliative care patients (n = 405) (Citation15) and 60% in patients with unresected pancreatic cancer (n = 45) (Citation28). In patients with various cancer types and stages (n = 167), 70% developed cancer cachexia at some time during the study period of one year (Citation29). In these studies, cachexia prevalence was higher using the Fearon et al. criteria compared to other criteria including C reactive protein, dietary intake, fatigue, and/or muscle strength. Significant associations between cachexia according to the Fearon et al. criteria with overall survival were found [HR 1.3 (Citation14) till 1.8 (Citation29)], however, other cachexia criteria were more predictive for survival [HR 1.4 (Citation14) till 3.3 (Citation29)]. While other studies indicated that cachexia according to the Fearon et al. criteria was associated with overall survival, no association with progression-free survival was found in the current study. This could be explained by the fact that most cachectic patients may be fit enough to complete first-line chemotherapy, while further-line treatment is hampered by cumulative toxicity and by a patient’s poor physical condition, resulting in shorter overall survival (Citation30). Alternatively, this may be explained by the fact that these other studies included patients with more advanced cancer in whom no anticancer treatment options were available (Citation14), by the difference in cancer types (Citation14,Citation28,Citation29) and by the duration of the study period (Citation29). Cachexia identified by clinical assessment in our study did show a significant association with progression-free survival (HR 3.310, P = 0.016). A possible explanation for this might be the lower treatment tolerance to first-line treatment in these patients resulting in lower chemotherapy dose intensities (80% had a RDI ≤90%) (Citation31).
Moreover, the proportion of patients identified as clinically cachectic was low compared to cachexia prevalence according to the Fearon et al. criteria, indicating that the oncologists only identified the patients with the worst clinical condition and the patients presenting with externally observable cachexia characteristics, i.e., a sicker group. This is supported by the fact that clinically cachectic patients had a lower BMI, lower physical functioning, and lower quality of life scores and this may also explain the association with progression-free survival. However, cachexia characteristics that are not externally observable may be missed by oncologists. This may be the case for sarcopenic obesity, in which a low muscle mass is masked by obesity (Citation11,Citation30,Citation32). In this way, clinical assessment may result in an underestimation of the cachexia prevalence. On the other hand, the cachexia prevalence may be overestimated using mortality-related cutoff values. In the current study, 68% of patients had a muscle mass below the sex-specific cutoff. The specific cutoffs defined by Martin et al. correspond to the 10th and 50th percentile in healthy men (BMI <25 kg/m2 and BMI ≥25 kg/m2, respectively) and 50th percentile in healthy women (Citation33), indicating that the cutoffs by Martin et al. are relatively high. As a consequence, patients with a normal muscle mass may be considered as being sarcopenic, which is one of the Fearon et al. criteria for cachexia.
Limitations of this study comprise the inclusion of only patients with metastatic colorectal cancer. Therefore, the results may not be representative for patients with other cancer types or stages. Moreover, no distinction was made between precachexia, cachexia, and refractory cachexia. These different stages of cachexia may require different management strategies and it has yet to be studied if and at what stage intervention is effective, and what the optimal intervention would look like.
In conclusion, there was a substantial difference in cancer cachexia prevalence when clinical assessment was compared to the cancer cachexia criteria defined by Fearon et al. in patients with metastatic colorectal cancer. Clinical assessment of cancer cachexia was related to progression-free survival but may underestimate cachexia prevalence. Further improvement in cancer cachexia criteria is necessary to identify cachectic patients, who are at risk of poorer clinical outcomes and may benefit from targeted cachexia interventions.
Acknowledgments
This work was done in the VU University Medical Center, Amsterdam, The Netherlands. No grants or other funding was provided for the conduction of this research.
Disclosure Statement
The authors have no conflict of interest to declare.
References
- Fearon K, Strasser F, Anker SD, Bosaeus I, Bruera E, et al.: Definition and classification of cancer cachexia: an international consensus. Lancet Oncol 12, 489–495, 2011.
- Vigano A, Del Fabbro E, Bruera E, and Borod M: The cachexia clinic: from staging to managing nutritional and functional problems in advanced cancer patients. Crit Rev Oncog 17, 293–303, 2012.
- Thoresen L, Frykholm G, Lydersen S, Ulveland H, Baracos V, et al.: The association of nutritional assessment criteria with health-related quality of life in patients with advanced colorectal carcinoma. Eur J Cancer Care (Engl) 21, 505–516, 2012.
- Thoresen L, Frykholm G, Lydersen S, Ulveland H, Baracos V, et al.: Nutritional status, cachexia and survival in patients with advanced colorectal carcinoma. Different assessment criteria for nutritional status provide unequal results. Clin Nutr 32, 65–72, 2013.
- Bachmann J, Heiligensetzer M, Krakowski-Roosen H, Buchler MW, Friess H, et al.: Cachexia worsens prognosis in patients with resectable pancreatic cancer. J Gastrointest Surg 12, 1193–1201, 2008.
- Blum D, Stene GB, Solheim TS, Fayers P, Hjermstad MJ, et al.: Validation of the Consensus-Definition for Cancer Cachexia and evaluation of a classification model – a study based on data from an international multicentre project (EPCRC-CSA). Ann Oncol 25, 1635–1642, 2014.
- Barret M, Antoun S, Dalban C, Malka D, Mansourbakht T, et al.: Sarcopenia is linked to treatment toxicity in patients with metastatic colorectal cancer. Nutr Cancer 66, 583–589, 2014.
- Barret M, Malka D, Aparicio T, Dalban C, Locher C, et al.: Nutritional status affects treatment tolerability and survival in metastatic colorectal cancer patients: results of an AGEO prospective multicenter study. Oncology 81, 395–402, 2011.
- Prado CM, Baracos VE, McCargar LJ, Reiman T, Mourtzakis M, et al.: Sarcopenia as a determinant of chemotherapy toxicity and time to tumor progression in metastatic breast cancer patients receiving capecitabine treatment. Clin Cancer Res 15, 2920–2926, 2009.
- Martin L, Birdsell L, Macdonald N, Reiman T, Clandinin MT, et al.: Cancer cachexia in the age of obesity: skeletal muscle depletion is a powerful prognostic factor, independent of body mass index. J Clin Oncol 31, 1539–1547, 2013.
- Prado CM, Lieffers JR, McCargar LJ, Reiman T, Sawyer MB, et al.: Prevalence and clinical implications of sarcopenic obesity in patients with solid tumours of the respiratory and gastrointestinal tracts: a population-based study. Lancet Oncol 9, 629–635, 2008.
- Dunne RF, Mustian KM, Garcia JM, Dale W, Hayward R, et al.: Research priorities in cancer cachexia: The University of Rochester Cancer Center NCI Community Oncology Research Program Research Base Symposium on Cancer Cachexia and Sarcopenia. Curr Opin Support Palliat Care 11, 278–286, 2017.
- Evans WJ, Morley JE, Argiles J, Bales C, Baracos V, et al.: (Cachexia: a new definition. Clin Nutr 27. 793–799, 2008.
- Wallengren O, Lundholm K, and Bosaeus I: Diagnostic criteria of cancer cachexia: relation to quality of life, exercise capacity and survival in unselected palliative care patients. Support Care Cancer 21, 1569–1577, 2013.
- Muscaritoli M, Anker SD, Argiles J, Aversa Z, Bauer JM, et al.: Consensus definition of sarcopenia, cachexia and pre-cachexia: joint document elaborated by Special Interest Groups (SIG) “cachexia-anorexia in chronic wasting diseases” and “nutrition in geriatrics”. Clin Nutr 29, 154–159, 2010.
- Del Fabbro E, Jatoi A, Davis M, Fearon K, di Tomasso J, et al.: Health professionals' attitudes toward the detection and management of cancer-related anorexia-cachexia syndrome, and a proposal for standardized assessment. J Community Support Oncol 13, 181–187, 2015.
- Muscaritoli M, Rossi Fanelli F, and Molfino A: Perspectives of health care professionals on cancer cachexia: results from three global surveys. Ann Oncol 27, 2230–2236, 2016.
- Churm D, Andrew IM, Holden K, Hildreth AJ, and Hawkins C: A questionnaire study of the approach to the anorexia-cachexia syndrome in patients with cancer by staff in a district general hospital. Support Care Cancer 17, 503–507, 2009.
- van der Werf A, Blauwhoff-Buskermolen S, Langius JA, Berkhof J, Verheul HM, et al.: The effect of individualized nutritional counseling on muscle mass and treatment outcome in patients with metastatic colorectal cancer undergoing chemotherapy: a randomized controlled trial protocol. BMC Cancer 15, 98, 2015.
- Frank E, and Dunlop AL: What does a patient's outfit weight? Fam Med 32, 595–596, 2000.
- Mourtzakis M, Prado CM, Lieffers JR, Reiman T, McCargar LJ, et al.: A practical and precise approach to quantification of body composition in cancer patients using computed tomography images acquired during routine care. Appl Physiol Nutr Metab 33, 997–1006, 2008.
- Shen W, Punyanitya M, Wang Z, Gallagher D, St-Onge MP, et al.: Total body skeletal muscle and adipose tissue volumes: estimation from a single abdominal cross-sectional image. J Appl Physiol (1985) 97, 2333–2338, 2004.
- Wampler GL and Fryer JG: Calculation of received dose intensity for combinations of drugs using small-cell lung carcinoma treatment regimens as examples. Cancer Chemother Pharmacol 30, 199–206, 1992.
- Nakayama G, Tanaka C, Uehara K, Mashita N, Hayashi N, et al.: The impact of dose/time modification in irinotecan- and oxaliplatin-based chemotherapies on outcomes in metastatic colorectal cancer. Cancer Chemother Pharmacol 73, 847–855, 2014.
- Eisenhauer EA, Therasse P, Bogaerts J, Schwartz LH, Sargent D, et al.: New response evaluation criteria in solid tumours: revised RECIST guideline (version 1.1). Eur J Cancer 45, 228–247, 2009.
- Dancey JE, Dodd LE, Ford R, Kaplan R, Mooney M, et al.: Recommendations for the assessment of progression in randomised cancer treatment trials. Eur J Cancer 45, 281–289, 2009.
- Landis JR and Koch GG: The measurement of observer agreement for categorical data. Biometrics 33, 159–174, 1977.
- Wesseltoft-Rao N, Hjermstad MJ, Ikdahl T, Dajani O, Ulven SM, et al.: Comparing two classifications of cancer cachexia and their association with survival in patients with unresected pancreatic cancer. Nutr Cancer 67, 472–480, 2015.
- Vanhoutte G, van de Wiel M, Wouters K, Sels M, Bartolomeeussen L, et al.: Cachexia in cancer: what is in the definition? BMJ Open Gastroenterol 3, e000097, 2016.
- Fearon K, Arends J, and Baracos V: Understanding the mechanisms and treatment options in cancer cachexia. Nat Rev Clin Oncol 10, 90–99, 2013.
- Andreyev HJ, Norman AR, Oates J, and Cunningham D: Why do patients with weight loss have a worse outcome when undergoing chemotherapy for gastrointestinal malignancies? Eur J Cancer 34, 503–509, 1998.
- Sun L, Quan XQ, and Yu S: An epidemiological survey of cachexia in advanced cancer patients and analysis on its diagnostic and treatment status. Nutr Cancer 67, 1056–1062, 2015.
- van der Werf A, Langius JAE, de van der Schueren MAE, Nurmohamed SA, van der Pant KAMI, et al.: Percentiles for skeletal muscle index, -area and -radiation attenuation based on computed tomography imaging in a healthy Caucasian population. Eur J Clin Nutr (Accepted 05 Oct 2017).