
Abstract
Introduction: Medicinal mushrooms have been used for the treatment of diseases and general promotion of health for many centuries. Recent pharmacological research into medicinal mushrooms has identified various therapeutic properties, with applications in modern medicine.
Aim: To evaluate the anti-cancer activities of Fomitopsis pinicola (F. pinicola) alcoholic extract in an in vivo setting.
Methods: The anti-tumour effect of the F. pinicola extract was tested in a xenograft immune-compromised Rag-1 mouse model. This was followed by RT-PCR and metabolomics analyses.
Results: There were no observable differences in tumor growth between treated and non-treated groups. The bioactive components were not detected in the mouse plasma or the tumor site.
Conclusions: The extract was poorly absorbed; this is likely due to the timing of treatment, dosage levels and modifications made to the extract where the alcohol-based solvent was replaced with water. This, in combination with fractionation studies which identified most anti-cancer compounds to be hydrophobic, largely explained the lack of anti-cancer activities in vivo.
Introduction
Mushrooms have been used in oriental medicine for the general promotion of health and longevity for centuries (Citation1). With a steady growth in the interest in medicinal mushrooms, investigations into their pharmaceutical potential are on the rise, with an increased number of published books and articles, and the addition of new scientific journals focusing on medicinal mushrooms (Citation1,Citation2). This is also reflected in industry, with the market value of medicinal mushrooms and their derivative supplements increasing from US$6 billion worldwide in 1999 to US$35.08 billion in 2015 and is expected to reach above US$59.48 billion by 2021 (Citation3).
Although medicinal mushrooms have been used by various cultures for centuries, they have only relatively recently been investigated for their application in modern medicine. Medicinal mushrooms have been used as an adjuvant to cancer therapy by alleviating the side-effects of chemo- and radiation therapy such as nausea, anemia, and a lowered immune system (Citation4). Furthermore, numerous clinical trials have been conducted to assess the potential anticancer properties of commercially prepared medicinal mushrooms (Citation4).
We have previously tested a whiskey extract from the fungus F. pinicola on various human cancer cell lines and have found positive growth inhibitory effects. In addition, we identified several biologically active pathways associated with the anticancer activities of the extract in prostate cancer (PCa) cell lines (Citation5). Since PCa is one of the most commonly diagnosed cancers in Australian and New Zealand men (Citation6,Citation7), and the fifth most common cancer worldwide (Citation7), we have continued to focus on PCa in this study.
PCa originates from the prostate gland, a male-specific organ associated with the reproductive system. The growth and survival of prostate cells is highly dependent on stimulation by androgens (Citation8), steroid hormones that play a specific role in the differentiation, development, and maintenance of male sexual characteristics via activation of androgen receptors (Citation8). Androgens regulate the prostate epithelium by stimulating cell proliferation (Citation9). Cancer occurs when the cell cycle becomes deregulated, and the rate of cell division exceeds the rate of cell death. Tumor progression and metastasis involve mutations in key genes involved in cell cycle control and proliferation, such as TP53 and RB (retinoblastoma) (Citation10). Over 95% of PCa are adenocarcinomas, which originate from prostatic epithelial cells (Citation11). Immortalized human PCa cell lines are commonly used as models of PCa. The PC3 cell line is a PCa adenocarcinoma, and consists of metastatic and androgen-independent cells derived from prostate metastasis in bone (Citation12), and is known to form tumors in a mouse xenograft model (Citation13,Citation14).
The aims of this study were to investigate the in vivo anticancer activities of a F. pinicola extract and to compare the results with previously identified anticancer activities in vitro. Further in vivo studies were designed to investigate the pharmacokinetic properties of the F. pinicola extract in mice. Using fractionation, the nature of the F. pinicola extract was also evaluated.
Material and Methods
Animal Ethics Statement
All animal studies were conducted under the approval of the University of Auckland Animal Ethics Committee (Ref No. 001190). All mice used in this study were housed at 20 °C in a 12 h light/dark cycle with food and water available ad libitum.
Preparation and Modification of Extract
The F. pinicola whiskey extract tested in this study was provided by NZFocus Ltd (Auckland, New Zealand). The commercial extract had been prepared by submerging dried F. pinicola bracket fungi from the Himalayan region in whiskey for six months. We reduced the volume of F. pinicola whiskey extract by freeze-drying, resulting in a dry white powder. The powder was resuspended using 5% dextrose.
PC3 Tumor Xenograft Study
Age-matched male-specific pathogen-free Rag1-/- mice (Jackson Laboratory, Bar Harbor, ME) weighing 18–22 g were subcutaneously inoculated with 5 × 10⁶ PC3 cells suspended in PBS (100 µl/mouse) on the right flank. Once tumors reached 200 mm3, animals were randomized to receive control vehicle (5% dextrose) or 500 or 1,000 mg/kg F. pinicola extract (n = 10 per group) daily for 15 days by oral gavage. Tumor measurements were recorded by electronic calipers. All quantified data are expressed as mean ± standard error of the mean (SEM). P-values were calculated using one-way ANOVA and data were considered significant when P-value <0.05. At the completion of treatment, tumor and liver tissues were collected for RT-PCR analysis.
Metabolomics Evaluation
Age-matched male-specific pathogen-free CD-1 mice (Charles River Laboratories, Wilmington, MA) weighing 18–23 g were treated with 1,000 mg/kg F. pinicola extract by oral gavage and were culled 15 min, 30 min, 1 h, 4 h, and 24 h after dosing (n = 3 per time point). Blood and liver were collected immediately after culling, with blood being centrifuged at 2,000g for 15 min in EDTA tubes (Becton Dickinson, Franklin Lakes, NJ) for the extraction of plasma. Fecal samples were also collected prior to culling.
Q-Exactive Mass Spectrometry
Plasma and fecal samples were mixed with ice cold methanol then centrifuged at 12,000g for 10 min at 4 °C to remove protein precipitates. The process was repeated three times. Fifty micro liter of supernatant was taken and added to 50 µl of ASTM (American Society for Testing and Materials) Type 1 (ULTRAPURE) water and mixed. Five micro liter of each sample was injected into a Q-Exactive Hybrid Quadrupole-Orbitrap MS with a heated electrospray ionization (HESI) source (Thermo Fisher Scientific, Waltham, MA) for analysis. A Syncronis C18 100 × 2.1 mm, 1.7 μm column (Thermo Fisher Scientific) was used with a mobile phase gradient of ASTM type 1 water (0.1% formic acid) and acetonitrile (0.1% formic acid) at a flow rate of 0.4 mL/min. Deuterated internal standards (tryptophan D5, cortosterone D8, progesterone D9) purchased from Sigma-Aldrich (Auckland, New Zealand) and prepared in methanol were used to correct for analyte response. Mass spectrometry data were analyzed using the MaxQuant software. Alignment and principal component analysis were completed using the SIEVE software.
RT-PCR
RNA was extracted from tumor, liver, and plasma using RNeasy Plus Mini Kits (QIAGEN, Venlo, the Netherlands) following the manufacturer’s protocol. One microgram of total RNA was reverse transcribed into cDNA using a Quantitect Reverse Transcription Kit (QIAGEN) following the manufacturer’s protocol. The primers (Thermo Fisher Scientific) used for RT-PCR analysis included RAD51 (Hs00947967_m1, 58 bp), Rad51 (Mm00487905_m1, 58 bp), BRCA1 (Hs01556193_m1, 59 bp), Brca1 (Mm00515386_m1, 90 bp), IRF1 (Hs00971960_m1, 60 bp), Irf1 (Mm01288580_m1, 66 bp) and house-keeping genes GAPDH (Hs02758991_g1, 93 bp), Gapdh (Mm99999915_g1, 109 bp), and 18S (4310893E, 187 bp). Primers targeting human genes were used for the analysis of tumor tissue and primers targeting mouse genes were used for liver tissue. RT-PCR reactions were performed with TaqMan™ Fast Advanced Master Mix (Thermo Fisher Scientific). The thermocycling steps were programed with QuantStudio 6 (Thermo Fisher Scientific) as follows: a precycling stage at 95 °C for 10 min, then 40 cycles of denaturation at 95 °C for 15 s and annealing at 60 °C for 60 s. The fluorescence signal was measured at the end of each annealing step. Microsoft Excel with the 2−ΔΔCt method was used to determine the mRNA expression levels of genes of interest relative to the house-keeping genes (Citation15). One-way ANOVA followed by Dunnett’s multiple comparisons test was performed using GraphPad Prism version 8.0 for Windows (GraphPad Software, San Diego, California USA, www.graphpad.com). P-values <0.05 were considered significant.
Fractionation of Extract
Fractionation was used to separate F. pinicola extract into aqueous and organic fractions. The ratio used for separation was 1:2:1 water: alcohol: chloroform solution. As the original extract already contained 50% ethanol and 50% water, the proportion used was 1:1:1:1 (water: methanol: ethanol: chloroform).
Tissue Culture
PCa cell line PC3 was obtained from Dr Ronnie Cohen (Perth) and was authenticated by analysis of short tandem repeats (STR) by DNA Diagnostic Ltd (Auckland, New Zealand). PC3 cells were cultured in Minimum Eagle Media (Sigma-Aldrich) supplemented with 10% Fetal Calf Serum (Moregate Biotech, Hamilton, New Zealand) and 1% Penicillin/Streptomycin/Glutamine (Sigma-Aldrich).
PC3 cells were seeded at a cell density of 2,000 cells/well in 96-well plates (Corning, New York, NY) and incubated overnight at 37 °C with 5% CO2 before being treated with the aqueous/organic fractions of F. pinicola extract. The cells were incubated under the same conditions for four ×24 h doubling cycles. Growth inhibition was measured using the sulforhodamine B-(SRB)-based assay (Citation16) with IC50 values determined by four parameter logistic fit using the SigmaPlot 11.0 (Systat Software Inc.).
Results
Antitumor Efficacy
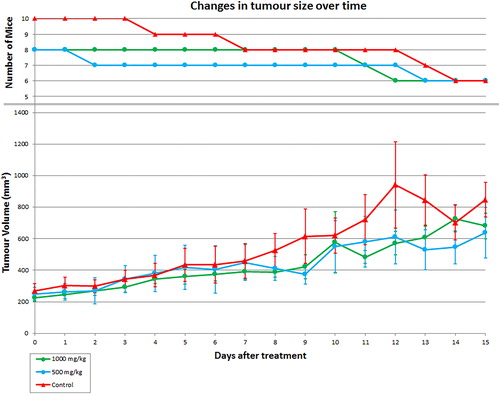
To determine if F. pinicola extract alters PC3 tumor growth, Rag1-/- mice with PC3 tumors were treated with 500 or 1,000 mg/kg F. pinicola extract. shows the changes in the average tumor size over time in the three xenograft mouse groups. The control group showed gradual increase in average tumor weight until day 12, where reduction in average tumor size was observed from day 12 to day 14. This coincide with reduced number of mice in the control group, as the mice with the largest tumors had to be culled thus leading to reduction in average tumor size of the surviving mice. All three groups showed gradual increase in tumor size over time. However, there were no significant differences between the changes in tumor size among the three groups.
Figure 1. The number of surviving mice and changes in tumor size over time in Rag1-/- mice with PC3 tumors treated daily with Bracket fungal extract at 500 or 1,000 mg/kg or control vehicle. Values represent the mean ± SEM. Number of mice = 6–10. For 1,000 mg/kg and 500 mg/kg groups, the number of mice started at 8 due to both having two mice with failed tumor implantation. The number of mice reduced over time due to tumor ulceration (resulting in ethically required euthanasia).
Xenograft Mice Tumor and Liver Gene Expression Analysis
The expression of human BRCA1, IRF1, and RAD51 genes in the PC3 tumors of Rag1-/- mice treated with F. pinicola extract were evaluated by RT-PCR, since the expression of these genes was altered by F. pinicola extract in prostate cancer cell lines in vitro (Citation5). There were no significant changes in gene expression levels between treated and untreated groups for all three genes tested (.
Figure 2. Changes in gene expression levels in Rag1-/- mice treated with F. pinicola extract. A. Changes in human gene expression levels in the PC3 tumors. B. Changes in gene expression levels of mouse genes in the liver tissues. Bars represent the mean and standard error (n = 3). Statistically significant differences vs. controls are shown at *P < 0.05, **P < 0.01.
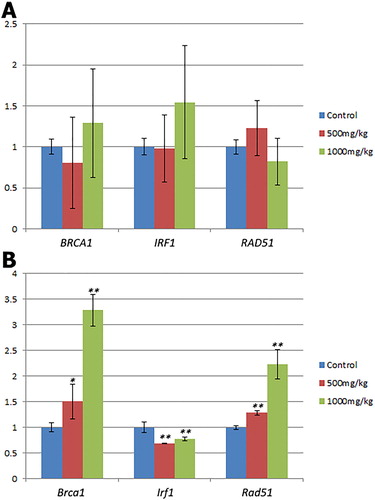
We also used RT-PCR to evaluate the expression of the orthologous mouse genes (Brca1, Irf1, and Rad51) in the liver of the Rag1-/- mice treated with F. pinicola extract. All three genes showed significant changes in gene expression levels after treatment (P < 0.05) (. For Brca1 and Rad51, the expression levels in the 1,000 mg/kg treatment group were significantly greater than those in the 500 mg/kg treatment group (P < 0.01).
CD1 Mice Liver and Plasma Gene Expression Analysis
CD1 mice were treated with 1,000 mg/kg F. pinicola extract with plasma and liver samples collected at multiple time points after dosing. Changes in gene expression over time were determined by RT-PCR. shows the changes in gene expression levels in the plasma of CD1 mice. In the plasma, while gene expression ranged between 1.37 and 0.79, no significant changes relative to baseline for any of the three genes were observed.
Figure 3. Changes in mouse gene expression levels in CD1 mice treated with F. pinicola extract over time. A. Changes in gene expression levels in the plasma. B. Changes in gene expression levels in the liver tissues. Bars represent the mean and standard error (n = 3). Statistically significant differences vs. baseline are shown at *P < 0.05, **P < 0.01.
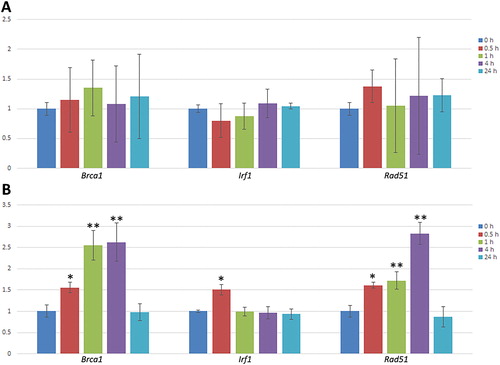
Rad51 and Brca1 showed significant increases in gene expression in the liver in the first 4 h after dosing (P < 0.05) (. Liver Irf1 showed a significant 1.5-fold increase in expression 30 min after dosing (P < 0.05), and returned to predosing level 1 h after dosing. All three genes showed similar liver expression levels as untreated controls 24 h after dosing.
Q-Exactive Analysis
Alignment and component extraction of mouse fecal and plasma samples are shown in . For the plasma samples, there is a lack of clustering between treated and control groups, which suggest no consistent differences in the metabolomics profiles between treated and control groups. For the mouse fecal samples, both positive and negative ions show clustering separate from controls, which suggest differences in the metabolomics profiles between the treated groups across all time points compared to controls. A scan of product ions revealed that multiple unknown positive and negative ions were observed in fecal samples of mice treated with F. pinicola compared to untreated control mice (). No unique peaks were found in treated mouse plasma samples compared to controls (data not shown).
Figure 4. Principal component analysis plot of mouse fecal and plasma samples.
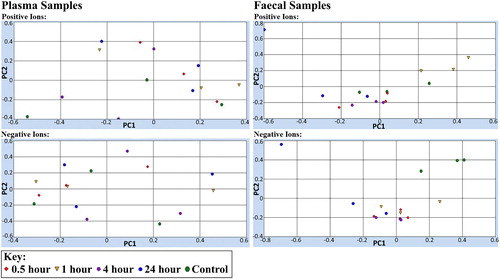
Table 1. Top positive and negative ion intensities in fecal samples of mice treated with F. pinicola extract. Criteria: p-value < 0.0001 in 2 of the 4 time points measured.
Extract Analysis
Fractionation was performed on F. pinicola whiskey extract. The extract was separated into an organic fraction (56.4% of total weight) and an aqueous fraction (43.6% of total weight).
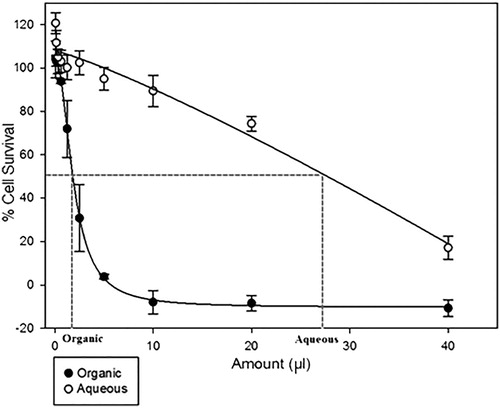
The antiproliferative activity of the aqueous and organic fractions of F. pinicola whiskey extract were tested on the PC3 cell line (). Stronger growth inhibitory activities were observed with the organic fraction compared to the aqueous fraction (Organic IC50 = 1.85 µl ± 0.97 µl vs. Aqueous IC50 = 27.7 µl ± 7.2 µl).
Figure 5. Antiproliferative activity of F. pinicola extract organic fraction and aqueous fraction in PC3 cells using SRB staining method. Symbols represent the mean and standard error of the mean (n = 4 technical replicates).
Discussion
Following our identification of anticancer activities and associated biologically active pathways of F. pinicola extract in cancer cell lines (Citation5), we wanted to ascertain if the same anticancer activities could be observed in an in vivo setting using a xenograft model. Despite observing antiproliferative activity in PC3 cells in vitro, the extract did not alter PC3 tumor growth at well-tolerated doses.
The tumor and liver tissues were harvested upon termination of the xenograft mice. The expression of three genes, previously found to be differentially expressed in the earlier in vitro assays in response to F. pinicola extract (Citation5) were measured using RT-PCR. We found significant changes in gene expression levels in the liver in the same direction as was observed by Affymetrix analysis in PCa cell lines (Citation5), but these changes were not detected in the tumor tissues. It is not clear why the extract altered gene expression in the liver but not in the tumor, although the minimal effect on tumor gene expression correlates with the lack of efficacy against tumor growth. One possibility is that the compound is metabolized or excreted through the bile into the feces during first pass metabolism and therefore the active component does not reach the tumor. This is supported by the mass spectrometry analysis of the fecal samples, where, unlike the plasma samples, the treated fecal samples cluster together and unique product ions were detected, indicating the likely presence of extract components or their metabolites. If the extract is indeed rapidly hepatically eliminated, the active component would still reach the liver where it could alter gene metabolism prior to being metabolized or excreted.
We also observed that changes in gene expression levels in the healthy mouse liver were similar to that of the immune-compromised mouse liver in response to treatment with F. pinicola extract. However, similar to the situation in tumors, there were minimal changes in gene expression observed in plasma, further suggesting that the active components of the extract are restricted from reaching the systemic circulation through elimination during first pass through the liver. The changes in gene expression in the liver returned to baseline level within 24 h after treatment (), suggesting that the active components were not retained for long periods within the liver, presumably due to its elimination there.
The original F. pinicola extract was an alcoholic extract containing ∼50% ethanol. Due to mice being extremely sensitive to ethanol, the alcoholic content was removed and the extract was resuspended in water as a 5% dextrose solution. The removal of ethanol increased the dosage the mice could tolerate without inducing alcohol toxicity. However, fractionation, in combination with tissue culture studies, showed the majority of the cell proliferative inhibitory activity to be in the hydrophobic (organic) fraction. The use of a hydrophilic-based solvent may have reduced the solubility of the active component in the GI tract of the mice, limiting absorption and promoting excretion in the feces. Dissolving the extract in an organic-based solvent, such as corn or palm oil, could potentially enhance absorption and increase bioavailability of the active compounds without inducing toxicity (Citation17).
The maximum dose tested was 1,000 mg/kg with no observable toxicity. A previous study by Wu et al. (Citation18) used dosages of 0.5% F. pinicola ethanol extract in the diet of up to 5,000 mg/kg in mice with no observable toxicity. They did not detect any inhibition of tumor growth at a dosage of 1,250 mg/kg but found a statistically significant inhibition of tumor growth at higher dosages (>2,500 mg/kg). This suggests that the dosages we used may have been too low to have any observable anticancer effects. In addition, we could potentially have treated the mice with much higher doses without the risk of toxicity. Furthermore, other similar animal studies began treating mice with F. pinicola extract prior to xenografting human tumor cells, and subsequently found tumor growth inhibition (Citation18–20). This prophylactic approach, rather than treating after tumors are well established, perhaps better represents the medicinal mushroom’s role as a nutraceutical for cancer prevention rather than a drug for the treatment of cancer.
Conclusion
Treatment with doses of the F. pinicola extract up to 1,000 mg/kg had no statistically significant effect on PC3 PCa tumor growth in mice, despite showing strong growth inhibitory effects in an in vitro analysis with the same cell line.
Using a combination of molecular analysis, we have found that the lack of tumor growth inhibition is likely due to the low bioavailability of active ingredients at tumor site. Thus, future in vivo studies using this extract will require improvements in the delivery mechanisms to ensure sufficient active components reach the tumor site for an observable response. Overall, we believe F. pinicola is still a potentially valuable source of anticancer (especially PCa) bioactive compounds, however, better understanding of the active components in the mushroom will be required moving forward.
Author Contributions
Overall design of study: Chi H.J. Kao, David R. Greenwood, Lynnette R. Ferguson, and Karen S. Bishop
Tissue Culture Study & RT-PCR: Chi H.J. Kao and Pamela M. Murray
Animal Study: Stephen M.F. Jamieson and Chi H.J. Kao
Q-Exactive: Margaret E. Coe and Chi H.J. Kao
Fractionation: David R. Greenwood and Chi H.J. Kao
Acknowledgments
The authors acknowledge The University of Auckland for providing access to the resources necessary for the completion of this study.
Disclosure Statement
The authors report no conflict of interest.
Additional information
Funding
Related Research Data
References
- Lindequist U, Niedermeyer THJ, and Jülich W-D: The pharmacological potential of mushrooms. Evid Based Complement Alternat Med 2, 285–299, 2005.
- Feeney MJ, Dwyer J, Hasler-Lewis CM, Milner JA, Noakes M, et al. Mushrooms and health summit proceedings. J Nutr 144, 1128S–1136S, 2014.
- Wasser SP, Nevo E, Sokolov D, Reshetnikov S, and Timot-Tismenetsky M: Dietary supplements from medicinal mushrooms: diversity of types and variety of regulations. Int J Med Mushr 2, 19, 2000.
- Patel S and Goyal A: Recent developments in mushrooms as anti-cancer therapeutics: a review. 3 Biotech 2, 1–15, 2012.
- Kao CH, Bishop KS, Xu Y, Han DY, Murray PM, et al. Identification of potential anticancer activities of novel ganoderma lucidum extracts using gene expression and pathway network analysis. Genomics Insights 9, 1–16, 2016.
- Vaidyanathan V, Karunasinghe N, Krishnamurthy V, Kao CH, Naidu V, et al. Aggressive prostate cancer incidence in New Zealand“united we fall, divided we stand-”. N Z Med J 130, 96–99, 2017.
- Bray F, Ferlay J, Soerjomataram I, Siegel RL, Torre LA, et al. Global cancer statistics 2018: Globocan estimates of incidence and mortality worldwide for 36 cancers in 185 countries. CA Cancer J Clin 68, 394–424, 2018.
- Brinkmann AO: Molecular mechanisms of androgen action – a historical perspective. Methods Mol Biol 776, 3–24, 2011.
- Ross RK, Pike MC, Coetzee GA, Reichardt JK, Yu MC, et al. Androgen metabolism and prostate cancer: establishing a model of genetic susceptibility. Cancer Res 58, 4497–4504, 1998.
- Laurie N, Mohan A, McEvoy J, Reed D, Zhang J, et al. Changes in retinoblastoma cell adhesion associated with optic nerve invasion. Mol Cell Biol 29, 6268–6282, 2009.
- Bostwick DG: The pathology of early prostate cancer. CA Cancer J Clin 39, 376–393, 1989.
- Alimirah F, Chen J, Basrawala Z, Xin H, and Choubey D: Du-145 and pc-3 human prostate cancer cell lines express androgen receptor: implications for the androgen receptor functions and regulation. FEBS Lett 580, 2294–2300, 2006.
- Grabowska MM, DeGraff DJ, Yu X, Jin RJ, Chen Z, et al. Mouse models of prostate cancer: Picking the best model for the question. Cancer Metastasis Rev 33, 377–397, 2014.
- Wu X, Gong S, Roy-Burman P, Lee P, and Culig Z: Current mouse and cell models in prostate cancer research. Endocr-Relat Cancer 20, 10.1530/ERC-1512-0285, 2013.
- Livak KJ and Schmittgen TD: Analysis of relative gene expression data using real-time quantitative pcr and the 2(-delta delta c(t)) method. Methods 25, 402–408, 2001.
- Skehan P, Storeng R, Scudiero D, Monks A, McMahon J, et al. New colorimetric cytotoxicity assay for anticancer-drug screening. J Natl Cancer Inst 82, 1107–1112, 1990.
- Savjani KT, Gajjar AK, and Savjani JK: Drug solubility: importance and enhancement techniques. ISRN Pharm 2012, 1957272012.
- Wu HT, Lu FH, Su YC, Ou HY, Hung HC, et al. In vivo and in vitro anti-tumor effects of fungal extracts. Molecules 19, 2546–2556, 2014.
- Wang Y, Cheng X, Wang P, Wang L, Fan J, et al. Investigating migration inhibition and apoptotic effects of fomitopsis pinicola chloroform extract on human colorectal cancer sw-480 cells. PLoS One 9, e101303, 2014.
- Gao Y, Wang P, Wang Y, Wu L, Wang X, et al. In vitro and in vivo activity of Fomitopsis pinicola (sw. Ex fr.) karst chloroform (fpkc) extract against s180 tumor cells. Cell Physiol Biochem 44, 2042–2056, 2017.