
Abstract
Thirty rats with glioma were divided into control group, temozolomide (TMZ) group (TMZ 30 mg/kg once daily for 5 day), and TMZ plus Caffeine group (TMZ 30 mg/kg once daily for 5 day and caffeine 100 mg/kg once daily for 2 weeks). The relative tumor fold and expression of hypoxia-induced factor-1α (HIF-1α), vascular endothelial growth factor (VEGF), neuropilin-1 (NRP-1), CCAAT/enhancer-binding protein homologous protein (CHOP), LC-3A/B, apoptosis-inducing factor-1 (AIF-1), and cleaved caspase three were compared. The relative tumor fold of TMZ plus Caffeine group was lower significantly than that of TMZ group at day 14. HIF-1α, VEGF, NRP-1, and CHOP expressions were not significantly different in the three groups. The LC-3A/B expression of TMZ plus Caffeine group was higher significantly than that of the control group and TMZ group. The AIF expressions of TMZ group and TMZ plus Caffeine group were higher significantly than that of the control group. The caspase-3 expression of TMZ plus Caffeine group was higher significantly than that of the control group and TMZ group. In conclusions, the inhibitory effect of caffeine on TMZ-treated glioma might be associated with increasing expressions of autophagy- and apoptosis-related genes.
Introduction
Glioma is the most common brain tumor. Glioblastoma multiforme (GBM) is characterized by diffuse infiltration into the brain parenchyma and obvious angiogenesis. Current therapy for GBM includes surgical excision and post-operative chemotherapy and/or radiation therapy. Even though, the prognosis for GBM is still poor. Temozolomide (TMZ) is a currently standard chemotherapeutic drug for GBM treatment. Intrinsic and/or acquired resistance to TMZ commonly accounts for treatment failures for GBM. Once recurrence develops, only few therapeutic approaches could be introduced to control the progression of GBM (Citation1). Therefore, seeking better and/or adjuvant agents to control the GBM becomes very urgent.
Caffeine has been reported to have ant-cancerous capabilities in vitro. For example, caffeine could modulate cell cycle, inhibit proliferation, induce cell apoptosis, decrease expression of Bcl-2, and increase expression of Cyt-C and caspase-3 in vitro (Citation2). Caffeine could increase glioma cell death by decreasing histone deacetylase one activity and/or by increasing histone acetyltransferase p300 activity in vitro (Citation3). Caffeine enhanced the cytotoxic effects of cisplatin and camptothecin on U251 glioma cell lines (Citation4). Caffeine, combining with tetrandrine, could also induce glioma cell death in vitro via increasing eukaryotic translation initiation factor-2α (eIF-2α) phospharylation, decreasing cyclin-D1 expression, and increasing caspase-dependent and -independent apoptosis pathways (Citation5).
However, the anti-cancerous effects of caffeine were seldom shown in animals and humans. An epidemiological study found that caffeinated beverages might reduce the risk of glioma development (Citation6). Caffeine, which is known to activate ryanodine receptors, paradoxically inhibited Ca(2+) increase by inositol 1,4,5-trisphospate receptor subtype 3 in glioma cells and prolonged survival in a mouse model (Citation7). But, the effects of caffeine on the expressions of hypoxia, angiogenesis, endoplasmic reticulum (ER) stress, autophagy, and apoptosis genes on TMZ-treated glioma in rats were still unclear. Therefore, we aimed to investigate these issues in this study.
Methods
Cell Line and Cell Culture
RT2 cells were kindly provided by National Taiwan University Hospital (Taipei, Taiwan). Cells were maintained in Dulbecco’s Modified Eagle Medium (Gibco, Berlin, Germany) that was supplemented with l-glutamine, streptomycin, penicillin (Gibco, Berlin, Germany), and 10% fetal calf serum (Gibco, Berlin, Germany). All cells were cultured at 37 °C in a 5% CO2 incubator.
Animal Care
Male, 8-week old, Fischer 344 inbred rat were purchased from the National Laboratory Animal Center (Taipei, Taiwan). Food and water were provided ad libitum to the animals in standard cages. The rats were maintained in a daily cycle of 12 h period of lightness and darkness. All administrate were performed and proved in accordance with the guidelines of the Institutional Animal Care and Use Committee at the Dalin Lin Tzu Chi Hospital, Buddhist Tzu Chi Medical Foundation (1031003-2).
Animals were monitored for morbidity or signs of distress throughout the study. Humane endpoints for these studies were based on weight loss (>10–15%) and clinical observations for behavior (decreased activity, hunched posture, shivering, labored breathing, moribund). We did not observe any adverse event during our studies, including signs of illness or mortality prior to experimental endpoint.
Development of Subcutaneous Xenograft Tumors
RT2 cells (1 × 10⁷ cells in 500 μl per injection site) were suspended in PBS. Rats were anesthetized by continuous flow of 3% isofluorane (2.5% LPM oxygen), and RT2 glioma cells were implanted into the subcutaneous space of right flank in Fischer 344 rats. Animals were observed for 45 to 60 min, after tumor inoculation, until fully recovered. Tumor growth was monitored with a digital caliper every week. Tumor volume was estimated according to the following formula: Volume = 0.5 × (d1 × d2 × d3), in which d1, d2, and d3 are the vertical of the tumor, respectively (Citation8).
Grouping and Treatments
Two weeks later, rats with tumor volume greater than 62.5 mm3 were randomly and equally divided into three study groups (10 rats in each group). To make sure that the amount of TMZ and/or caffeine was intook standardly, rats were treated by oral instillation of saline or TMZ, or TMZ plus caffeine once at the same time in the morning. Control group received only saline once daily for 5 day; TMZ group received only TMZ (30 mg/kg) once daily for 5 day; TMZ plus Caffeine group received TMZ (30 mg/kg) once daily for 5 day plus caffeine (100 mg/kg) once daily for 2 weeks. The relative tumor fold was calculated by tumor volume at each week compared to that at the start of this study (Citation8).
Western Blotting Analysis
Then, all rats were sacrificed at the end of this study (2 weeks after start of this study and 4 weeks subsequent to injection of RT2 cells). Orthotopic tumor masses were collected and snap-frozen in liquid nitrogen and stored at −80 °C until analysis.
Sections of the orthotopic tumor masses were washed in PBS, and broken into small tumor pieces using scissors in 0.2 ml T-PER tissue protein extraction reagent (Thermo, USA). Aspirate the PBS, then add 200 μl ice-cold T-PER tissue protein extraction reagent (Thermo, USA), and crushed the tissue. Vortex the mixture, then incubate the mixture on ice for 30 mins, with occasional vortexing. Clarify the lysates by centrifugation at 14,000 rpm at 4 °C for 10 min. Transfer the clarified tissue extracts to clean tube. The clarified tissue extracts should be stored at −80 °C until ready for analysis. Avoid repeated freeze-thaw cycles. In preparation for performing the assay, allow the samples to thaw on ice. Mix well prior to analysis. Determine protein concentration using a suitable method, such as the Protein Extraction Kit (Thermo, USA).
The protein concentration was determined by BCA protein quantitative method (Pierce™ BCA Protein Assay Kit, Thermo, USA). After SDS-PAGE (sodium dodecyl sulfate-polyacrylamide gel electrophoresis) protein electrophoresis, proteins were transferred to a PVDF (polyvinylidene fluoride) membrane. Then 5% nonfat milk was added to block the membrane for 1 h. Subsequently, primary antibodies of hypoxia-inducible factor-1α (HIF-1α) (Abcam, USA), vascular endothelial growth factor (VEGF) (Millipore, USA), Neuropilin-1 (NRP-1) (Cell signaling, USA), CCAAT/enhancer-binding protein homologous protein (CHOP) (Cell signaling, USA), LC-3A/B (Cell signaling, USA), apoptosis-inducing factor-1 (AIF-1) (Cell signaling, USA), cleaved caspase 3 (cell signaling, USA), and β-actin (cell signaling, USA), were added to the membrane and incubated overnight at 4 °C. Then, horseradish peroxidase (HPR)-conjugated secondary antibodies were added to the membrane and incubated for 2 h. The film was then developed using ECL (enhanced chemiluminescence). The internal control was β-actin.
Statistical Analysis
The relative tumor folds, and protein expressions ratio relative to β-actin of HIF-1α, VEGF, NRP-1, CHOP, AIF-1, caspase 3, LC-3A/B, were compared between three groups by one-way analysis of variance (ANOVA) with post-hoc Bonferroni correction. All analyses were performed by commercial software (Stata Corp LP, College Station, TX, USA), and P-values < 0.05 were considered statistically significant.
Results
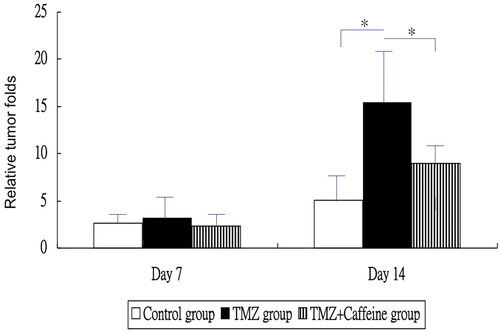
showed the relative tumor folds at each week in three groups. The relative tumor folds were not significantly different between control group (mean ± standard deviation, SD = 2.6 ± 1.3), TMZ group (3.2 ± 2.5), and TMZ plus Caffeine group (2.3 ± 1.7) at day 7 (one-way ANOVA, P = 0.5449) (). The relative tumor fold of TMZ group was higher significantly than that of the control group and that of the TMZ plus Caffeine group at day 14 (one-way ANOVA, P = 0.0003 and post-hoc Bonferroni correction, P < 0.001 and 0.022, respectively). But, the relative tumor fold of TMZ plus Caffeine group was not significantly higher than that of the control group at day 14 (post-hoc Bonferroni correction, P = 0.265). That is, caffeine inhibited glioma growth after TMZ treatment ().
Figure 1. The relative tumor folds at each week in three groups. The relative tumor folds were not significantly different between three groups at day 7 (P = 0.5449). The relative tumor fold of TMZ group was higher significantly than that of the control group and that of the TMZ plus Caffeine group at day 14 (P < 0.001 and 0.022, respectively). But, the relative tumor fold of TMZ plus Caffeine group was not significantly higher than that of the control group at day 14 (P = 0.265).
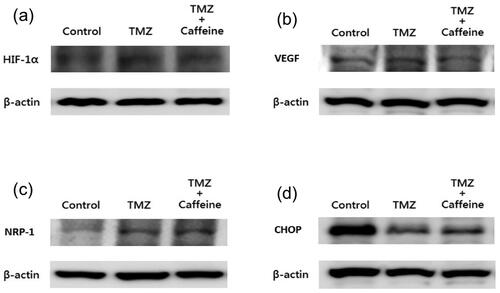
showed the results of Western blotting of HIF-1α, VEGF, NRP-1, and CHOP in three groups at day 14. The expression of HIF-1α (0.052 ± 0.023 for control group; 0.054 ± 0.026 for TMZ group; 0.072 ± 0.025 for TMZ plus Caffeine group, one-way ANOVA, P = 0.1478) (), VEGF (2.011 ± 0.541 for control group; 2.110 ± 0.974 for TMZ group; 2.950 ± 2.017 for TMZ plus Caffeine group, one-way ANOVA, P = 0.2400) (), NRP-1 (0.090 ± 0.034 for control group; 0.125 ± 0.048 for TMZ group; 0.117 ± 0.063 for TMZ plus Caffeine group, one-way ANOVA, P = 0.2678) (), and CHOP (2.159 ± 2.834 for control group; 2.015 ± 1.654 for TMZ group; 2.171 ± 1.166 for TMZ plus Caffeine group, one-way ANOVA, P = 0.9815) (), were not significantly different in the three groups at the end of study.
Figure 2. Western blotting of HIF-1α, VEGF, NRP-1, and CHOP in three groups at day 14. The expression of HIF-1α (a) (P = 0.1478), VEGF (b) (P = 0.2400), NRP-1 (c) (P = 0.2678), and CHOP (d) (P = 0.9815), were not significantly different in three groups at the end of study.
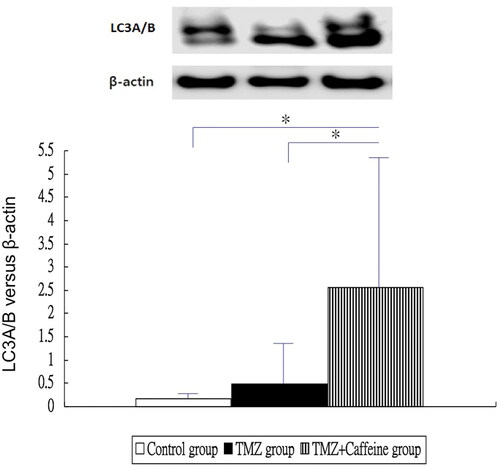
showed the results of Western blotting of LC3A/B in three groups at day 14. The LC3A/B expression of TMZ plus Caffeine group (2.555 ± 2.863) was higher significantly than that of the control group (0.173 ± 0.205) and TMZ group (0.479 ± 1.018) (one-way ANOVA, P = 0.0104 and post-hoc Bonferroni correction, P = 0.016 and 0.041, respectively). But, the LC3A/B expression was not significantly different in the TMZ group (0.479 ± 1.018) and control group (0.173 ± 0.205) (post-hoc Bonferroni correction, P = 1.000).
Figure 3. Western blotting of LC3A/B in three groups at day 14. The LC3A/B expression of TMZ plus Caffeine group was higher significantly than that of the control group and TMZ group (P = 0.016 and 0.041, respectively). But, the LC3A/B expression was not significantly different in the TMZ group and control group (P = 1.000).
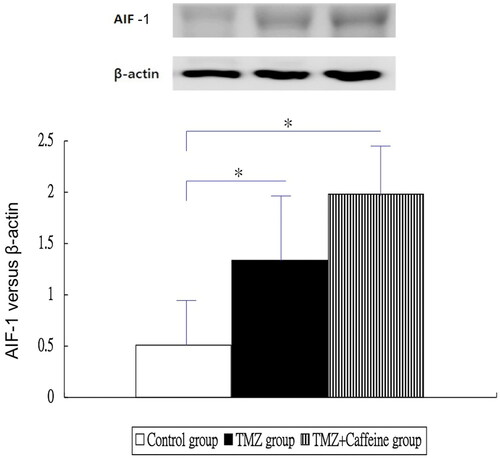
showed the results of Western blotting of AIF-1 in three groups at day 14. The AIF expressions of TMZ group (1.334 ± 0.727) and TMZ plus Caffeine group (1.976 ± 0.532) were higher significantly than that of the control group (0.513 ± 0.539) (one-way ANOVA, P < 0.0001 and post-hoc Bonferroni correction, P = 0.016 and <0.001, respectively). But, the AIF expression of TMZ plus Caffeine group (1.976 ± 0.532) was not significantly higher than that of TMZ group (1.334 ± 0.727) (post-hoc Bonferroni correction, P = 0.076).
Figure 4. Western blotting of AIF-1 in three groups at day 14. The AIF expressions of TMZ group and TMZ plus Caffeine group were higher significantly than that of the control group (P = 0.016 and <0.001, respectively). But, the AIF expression of TMZ plus Caffeine group was not significantly higher than that of TMZ group (P = 0.076).
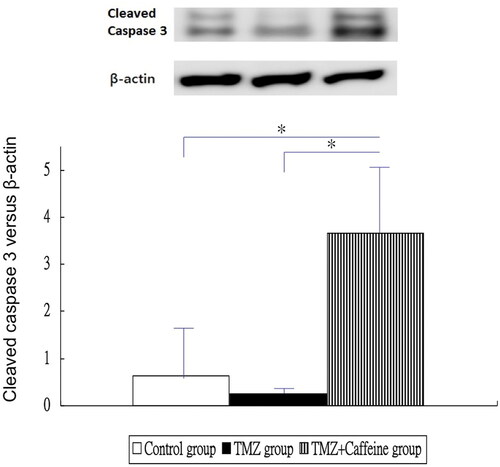
showed the results of Western blotting of cleaved caspase 3 in three groups at day 14. The cleaved caspase-3 expression of TMZ plus Caffeine group (3.655 ± 1.530) was higher significantly than that of the control group (0.645 ± 1.173) and TMZ group (0.248 ± 0.110) (one-way ANOVA, P < 0.0001 and post-hoc Bonferroni correction, P < 0.001 for both comparisons). But, the caspase-3 expression was not significantly different in the TMZ group (0.248 ± 0.110) and control group (0.645 ± 1.173) (post-hoc Bonferroni correction, P = 1.000).
Figure 5. Western blotting of cleaved caspase 3 in three groups at day 14. The cleaved caspase-3 expression of TMZ plus Caffeine group was higher significantly than that of the control group and TMZ group (P < 0.001 for both comparisons). But, the caspase-3 expression was not significantly different in the TMZ group and control group (P = 1.000).
Discussion
This experimental study showed that caffeine might inhibit the growth of TMZ-treated glioma in rats. And, this tumor inhibitory effect of caffeine might be associated with increasing protein expressions of autophagy- and apoptosis-related genes, but not associated with expressions of HIF-1α, VEGF, NRP-1, and CHOP genes.
HIF-1α, VEGF, VEGF-receptor 2 (VEGFR-2), endothelial nitric oxide synthase (eNOS), NRP-1, and NRP-2 were associated with angiogenesis (Citation9). VEGF is best known for its angiogenic activity on endothelial cells, but it also affects neurons, pneumocytes, and other mature cell types as well as endothelial, neural, and hematopoietic progenitors (Citation10). Second, HIF-1α-dependent up-regulation of NRP-1 is also a critical molecular event involved in the vasculogenic mimicry and tumor formation in vivo (Citation11). NRP-1, as a non-tyrosine kinase receptor for VEGF, was overexpressed in a number of human tumors, including GBM (Citation12). NRP-1 would mediate diverse cellular signaling pathways in gliomas, including proliferation, invasion, and migration, as well as tumor angiogenesis (Citation13). However, we did not find caffeine could modulate significantly protein expressions of these angiogenesis-related genes in this animal study.
Caffeine might play different or contradictory roles on various pathophysiologic conditions. For example, caffeine suppressed hepatosteatosis by downregulation of genes associated with lipogenesis, ER stress, and inflammatory responses, and enhancement of lipid oxidation in the zebrafish model (Citation14). Early caffeine treatment protects developing lungs from hyperoxia-induced injury by attenuating ER stress (Citation15). Caffeine is a pleiotropic neuroprotective drug in the developing brain due to its anti-oxidative, anti-inflammatory, and anti-apoptotic properties (Citation16). Contradictorily, caffeine combined with sedative/anesthetic drugs could trigger widespread neuroapoptosis in a mouse model of prematurity (Citation17). Furthermore, the effects and mechanisms of caffeine on cancer treatment belonged to other stories.
Some agents could induce autophagic cell death and/or apoptosis of cancer cells mediated by ER stress and other mechanisms in vitro. For example, luteolin induced a lethal ER stress response and mitochondrial dysfunction in glioblastoma cells by increasing intracellular reactive oxygen species (ROS) levels (Citation18). Minocycline could inhibit glioma growth through ER stress-induced autophagic cell death and apoptosis (Citation19). Fluoxetine synergizes with TMZ to induce the CHOP-dependent ER stress-related apoptosis pathway in glioma cells (Citation20). As for caffeine, it could inhibit ultraviolet-induced skin carcinogenesis via increasing a DNA repair gene (NEIL3) expression and increasing the ataxia telangiectasia and rad3 (ATR)-related apoptosis (Citation21). Caffeine could induce premature chromosome condensation and result in cell death in root meristems of Vicia faba (Citation22). However, caffeine modulated the cytotoxicity of doxorubicin, gemcitabine, and paclitaxel in SH-SY5Y cells via different mechanisms in vitro. Pretreatment with caffeine (100 nM and 10 μM) sensitized SH-SY5Y cells to doxorubicin-induced toxicity, decreased total cell ROS production but increased mitochondrial ROS production, and increased apoptosis. In contrast, caffeine (10 nM and 10 μM) protected cells against gemcitabine-induced toxicity and apoptosis. Similarly, 1 μM and 10 μM caffeine protected cells against paclitaxel-induced toxicity and mitochondrial ROS production (Citation23). In this animal model of RT2 glioma, however, CHOP expression did not elevated significantly in the TMZ and TMZ plus Caffeine (100 mg/kg once daily for 2 weeks) groups. These discrepancies might be due to the differences in vitro or in vivo experiments, cancer types, and/or treatment protocols.
Actually, the activation of autophagy might play a contradictory role on the viability of glioma. Autophagy appeared earlier than apoptosis after irradiation on MG cells (Citation24). Tiwari et al. (Citation25) reported that N-(4-hydroxyphenyl) retinamide (4-HPR)-induced autophagy in glioma cell may provide survival advantage, but inhibition of autophagy may enhance the cytotoxicity of 4-HPR to glioma. Resveratrol induced autophagy in human U251 glioma cells, but autophagy inhibitors can increase the cytotoxicity of resveratrol to glioma cells (Citation26). Bufalin could induce autophagy, but autophagy itself played a cytoprotective role in bufalin-induced ER stress and cell death (Citation27). Chloroquine drugs blocked autophagy and triggers ER stress, thereby increased the chemosensitivity of glioma cells to TMZ (Citation28). As for caffeine, Sailki et al. (Citation29) reported that caffeine induced apoptosis by enhancement of autophagy via PI3K/Akt/mTOR/p70S6K inhibition. But, Pitaksalee et al. (Citation30) claimed that caffeine could potentiate methamphetamine toxicity on SH-SY5Y cells through inhibition of autophagy. Now, we showed that caffeine increased expression of LC3A/B in TMZ-treated glioma in rats. More study was needed to confirm the exact mechanism about caffeine-related glioma cell death in animals.
There were some weak points in this study. First, TMZ would be given to patients with malignant glioma for several courses in a period clinically. The findings and related expressions of gene/protein might alter with time. However, the relative size of glioma was too high in the end of 2nd week in this study. So, we had to set the end point of this study in the 2nd week. Second, based on our protocol, we had just known that the caffeine could prevent re-growth of glioma after cessation of TMZ, but could not tell the readers whether caffeine played an additive or synergistic therapeutic effect with TMZ on inhibition of glioma. Third, only one dose of caffeine was used in this study. It is better to use multiple doses of caffeine to compare chemopreventive measures and/or possible toxic effects. Fourth, we had not investigated the effect on glioma cells inoculated intracerebrally. Also, we had not performed histological examinations of gliomas including tumor vascularity, necrosis, and apoptosis following combination treatment of caffeine and TMZ.
Conclusion
This animal study showed that caffeine might inhibit the growth of TMZ-treated glioma. And, the inhibitory effect of caffeine on glioma might be associated with increasing protein expressions of autophagy- and apoptosis-related genes, but not associated with hypoxia, angiogenesis, and ER stress. Long-term animal and/or clinical studies should be conducted in the future.
Acknowledgments
The funders had no role in study design, data collection and analysis, decision to publish, or preparation of the manuscript.
Disclosure Statement
The authors declare that they have no competing interests.
References
- Miyata H, Ashizawa T, Iizuka A, Kondou R, Nonomura C, Sugino T, Urakami K, Asai A, Hayashi N, Mitsuya K, et al. Combination of a STAT3 inhibitor and an mTOR Inhibitor against a temozolomide-resistant glioblastoma cell line. Cancer Genomics Proteomics. 2017;14(1):83–91. doi:https://doi.org/10.21873/cgp.20021
- Liu JD, Song LJ, Yan DJ, Feng YY, Zang YG, Yang Y. Caffeine inhibits the growth of glioblastomas through activating the caspase-3 signaling pathway in vitro. Eur Rev Med Pharmacol Sci. 2015;19(16):3080–3088.
- Chen JC, Hwang JH. Effects of caffeine on cell viability and activity of histone deacetylase 1 and histone acetyltransferase in glioma cells. Ci Ji Yi Xue Za Zhi. 2016;28(3):103–108. doi:https://doi.org/10.1016/j.tcmj.2016.06.005
- Janss AJ, Levow C, Bernhard EJ, Muschel RJ, McKenna WG, Sutton L, Phillips PC. Caffeine and staurosporine enhance the cytotoxicity of cisplatin and camptothecin in human brain tumor cell lines. Exp Cell Res. 1998;243(1):29–38. doi:https://doi.org/10.1006/excr.1998.4122
- Chen JC, Hwang JH, Chiu WH, Chan YC. Tetrandrine and caffeine modulated cell cycle and increased glioma cell death via caspase-dependent and caspase-independent apoptosis pathways. Nutr Cancer. 2014;66(4):700–706. doi:https://doi.org/10.1080/01635581.2014.902974
- Holick CN, Smith SG, Giovannucci E, Michaud DS. Coffee, tea, caffeine intake, and risk of adult glioma in three prospective cohort studies. Cancer Epidemiol Biomarkers Prev. 2010;19(1):39–47. doi:https://doi.org/10.1158/1055-9965.EPI-09-0732
- Kang SS, Han KS, Ku BM, Lee YK, Hong J, Shin HY, Almonte AG, Woo DH, Brat DJ, Hwang EM, Yoo SH, et al. Caffeine-mediated inhibition of calcium release channel inositol 1,4,5-trisphosphate receptor subtype 3 blocks glioblastoma invasion and extends survival. Cancer Res. 2010;70(3):1173–1183. doi:https://doi.org/10.1158/0008-5472.CAN-09-2886
- Chen Y, Chen JC, Tseng SH. Tetrandrine suppresses tumor growth and angiogenesis of gliomas in rats. Int J Cancer. 2009;124(10):2260–2269. doi:https://doi.org/10.1002/ijc.24208
- Schneider BP, Radovich M, Flockhart DA, Carpenter JS, Li L, Robarge JD, Storniolo AM, Hancock BA, Skaar TC, Sledge GW. Exploratory study evaluating the association of polymorphisms of angiogenesis genes with hot flashes. Breast Cancer Res Treat. 2009;116(3):543–549. doi:https://doi.org/10.1007/s10549-008-0178-z
- Hong X, Jiang F, Kalkanis SN, Zhang ZG, Zhang X, Zheng X, Mikkelsen T, Jiang H, Chopp M. Decrease of endogenous vascular endothelial growth factor may not affect glioma cell proliferation and invasion. J Exp Ther Oncol. 2007;6(3):219–229.
- Misra RM, Bajaj MS, Kale VP. Vasculogenic mimicry of HT1080 tumour cells in vivo: critical role of HIF-1α-neuropilin-1 axis. PLoS One. 2012;7(11):e50153. doi:https://doi.org/10.1371/journal.pone.0050153
- Li X, Tang T, Lu X, Zhou H, Huang Y. RNA interference targeting NRP-1 inhibits human glioma cell proliferation and enhances cell apoptosis. Mol Med Rep. 2011;4(6):1261–1266. doi:https://doi.org/10.3892/mmr.2011.550
- Chen L, Zhang G, Shi Y, Qiu R, Khan AA. Neuropilin-1 (NRP-1) and magnetic nanoparticles, a potential combination for diagnosis and therapy of gliomas. Curr Pharm Des. 2015;21(37):5434–5449. doi:https://doi.org/10.2174/1381612821666150917092658
- Zheng X, Dai W, Chen X, Wang K, Zhang W, Liu L, Hou J. Caffeine reduces hepatic lipid accumulation through regulation of lipogenesis and ER stress in zebrafish larvae. J Biomed Sci. 2015;22(1):105. doi:https://doi.org/10.1186/s12929-015-0206-3
- Teng RJ, Jing X, Michalkiewicz T, Afolayan AJ, Wu TJ, Konduri GG. Attenuation of endoplasmic reticulum stress by caffeine ameliorates hyperoxia-induced lung injury. Am J Physiol Lung Cell Mol Physiol. 2017;312(5):L586–L598. doi:https://doi.org/10.1152/ajplung.00405.2016
- Endesfelder S, Weichelt U, Schiller C, Sifringer M, Bendix I, Bührer C. Caffeine protects against anticonvulsant-induced neurotoxicity in the developing rat brain. Neurotox Res. 2017;32(3):460–472. doi:https://doi.org/10.1007/s12640-017-9768-z
- Cabrera OH, O’Connor SD, Swiney BS, Salinas-Contreras P, Manzella FM, Taylor GT, Noguchi KK. Caffeine combined with sedative/anesthetic drugs triggers widespread neuroapoptosis in a mouse model of prematurity. J Matern Fetal Neonatal Med. 2017;30(22):2734–2741. doi:https://doi.org/10.1080/14767058.2016.1261400
- Wang Q, Wang H, Jia Y, Pan H, Ding H. Luteolin induces apoptosis by ROS/ER stress and mitochondrial dysfunction in gliomablastoma. Cancer Chemother Pharmacol. 2017;79(5):1031–1041. doi:https://doi.org/10.1007/s00280-017-3299-4
- Liu WT, Huang CY, Lu IC, Gean PW. Inhibition of glioma growth by minocycline is mediated through endoplasmic reticulum stress-induced apoptosis and autophagic cell death. Neuro Oncol. 2013;15(9):1127–1141. doi:https://doi.org/10.1093/neuonc/not073
- Ma J, Yang YR, Chen W, Chen MH, Wang H, Wang XD, Sun LL, Wang FZ, Wang DC. Fluoxetine synergizes with temozolomide to induce the CHOP-dependent endoplasmic reticulum stress-related apoptosis pathway in glioma cells. Oncol Rep. 2016;36(2):676–684. doi:https://doi.org/10.3892/or.2016.4860
- Li X, Cornelis MC, Liang L, Song F, De Vivo I, Giovannucci E, Tang JY, Han J. A genome-wide analysis of gene-caffeine consumption interaction on basal cell carcinoma. Carcinogenesis. 2016;37(12):1138–1143.
- Rybaczek D, Musiałek MW, Balcerczyk A. Caffeine-induced premature chromosome condensation results in the apoptosis-like programmed cell death in Root Meristems of Vicia faba. PLoS One. 2015;10(11):e0142307. doi:https://doi.org/10.1371/journal.pone.0142307
- Hall S, Anoopkumar-Dukie S, Grant GD, Desbrow B, Lai R, Arora D, Hong Y. Modulation of chemotherapy-induced cytotoxicity in SH-SY5Y neuroblastoma cells by caffeine and chlorogenic acid. Toxicol Mech Methods. 2017;27(5):363–369. doi:https://doi.org/10.1080/15376516.2017.1296049
- Jo GH, Bögler O, Chwae YJ, Yoo H, Lee SH, Park JB, Kim YJ, Kim JH, Gwak HS. Radiation-induced autophagy contributes to cell death and induces apoptosis partly in malignant glioma cells. Cancer Res Treat. 2015;47(2):221–241. doi:https://doi.org/10.4143/crt.2013.159
- Tiwari M, Bajpai VK, Sahasrabuddhe AA, Kumar A, Sinha RA, Behari S, Godbole MM. Inhibition of N-(4-hydroxyphenyl)retinamide-induced autophagy at a lower dose enhances cell death in malignant glioma cells. Carcinogenesis. 2008;29(3):600–609. doi:https://doi.org/10.1093/carcin/bgm264
- Li J, Qin Z, Liang Z. The prosurvival role of autophagy in Resveratrol-induced cytotoxicity in human U251 glioma cells. BMC Cancer. 2009;9:215. doi:https://doi.org/10.1186/1471-2407-9-215
- Shen S, Zhang Y, Wang Z, Liu R, Gong X. Bufalin induces the interplay between apoptosis and autophagy in glioma cells through endoplasmic reticulum stress. Int J Biol Sci. 2014;10(2):212–224. doi:https://doi.org/10.7150/ijbs.8056
- Golden EB, Cho HY, Hofman FM, Louie SG, Schönthal AH, Chen TC. Quinoline-based antimalarial drugs: a novel class of autophagy inhibitors. Neurosurg Focus. 2015;38(3):E12. doi:https://doi.org/10.3171/2014.12.FOCUS14748
- Saiki S, Sasazawa Y, Imamichi Y, Kawajiri S, Fujimaki T, Tanida I, Kobayashi H, Sato F, Sato S, Ishikawa K, et al. Caffeine induces apoptosis by enhancement of autophagy via PI3K/Akt/mTOR/p70S6K inhibition. Autophagy. 2011;7(2):176–187. doi:https://doi.org/10.4161/auto.7.2.14074
- Pitaksalee R, Sanvarinda Y, Sinchai T, Sanvarinda P, Thampithak A, Jantaratnotai N, Jariyawat S, Tuchinda P, Govitrapong P, Sanvarinda P. Autophagy inhibition by caffeine increases toxicity of methamphetamine in SH-SY5Y neuroblastoma cell line. Neurotox Res. 2015;27(4):421–429. doi:https://doi.org/10.1007/s12640-014-9513-9