
Abstract
Pretreatment inflammation-based biomarkers and the prognostic nutrition index (PNI) have been used to evaluate prognosis in cancer patients. However, few studies have focused on the prognostic value of post-treatment inflammation-based biomarkers and PNI in ESCC patients. We aimed to investigate the values of pre/post-treatment inflammatory parameters and PNI for establishing a nomogram to predict overall survival (OS) in ESCC patients. A retrospective review was performed on 268 ESCC patients with esophagectomy. The prognostic values of inflammatory and nutrition indexes were evaluated. Based on the results of multivariable Cox analysis, a nomogram was developed. The predictive accuracy and discriminative ability of the nomogram were determined using the concordance-index (C-index) and a calibration curve and subsequently compared to tumor-node-metastasis (TNM) staging by C-index, receiver operating characteristic (ROC) and decision curve analysis (DCA). PreSII, PostSII, PrePNI, N stage, and TNM classification were assembled into a nomogram. The C-index of the nomogram was 0.774, and the area under curve (AUC) of the nomogram was 0.862. DCA demonstrated that the established nomogram was a better predictive model compared to the TNM system. The developed nomogram with superior predictive ability provides more valuable prognostic information for patients and clinicians than TNM classification.
Introduction
Esophageal cancer (EC) remains one of the leading causes of cancer death and disease burden across the world (Citation1). Data from the Global Burden of Diseases, Injuries, and Risk Factors Study 2017 (GBD) have shown that age, gender, tobacco smoking, alcohol consumption, and body mass index (BMI) are risk factors at the global level, and that the absolute number of new cases and mortality has increased due to the population growth and aging (Citation2). Previous studies into cancer statistics have demonstrated that more than 60% of patients were diagnosed during late stage (Citation3, Citation4) and the 5-year survival rate of ESCC patients was below 30% (Citation5, Citation6). Although age-standardised incidence and mortality rates of EC have decreased over the past thirty years, the poor prognosis and survival rate of EC emphasizes the fact that effective measures should be undertaken to reduce the risk factors and improve the survival rate.
Histologically, there are two predominant subtypes of primary esophageal cancer: esophageal squamous cell carcinoma (ESCC) and esophageal adenocarcinoma (EAC). It is well recognized that EAC is the major subtype in the high-income countries, whereas there is a higher incidence of ESCC in developing countries (Citation7) such as South Africa and countries in Eastern to Central Asia, suggesting ethnicity, genetics, and lifestyle are important factors in the development of ESCC (Citation8). In the clinic, the most common cancer-related prognosis assessment system is the American Joint Committee on Cancer (AJCC) staging system, which establishes tumor-node-metastasis (TNM) subclassification based on the depth of invasion of the primary tumor (T), lymph node involvement (N), and extent of metastatic disease (M) (Citation9). However, the TNM classification only focuses on tumor-specific characteristics without considering other factors. Additionally, the ESCC patients diagnosed at the same TNM stage who received similar therapy usually presented distinct outcomes, suggesting that it is imperative to develop a new tool that can assist the eighth edition AJCC-TNM staging system to provide reliable and accurate prognosis in individual patients (Citation9).
Recently, accumulating studies have elucidated that pretreatment inflammatory biomarkers and nutrition status are associated with tumor progression and metastasis, which possess a significant predictive and prognostic value in a variety of cancers (Citation10, Citation11). To the best of our knowledge, systemic inflammation-based bio-factors are capable of reflecting host inflammatory and immune responses in surgically resected EC patients (Citation12). The pretreatment neutrophil lymphocyte ratio (pre-NLR), pretreatment platelet lymphocyte ratio (pre-PLR), pretreatment lymphocyte monocyte ratio (pre-LMR), pretreatment systematic immune-inflammation index (pre-SII), and the pretreatment prognostic nutritional index (pre-PNI), have been shown to be efficacious in predicting survival outcomes in several studies (Citation13–16). Moreover, a previous study has also shown that posttreatment NLR (post-NLR) is associated with the clinical outcome of ESCC patients (Citation17). However, few studies have combined pretreatment/post-treatment inflammatory biomarkers and nutrition index to evaluate the efficacy of these clinicopathological parameters in ESCC patients.
Nomograms are widely used graphical calculation tools, which can incorporate continuous or categorical clinical variables. The effect of clinical variables on the specific outcome can be represented in the format of axes, and risk points are attributed according to the prognostic/predictive importance of the variable of interest (Citation18). Thus, this study aimed to investigate and verify the prognostic value of these dynamic inflammatory parameters, and to establish a prognostic nomogram that provides more accurate prediction in the prognosis of ECSS patients.
Materials and Methods
Patient Enrollment
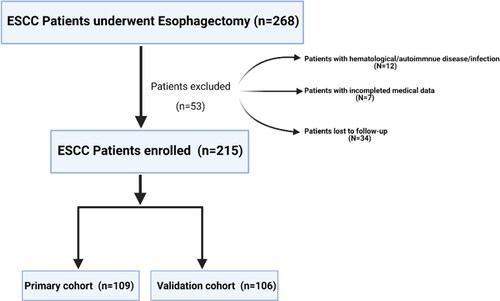
We retrospectively reviewed a total of 268 patients who received combined thoracoscopic-laparoscopic esophagectomy between August 2010 and March 2014 at the department of thoracic surgery, the first affiliated hospital of University of Science and Technology of China (USTC). The inclusion criteria were as follows: (Citation1) patients with esophageal squamous carcinoma located in the thoracic esophagus and esophagogastric junction; (Citation2) patients with histologically diagnosed ESCC; (Citation3) patients whose preoperative and postoperative peripheral blood laboratory results were obtained at 1-5-days before and after surgery. The exclusion criteria were as follows: (Citation1) patients who had undergone preoperative chemotherapy or radiotherapy; (Citation2) patients with hematological, autoimmune diseases or infection; (Citation3) patients lacking clinical variables and follow-up information. In total, 53 patients were excluded from this analysis. The detailed enrollment process is shown in . Finally, a total of 215 patients were enrolled in this study and were divided into a training cohort and a validation cohort with the cutoff date of December 21, 2012. Overall survival (OS) was defined as the time from the date of discharge to death or the last date of follow-up for patients alive.
Figure 1. Flowchart of the enrollment process.
All patients enrolled in this study gave signed informed consent for the study protocol, and this study was approved by the Medical Ethics Committee of the first affiliated hospital of USTC. Patients were followed up in the outpatient department every 3-6 mo, for the first two years from the date of discharge, and then annually. The content of the follow-up form included 1, 3, 5-year survival rate, physical examination, chest CT, and esophagoscopy (if necessary). The last follow-up was on January 18th, 2019.
Clinical Systemic Inflammatory and Nutrition Indexes
Peripheral blood was obtained within 5 day before and after the operation to measure the levels of neutrophils, lymphocytes, platelets, monocytes, and serum albumin. Blood cell counts and albumin were tested by the DxC800 clinical chemistry analyzer and LH750 hematology analyzer (Beckman Coulter, America): NLR = neutrophil/lymphocyte count; PLR = platelet/lymphocyte count; LMR = lymphocyte/monocyte; SII = platelet*neutrophil/lymphocyte; PNI = 10*serum albumin (g/dl) +0.05*lymphocyte. The optimal cutoff values of the indexes above were obtained by receiver operating characteristic (ROC) analysis based on OS.
Statistical Analysis
Statistical analysis was carried out by using IBM SPSS (version 25.0, Chicago, IL) software and R language with Hmisc, ggplot2, rms, rmda, and survival ROC packages (version 3.6.3). Normally distributed continuous data were presented as mean ± standard deviation, while discrete data were presented as count and proportion. Continuous variables were assessed using t-test, and categorical variables were compared by using the χ2 test or Fisher’s exact test. Log-rank test (categorical variables) or Cox regression analysis (continuous variables) was used to preliminarily identify clinical risk factors related to OS in the primary cohort. To avoid neglecting potential biomarkers that might be of clinical significance, parameters which indicated p < 0.1 in univariate analysis were selected to perform multivariate analysis. Multivariate Cox proportional hazard models were adopted to determine prognostic indexes, with a significance level set at two-sided 0.05. Hazard ratios (HRs) and 95% confidence intervals (CIs) of these indexes were estimated to quantify the strength of these associations. Based on the results of the multivariable Cox analysis, a nomogram was formulated. The time-dependent ROC curve was used to estimate and compare the discrimination ability of the nomogram for predicting 3- and 5- year OS with area under curve (AUC) value in the primary and validation cohort. Decision curve analysis (DCA) was used to evaluate the clinical application of prediction models by quantifying the net benefits (Citation19). A P value less than 0.05 was considered to be statistically significant.
Results
Clinicopathological Characteristics of Patients
This retrospective study enrolled 215 cases of ESCC patients, including 109 cases (79 males and 30 females) in the primary cohort and 106 cases (79 males and 27 females) in the validation cohort (). The median age in the primary cohort and validation cohort were 66 years (range from 41-87 years) and 64 years (range from 42-81 years) respectively. In the primary cohort, the median OS was 59.6 mo, (range from 4-100 mo,), and the rate of 3- and 5- year OS was 61.5% and 44.9%. In the validation cohort, the median OS was 45.2 mo, and the rate of 3- and 5- year OS was 58.4% and 51.9%.
Table 1. Characteristics of patients in the primary and validation cohort.
In the primary cohort, the median of pre-NLR, pre-PLR, pre-LMR, Pre-SII and pre-PNI were 2.59 (range 0.81-7.43), 106.2 (range 38.52-235.29), 3.72(range 0.68-19.23), 468.7 (range 129.81-3588.24), and 384.6(range 243-980), respectively. Compared to the post-treatment inflammatory biomarkers and nutrition index, there was a significant increase in post-NLR in comparison with pre-NLR by a median of 15.98, as well as a post-PLR increase by a median of 218.9. Similarly, compared to the pre-SII, there was a large increase in post-SII by a median of 2146.8. Conversely, the post-LMR and the post-PNI were significantly decreased by a median of 1.31 and 293.3. Additionally, the validation cohort also had a similar trend to the primary cohort.
Selection of Optimal Cutoff Values for Pre-/Post-Treatment NLR, PLR, LMR, SII and PNI
After collecting all the baseline characteristics, we computed the optimal cutoff points for the pre-/post-treatment inflammatory biomarkers and nutritional index using ROC analysis which compares sensitivity vs. specificity in a range of values to predict a dichotomous clinical outcome according to the OS (Citation20). The optimal cutoff point was calculated by the Youden index (sensitivity + specificity −1) which measures the effectiveness of these clinical variables and enables the selection of an optimal threshold value (Citation21). In the primary cohort, the pretreatment AUC of the ROC curves were 0.655, 0.545, 0.517, 0.586, 0.596 for the PreNLR, PrePLR, PrePNI, PreSII, and PreLMR, respectively (), and 0.540, 0.538, 0.510, 0.583, 0.564 for PostNLR, PostPLR, PostPNI, PostSII, and PostLMR, respectively ().
Figure 2. Receiver operating characteristic curve analysis for the optimal cutoff value. (a) The areas under the curve for overall survival were 0.655, 0.545, 0.517, 0.586, 0.596 for the PreNLR, PrePLR, PrePNI, PreSII, and PreLMR. (b) The areas under the curve for overall survival were 0.540, 0.538, 0.510, 0.583, 0.564 for PostNLR, PostPLR, PostPNI, PostSII, and PostLMR.
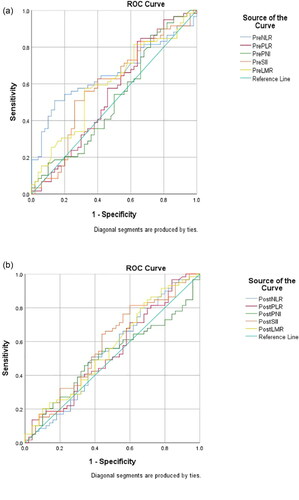
Based on the Youden index, the optimal cutoff values for the prediction of survival were 2.86 for PreNLR, 77.2 for PrePLR, 334 for PrePNI, 344 for PreSII, 3.59 for PreLMR, 7.45 for PostNLR, 87.82 for PostPLR, 301.5 for PostPNI, 1043.5 for PostSII, and 0.83 for PostLMR.
Identification of OS Relevant Factors
In the primary cohort, univariate survival analysis revealed that N stage, TNM stage, PreNLR, PrePLR, PrePNI, PreSII, PreLMR, PostPLR, and PostSII were associated with OS probability, while no significant relationship was found between prognosis and age(p = 0.612), gender (p = 0.168), smoking(p = 0.081), drinking(p = 0.728), intraoperative blood loss(p = 0.531) and operation time(p = 0.96) (). Multivariate analysis further confirmed that N stage [HR, 2.323; 95%CI, 1.159-4.656; P = 0.0175], TNM stage [I vs II: HR, 3.075; 95%CI, 1.196-7.906; P = 0.0197; I vs III: HR, 2.838; 95%CI, 1.174-6.864; P = 0.0206], PreSII (HR,0.458; 95%CI, 0.249-0.842; P = 0.012), PostSII (HR,0.467; 95%CI, 0.218-0.998; P = 0.0493), and PrePNI (HR,0.358; 95%CI, 0.166-0.773; P = 0.0089) were independently associated with OS in ESCC patients ().
Figure 3. The forest plot of the multivariate analysis of clinical, inflammatory, and nutritional indexes in predicting the OS in the ESCC patients.
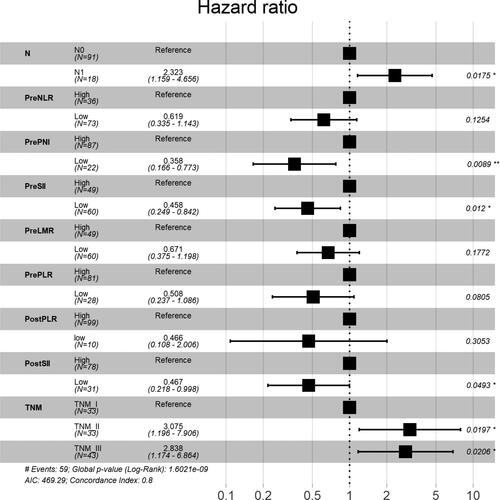
Table 2. Univariate analyze for predicting overall survival in patients.
Establishment and Verification of the Nomogram
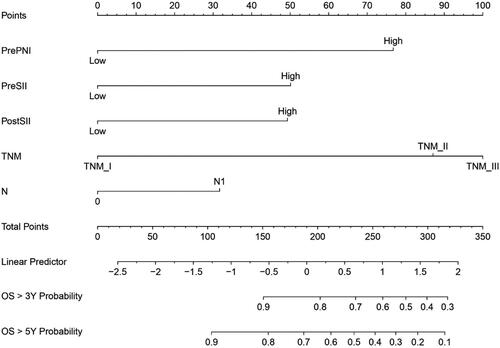
In order to predict the OS for patients with ESCC, based on the results of the multivariate analysis, four variables, including N stage, TNM stage, PreSII, PostSII and PrePNI, were eventually integrated in the nomogram to predict the 3-, 5-year survival of the primary cohort ().
Figure 4. Nomogram for predicting 3-year and 5-year survival probability of ESCC patients after surgery. This nomogram is used by calculating the points for each independent factor. The total score is identified on the total point scale to determine the probability of OS.
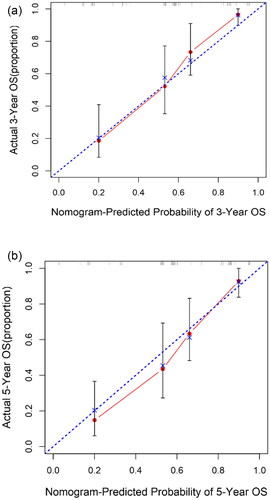
The concordance-index (C-index) is a useful evaluation value and was applied to evaluate prognostic nomogram performance (Citation22), The C-index of the nomogram was 0.774. The 3- and 5- year calibration curve showed that predicted survival corresponded with actual survival (). Similarly, a consistent result was also identified in the validation cohort. In the validation set, the C-index of the nomogram for OS prediction was 0.677.
Figure 5. Calibration curve for nomogram. (a) 3-year nomogram in the primary set, and (b) 5-year nomogram in the primary set. X-axis is nomogram-predicted probability of survival (ESCC). Y-axis is observed probability of the survival. Blue broken line = ideal nomogram; Red line = developed nomogram. Red dots with bars represent the nomogram performance with 95%CI.
Comparison of Predictive Accuracy between Constructed Nomogram and TNM Classification
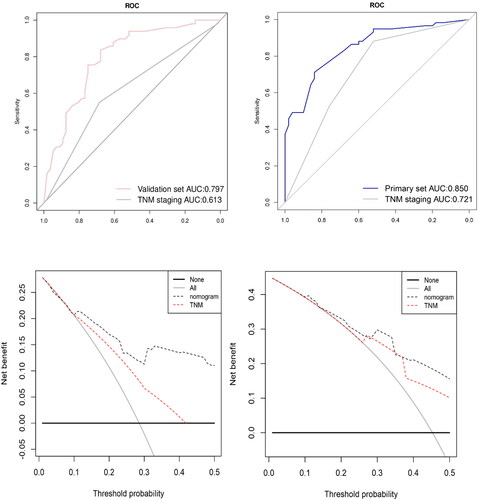
To further evaluate the predictive ability of the nomogram, we compared the predictive accuracy of the nomogram with that of TNM stage in the primary and validation cohorts using different methods. The C-index of the nomogram was better than that of the TNM stage (Primary set C-index 0.657 and the validation set C-index 0.618) alone in both sets. Moreover, ROC analysis demonstrated that the prediction of the nomogram was better than the TNM stage alone (AUC 0.850 vs 0.721 for the primary cohort, AUC 0.797 vs 0.613 for the validation set) (). Finally, decision curve analysis (DCA) was used to evaluate the two prediction models: nomogram and traditional TNM stage (Citation19). As shown in and d, the nomogram had a better efficacy in predicting 3- and 5-year OS.
Figure 6. Comparison of predictive accuracy between constructed nomogram and TNM classification. (a) ROC curves were used to compare the prediction accuracy between the nomogram and TNM staging in primary set. (b) ROC curves were used to compare the prediction accuracy between the nomogram and TNM staging in validation set. (c) Decision curve analysis (DCA) was used to evaluate the two prediction models: nomogram and traditional TNM stage in primary set and in validation set (d).
Discussion
Although accumulating evidence has revealed that systemic inflammatory response (SIR) and the nutritional status of cancer patients are associated with clinical outcomes, the dynamic change of the pre-/post- treatment SIR and nutrition index in surgically resected ESCC patients remains largely unknown. In the present study, we retrospectively analyzed a consecutive cohort of 215 ESCC patients who received curative esophagectomy and found that most inflammatory factors and PrePNI could predict the prognosis of ESCC patients, except for PostNLR and PostPNI. Moreover, PreSII, PostSII and PrePNI were superior to the other biomarkers in prediction, with higher SII and lower PrePNI indicating poor OS. Combined with TNM stage and N stage, we developed a graphic nomogram to predict survival outcome after curative resection in ESCC patients. Importantly, the nomogram showed a better predictive ability and clinical application than TNM stage alone in the patients, which could be helpful to design tailor-made regimens for ESCC patients.
In recent years, research into the correlation between inflammation and cancer has shown that some kinds of immune cells in the tumor microenvironment not only lose their antitumor functions but also enhance cancer cell proliferation by activating several critical intracellular signaling pathways such as NF-κB pathway (Citation23). Simultaneously, these infiltrated inflammatory cells such as neutrophils and macrophages could secrete various kinds of cytokines which play important roles during different stages of carcinogenesis, including angiogenesis and invasion (Citation24, Citation25). A single-cell transcriptomic analysis by Yao et al has identified that ESCC was initiated and developed through an early suppression of the CD8+ response against the initial esophageal injury, resulting in the accumulation and activation of macrophages and neutrophils. This may generate a chronic inflammatory microenvironment that increases carcinogen-transformed epithelial cell survival and proliferation (Citation26). In this study, we identified the prognostic value of SII (PreSII and PostSII) which is a systemic inflammatory marker calculated by neutrophil, platelets, and lymphocyte counts. It is well accepted that cancers as an unhealed wound recruit neutrophils during the early initiation phases of tumorigenesis, and persistent neutrophil infiltration promotes tumor progression, metastasis, and angiogenesis by inhibiting adaptive immune activity, such as T cell-dependent anti-tumor immunity (Citation27–29). In addition, activated platelets have been identified as inducing hematopoietic and immune cell migration toward a tumor site, resulting in metastasis and cancer progression by forming neutrophil extracellular trap (NETs) which are able to “hide” cancer cells from immunological surveillance (Citation30). Recent evidence has suggested that platelets can also secrete platelet-derived growth factors and pro-angiogenic proteins which contribute to tumor migration and metastasis (Citation31). Lymphocytes have been identified to play an important role in attacking cancer cells by interacting with tumor-related antigens, and cancer cells could exploit immune checkpoints to inactivate tumor-infiltrating lymphocytes (TILs). Several clinical trials have shown that higher lymphocyte infiltration is associated with better prognosis (Citation32, Citation33). To some extent, SII could reflect the balance between host inflammatory status and immune responses in cancer patients.
ESCC is a catabolic inflammatory-disease whose typical symptoms are dysphagia and weight loss (Citation34). It has been recognized that undernourishment in patients with cancer could lead to poor therapeutic responses and prognosis (Citation35, Citation36). The prognostic nutrition index calculated using serum albumin and total lymphocyte count suggests that these factors are associated with physiological activities of the human body and inflammation (Citation37). Albumin plays a critical role in modulating osmotic colloid pressure, lipid metabolism and intravascular molecule transportation (Citation38). The level of serum albumin in peripheral blood not only reflect liver function and nutritional status but also has a correlation with stress, hydration state, aging, and inflammation. The understanding of the precise mechanism of low albumin level in patients with cancer remains inconclusive. The underlying explanation of hypoalbuminemia is that cancer cells produce a systemic release of pro-inflammatory cytokines and unexpected growth factors which induce hepatocytes to downregulate their production of albumin (Citation39).
Our results were consistent with similar studies which only investigated the association between pretreatment inflammatory/nutrition indexes and OS in ESCC patients. Shao et al have shown that PreNLR and C-reactive protein albumin (CRP/Alb) ratio had high sensitivity and specificity in predicting survival in ESCC patients with radical esophagectomy (Citation40). Additionally, Gao and coworkers have demonstrated that PreSII has superior prognostic value in predicting OS and disease-free survival (DFS) for ESCC patients (Citation41). More recently, research into the impact of inflammatory biomarkers on short-term outcomes (STO) of ESCC have elucidated that PreNLR possessed the best predictive value in ESCC patients undergoing radiotherapy and chemoradiotherapy. Nevertheless, several publications presented results that are distinct from the results above. Liu et al have shown that PrePLR and PreLMR were potential prognostic biomarkers in surgically resected ESCC patients, but not PreNLR (Citation42). The underlying reasons which generated the inconsistencies between those results are listed as follows: Firstly, the ESCC patients enrolled in different analyses may have received differing treatments; Secondly, most studies mentioned above were single-center analyses, in which there is a potential for selection bias. Moreover, in terms of the indexes, the classification criteria and cutoff values in the studies differ from each other. These factors may contribute to the different results in predicting the impacts of inflammatory and nutritional indexes.
Nomograms are statistical tools used commonly to estimate prognosis in oncology (Citation43). Even though the TNM system remains the gold standard in the prediction of solid tumor prognosis, nomograms have appeared as a simpler graphical representation of a statistical model that estimates the survival of individual patients by combining multiple clinical variables (Citation44). To the best of our knowledge, this is the first nomogram that describes the prognostic significance of SII and PNI in ESCC patients who underwent radical esophagectomy. The ROC curves and DCA analysis suggested our nomogram had a higher prediction accuracy than TNM staging alone, which showed that nomograms represent an advancement in the development of prognostication tools.
Even though our nomogram showed a good predictive accuracy for OS, there remains several limitations in this study. Firstly, due to the lack of golden standard criteria to confirm the cutoff value of the aforementioned indexes, the cutoff values used in this study are different from those used in other studies. Secondly, this analysis is a retrospective, nonrandomized, single institution study with a small number of ESCC cases. For further high-level investigation, a randomized, multi-center collaborative study is needed to confirm the results. Thirdly, in this study, we only collected data on systematic inflammatory biomarkers and nutrition status at 1-5 day before and after the surgery, which only present the significance of these clinical variables in a short term. Lastly, this dataset only consisted of ESCC patients with surgical resection with a 5-year follow up.
Conclusion
Clinical inflammatory and nutrition indexes have prognostic value for ESCC patients with radical esophagectomy. A visual nomogram established by incorporating SII and PrePNI with several clinicopathological variables showed a better predictive ability than TNM classification alone. Although precise biological mechanisms of the indexes in predicting OS are not completely understood, the nomogram may provide valuable prognostic information for patients and clinicians.
Author Contribution
All authors have read and approved the manuscript for publication.
Juan Li drafted the manuscript, analyzed and interpreted the data. Xinyu Mei made the figures and tables. Di Sun and Mingfa Guo reviewed and revised the manuscript. Xia Chen collected the data and designed this study.
Data Availability
The dataset analyzed for the present study are available from the corresponding author upon reasonable request.
Disclosure Statement
The authors declare that there is no conflict of interest regarding the publication of this manuscript.
Additional information
Funding
Reference
- Bray F, Ferlay J, Soerjomataram I, Siegel RL, Torre LA, Jemal A. Global cancer statistics 2018: GLOBOCAN estimates of incidence and mortality worldwide for 36 cancers in 185 countries. CA Cancer J Clin. 2018;68(6):394–424. doi:https://doi.org/10.3322/caac.21492
- Kamangar F, Nasrollahzadeh D, Safiri S, Sepanlou SG, Fitzmaurice C, Ikuta KS, Bisignano C, Islami F, Roshandel G, Lim SS, et al. The global, regional, and national burden of oesophageal cancer and its attributable risk factors in 195 countries and territories, 1990-2017: a systematic analysis for the global burden of disease study 2017. Lancet Gastroenterol Hepatol. 2020;5(6):582–97. doi:https://doi.org/10.1016/S2468-1253(20)30007-8
- Corona E, Yang L, Esrailian E, Ghassemi KA, Conklin JL, May FP. Trends in esophageal cancer mortality and stage at diagnosis by race and ethnicity in the United States. Cancer Causes Control. 2021;32(8):883–94. doi:https://doi.org/10.1007/s10552-021-01443-z
- Reichenbach ZW, Murray MG, Saxena R, Farkas EG, Klochkova A, Patel K, Tice C, Hall TM, Gang J, Parkman HP, et al. Clinical and translational advances in esophageal squamous cell carcinoma. Adv Cancer Res. 2019;144:95–135. doi:https://doi.org/10.1016/bs.acr.2019.05.004
- Siegel RL, Miller KD, Jemal A. Cancer statistics, 2020. CA Cancer J Clin 2020;70:7–30. doi:https://doi.org/10.3322/caac.21590
- Tachibana M, Kinugasa S, Hirahara N, Yoshimura H. Lymph node classification of esophageal squamous cell carcinoma and adenocarcinoma. Eur J Cardio-Thoracic Surg. 2008 Aug;34(2):427–31. doi:https://doi.org/10.1016/j.ejcts.2008.04.022
- Chen W, Zheng R, Baade PD, Zhang S, Zeng H, Bray F, Jemal A, Yu XQ, He J. Cancer statistics in China, 2015. CA Cancer J Clin. 2016;66(2):115–32. doi:https://doi.org/10.3322/caac.21338
- Abnet CC, Arnold M, Wei WQ. Epidemiology of esophageal squamous cell carcinoma. Gastroenterology. 2018;154(2):360–73. doi:https://doi.org/10.1053/j.gastro.2017.08.023
- Rice TW, Patil DT, Blackstone EH. 8th edition AJCC/UICC staging of cancers of the esophagus and esophagogastric junction: application to clinical practice. Ann Cardiothorac Surg. 2017;6(2):119–130. doi:https://doi.org/10.21037/acs.2017.03.14
- Wang Y, Chen L, Zhang B, Song W, Zhou G, Xie L, Yu D. Pretreatment inflammatory-nutritional biomarkers predict responses to neoadjuvant chemoradiotherapy and survival in locally advanced rectal cancer. Front Oncol. 2021;11:639909. doi:https://doi.org/10.3389/fonc.2021.639909
- Yin Y, Wang J, Wang KM,et al. Prognostic value of the neutrophil to lymphocyte ratio in lung cancer: a meta-analysis. Clinics (Sao Paulo). 2015;70(7):524–30. doi:https://doi.org/10.6061/clinics/2015(07)1
- Zhang X, Hu D, Lin X, et al. Prognostic value of an inflammation-related index in 6,865 Chinese patients with postoperative digestive tract cancers: the FIESTA study. Front Oncol. 2019;9(MAY):1–9. doi:https://doi.org/10.3389/fonc.2019.00427
- Kijima T, Arigami T, Uchikado Y, Uenosono Y, Kita Y, Owaki T, Mori S, Kurahara H, Kijima Y, Okumura H, et al. Combined fibrinogen and neutrophil-lymphocyte ratio as a prognostic marker of advanced esophageal squamous cell carcinoma. Cancer Sci. 2017;108(2):193–9. doi:https://doi.org/10.1111/cas.13127
- Guo XW, Zhou JY, Jiang W, Ji L, Liu YC, Yin XX. The combination of preoperative nutritional risk screening-2002 and neutrophil-to-lymphocyte ratio is a useful prognostic marker in patients with esophageal squamous cell carcinoma. Nutr Cancer. 2021;73(4):588–95. doi:https://doi.org/10.1080/01635581.2020.1766090
- Ishibashi Y, Tsujimoto H, Hiraki S, Kumano I, Yaguchi Y, Horiguchi H, Nomura S, Ito N, Shinto E, Aosasa S, et al. Prognostic value of preoperative systemic immunoinflammatory measures in patients with esophageal cancer. Ann Surg Oncol. 2018;25(11):3288–99. doi:https://doi.org/10.1245/s10434-018-6651-y
- Okadome K, Baba Y, Yagi T, et al. Prognostic nutritional index, tumor-infiltrating lymphocytes, and prognosis in patients with esophageal cancer. Ann Surg. 2020 Apr;271(11):693–700. doi:https://doi.org/10.1097/SLA.0000000000002985
- Liang S, Li C, Gao Z, Li J, Zhao H, Yu J, Meng X. A nomogram to predict short-term outcome of radiotherapy or chemoradiotherapy based on pre/post-treatment inflammatory biomarkers and their dynamic changes in esophageal squamous cell carcinoma. Int Immunopharmacol. 2021;90:107178. doi:https://doi.org/10.1016/j.intimp.2020.107178
- Kattan MW. Nomograms are superior to staging and risk grouping systems for identifying highrisk patients: preoperative application in prostate cancer. Curr Opin Urol. 2003;13(2):111–6. doi:https://doi.org/10.1097/00042307-200303000-00005
- Vickers AJ, Elkin EB. Decision curve analysis: a novel method for evaluating prediction models. Med Decis Making. 2006;26(6):565–74. doi:https://doi.org/10.1177/0272989X06295361
- Florkowski CM. Sensitivity, specificity, receiver-operating characteristic (ROC) curves and likelihood ratios: communicating the performance of diagnostic tests. Clin Biochem Rev. 2008;29(suppl 1):S83–7.
- Fluss R, Faraggi D, Reiser B. Estimation of the Youden Index and its associated cutoff point. Biom J. 2005;47(4):458–72. doi:https://doi.org/10.1002/bimj.200410135
- Harrell FE, Lee KL, Mark DB. Multivariable prognostic models: Issues in developing models, evaluating assumptions and adequacy, and measuring and reducing errors. Statist Med. 1996;15(4):361–87. doi:https://doi.org/10.1002/(SICI)1097-0258(19960229)15:4 < 361::AID-SIM168 > 3.0.CO;2-4
- Whiteside TL. The tumor microenvironment and its role in promoting tumor growth. Oncogene. 2008. 2008;27(45):5904–12. doi:https://doi.org/10.1038/onc1
- Landskron G, De La Fuente M, Thuwajit P, Thuwajit C, Hermoso MA. Chronic inflammation and cytokines in the tumor microenvironment. J Immunol Res. 2014;2014:149185. doi:https://doi.org/10.1155/2014/149185
- Li L, Yu R, Cai T, Chen Z, Lan M, Zou T, Wang B, Wang Q, Zhao Y, Cai Y, et al. Effects of immune cells and cytokines on inflammation and immunosuppression in the tumor microenvironment. Int Immunopharmacol. 2020;88(July):106939. doi:https://doi.org/10.1016/j.intimp.2020.106939
- Yao J, Cui Q, Fan W, Ma Y, Chen Y, Liu T, Zhang X, Xi Y, Wang C, Peng L, Luo Y, Lin A, Guo W, Lin L, Lin Y, Tan W, Lin D, Wu C, Wang J. Single-cell transcriptomic analysis in a mouse model deciphers cell transition states in the multistep development of esophageal cancer. Nat Commun. 2020;11(1):3715. doi:https://doi.org/10.1038/s41467-020-17492-y
- Powell DR, Huttenlocher A. Neutrophils in the tumor microenvironment. Trends Immunol. 2016;37(1):41–52. doi:https://doi.org/10.1016/j.it.2015.11.008
- Patel S, Fu S, Mastio J, Dominguez GA, Purohit A, Kossenkov A, Lin C, Alicea-Torres K, Sehgal M, Nefedova Y, et al. Unique pattern of neutrophil migration and function during tumor progression. Nat Immunol. 2018;19(11):1236–47. doi:https://doi.org/10.1038/s41590-018-0229-5
- Giese MA, Hind LE, Huttenlocher A. Neutrophil plasticity in the tumor microenvironment. Blood. 2019;133(20):2159–67. doi:https://doi.org/10.1182/blood-2018-11-844548
- Palacios-Acedo AL, Mège D, Crescence L, Dignat-George F, Dubois C, Panicot-Dubois L. Platelets, Thrombo-Inflammation, and Cancer: Collaborating With the Enemy. Front Immunol. 2019;31(10):1805. doi:https://doi.org/10.3389/fimmu.2019.01805
- Wojtukiewicz MZ, Sierko E, Hempel D, Tucker SC, Honn KV. Platelets and cancer angiogenesis nexus. Cancer Metastasis Rev. 2017;36(2):249–62. doi:https://doi.org/10.1007/s10555-017-9673-1
- Davoodzadeh Gholami M, Kardar GA, Saeedi Y, Heydari S, Garssen J, Falak R. Exhaustion of T lymphocytes in the tumor microenvironment: significance and effective mechanisms. Cell Immunol. 2017;322:1–14. doi:https://doi.org/10.1016/j.cellimm.2017.10.002
- Badalamenti G, Fanale D, Incorvaia L, Barraco N, Listì A, Maragliano R, Vincenzi B, Calò V, Incorvaia JL, Bazan V, Russo A. Role of tumor-infiltrating lymphocytes in patients with solid tumors: can a drop dig a stone? Cell Immunol. 2019;343:103753. doi:https://doi.org/10.1016/j.cellimm.2018.01.013
- Abbas G, Krasna M. Overview of esophageal cancer. Ann Cardiothorac Surg. 2017 Mar;6(2):131–136. doi:https://doi.org/10.21037/acs.2017.03.03
- Kim DH. Nutritional issues in patients with cancer. Intest Res. 2019;17(4):455–62. doi:https://doi.org/10.52/IR.2019.00076
- Bullock AF, Greenley SL, McKenzie GAG, Paton LW, Johnson MJ. Relationship between markers of malnutrition and clinical outcomes in older adults with cancer: systematic review, narrative synthesis and meta-analysis. Eur J Clin Nutr. 2020;74(11):1519–35. doi:https://doi.org/10.1038/s41430-020-0629-0
- Moujaess E, Fakhoury M, Assi T, Elias H, El Karak F, Ghosn M, Kattan J. The Therapeutic use of human albumin in cancer patients’ management. Crit Rev Oncol Hematol. 2017;120:203–209. doi:https://doi.org/10.1016/j.critrevonc.2017.11.008
- Nazha B. Hypoalbuminemia in colorectal cancer prognosis: nutritional marker or inflammatory surrogate? World J Gastrointest Surg. 2015;7(12):370. doi:https://doi.org/10.4240/wjgs.v7.i12.370
- McMillan DC. Systemic inflammation, nutritional status and survival in patients with cancer. Curr Opin Clin Nutr Metab Care. 2009 May;12(3):223–6. doi:https://doi.org/10.1097/MCO.0b013e32832a7902
- Shao Y, Ning Z, Chen J, et al. Prognostic nomogram integrated systemic inflammation score for patients with esophageal squamouscell carcinoma undergoing radical esophagectomy. Sci Rep. 2015;5(1) doi:https://doi.org/10.1038/srep18811
- Gao Y, Guo W, Cai S, Zhang F, Shao F, Zhang G, Cai S, Liu T, Tan F, Li N, Xue Q, Gao S, He J. Systemic immune-inflammation index (SII) is useful to predict survival outcomes in patients with surgically resected esophageal squamous cell carcinoma. J Cancer. 2019;10(14):3188–3196. doi:https://doi.org/10.7150/jca.30281
- Liu JS, Huang Y, Yang X, Feng JF. A nomogram to predict prognostic values of various inflammatory biomarkers in patients with esophageal squamous cell carcinoma. Am J Cancer Res. 2015;5(7):2180–9
- Iasonos A, Schrag D, Raj GV, Panageas KS. How to build and interpret a nomogram for cancer prognosis. JCO. 2008;26(8):1364–70. doi:https://doi.org/10.1200/JCO.2007.12.9791
- Balachandran VP, Gonen M, Smith JJ, DeMatteo RP. Nomograms in oncology: more than meets the eye. Lancet Oncol. 2015;16(4):e173–80. doi:https://doi.org/10.1016/S1470-2045(14)71116-7