
 ?Mathematical formulae have been encoded as MathML and are displayed in this HTML version using MathJax in order to improve their display. Uncheck the box to turn MathJax off. This feature requires Javascript. Click on a formula to zoom.
Abstract
Background
Risk of breast cancer in adult life is influenced by body size and height in childhood, but the mechanisms responsible for these associations are currently unknown. We carried out research to determine if, at age 15–18, measures of dietary intake were associated with body size, hormones, and with variations in breast tissue composition that in adult life are associated with risk of breast cancer.
Methods
In a cross-sectional study of 766 healthy Caucasian women aged 15–18, we measured percent breast water (PBW), total breast water and fat by magnetic resonance (MR), and assessed dietary intake using a validated food frequency questionnaire. We also measured height, weight, skin-fold thicknesses and waist-to-hip ratio, and in fasting blood assayed glucose and insulin.
Results
After adjustment for age, measures of body size, and energy intake, dietary fiber (insoluble and total fiber) and insulin were associated positively and significantly with PBW.
Conclusions
Dietary fiber and fasting insulin were associated with breast tissue measures. These data suggest a potential approach to breast cancer prevention.
Introduction
In childhood and adolescence, greater height, lower weight or body mass index, and leaner body type are in later life associated with a higher risk of breast cancer (Citation1). The mechanisms that underlie these associations are currently unknown (Citation2). In adult life, variations in breast tissue composition, referred to as “percent mammographic density” (PMD), have been shown to be a strong risk factor for breast cancer (Citation3, Citation4), and in premenopausal women, variations in PMD have been associated with variations in height and weight (Citation5). These findings suggest that variations in breast tissue composition in adult life may be in part the result of factors in early life that influence both body size and breast tissue composition.
We have carried out research to examine the association of anthropometric measures, circulating hormones, genetic variants and dietary intake at age 15–18, with contemporaneous variations in breast tissue composition assessed by magnetic resonance (MR). Breast water determined by MR, and the risk factor PMD, both reflect breast fibro-glandular tissue and are strongly correlated (Citation6–8). The present report is concerned only with the association of dietary intake and associated hormones with breast tissue composition.
Methods
General Method
We carried out a cross-sectional observational study in which we recruited young women aged 15–18 years. Breast water and fat in participants were measured with MR, and anthropometric variables were measured. Diet was assessed by food frequency questionnaire, and glucose and insulin were assayed in fasting serum.
Recruitment of Subjects
Recruitment of young women was from Toronto high schools, and family practices. Recruitment took place in two phases, Phase one between 2003 and 2007 and Phase two between 2010 and 2015. Subjects in Phase one have been included in a previous publication (Citation8). Ethics approvals were obtained from the University Health Network, Sunnybrook Hospital, and Women’s College Hospital (all in Toronto) and from the Toronto District School Board, the Toronto Catholic District School Board, the York Region District School Board and the York Catholic District School Board.
School Recruitment
With the consent of school principals we contacted their health and/or science departments, which were asked to agree to our approaching their students in their classrooms, to present a cancer educational talk and introduce the research study. Eligible students interested in participating were given an information package to take home that described the study and included consent forms for both mother and daughter. On receipt of written consent from both mother and daughter we contacted them to set up appointments.
Family Practice Recruitment
Participating family practices contacted young women aged 15–18 on their patient lists, introduced the study and invited their participation. Those interested were mailed the same information package and consent forms that were used in schools.
Inclusion and Exclusion of Subjects
Subjects were excluded if they had not established menses, had used oral contraceptives within the previous 6 mo, had been pregnant, had breast implants, augmentation or reduction mammoplasty, or previous breast cancer. We planned to carry out a genome-wide association in the subjects enrolled in the present study and, to avoid population stratification, we recruited only subjects who by self-report were white Caucasians. Exclusion criteria for the safe use of MR, included recent breast surgery, metal implants of any sort, known claustrophobia, and weight more than 200 lbs.
Measurements
Menstrual and Reproductive Characteristics
Information on demographic and risk factors for breast cancer was obtained by questionnaire. This included age at the onset of menses, and details of prior exposure to oral contraceptives.
Anthropometric Measures
A research assistant, trained by an instructor from the Department of Physical Education, University of Toronto, measured height, weight and waist and hip circumferences. Skinfold thickness was measured using calipers at subscapular, triceps and supra-iliac sites. Percent body fat was calculated using methods validated in adolescent girls (Citation9, Citation10), that use skinfold thickness measurements at triceps (T) and subscapular sites (S).
Diet
Dietary intake was assessed using a food frequency questionnaire adapted from the US DHQ II, which was developed for use in adults, modified to optimize the capture of foods consumed by Canadians, by the addition of food group equivalents from the Canadian Diet History Questionnaire (Citation11).
Magnetic Resonance Measures of Breast Water and Fat
The first 181 young women included in the analysis were examined using a 1.5 T Signa Cvi MR system (GE, Waukesha WI) (Citation8). The remaining 776 subjects were examined in a 3.0 T scanner (Phillips). All scans were carried out in the prone position with commercially available breast coils from the respective vendors.
To determine if the data from these two scanners could be pooled we scanned 12 healthy volunteers on both scanners on the same day. Total fat and water measures from the two scanners were strongly correlated (R2 > 0.99) but showed some underestimation of fat in the 3.0 T protocol relative to the 1.5 T protocol. A correction applied to the T3.0 protocol decreased the discrepancy (Citation12).
With both scanners the sequence was calibrated using a series of home-built phantoms. Bi-monthly scans of three phantoms with known water/oil concentrations and various volumes using the same MR imaging protocol confirmed volume accuracy within 2% and water/oil content accuracy within 3%.
The output of the MR examination was a series of “slices” at 7-mm intervals through both breasts. The breast was distinguished from surrounding tissues on each slice by an observer using a semi-automated image analysis program, and the water and fat within each slice calculated and summed over all slices which acquires the water and fat signals with phase shifts of (0, pi, 2 pi). The results shown are measurements in the right breast only and are expressed as percent water, total breast water and total fat. All measurements have been shown to be bilaterally symmetrical (Citation13). A small amount of water is also present in fat and allowance is made for this in calculating the water content of the breast used here.
Blood Samples for Measurement of Glucose and Insulin
Fasting blood samples were collected in the early morning after a 12-hour fast on the day of the MR examination and within 10 day of the first day of the most recent menstrual period. Serum was separated within 2 h, of collection and stored in 2 ml aliquots at −70 C until analysis.
Assays of Glucose and Insulin
All assays in subjects from Phases 1 and two of recruitment were carried out in fasting serum at the same time in the Immunochemical Core Lab (ICL), Mayo Clinic Research Core Labs. The assays used, their inter- and intra- assay coefficients of variation, and lower limits of detection are shown in Supplementary material.
Calculation of Insulin Measures
We used fasting serum levels of glucose and insulin for each subject to calculate measures of insulin production, sensitivity and resistance using on-line software: https://www.dtu.ox.ac.uk/homacalculator/download.php version 2.2.3 for the HOMA model, that calculates (Citation14) measures of insulin sensitivity (HOMA2-S), beta-cell function (HOMA2-B), and insulin resistance (HOMA2-IR).
Statistical Methods
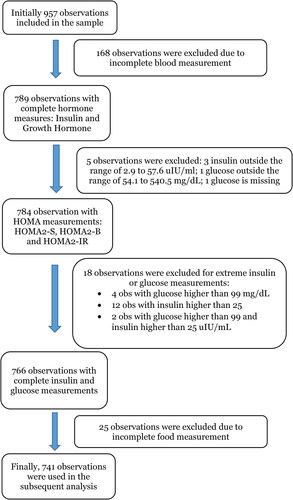
Nine hundred and fifty-seven young women were recruited and had breast MR and complete anthropometric measures. One hundred and sixty-eight subjects did not provide a blood sample. An additional five subjects whose fasting insulin or glucose values fell outside the limits set by the HOMA software, were excluded from the analysis of blood samples. Eighteen subjects had values for insulin or glucose that were outliers suggesting they were not fasting samples, leaving 766 subjects, of whom 25 did not complete a food frequency questionnaire. The remaining 741 subjects were included in the analysis. Details of these exclusions are given in .
Figure 1. Subject selection for analysis.
Means and standard deviations were calculated for selected characteristics. Total water and total fat by MR were log transformed for analysis.
The associations of MR breast tissue characteristics with dietary intakes and insulin were examined using univariable and multivariable regression models. The multivariable models included age, height and weight, percent body fat and waist-to-hip ratio at the time of the MR examination.
To illustrate graphically the main findings of regression analysis, we ran multivariable regression analyses with selected variables divided into quintiles. The statistical significance of the differences in breast measures of percent water, total water and total fat associated with increasing levels of these variables were assessed using tests for linear trend.
The analyses were conducted using statistical software R version 2.15.1. All p-values were calculated from two-tailed tests of statistical significance. Statistical significance was declared at the 5% level. All p-values are adjusted for the variables shown in the Table footnotes.
Results
Characteristics of Subjects
shows selected characteristics of subjects enrolled in Phases 1 and two of the study. Subjects were in general similar in age, height and weight, and waist-to-hip ratio, but there was a statistically significant difference between phases in percent body fat. Energy intake, total protein, glycemic load, total carbohydrate intake and sucrose and fasting serum insulin also differed significantly between Phases one and two.
Table 1. Selected characteristics of subjects overall and by phase of recruitment (mean (SD)).
Association of Nutrients with Breast Tissue Composition
shows the associations of selected nutrients and breast tissue measures of percent density, total breast water and total breast fat. The associations of nutrients and breast measures were examined using linear regression adjusted for age, height, weight, waist to hip ratio, percent body fat and food energy. shows regression coefficients and associated p values.
Table 2. Association of selected nutrients with breast tissue composition (N = 741).
Insoluble and total dietary fiber were both significantly and positively associated with percent water. Insoluble and total dietary fiber were associated positively with total breast water and inversely with total breast fat, but neither association was statistically significant.
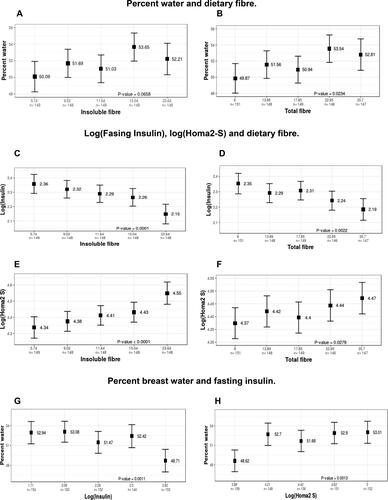
The direction and magnitude of these associations are illustrated in that show the associations of the breast measure of percent water according to quintiles of insoluble and total and dietary fiber. Compared to the lowest quintile of fiber intake, percent water was 2.12% greater in the highest quintile of intake of insoluble fiber (Ptrend=0.065) and 2.94% greater for the highest quintile of intake of total fiber (Ptrend=0.002).
Figure 2. Associations between percent breast water, dietary fiber and fasting serum insulin, and HOMA2-S. Shown are the associations between percent breast water and insoluble fiber (A) and total fiber (B), and between log fasting insulin and insoluble fiber (C) and total fiber (D), are shown, and between log HOMA2-S and insoluble fiber (E) and total fiber (F), and between percent breast water and log insulin (G) and log HOMA2-S (H). To illustrate these associations we ran multivariable regression analyses with dietary fiber (total and insoluble), log insulin and HOMA2-S divided into quintiles. The statistical significance of the differences in breast measures of percent water, total water and total fat associated with increasing levels of dietary fiber, log insulin or log HOMA2-S were assessed using tests for linear trend. All p values were adjusted for height, weight, waist-hip ratio and percent body fat.
Associations of Nutrients with Insulin and HOMA Measures
shows the associations of the nutrients shown in with fasting serum insulin, and the HOMA measures calculated from fasting serum insulin and fasting serum glucose. Soluble and insoluble fibers, and total fiber, were each significantly associated with fasting insulin and all of the HOMA measures. The associations of total and soluble fiber with fasting insulin, HOMA 2B and HOMA two IR were all inverse, and those with the HOMA2-S estimate of insulin sensitivity were positive. These nutrients explained between 9 and 11% of the variance in fasting insulin.
Table 3. Association between selected nutrients and hormones (N = 741).
The direction and magnitude of these associations are illustrated in that show the associations of log insulin and log HOMA 2-S according to quintiles of insoluble and total and dietary fiber. Compared to the lowest quintile of insoluble fiber intake, log insulin was 0.21 units lower in the highest quintile of intake of insoluble fiber (ptrend= 0.0.0001) and 0.16 units lower in the highest quintile of intake of total fiber (Ptrend=0.002). Compared to the lowest quintile of fiber intake, the estimate of insulin sensitivity, log HOMA 2-S, was 0.21 units greater in the highest quintile of intake of insoluble fiber (ptrend=0 < 0.0001) and 0.10 units greater for the highest quintile of intake of total fiber (ptrend=0.03).
Associations of Breast Measures with Fasting Insulin and HOMA Measures
shows the regression coefficients and associated p-values for the associations of percent water with fasting insulin and HOMA measures. The associations of percent water and total breast fat with fasting insulin and all HOMA measures were statistically significant after adjustment for age and all anthropometric measures. Insulin, glucose and the HOMA measures were not significantly associated with total breast water.
Table 4. Association between hormones and breast tissue composition (n = 766).
shows the direction and magnitude of the association of log insulin and log HOMA2-S with percent water. Compared to the lowest quintile of log insulin, percent water was 4.23% lower in the highest quintile of log insulin (ptrend = 0.001). For log HOMA2-S percent water was 4.4% greater for the highest quintile of log HOMA2-S compared to the lowest quintile (ptrend = 0.001).
Discussion
The purpose of the present research was to determine if dietary intake at age 15–18, was associated with measures of body size, hormones and growth factors, and with variations in breast tissue composition that are associated with risk of breast cancer in later life. The present findings show that after adjustment for total energy intake and all anthropometric variables, insoluble and total dietary fiber were positively associated at age 15–18 with percent breast water. Insoluble and total dietary fibers were also associated inversely with fasting serum insulin and positively with the calculated HOMA2 S estimate of insulin sensitivity. Insulin was associated inversely with percent water and positively with total breast fat, and insulin sensitivity was associated positively with percent water and inversely with total beast fat.
The cross-sectional design of the present study does not allow us to examine the direction of the associations shown between diet, insulin and breast tissue composition. However it is known from a randomized trial that dietary fiber influences insulin levels (Citation15).
A Mendelian randomization analysis (by the Breast Cancer Association Consortium) in 182,306 participants of European ancestry, used genetic instruments for fasting insulin, fasting glucose, 2-h glucose, body mass index (BMI) and BMI adjusted waist-to-hip ratio (WHR) (Citation16). The result confirmed the previously reported inverse association of genetically predicted BMI and WHR with risk of breast cancer, and in addition showed a positive association of predicted fasting insulin with risk of breast cancer.
Previous work in 957 subjects, that included the subjects in the present study, showed that PBW was associated with height (positively), and with weight, percent body fat and waist to hip ratio (all inversely). These variables explained 44% of the variance in PBW, and 53% of the variance in total breast fat, but only 5% of variance in total breast water. After adjustment for these anthropometric variables, fasting serum insulin (inversely), and insulin sensitivity (positively) were each significantly associated with PBW and, respectively, positively and inversely associated with total breast fat (Citation17). Further, administered insulin has been shown to be associated with greater percent density and greater dense volume in mammograms in adult women (Citation18). Existing knowledge thus suggests that the observed associations between dietary fiber, fasting serum insulin and breast tissue composition are plausible and may be causal.
As previously noted PBW is strongly correlated with mammographic density (Citation6, Citation7), a strong risk factor for breast cancer in adult women (Citation3). Previous studies have also shown that breast water is principally associated with the breast fibro-glandular tissue that is observed as radiologically dense (Citation6). Dietary fiber intake in young adults has been shown to be associated inversely with risk of breast cancer, and suggest that intake during adolescence may be particularly important (Citation19).
Most previous studies of diet in childhood and mammographic density have used recall at ages 45–60 of diet in childhood, and mammograms obtained at ages 45–60. These studies have variously shown associations of red meat (Citation20) and animal fat intake (Citation21) with MD, no association of MD with dietary fiber (Citation22), and no dietary associations with MD (Citation20). Jung et al used 3 × 24 h, recalls of diet collected from 182 girls at ages 10–19 years (Citation23). An association was found between mammographic density measured as percent dense breast volume determined by MR at ages 25–29, and intakes of sucrose and total carbohydrate at ages 10–19 years. Fiber was not associated with percent dense breast volume.
To our knowledge the present study is the largest to date of the nutritional associations with contemporaneous measures of breast tissue composition in young women. The timing of the study in early life allows us to examine the association of breast tissue characteristics, measured using quantitative, volumetric methods, with measures of diet and body size, when the mean levels of percent breast water, and fasting serum levels of insulin, are greater than in adult life, and have not yet been influenced by parity, menopause, and the effects of aging (Citation24, Citation25). Dietary intakes were assessed using a food frequency questionnaire modified by the addition of food group equivalents from the Canadian Diet History Questionnaire (Citation11).
The present results require replication, but they suggest that interventions, either dietary or pharmacologic, directed at reducing insulin levels or sensitivity during childhood and adolescence, may be associated with a reduction of radiologically dense breast tissue in later life. It remains to be determined whether such a change in breast tissue composition in early life will be associated with a reduced risk of breast cancer in later life.
Conclusions
These results show an association of dietary fiber with breast tissue measures and with measures of fasting insulin and insulin sensitivity. These findings require replication but suggest a potential approach to breast cancer prevention in early life.
Author Contributions
LM co-supervised the conduct of the study and carried out the nutrient analysis. LL and MT carried out recruitment and data collection. SS and JZ carried out statistical analysis and prepared tables and figures. SC and GS performed MR breast examinations. SM supervised statistical analysis. NB was responsible for conception of the study, obtaining funding, and overall supervision. All authors read and approved the submitted manuscript.
Acknowledgments
We thank the young women, their mothers, and the Toronto schools that participated in this research, and Drs. Sheila Dunn, Vivien Brown, Jennifer Rosset and Marla Shapiro for their assistance with the recruitment of subjects from family practices.
Disclosure Statement
No potential conflict of interest was reported by the authors.
Data Availability Statement
Data will be made available on request after ethics approval.
Additional information
Funding
References
- Ahlgren M, Melbye M, Wohlfahrt J, Sorensen T. Growth patterns and the risk of breast cancer in women. N Engl J Med. 2004;351(16):1619–26. doi:https://doi.org/10.1056/NEJMoa040576
- Terry MB. Consistency, now what? Breast Cancer Res. 2017;19(1):85. doi:https://doi.org/10.1186/s13058-017-0869-7
- McCormack VA, dos Santos Silva I. Breast density and parenchymal patterns as markers of breast cancer risk: a meta-analysis. Cancer Epidemiol Biomark Prev. 2006;15(6):1159–69. doi:https://doi.org/10.1158/1055-9965.EPI-06-0034
- Boyd NF, Guo H, Martin LJ, Sun L, Stone J, Fishell E, Jong RA, Hislop G, Chiarelli A, Minkin S, et al. Mammographic density and the risk and detection of breast cancer. N Engl J Med. 2007;356(3):227–36. doi:https://doi.org/10.1056/NEJMoa062790
- Boyd NF, Lockwood GA, Byng JW, Little LE, Yaffe MJ, Tritchler DL. The relationship of anthropometric measures to radiological features of the breast in premenopausal women. Br J Cancer. 1998;78(9):1233–8. doi:https://doi.org/10.1038/bjc.1998.660
- Poon CS, Bronskill MJ, Henkelman M, Boyd NF. Quantitative magnetic resonance imaging parameters and their relationship to mammographic pattern. J Natl Cancer Inst. 1992;84(10):777–80. doi:https://doi.org/10.1093/jnci/84.10.777
- Graham SJ, Bronskill MJ, Byng JW, Yaffe MJ, Boyd NF. Quantitative correlation of breast tissue parameters using magnetic resonance and X-ray mammography. Br J Cancer. 1996;73(2):162–8. doi:https://doi.org/10.1038/bjc.1996.30
- Boyd N, Martin L, Chavez S, Gunasekara A, Salleh A, Melnichouk O, Yaffe M, Friedenreich C, Minkin S, Bronskill M, et al. Breast-tissue composition and other risk factors for breast cancer in young women: a cross-sectional study. Lancet Oncol. 2009;10(6):569–80. doi:https://doi.org/10.1016/S1470-2045(09)70078-6
- Slaughter MH, Lohman TG, Boileau RA, Horswill CA, Stillman RJ, Van Loan MD, Bemben DA. Skinfold equations for estimation of body fatness in children and youth. Hum Biol. 1988;60(5):709–23.
- Wong WW, Stuff JE, Butte NF, Smith EO, Ellis KJ. Estimating body fat in African American and white adolescent girls: a comparison of skinfold-thickness equations with a 4-compartment criterion model. Am J Clin Nutr. 2000;72(2):348–54. doi:https://doi.org/10.1093/ajcn/72.2.348
- Csizmadi I, Kahle L, Ullman R, Dawe U, Zimmerman TP, Friedenreich CM, Bryant H, Subar AF. Adaptation and evaluation of the National Cancer Institute’s Diet History Questionnaire and nutrient database for Canadian populations. Public Health Nutr. 2007;10(1):88–96. doi:https://doi.org/10.1017/S1368980007184287
- Chavez S, Stanisz G. Comparing average breast fat content results from two different protocols at 1.5T and 3T: can the data be pooled? J Magn Reson Imaging. 2014;40(4):890–8.[InsertedFromOnline
- Hennessey S, Huszti E, Gunasekura A, Salleh A, Martin L, Minkin S, Chavez S, Boyd NF. Bilateral symmetry of breast tissue composition by magnetic resonance in young women and adults. Cancer Causes Control. 2014;25(4):491–7. doi:https://doi.org/10.1007/s10552-014-0351-0
- Wallace TM, Levy JC, Matthews DR. Use and abuse of HOMA modeling. Diabetes Care. 2004;27(6):1487–95. doi:https://doi.org/10.2337/diacare.27.6.1487
- Ghalandari H, Kamalpour M, Alimadadi A, Nasrollahzadeh J. Comparison of two calorie-reduced diets of different carbohydrate and fiber contents and a simple dietary advice aimed to modify carbohydrate intake on glycemic control and inflammatory markers in Type 2 diabetes: A randomized trial. Int J Endocrinol Metab. 2017;16(1):e12089. doi:https://doi.org/10.5812/ijem.12089
- Shu X, Wu L, Khankari N, et al. Association of obesity and circulating insulin and glucose with breast cancer risk: a Mendelian randomization analysis. Int J Epidemiol. 2019;48(3):795–806.
- Linton L, Taylor M, Saha S, Zhu J, Chavez S, Stanisz GP, Martin L, Dunn S, Minkin S, Boyd N. Body size, breast tissue composition, and circulating hormones and growth factors, at age 15-18: a cross-sectional study. Submitted for publication.
- Borgquist S, Rosendahl AH, Czene K, Bhoo-Pathy N, Dorkhan M, Hall P, Brand JS. Long-term exposure to insulin and volumetric mammographic density: observational and genetic associations in the Karma study. Breast Cancer Res. 2018;20(1):93. doi:https://doi.org/10.1186/s13058-018-1026-7
- Farvid MS, Eliassen HA, Cho E, Liao X, Chen WY, Willett WC. Dietary fiber intake in young adults and breast cancer risk. Pediatrics. 2016;137(3):1226. doi:https://doi.org/10.1542/peds.2015-1226
- Yaghjyan L, Ghita GL, Rosner B, Farvid M, Bertrand KA, Tamimi RM. Adolescent fiber intake and mammographic breast density in premenopausal women. Breast Cancer Res. 2016;18(1):85. doi:https://doi.org/10.1186/s13058-016-0747-8
- Bertrand KA, Burian RA, Eliassen AH, Willett WC, Tamimi RM. Adolescent intake of animal fat and red meat in relation to premenopausal mammographic density. Breast Cancer Res Treat. 2016;155(2):385–93. doi:https://doi.org/10.1007/s10549-016-3679-1
- Jung S, Goloubeva O, Hylton N, Klifa C, LeBlanc E, Shepherd J, Snetselaar L, Van Horn L, Dorgan JF. Intake of dietary carbohydrates in early adulthood and adolescence and breast density among young women. Cancer Causes Control. 2018;29(7):631–42. doi:https://doi.org/10.1007/s10552-018-1040-1
- Sellers T, Vachon C, Pankratz V, Janney C, Fredericksen Z, Brandt K, Huang Y, Couch F, Kushi L, Cerhan J, et al. Association of childhood and adolescent anthropometric factors, physical activity, and diet with adult mammographic breast density. Am J Epidemiol. 2007;166(4):456–64. doi:https://doi.org/10.1093/aje/kwm112
- Vachon CM, Kuni CC, Anderson K, Anderson VE, Sellers TA. Association of mammographically defined percent breast density with epidemiologic risk factors for breast cancer (United States). Cancer Causes Control. 2000;11(7):653–62.
- Byrne C, Schairer C, Wolfe J, Parekh N, Salane M, Brinton LA, Hoover R, Haile R. Mammographic features and breast cancer risk: effects with time, age, and menopause status. J Natl Cancer Inst. 1995;87(21):1622–9. doi:https://doi.org/10.1093/jnci/87.21.1622